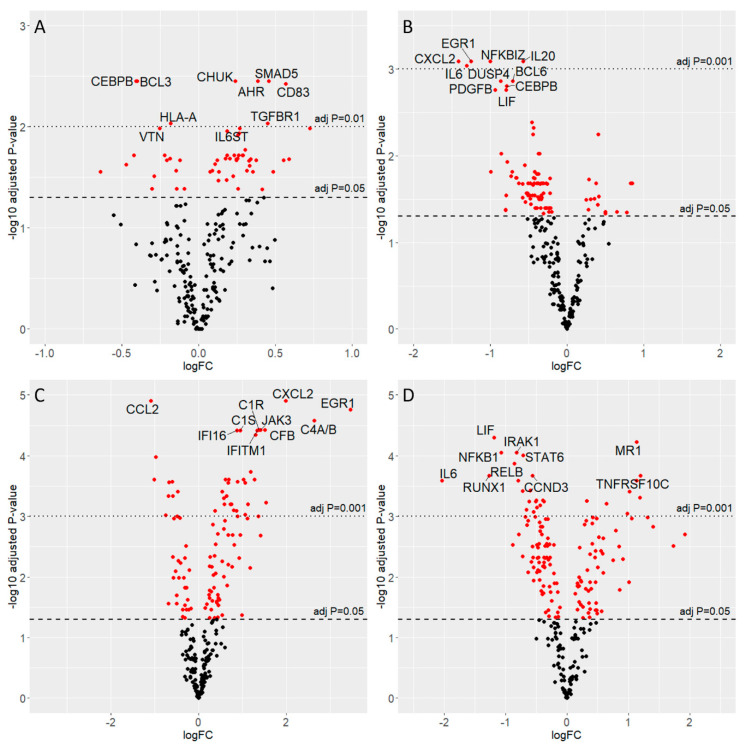
Figure 3.
Volcano plots of four experimental groups. Volcano plots were obtained by plotting log2 fold change (x-axis) and -log10 of adjusted p-value (y-axis). In red are differentially expressed genes; dashed lines indicate the significance levels. For each comparison the top ten genes are displayed. Groups: (A) CBV3 vs. CBV3-Ctrl; (B) Spl-EV vs. Spl-Ctrl; (C) Spl-Ctrl vs. CBV3-Ctrl; (D) Spl-EV vs. CBV3.

