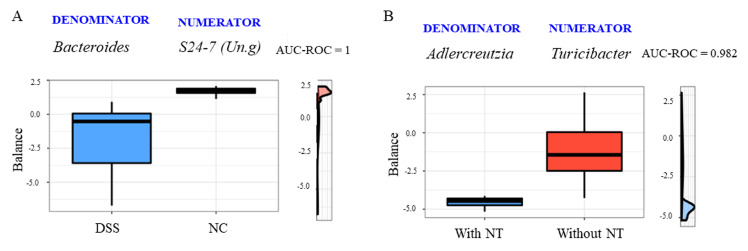
Figure 5.
Microbial signatures or global balances selected by the selbal algorithm with a strong accuracy to distinguish colitis phenotypes (A) or neoagarotetraose (NT) supplementation status (B). AUC = Area under the ROC (Receiver Operating Characteristics) curve. The box plots represent the distribution of the balance values for each category. The right (vertical) panel of the figure represents density curves for each category. NC: normal controls; B: colitis induced by dextran sulfate sodium.

