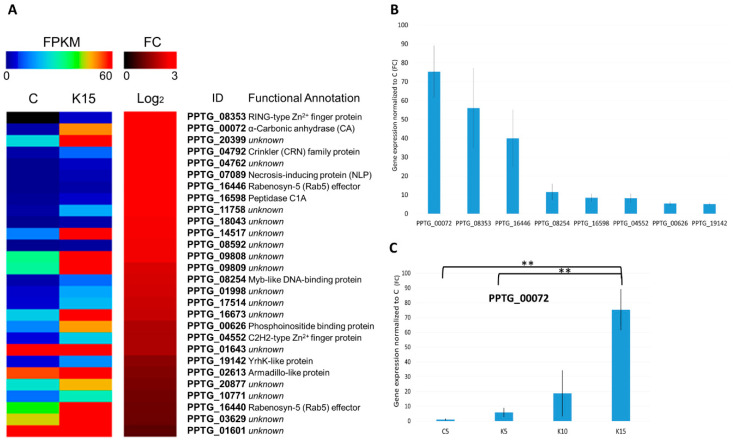
Figure 3.
Overview of upregulated genes. (A) Heat map of expression levels (Fragment Per Kilo base of exon per Million reads, FPKM; left part of the panel) and fold change (FC, log2; right part of the panel) of significantly upregulated genes (defined by their ID and putative functional annotation) upon K+ application (K15 sample) compared to freely swimming zoospores (C sample). Only genes with FC > 2 (log2 > 0) were considered. Correspondence between colors and FPKM or FC is reported in the scale at the top of each panel; (B) expression of a selection of upregulated genes, analyzed by RT-qPCR and expressed as FC in K15 sample compared to C. Panels C shows the differential expression of Carbonic Anhydrase (CA) PPTG_00072, expressed as FC, at different times after K+ application (K5, K10, K15), compared to the C sample, analyzed by RT-qPCR. ** p < 0.01.

