Abstract
Two-photon laser scanning microscopy (2PLSM) is a state-of-the-art technique used for non-invasive imaging deep inside the tissue, with high 3D resolution, minimal out-of-focus photodamage, and minimal autofluorescence background. For optimal application of fluorescent probes in 2PLSM, their two-photon absorption (2PA) spectra, expressed in absolute cross sections must be characterized. Excitation at optimum wavelength will make it possible to reduce the laser power and therefore minimize photodamage. Obtaining 2PA spectra and cross sections requires correcting the two-photon excited fluorescence signals for a combination of laser properties, including the beam spatial profile, pulse duration, and absolute power, at each wavelength of the tuning range. To avoid such tedious day-to-day laser characterization required in the absolute measurement method, a relative method based on independently characterized 2PA reference standards is often used. By carefully analyzing the available literature data, we selected the most reliable standards for both the 2PA spectral shape and cross section measurements. Here we describe a protocol for measuring the 2PA spectral shapes and cross sections of fluorescent proteins and other fluorophores with the relative fluorescence method using these reference standards. Our protocol first describes how to build an optical system and then how to perform the measurements. In our protocol, we use Coumarin 540A in dimethyl sulfoxide and LDS 798 in chloroform for the spectral shape measurements to cover the range from 680 to 1300 nm, and Rhodamine 590 in methanol and Fluorescein in alkaline water (pH 11) for the absolute two-photon cross section measurements.
Keywords: Two-photon absorption, Two-photon laser scanning microscopy, Two-photon brightness, Two-photon spectra, Cross sections, Fluorescent proteins, Fluorophores, Two-photon reference standards
Background
Two-photon laser scanning microscopy (2PLSM) is an advanced imaging technique used in neuroscience, cancer biology, immunology, and other areas of biosciences ( Denk et al., 1990 ; Xu et al., 1996; Zipfel et al., 2003 ; Helmchen and Denk, 2005). Compared to fluorescence confocal microscopy, which is based on one-photon excitation, 2PLSM provides deeper interrogation of tissues with less out-of-focus photodamage and less autofluorescence background. For optimal application of 2PLSM, information about the brightness of fluorescent probes upon two-photon excitation at different laser wavelengths (i.e., two-photon absorption and excitation spectra) is necessary. That information helps researchers choose the right probe(s) for a particular application (e.g., the brightest probe excitable with optimum wavelength within the near-infrared tissue transparency window, or a combination of probes for multicolor imaging). There are several methods to measure the two-photon absorption spectra and absolute cross section values (Rumi and Perry, 2010), including a direct one, based on nonlinear transmission (z-scan), and indirect ones, such as two-photon excited fluorescence (2PEF). Here we choose the 2PEF approach because it is much more sensitive, requiring much lower concentration of fluorophores, and all the probes used in 2PLSM are intrinsically fluorescent. In contrast to one-photon (1P) excitation, two-photon (2P) excitation efficiency strongly depends on the laser beam spatial and (pulse) temporal profiles. Since these characteristics usually vary from wavelength to wavelength across the laser tuning range, careful corrections for these variations are necessary for extracting pure molecular two-photon absorption (2PA) spectral shape and absolute cross section values (σ2). To obtain these properties one can use either an absolute or a relative method. In the absolute measurement method, the laser properties such as power, pulse duration and shape, and spatial beam profile (i.e., intensity dependence on x, y, and z coordinates inside the sample solution) must be characterized at each wavelength. Then, a function representing a combination of these parameters at each laser wavelength should be constructed and applied for correction of raw data. The spectra obtained using this absolute method (Xu and Webb, 1996; Albota et al., 1998 ; Makarov et al., 2008 ; Makarov et al., 2011 ; de Reguardati et al., 2016 ) can be considered as reference standards for application in relative method.
To avoid tedious characterization of laser properties on a day-to-day basis (necessary in absolute method of measurement), we use in our protocol a relative method based on previously characterized reference standards. In this method, the raw 2PA spectra are collected for the sample, F2,S(λ), and for the reference, F2,R(λ), (indices S and R are used for sample and reference, respectively, here and throughout) in the same conditions of excitation, and then the correction function fc(λ) is calculated using the known 2PA spectrum of the reference A2PA,R(λ) and its raw spectrum F2,R(λ):
This correction function is then applied to the raw spectrum of the sample to get its corrected, “true” spectrum ( Makarov et al., 2008 ), eq. (1):
A similar approach is used for evaluating the two-photon cross section values. In this case, the raw fluorescence signal of the sample, measured at a particular excitation wavelength λex is corrected for a combination of laser properties by using a 2PA cross section reference standard measured at the same excitation and fluorescence registration conditions.
Suppose F2,S(λex, λreg) and F2,R(λex, λreg) are the two-photon fluorescence signals recorded in a narrow spectral range around registration wavelength, λreg, with the same excitation conditions for the sample and the reference. To calculate the 2PA cross section, one needs to normalize these signals to the fluorescence quantum efficiencies and concentrations of signal and reference, respectively. Let φS( λreg) and φR(λreg) be the differential quantum efficiencies measured at the same wavelength with the same spectral bandwidth as F2 signals, but with one-photon excitation. Using a narrow spectral range in fluorescence collection avoids corrections to the spectral sensitivity of the detection system. CS and CR are the corresponding concentrations, used in the two-photon experiment, and calculated using Beer’s law: C = ODmax/εmax where ODmax is the peak optical density and εmax is the peak extinction coefficient. Then the two-photon cross section of the sample reads ( Makarov et al., 2008 ), eq. (2):
where σ2,R (λex ) is the cross section of the reference.
Although the literature data accumulated over the last few decades for the reference standards start to converge for some of them, significant deviations are still present for the others. The relative method of 2PA characterization was used previously, but the detailed descriptions of the measurement details were often missing and selection of standards was arbitrary, resulting in large variations in the results between different labs. By carefully analyzing the available literature data, we selected the most reliable standards for both the 2PA spectral shape and cross section measurements (see Notes). In our protocol, we use Coumarin 540A in DMSO ( de Reguardati et al., 2016 ) and LDS 798 in chloroform ( Makarov et al., 2011 ) for the spectral shape measurements to cover the range from 680 to 1300 nm. We use Fluorescein in alkaline water (pH 11) ( Xu et al., 1995 ; Xu and Webb, 1996; Makarov et al., 2008 ; de Reguardati et al., 2016 ) and Rhodamine 6G in methanol (Hermann and Ducuing, 1972; Bradley et al., 1972 ; Penzkofer and Leupacher, 1987; Albota et al., 1998 ; Makarov et al., 2008 ; de Reguardati et al., 2016 ) for the absolute σ2 measurements at selected wavelengths. The standards for the shape were selected because their reported 2PA and 1PA spectra closely overlap, signifying that the reported 2P spectral shapes measurements were reliable. Also, the spectra are very broad and structureless, thus introducing fewer potential errors due to a finite laser spectral shape and small shifts in central wavelength. The standards for the σ2 were selected based on a close match between two to five independent measurements at a selected wavelength. Using this protocol will make it possible for researchers to characterize the absolute 2PA spectra of new fluorescent probes and sensors in a standardized way and with high reproducibility.
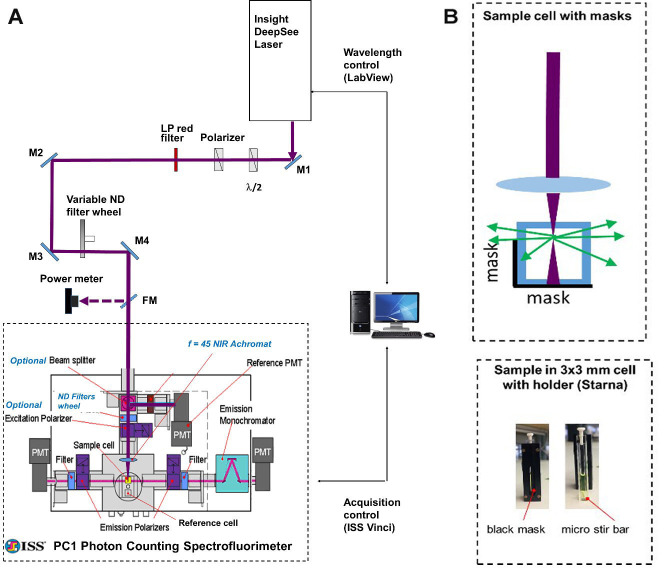
Our optical setup (Figure 1) consists of an automatically tunable (with custom LabView program) femtosecond laser (InSight DeepSee, Spectra Physics) coupled with a photon counting spectrofluorimeter (PC1, ISS). The laser output beam (100-120 fs pulse duration, 680-1,300 nm tuning range, 80 MHz repetition rate, 0.6-1.3 W average power, horizontal polarization) was first attenuated to 100-200 mW and made vertically polarized with a system of a half-wave plate and a Glan-laser polarizer. It then was filtered (with a 645 long pass filter) to remove all residual visible light and was directed with 4 mirrors (M1-M4) to the entrance aperture of the spectrofluorimeter. We use a continuous variable neutral density filter wheel between mirrors M3 and M4 to further attenuate the power to a particular value needed in the experiment. A flip mirror (FM) is used to send an attenuated beam to a power meter (Melles Griot) for monitoring laser power before the sample.
Figure 1. Schematic of experimental setup.
A. General layout. A femtosecond InSight DeepSee (SpectraPhysics) laser beam is steered with a system of mirrors (M1-M4) to the entrance aperture of a photon counting spectrofluorimeter PC1 (ISS). Automatic wavelength-to-wavelength tuning of the laser is controlled with a custom LabView program and the fluorescence signal acquisition is accomplished with the ISS Vinci software. B. Top: Schematic of the geometrical arrangement of the 3 x 3 mm cuvette with the sample solution (top view). The laser beam (dark red) is focused with an f = 45 mm lens into a frontal part of the solution. The fluorescence is collected through a side, directed to the left emission channel through a mask. The mask is a narrow rectangle of black paper fixed inside the cuvette holder that allows only the fluorescence from the front 0.7 mm of solution to get out. Bottom: A cuvette with a sample solution inside the holder is shown from the side of the holder having a mask (left image); the same cuvette taken out of holder having a micro stir bar on its bottom (right image).
A few re-arrangements were made to the spectrofluorimeter optics to adjust it for the 2PEF measurements. The excitation lamp source (not shown), excitation monochromator (not shown), optional beamsplitter, and two collimating lenses were removed from the excitation path. The neutral density motorized filter wheel with 4 slots (ISS) was added and connected to the step motor of the filter wheel of the left fluorescence registration channel. A NIR achromatic lens, f = 45 mm (Edmund Optics) was inserted into an optical tube (ISS) at the end of excitation path. This lens focuses the laser beam onto the sample, held in a 3 x 3 mm optical cuvette (Starna Cells). To avoid absorption of the laser by the solvent, fluorescence is collected from the first 0.7 mm layer of solution (Figure 1B). To minimize thermal lensing effects, all dye solutions are stirred during the measurement (Figure 1B). The left fluorescence detection channel (without monochromator) is used for measurements relative two-photon excitation spectra, because in this case only integrated fluorescence signal is required, and the right fluorescence channel (with monochromator) is used for measuring the two-photon cross sections.
Materials and Reagents
15 ml screw cap glass vials (Kesell, catalog number: BLP025, package of 8)
200 µl gel pipette tips (Fisher Scientific, BasixTM, catalog number: 13-611-116)
Thick black construction paper
Coumarin 540A dye (Exciton, catalog number: 05450)
LDS 798 dye (Exciton, catalog number: 07980)
Rhodamine 590 dye (Exciton, catalog number: 05901)
Fluorescein sodium salt, analytical standard (Sigma-Aldrich, catalog number: 30181-100MG)
Chloroform, CHCl3 (Fisher Scientific, HPLC grade, catalog number: C607-1)
Deuterated chloroform, CDCl3 (Sigma-Aldrich, catalog number: 151858-10x0.75ML)
Dimethyl sulfoxide, C2H6OS (Fisher Chemical, Certified ACS grade, catalog number: 151874-10x0.75)
Methanol, CH3OH (Fisher Chemical, HPLC grade, catalog number: A452-4)
LDS 798 dye solution in CHCl3:CDCl3 (1:2) mixture (see Recipes)
Coumarin 540A dye solution in DMSO (see Recipes)
Rhodamine 590 dye solution in methanol (see Recipes)
Equipment
Optical Table: Sealed Hole Table Top with Tuned Damping (Newport, model: RS 2000TM), set on High Performance Laminar Flow Isolators (4 pieces) (Newport, model: S 2000)
Femtosecond pulsed laser (InSight DeepSee Dual, Newport Spectra-Physics)
Photon Counting Spectrofluorimeter (ISS, model: PC1TM)
Silver coated mirrors (Newport, model: New Focus 5103 (5 pcs.))
Stainless steel optical posts (Thorlabs, catalog numbers: TR3 (4pcs.) and TR4 (7 pcs.))
Standard ½” diameter, 3” long postholders (Thorlabs, catalog number: PH3 (11 pcs.))
Standard ½” diameter 1” long postholder (Thorlabs, catalog number: PH1 (1pc.))
Post holder bases (Thorlabs, catalog numbers: BA1 (11 pcs.) and BA1S (1pc.))
Bolts and nuts. ¼”–20 Hardware Kit (Thorlabs, catalog number: HW-KIT2)
New Focus mirror mount (Newport, catalog number: 9773 (5 pcs.))
Flipper Optic Mount (Newport, model: New Focus 9891)
Mounted achromatic half wave plate (690-1,200 nm) (Thorlabs, catalog number: AHWP10M-980)
Rotation Mount for Ø1" Optics (Thorlabs, catalog number: RSP1 (2 pcs.))
Unmounted Glan-Laser Polarizer, Ø10 mm CA, Uncoated (Thorlabs, catalog number: GL10P)
SM1 Lens Tube Mount for 8 mm and 10 mm Mounted Polarizing Prisms (Thorlabs, catalog number: SM1PM10)
Mounted Continuously Variable ND Filter, Ø50 mm, OD: 0.04-4.0, ARC: 650-1,050 nm (Thorlabs, catalog number: MDC-50C-4M-B)
Broadband Energy/Power Meter (Melles-Griot, Model 13PEM001)
25mm Dia. x 45mm FL, NIR II Coated, Achromatic Lens (Edmund Optics, model: ACH-NIR 25x45 NIR-II, Stock: 45-802)
22 mm-to-25 mm inner diameter lens tube adaptors, ISS Accessory, 2 pieces
ND New Focus reflective filters (Newport, catalog numbers: 5240 (OD 1), 5235 (OD 0.5), and 5233 (OD 0.3))
4-slot filter wheel with a stepper motor, ISS Accessory
Short pass filters, 633/SP (Semrock, catalog number: BSP01-633R-25), 680/SP (Semrock, catalog number: FF01-680/SP-25), 694/SP (Semrock, catalog number: FF02-694/SP-25), 745/SP (Semrock, catalog number: FF01-745/SP-25), 770/SP (Semrock, catalog number: FF01-770/SP-25)
Long pass filter 645/LP (Thorlabs, catalog number: FGL 645)
RS 232 Serial cable (15 ft)
Micro, square, stopper top special optical glass cuvettes, 3 x 3 mm (Starna Cells, catalog number: 23-3.45-SOG-3, quantity 6)
3-mm SOG cuvette adaptor holder (Starna Cells, catalog number: FCA3, quantity 4)
1 cm standard glass fluorometer rectangular cells (Starna Cells, catalog number: 23-G-10, quantity 4)
Micro spinbar magnetic stir bar, 5 x 1 mm (Thomas Scientific, catalog number: 1207Q08, quantity 6)
UV/Vis spectrophotometer (PerkinElmer, LAMBDA 950)
Luminescence Spectrometer (PerkinElmer, LS55)
200 µl pipette (Gilson, model: Pipetman Classic P200, catalog number: F123601)
Software
OriginPro 2017 (OriginLab, https://www.originlab.com)
Vinci 3 (ISS, http://www.iss.com/)
-
LabView2018 (National Instruments, https://www.ni.com)
Custom Labview program for scanning the laser wavelength could be obtained by sending an e-mail request to mikhail.drobijev@montana.edu
Procedure
-
Building optical setup for two-photon absorption measurements
On the optical table set up and fix a femtosecond laser and a spectrofluorimeter, approximately 2 m apart.
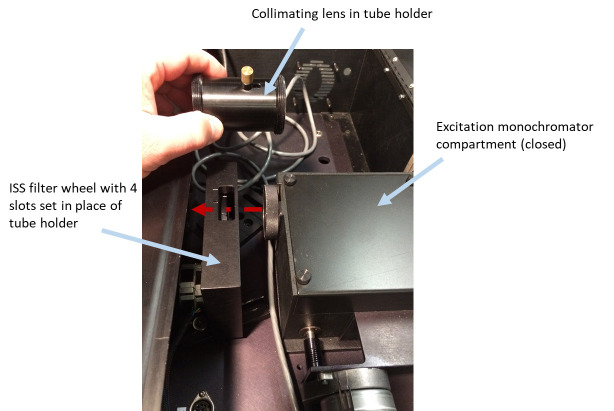
Remove the excitation lamp source (Figure 2), the mirror holder with two mirrors from the excitation monochromator (Figure 3), two lenses (in tubes) (Figures 4 and 5), optional beam splitter (Figure 6), and optional filter (Figure 7) from the excitation path of the PC1 spectrofluorimeter. The tube carrying the first lens and placed between the monochromator and optional beamsplitter must be removed as well (Figure 4). The second tube (empty), entering the sample compartment should be kept in place (Figure 5).
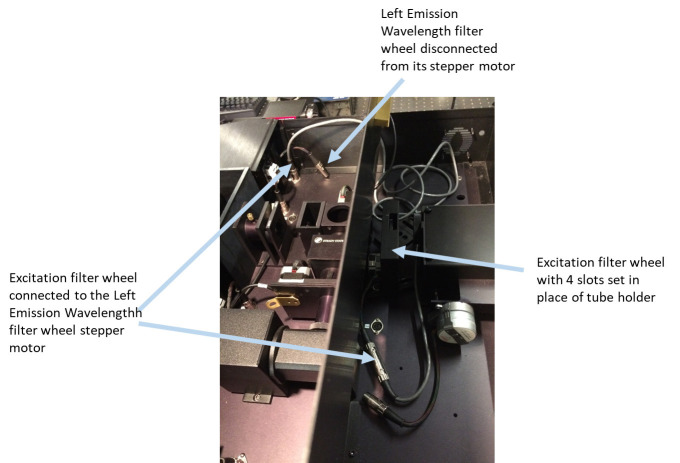
Disconnect the ‘Left Emission Wavelength’ stepper motor cable from its stepper motor jack inside PC1 (Figure 8).
In a spare motorized filter wheel with 4 slots (ISS accessories) insert New Focus ND reflective filters with OD = 1, OD = 0.5, and OD = 0.3 in the slots # 1, 2, and 3, respectively. Leave the slot # 4 empty.
Set a motorized filter wheel with these ND filters in the excitation optical path of PC1 right after the excitation monochromator and bolt it to the PC1 base (Figures 4 and 8).
Connect the stepper motor of this filter wheel to the stepper motor jack of the ‘Left Emission Wavelength’ wheel (Figure 8).
Put the excitation polarizer inside the optical path of the PC1.
Turn on the PC1 and the computer controlling it.
Create a file template in Vinci to measure the excitation power dependence of fluorescence in the left or right emission channels (Power Dependence file), Figure 9. For that, go to Experiment in Vinci software, then click on Single Point, and in the drug menu select Intensity. Right-click on the block called Fixed Parameter, click on Remove tab, and select Left Emission Wavelength box, then click OK. Right click on the block called Variable Parameters, click on Add tab and select Left Emission Wavelength function then click OK. In the Variable Parameters, Left Emission Wavelength box, click on the Edit List and call filter #1–0.1T, #2–0.3T, #3–0.5T, and #4–empty. In the Time Base window, select 10 s, and in Number of Iterations, select 1. Save this file as “Power Dependence”.
Create a file template in Vinci to measure the two-photon excitation spectra of the two samples–one set in the Sample and another–in Reference position of the PC1 in one laser scan using left emission channel (Spectral Scan file), Figure 10. For that, go to Experiment in Vinci software, then click on Slow Kinetics, and in the drug menu select Intensity. Right-click on the block called Variable Parameters and add a Sample function. In the Time Base window, select 1.0 s, and in Time window in Variable parameters select 0 s for Start, 6,500 s for Stop, and 6.00 for Step. Select 200 min for ‘Measure Dark every __ minutes’. In the block Fixed Parameters under Left Emission Wavelength select empty in the Value box. Save the file as “Spectral Scan”.
Turn on the laser in the alignment mode (200 mW) at 720 nm. Use safety goggles.
Set the first mirror M1 assembled in the holder right after the laser output (main beam) to turn the beam 90° in horizontal plane, parallel to the table, see Figure 1.
Set first a half-wave plate and second a Glan Laser polarizer assembled in their rotation mounts after the M1 in the laser beam. Make sure the beam passing through both of them freely at its original height (as it came out of the laser).
Turn the half-wave plate fast axis approximately to 45° (turning laser polarization from horizontal to vertical).
Turn the Glan polarizer polarization axis close to vertical position.
Use 3 mirrors (M2-M4) in their holder assemblies to direct the laser beam to the entrance aperture of the spectrofluorimeter (see Figure 1). Use mirrors M2 and M3 to make the beam height close to the height of the entrance aperture of PC1 and parallel to the table. Use M3 and M4 to direct the beam to the center of the entrance aperture of PC1 in the horizontal plane.
Put the continuously variable neutral density filter in the beam after the M3 mirror.
Put the flip mirror FM after M4 and flip it up.
Put the power meter in the laser path after the flip mirror.
Turn the continuously variable neutral density (ND) filter wheel to the maximum transmission position.
Check that the laser power measured with the power meter is ~200 mW.
Turn the continuously variable ND filter to attenuate the power to ~20 mW.
In the VINCI Experiment software (ISS), go to Instrument Control tab and open the excitation shutter.
In the same tab set the Left Emission Wavelength to position 4 (corresponding to empty slot of the excitation ND filter wheel.
With mirrors M3 and M4 align the beam along the axis connecting the center of the entrance aperture of PC1 and the center of the window in the sample holder.
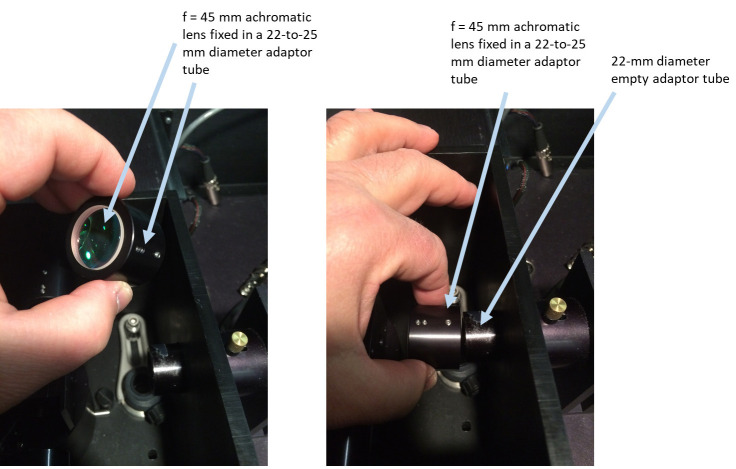
Insert the 45-mm achromatic lens into a 22 mm-to-25 mm diameter adaptor tube (ISS accessory) and slip that adaptor with the lens over a 22-mm ISS tube, with the lens facing toward the sample position (Figure 11).
Make sure that the laser beam is still pointing at the center of the opening of the sample holder (now with the 45-mm lens in). If necessary slightly re-align the beam with mirrors M3 and M4.
Turn off the laser.
In the right emission channel, insert the Semrock 745/SP filter into a filter slot.
Disconnect the Laser from the computer with InSight GUI software and connect it through an RS 232 Serial port to a PC computer with the custom LabView program for tuning laser wavelength.
Turn on the laser using the LabView program (Figure 12, Supplemental file 1 Laser Scan).
Tune the laser to 850 nm.
Flip the flip mirror up.
Open the laser shutter with the LabView program.
Adjust the laser power to 200 mW. First make sure that continuously variable ND filter is turned to a fully transmitting position. Then, slowly rotate the half-wave plate (sitting immediately after the laser) until the laser power reads 200 mW. Use this position of the half-wave plate always, unless higher power is needed in experiment.
Move the head of the power meter into the sample compartment and fix it (with the 1” post holder and short post holder base BA1S), such that its sensor is centered inside the round opening of the excitation path and facing the laser beam. Set the excitation polarizer to horizontal (90°) position with the Instrument Control of PC1 software. Adjust the angle of the external Glan Laser polarizer by turning its rotation mount, to a position where the power is minimum. Lock this position with a screw on its rotation mount.
Slide the excitation polarizer out of the excitation optical path.
Calibrate the ND filters at several laser wavelengths in the whole tuning range. Set a first laser wavelength at 680 nm. By using the Instrument Control function in Vinci, change the position of the Left Emission Wavelength filter from 1 to 4 and record the power for all 4 positions. Calculate the ratio of power measured for positions 1-3 to that measured for position 4.
Repeat Step A38 for a set of wavelengths (680, 690, 710, 730, 780, 800, 810, 840, 900, 940, 960, 1,000, 1,050, 1,060, 1,100, 1,200, 1,300 nm) in the laser tuning range.
Summarize the data in the Origin Workbook, see Figure 13.
Turn off the laser.
Remove the power meter head from the sample compartment and place it back to its holder after the flip mirror.
Insert the 770/SP filter into a 22 mm-to-25 mm diameter adaptor tube (ISS accessory) and slip that adaptor with the filter over a 22-mm ISS tube (with the PC1 collecting lens in it) used for emission collection through the left emission channel.
In the Left Emission Filter Wheel with 4 slots (disconnected from its electric jack) insert the Semrock 633/SP, 694/SP, and 680/SP filters in slots 1, 2, and 3, respectively. Leave slot 4 empty.
Dismount two adaptor holders for 3 x 3 mm cuvettes (unscrew 4 miniature screws holding one side of the holder) and insert a rectangular band of black paper (0.9 x 4 cm) on the side containing 4 screws such that only a narrow slit of ~0.7 mm remains open into each of the holders, see Figure 1B, right, bottom. The slit is supposed to be on the left side of the facet, when looking at the holder.
Mount the holders back, fixing the pieces of paper inside them with 4 screws.
-
Measuring two-photon excitation spectral shapes using Left Emission Channel
-
Preparation of samples for two-photon spectral measurements.
Prepare the stock solutions of samples (up to two new samples) and references (LDS798 and Coumarin 540A), see Recipes for preparation of reference solutions, and add 150 μl of them into the 3 x 3 mm optical cuvettes.
Using Lambda 950 Spectrophotometer, measure absorption spectra of all the samples. The optical density in the spectral maximum of all solutions should be in the range of 0.2-1.5 when measured in 3 x 3 mm cuvettes placed in 3-mm adaptor holder.
Put micro stir bars in solutions with reference.
-
Initial instrument setup preparation. Coumarin 540A solution in Sample holder. Filters 770/SP and 633/SP in the Left Emission Channel.
Turn on the laser in the full power mode.
Start the laser control LabView program (Supplemental file 3 LaserTestVI3.vi) from a PC computer.
Turn on the PC1 spectrofluorimeter.
Insert the adaptor holders for 3 x 3 cuvettes into the sample and reference holders of PC1 such that the masked side of either adaptor holder is directed to the left emission channel when it is set to the measurement (the reference holder can be set to measurement by selecting Reference position of the turret in the Instrument Control of Vinci). Keep the adaptor holders in place during all the measurements.
Set the Sample position to measurement.
In the Instrument Control start stirring both Sample and Reference.
Insert the 3 x 3 mm cuvette with Coumarin 540A solution into the sample holder of PC1.
Turn manually the left emission wavelength filter wheel to position 1 (corresponding to 633/SP filter).
Slide the left emission polarizer in the emission path and set it to Magic Angle position (with Instrument Control function).
Set the laser wavelength to 800 nm.
Adjust the laser power with the continuous ND filter to ~20 mW.
Send the laser beam to PC1 by flipping the flip mirror down.
Make sure that the excitation polarizer in PC1 is moved out of the excitation optical path.
Make sure with the Instrument Control of Vinci that the ND filter wheel in the excitation channel (Left Emission Wavelength) is set to empty position (slot 4).
Open the excitation shutter with Instrument Control.
In a dark room with the sample compartment lid removed, adjust the distance from the 45-mm lens to the sample by sliding the adaptor with the lens in it over the 22-mm tube (fixed) and maximizing the intensity of fluorescence at the left emission channel PMT.
Fix the position of the adaptor (with respect to a 22-mm tube) with a small screw.
-
Adjusting power range for the samples #1 and #2. First, sample #1 and then sample #2 in Sample holder. Filters 770/SP and 633/SP (or 680/SP, 694/SP or empty) in the Left Emission Channel. Select the second short pass filter such that its cutoff wavelength is larger than fluorescence peak wavelength of samples #1 and #2.
Put the cuvette with the sample #1 solution into the Sample position instead of Coumarin 540A solution.
Cover the sample compartment with the lid.
Measure the maximum signal at several wavelengths across the 2PA spectrum, e.g., 700, 800, 900, 1000, 1100, 1200 nm (using left PMT).
Repeat the same for the sample #2.
Adjust the laser power with the continuous ND filter such that the maximum signal across the 2PA spectrum of both samples amounts ~1 x 10⁶ counts. Typically, this power will be in the range 10-100 mW, depending on sample concentration and two-photon brightness.
-
Checking the power dependence of fluorescence at different wavelengths for samples #1 and #2. First, sample #1 and then sample #2 in Sample holder. Filters 770/SP and 633/SP (or 680/SP, 694/SP or empty) in the Left Emission Channel.
Using the Power Dependence file, check that the power dependence of sample #1 fluorescence is quadratic (power exponent between 1.95 and 2.05) at wavelengths in the short wavelength region of spectrum, where the one-photon excitation can contribute. Find the shortest wavelength by using discrete steps of 20 nm (i.e., 680, 700, 720 nm, etc.), at which the signal is quadratic.
Repeat the Step B4a for sample #2.
-
Scanning 2PA spectra of samples #1 and #2. Sample #1–in Sample position and sample #2–in Reference position. Filters 770/SP and 633/SP (or 680/SP, 694/SP or empty) in the Left Emission Channel.
Put cuvettes with sample #1 in the Sample position and with sample #2 in the Reference position of the sample compartment turret.
In the scanning part of the LabView file controlling the laser, set the start wavelength of the scan equal to the largest number found in Steps B4a and B4b.
Calculate the stop wavelength (λstop) by taking the longest possible wavelength observed as a long-wavelength edge of one-photon absorption spectrum multiplied by 2 and taking the closest number to it in a sequence of numbers starting at 680 with. Set this number as a stop wavelength.
Set the step equal to 4 nm and the time per step equal to 42 s.
Open the Spectral Scan file, make the notes about the experiment (samples names and positions, filters used, etc.) and start the scan.
Start the laser scan.
Once the scan is finished, remove the cuvettes with the samples from adaptor holders.
-
Scanning 2PA spectra of Coumarin 540A solution. One cuvette with Coumarin 540A solution–in Sample position and another cuvette with Coumarin 540A solution–in Reference position. Filters 770/SP and 633/SP in the Left Emission Channel.
Put two cuvettes with the same solution of Coumarin 540A in DMSO into the Sample and Reference positions of the turret.
Repeat Steps B5b-B5g with the stop wavelength equal to 980 nm in Step B5c and all other settings kept the same in Steps B5b-B5f and making the notes about the reference in Step B5e.
-
Scanning 2PA spectra of LDS 798 solution. One cuvette with LDS 798 solution–in Sample position and another cuvette with LDS 798 solution–in Reference position. Filter 770/SP in the Left Emission Channel.
Put two cuvettes with the same solution of LDS 798 in chloroform/deuterated chloroform, 1:2, into the Sample and Reference positions of the turret.
Turn manually the left emission wavelength filter wheel to position 4 (empty).
Repeat Steps B5b-B5f with the start wavelength equal to 940 nm in Step B5b and all other settings kept the same in Steps B5b-B5f and making the notes about the reference in Step B5e.
-
Calculating corrected two-photon excitation spectra of samples #1 and #2 with the programs written in OriginLab.
-
For a file that contains the two-photon raw spectral data (.ifx) in which two samples were measured simultaneously in the 'Sample' and 'Reference' holders:
In OriginLab, create and save an Import Wizard (File > Import > Import Wizard) that will open the file into a workbook so that it looks similar to the example workbook displayed in Figure 14. The data columns that the Vinci program saves are 'Time', 'Sample', 'Intensity', 'IntensityStdError', and 'Real time'.
Name this Import Wizard filter "2PA_sample_and_reference".
Add the auto-analysis script to that Import Wizard filter. To do this, first import the file used for the above step, select the filter you just created, and click "Next" through to the last window. Check "Save the filter" as well as "Specify advanced filter options". Save this as a new filter, "2PA_sample_and_reference_autocalculation". Click "Next", which brings you to a window to copy and paste Script 1 (see Supplemental file 2 Origin Script) in the window "Script after each file imported:".
After filling in the appropriate values in the window that pops up (first wavelength, last wavelength, wavelength step, seconds per step), the resulting workbook should look like the following (Figure 15). Additionally, a graph (Figure 16) will pop up that shows what the raw data looks like after the script auto-deletes the points when the laser is stabilizing. It should look like data points clustered into two distinct spectra. If there are points that are randomly much lower in intensity than the others, that usually means the script did not work for some reason and the data should be manually sorted. This graph (Figure 16) is an important visual check that the script worked as it is meant to.
If the samples measured are reference dyes to measure the correction function of the setup, then copy and paste the "correct" reference dye spectra into their corresponding columns (column D for the 'Sample holder', column E for the 'Reference holder). Make sure that the wavelength range you copied matches the wavelength range you measured. Columns F and G are now the correction functions for the 'Sample holder' and the 'Reference holder', respectively. They are set to divide the raw spectra by the correct spectra.
-
Merge the short range correction functions separately measured with the reference dyes Coumarin 540A in DMSO (λstart-980 nm) and LDS798 in 2:1 CDCl3:CHCl3 (940 nm-λstop) into full range correction function (λstart-λstop). (Correction function data from the 'Sample holder' and the 'Reference holder' should be treated separately.)
First, normalize the short range correction functions by dividing each of them by the mean of the column values in the 940-980 nm range.
Now, find the mean of the row values of the two short range correction functions in the 940-980 nm range and accept it as a part of correction function for this range.
Create the merged correction function. For the λstart-936 nm range, paste the normalized correction function measured with Coumarin 540A in DMSO. For the 940 nm-980 nm range, paste the average correction function from the previous step. For the 980 nm-λstop range, paste the normalized correction function measured with LDS798 in 2:1 CDCl3:CHCl3.
If the samples measured have unknown 2PA spectra, then copy and paste the correction functions that you measured previously for the sample holder and the reference holder (column D for the 'Sample holder', column E for the 'Reference holder'). Make sure that the wavelength range you copied matches the wavelength range you measured. Columns F and G are now the corrected 2PA spectral shapes for the samples measured in the 'Sample holder' and the 'Reference holder', respectively. They are set to divide the raw spectra by the correction functions.
-
-
-
Measurement of two-photon absorption cross sections of a red fluorescent protein (for example, RGECO1, described in Zhao et al., 2011 ) relatively to Rhodamine 590 in methanol at 1,060 nm using Right Emission Channel with registration of fluorescence at 600 nm.
Prepare the stock solution of Rhodamine 6G in methanol. Adjust the optical density at 528 nm in 3 x 3 mm cuvette to a number between 0.2 and 0.3. Record the exact number for OD.
Adjust the optical density of the sample in 3 x 3 mm cuvettes to 0.2-0.3. Record the exact number for OD.
Set the laser wavelength at 1,060 nm.
In the right emission channel, slide the polarizer in and set it to the magic angle using Instrument Control function.
Set the right emission monochromator to 600 nm and manually insert the two 2-mm slits into the monochromator.
Put the cuvette with reference Rhodamine 590 solution in the Sample holder of the turret.
Adjust the laser power with the ND continuous filter such that the right emission intensity will be on the order of 50,000-100,000 when the excitation filter wheel is set to empty position (#4).
Record this power.
Repeat Steps C7 and C8 for the sample solution.
Run the Power Dependence file with registration in the Right Emission Channel for Rhodamine 590.
Repeat Step C10 for the sample without changing condition.
Using the OriginLab, plot the power dependencies of fluorescence signals as function of power squared and obtain the ratio F2, S (λex, λreg)/F2, R (λex, λreg) values as ratio of the slopes of linear fits of the sample and reference standard, respectively.
-
Using known extinction coefficients, calculate the ratio of concentrations:
To measure the φ numbers, dilute the sample and reference solutions to have optical densities, similar to each other at a selected wavelength (530 nm) and falling in the range of 0.05-0.07 in 1-cm optical cuvettes. Record their respective OD values at 530 nm: ODS (530) and ODR (530).
Using LS55 spectrofluorimeter, record fluorescence spectra of the sample and reference upon excitation at 530 nm with excitation slit equal to 5 nm and emission slit–16 nm.
-
Record the one-photon signals at 600 nm F1, S (600) and F1, R (600) and calculate the ratio:
Using eq. (2), all the ratio values obtained in Steps C12-C16, and Rhodamine 590 cross section σ2(1060) = 10 GM, calculate the 2PA cross section of the sample.
Figure 2. Entrance aperture of the PC1 ISS spectrofluorimeter after the excitation lamp source was removed.

A flip mirror is used for steering the laser beam into a powermeter head. Red dashed arrow shows the direction of laser beam propagation here and in Figures 3-7.
Figure 3. Removing mirror holder with two mirrors from excitation monochromator compartment.
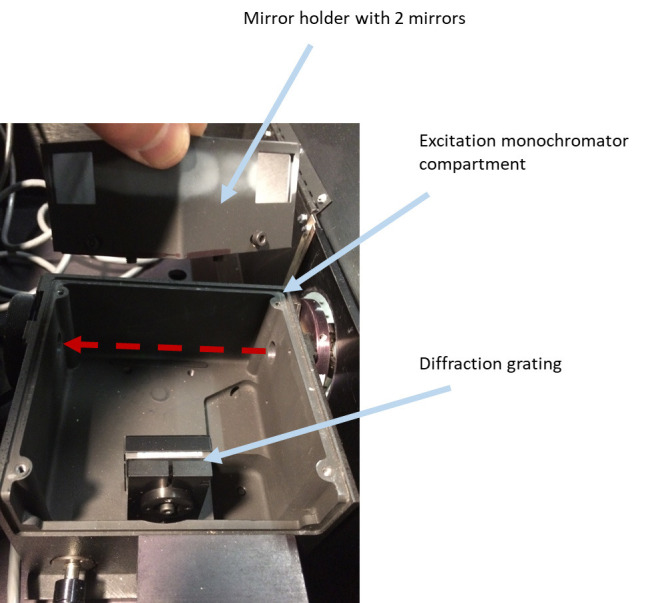
Figure 4. Removing tube holder with collimating lens (placed right after excitation monochromator) and setting an ISS filter wheel with four slots in place of it.
Figure 5. Changes in the sample compartment.
A focusing lens is removed from the tube lens holder pointing toward the sample. 3-mm cuvette adaptors are inserted in the Sample and Reference cuvette holders. In the Left Emission Channel, an additional adaptor tube holder (25-mm) with a short-pass filter (770/SP) is slide onto a 22-mm tube lens holder.
Figure 6. Removing optional beam splitter.
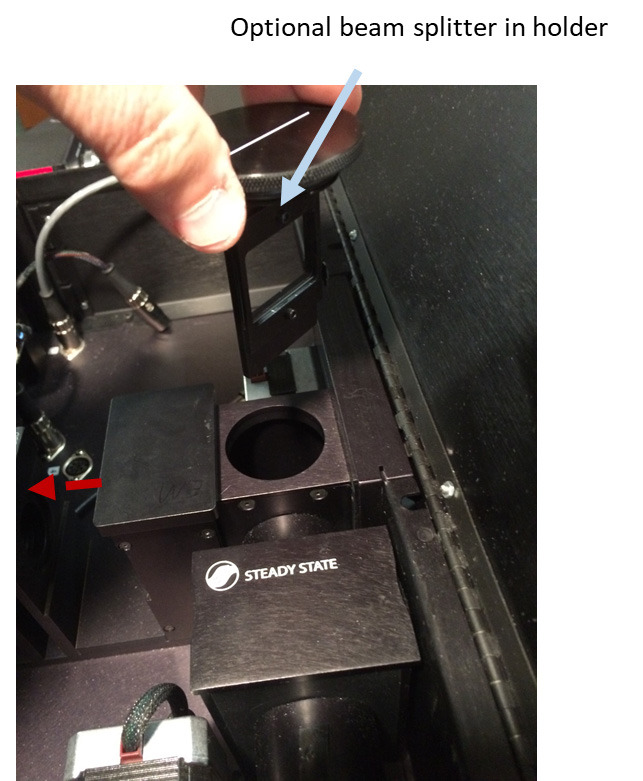
Figure 7. Removing optional excitation filter.
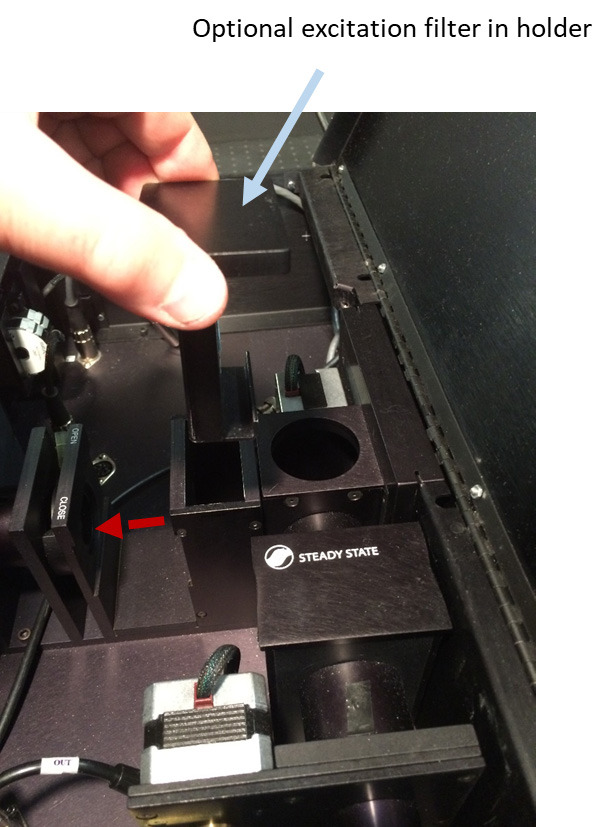
Figure 8. Electrically disconnecting Left Emission Wavelength filter wheel from its stepper motor and connecting an additional filter wheel in excitation path with the stepper motor of the Left Emission Wavelength filter wheel.
Figure 9. Upper left part of the screenshot showing a Vinci 3 template file for the power dependence measurement in the Sample position in both left and right emission channels.

Figure 10. Upper left part of the screenshot showing a Vinci 3 template file for the spectral scan of two samples at once (set in the Sample and Reference positions).
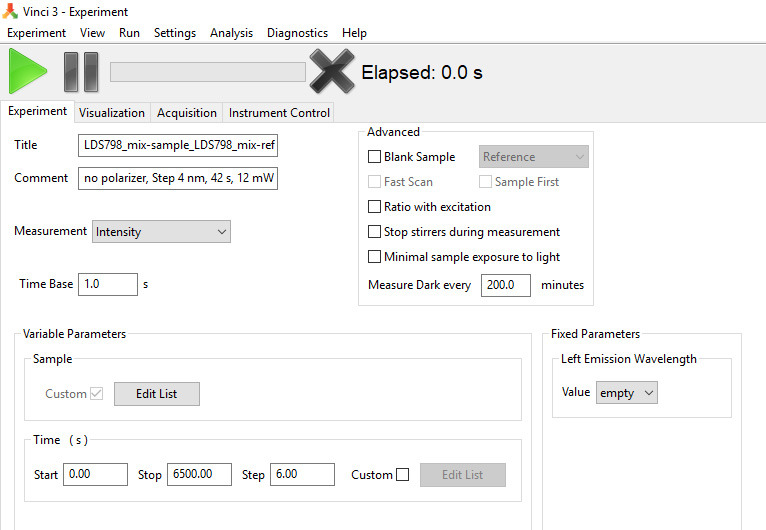
Figure 11. Placing a 45-mm achromatic lens into an excitation optical pathway inside the sample compartment.
Left: An f = 45 mm achromatic lens is inserted and fixed in a 22-to-25 mm diameter adaptor tube. Right: Achromatic lens in the adaptor tube is slide over the 22-mm empty adaptor tube inside the sample compartment.
Figure 12. Front view of the custom-made LabView program to scan the laser from the initial to the final wavelength with a particular step and dwell time.
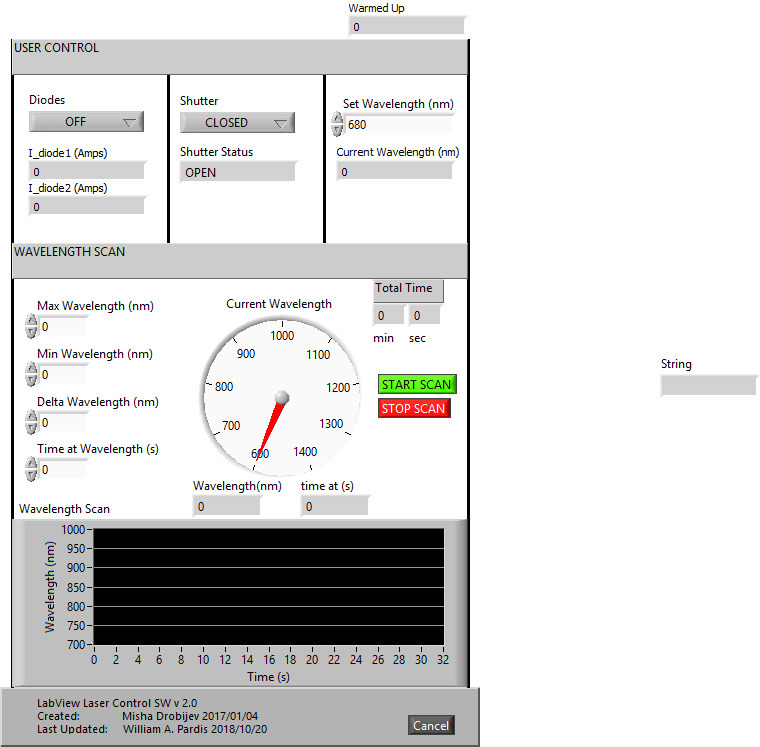
Figure 13. Origin workbook containing a look up calibration table for the transmission properties of ND filters in the filter wheel set in the excitation path at several laser wavelengths.
Figure 14. An example of what the Origin workbook will look like after creating the "2PA_sample_and_reference" Import Wizard filter.

Figure 15. An example of what the final workbook should look like after opening a file with the "2PA_sample_and_reference_autocalculation" Import Wizard filter.
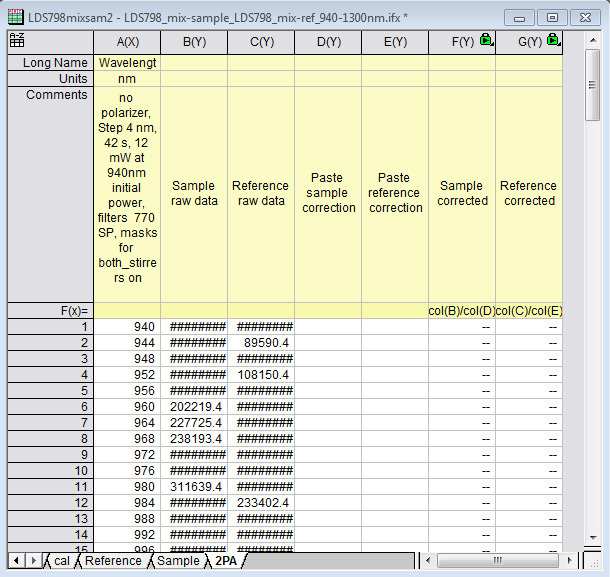
Figure 16. An example of the graph showing what the raw data looks like after the script auto-deletes the points when the laser is stabilizing.
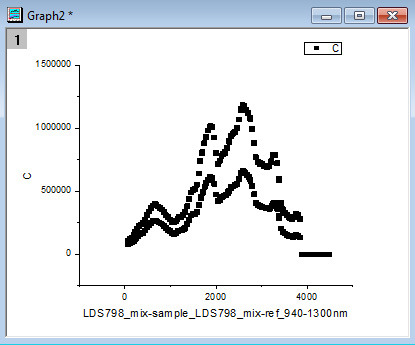
This graph pops up after opening a file with the "2PA_sample_and_reference_autocalculation" Import Wizard filter. It is a visual check that the script worked as intended.
Data analysis
The variations of spectral profiles, i.e., deviations of relative values at one wavelength when the spectra are normalized at another wavelength (e.g., peak) contain the random and systematic contributions. The random contribution comes from reproducibility of the laser parameters in consecutive scans of the same sample. We have observed that the deviations across the spectra were not larger than 4% in 2-3 consecutive scans. Since two scans (sample and reference standard) are used to calculate the corrected 2PA spectrum, this results in a random error of 6%. The systematic spectral deviations come from the accuracy of the measurement of 2PA spectra of references standards. Those can be estimated to be about 5% for Coumarin 540A ( de Reguardati et al., 2016 ) and ~10% for LDS 798 ( Makarov et al., 2011 ). This results in the total spectral shape errors of 8% in the short wavelength range (680-980 nm) and 12% in the long wavelength range (980-13,00 nm).
The error of the 2PA cross section measurement is a combination of the errors of individual parameters entering eq. (2). The errors of F2 numbers are estimated from linear fits of the fluorescence intensity vs. power squared plots (usually 1% for both F2,S and F2,R). The errors in differential quantum yields, φ for both sample and reference were determined from 12 independent measurements of one protein and found to be 7%. The errors in concentrations come mostly from the errors in measurements of extinction coefficients of the sample, equal to 5% ( Molina et al., 2019 ). The systematic error, coming from the uncertainty in the 2PA cross section of reference standard is 10% for Rhodamine 590 (see Notes section). Therefore, the total error calculated in quadrature for the σ2 of the sample measured at one wavelength (1,060 nm) amounts to 15%. This translates to the error of absolute σ2 value, determined at different wavelengths of ~18% ( Molina et al., 2019 ).
Notes
We use the mixture of chloroform/deuterated chloroform (1:2) as solvent for LDS 798 to get rid of chloroform absorption at 1,150 nm. We observed virtually no changes in 1PA spectra of the dyes when going from pure chloroform to the mixture.
-
The shapes of the one-photon and two-photon absorption spectra of Coumarin 540A in DMSO closely match each other in the region of 745-1,000 nm, if the 1PA is plotted versus one-photon wavelength doubled (de Reguardati et al, 2016; Figure 17). In the shorter wavelength range, 680-745 nm the relative 2PA values presented in ( de Reguardati et al., 2016 ) systematically exceed the 1PA values. We have measured independently the 2PA spectrum of Coumarin 540A in DMSO, using Prodan in DMSO as a reference standard ( de Reguardati et al., 2016 ) in the region of 680-800 nm, and obtained much better correlation between the 2PA and 1PA spectral shapes of Coumarin 540A, cf. red and black lines in Figure 17.
To double check the spectral shape of Coumarin 540A (A2PA,R(λ) function) in a broad range from 680 to 1,000 nm, we measured the 2PA spectrum of Rhodamine 590 (= Rhodamine 6G) in methanol versus Coumarin 540A in DMSO and compared it to the known literature data (Figure 18). The data from (Hermann and Ducuing, 1972; Makarov et al., 2008 ; de Reguardati et al., 2016 ) were presented as measured, in absolute cross section values (see Footnote a and b to the Table 5 below for the Hermann and Ducuing data). The data from ( Albota et al., 1998 ; Rodriguez et al., 2009 ; Rodriguez and Chiesa, 2011; Rodriguez and Chiesa, 2012) were scaled to a value of 74 GM at 820 nm that matches the measurements of ( Makarov et al., 2008 ; de Reguardati et al., 2016 ). The spectrum from (Wakebe and Van Keuren, 1999), originally presented as relative spectrum for Rhodamine 6G in ethanol, is shifted 17 nm to the red (in 2PA wavelengths) and scaled to a value of 34 GM at 844, matching the measurements of ( Makarov et al., 2008 ; de Reguardati et al., 2016 ). In almost the whole region of Coumarin 540A absorption, from 690 to 960 nm, there is a good correlation between the spectral shapes measured in ( Albota et al., 1998 ) and ( de Reguardati et al., 2016 ), therefore we conclude that these spectra present the best approximation to the 2PA spectrum of Rhodamine 6G. This conclusion is supported by good matches of other data to these spectra in different spectral regions or at separate wavelengths: Hermann and Ducuing data at 694 and 1,060 nm; Wakebe and Van Keuren data–in the 806-1,106 nm region; Makarov et al. (2008) data–in the 720-900 and 1,060-1,100 nm regions; Rodriguez et al. (2007) data–in the 720-860 nm region.
When the 2PA spectral shape of Coumarin 540A in DMSO is taken as a reference, the 2PA spectrum of Rhodamine 6G in methanol shows strongly overestimated absorption in the region of 680-750 region (cf. open diamonds and light blue line in Figure 18). This can be due to overestimated values of 2PA of Coumarin 540A, as shown in Figure 17. However, when the 2PA spectrum of Coumarin 540A corrected in the 680-740 nm range with Prodan (see Table 1 for the values) is taken for the A2PA,R(λ) function, the Rhodamine 6G spectrum (dark green line with triangles in Figure 18) matches quite well the literature spectra of ( Albota et al., 1998 ) and ( de Reguardati et al., 2016 ) in the region of 680-980 nm. Therefore we conclude that the corrected 2PA spectrum of Coumarin 540A in DMSO is a good approximation for the A2PA,R(λ) function when the corrected spectrum of Coumarin 540A in DMSO is used as a reference in the range of 680-980 nm.
-
In Makarov et al. (2011) , the 2PA spectra of the LDS 798 dye in chloroform were obtained using fluorescence (relatively to Styryl 9M [ Makarov et al., 2008 ]) and z-scan (absolute measurement) techniques. The shapes of the one-photon and two-photon absorption spectra are very broad, structureless, and closely match each other in the region of 900-1,300 nm, if the 1PA is plotted versus one-photon wavelength doubled (Makarov et al, 2011; Figure 19).
Since the z-scan data are obtained with absolute method (LDS 798 is a primary standard), we use the corresponding 2PA shape (black squares in Figure 19) for the A2PA,R(λ) function. To interpolate the A2PA,R(λ) function to intermediate wavelengths, we use a Gaussian fit to the experimental data between 900 and 1300 nm, shown by a dashed black line in Figure 19. This spectrum is presented in Table 2. To check the performance of this function, the 2PA spectrum of Rhodamine 590 in methanol was measured relatively to LDS 798 in CHCl3/CDCl3 (1:2) in the 940-1140 mn region, see Figure 18. The data (purple line) match well the spectra of Albota et al. (1998) ; Wakebe and Van Keuren (1999), and de Reguardati et al. (2016) and overlaps well with the spectrum measured using Coumarin 540A (dark green line) in the region 940-980 nm. This corroborates our choice of LDS 798 as a reference standard for the spectral shape in the 940-1,300 nm region.
In the measurements of two-photon cross sections, we use optical densities OD < 0.05 at the fluorescence registration wavelength and OD < 0.3 in the absorption peak (in 3-mm cuvette). That is needed to exclude possible re-absorption and re-emission effects.
-
We suggest using Rhodamine 590 in methanol as a reference standard (see Tables 3 and 4 for literature data) for measuring 2PA cross sections at selected wavelengths. Most consistent literature data were collected near 1,060 nm (Table 3). For this wavelength we suggest using σ2 = 10 ± 1 GM.
Table 4. Other σ2 values of Rhodamine 6G at selected wavelengths.
The σ2 values showing satisfactory matching between two or more measurements are italicized in column 7. Recommended values of σ2 are calculated as average of these numbers for each wavelength.Wavelength(nm)Solvent Conc.(M)Pulse Originalσ2(GM)Correction 1σ2(GM)Correction 2(final)σ2(GM)Ref. 694 C2H5OH n/a ns 355 ± 170 710 ± 355a 277 ± 138 b Hermann and Ducuing, 1972 694 CH3OH 0.04 30 ps 180 ± 20 - 180 ± 20 Sperber and Penzkofer, 1986 690700CH3OH 1.1 10-4 100 fs 136176- 156 e Albota et al., 1999 694 CH3OH 8 10-6 100 fs 112 ± 22 - 112 ± 22 Makarov et al., 2008 692 CH3OH n/a 100 fs 202 ± 16 - 202 ± 16 de Reguardati et al., 2016 Suggested conditions and cross section value 694 CH3OH 10-5 100 fs 180 ± 23 730 CH3OH 8 10-6 100 fs 50 ± 10 - 50 ± 10 Makarov et al., 2008 730 CH3OH n/a 100 fs 50 ± 4 - 50 ± 4 de Reguardati et al., 2016 Suggested conditions and cross section value 730 CH3OH 10-5 100 fs 50 812 CH3OH 8 10-6 100 fs 71 ± 14 - 71 ± 14 Makarov et al., 2008 812 CH3OH n/a 100 fs 79 ± 6 - 79 ± 6 de Reguardati et al., 2016 Suggested conditions and cross section value 812 CH3OH 10-5 100 fs 75 940 CH3OH 1.1 10-4 100 fs 7.7 - 7.7 Albota et al., 1999 940 CH3OH 8 10-6 100 fs 8.3 ± 1.7 - 8.3 ± 1.7 Makarov et al., 2008 940 CH3OH n/a 100 fs 11.1 ± 0.9 - 11.1 ± 0.9 de Reguardati et al., 2016 Suggested conditions and cross section value 940 CH3OH 10-5 100 fs 9.0 ± 1.0 960 CH3OH 1.1 10-4 100 fs 12.7 - 12.7 Albota et al., 1999 960 CH3OH 8 10-6 100 fs 10.9 ± 2.2 - 10.9 ± 2.2 Makarov et al., 2008 960 CH3OH n/a 100 fs 17 ± 1.4 - 17.0 ± 1.4 de Reguardati et al., 2016 Suggested conditions and cross section value 960 CH3OH 10-5 100 fs 13 ± 2 -
We suggest using Fluorescein in water at pH 11 as a reference standard for molecules fluorescing in green part of the spectrum (500-550 nm). Part C of the protocol should be adjusted then to measuring fluorescence in the green region. Table 5 summarizes the literature data for Fluorescein with recommended wavelengths and σ2 values.
Footnotes for Tables 3-5:
aMultiplied by factor 2 to conform with the more recent definition of σ2 (two photons are needed to excite one molecule), cf. Xu and Webb (1996); Kaatz and Shelton (1999); Makarov et al. (2008) .
bMultiplied by factor 0.39 to conform with the current reference value of quartz, d11 = 0.30 pm/V (versus 0.48 pm/V), see Kaatz and Shelton (1999).
cRe-evaluated using the laser coherence function value g(2) = 2, see Weber (1971); Bradley et al. (1972) ; Kaatz and Shelton (1999). That factor was not included in original analysis.
dMultiplied by factor 4 to conform with the more recent definition of σ2 (two photons are needed to excite one molecule), cf. Xu and Webb (1996); Kaatz and Shelton (1999); Makarov et al. (2008) .
eInterpolated between 690 and 700 nm measurements.
Figure 17. Spectral shapes on 1PA and 2PA spectra of Coumarin 540A in DMSO.
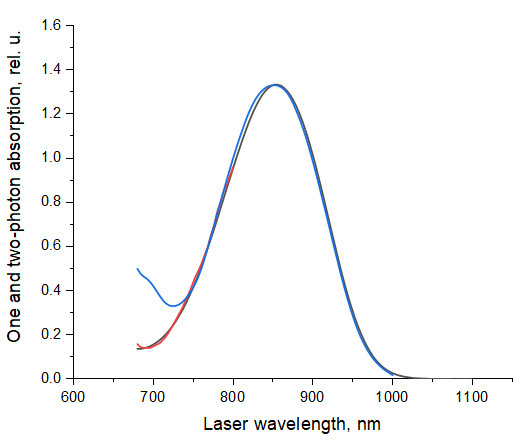
. The 1PA spectrum measured in this work, black line, and 2PA spectrum ( de Reguardati et al., 2016 ), blue line, are normalized at their peak values. The short wavelength part of the 2PA spectrum (680-800 nm), red line, was measured in this work, using Prodan in DMSO ( de Reguardati et al., 2016 ) as a standard.
Figure 18. Two-photon absorption spectra (logarithmic scale) of Rhodamine 6G in merthanol or ethanol.
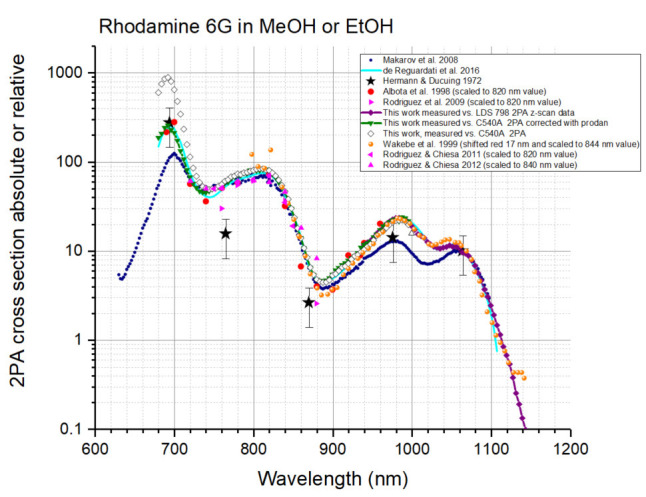
The data of Hermann and Ducuing (1972)–black stars, Makarov et al. (2008) –blue circles, de Reguardati et al. (2016) –light blue line, are presented in absolute σ2 values (see footnotes a and b to Tables 3-5 after Table 5). The data of Albota et al. (1998) –red circles, Rodriguez et al. (2009) –ping right triangles; Rodriguez and Chiesa (2011)–pink left triangles, Rodriguez and Chiesa (2012)–pink up triangles are scaled (see text), and Wakebe and Van Keuren (1999)–orange circles are scaled and shifted (see text). The (scaled) spectrum obtained here using Coumarin 540A in DMSO 2PA spectrum ( de Reguardati et al., 2016 ) as a standard, is shown by open diamonds. The spectrum measured in this work (scaled) relatively to Coumarin 540A in DMSO in 740-1,000 nm region and relatively to Prodan in DMSO in 680-740 nm region is shown by dark green down triangles connected with continuous line. The spectrum obtained in this work relatively to LDS 798 in chloroform/deuterated chloroform, is shown by purple diamonds connected with continuous line.
Table 5. Some suggested σ2 values of Fluorescein in alkaline water solution at different wavelengths.
The σ2 values showing satisfactory matching between two or more measurements are italicized in column 7. Recommended values of σ2 are calculated as average of these numbers for each wavelength.
|
Wavelength (nm) |
Solvent |
Conc. (M) |
Pulse |
Original σ2 (GM) |
Correction 1 σ2 (GM) |
Correction 2 (final) σ2 (GM) |
Ref. |
| 710 | H2O pH11 | 8 10-5 | 100 fs | 17.3 ± 4.4 | 17.3 ± 4.4 | Xu and Webb, 1996 | |
| 710 | H2O pH11 | 3 10-6 | 100 fs | 16.5 ± 3.3 | - | 16.5 ± 3.3 | Makarov et al., 2008 |
| Suggested conditions and cross section value | |||||||
| 710 | H2O pH11 | 10-5 | 100 fs | 16.9 | |||
| 730 | H2O pH11 | 8 10-5 | 100 fs | 25.0 ± 6.3 | 25.0 ± 6.3 | Xu and Webb, 1996 | |
| 730 | H2O pH11 | 3 10-6 | 100 fs | 24.2 ± 4.8 | - | 24.2 ± 4.8 | Makarov et al., 2008 |
| Suggested conditions and cross section value | |||||||
| 730 | H2O pH11 | 10-5 | 100 fs | 24.6 | |||
| 782 | H2O pH11 | n/a | 100 fs | 46 ± 10 | 46 ± 10 | Xu et al., 1995 | |
| 782 | H2O pH11 | 8 10-5 | cw (single mode) | 38 ± 10 | 38.0 ± 10 | Xu and Webb, 1996 | |
| 782 | H2O pH11 | 3 10-6 | 100 fs | 46 ± 9 | - | 46 ± 9 | Makarov et al., 2008 |
| Suggested conditions and cross section value | |||||||
| 782 | H2O pH11 | 10-5 | 100 fs | 43 ± 3 | |||
| 802 | H2O pH11 | 8 10-5 | cw (single mode) | 36 ± 10 | 36 ± 10 | Xu and Webb, 1996 | |
| 802 | H2O pH11 | 3 10-6 | 100 fs | 38 ± 8 | - | 38 ± 8 | Makarov et al., 2008 |
| Suggested conditions and cross section value | |||||||
| 802 | H2O pH11 | 10-5 | 100 fs | 37 | |||
| 842 | H2O pH11 | 8 10-5 | 100 fs | 12 ± 3 | 12 ± 3 | Xu and Webb, 1996 | |
| 842 | H2O pH11 | 3 10-6 | 100 fs | 13 ± 3 | - | 13 ± 3 | Makarov et al., 2008 |
| Suggested conditions and cross section value | |||||||
| 842 | H2O pH11 | 10-5 | 100 fs | 12.5 | |||
| 900 | H2O pH11 | 8 10-5 | 100 fs | 16 ± 4 | 16 ± 4 | Xu and Webb, 1996 | |
| 900 | H2O pH11 | 3 10-6 | 100 fs | 15 ± 3 | - | 15 ± 3 | Makarov et al., 2008 |
| Suggested conditions and cross section value | |||||||
| 900 | H2O pH11 | 10-5 | 100 fs | 15.5 | |||
| 1000 | H2O pH11 | 3 10-6 | 100 fs | 3.1 ± 0.6 | - | 3.1 ± 0.6 | Makarov et al., 2008 |
| 1000 | H2O pH11 | n/a | 100 fs | 3.3 ± 0.3 | - | 3.3 ± 0.3 | de Reguardati et al., 2016 |
| Suggested conditions and cross section value | |||||||
| 1000 | H2O pH11 | 10-5 | 100 fs | 3.2 | |||
| 1060 | C2H5OH | 10-5 | 60 ns | 0.18 | 0.36a | 0.18c | Bradley et al., 1972 |
| 1060 | C2H5OH | ps | 0.075 | 0.15a | 0.15 | Bradley et al., 1972 | |
| 1050 | H2O pH11 | 8 10-5 | 100 fs | 0.23 ± 0.07 | 0.23 ± 0.07 | Xu and Webb, 1996 | |
| 1050 | H2O pH11 | 3 10-6 | 100 fs | 0.17 ± 0.03 | - | 0.17 ± 0.03 | Makarov et al., 2008 |
| Suggested conditions and cross section value | |||||||
| 1050 | H2O pH11 | 10-5 | 100 fs | 0.2 | |||
Table 1. Correct 2PA spectral shape of Coumarin 540A in DMSO, with 680-760 nm data corrected by Prodan in DMSO ( de Reguardati et al., 2016 ) .
| Wavelength | Relative value | Wavelength | Relative value | Wavelength | Relative value | Wavelength | Relative value |
| 680 | 0.135 | 760 | 0.376 | 840 | 0.990 | 920 | 0.523 |
| 684 | 0.117 | 764 | 0.408 | 844 | 0.996 | 924 | 0.478 |
| 688 | 0.113 | 768 | 0.445 | 848 | 0.999 | 928 | 0.434 |
| 692 | 0.112 | 772 | 0.483 | 852 | 1.00 | 932 | 0.390 |
| 696 | 0.112 | 776 | 0.522 | 856 | 0.998 | 936 | 0.348 |
| 700 | 0.115 | 780 | 0.561 | 860 | 0.994 | 940 | 0.307 |
| 704 | 0.118 | 784 | 0.600 | 864 | 0.985 | 944 | 0.268 |
| 708 | 0.124 | 788 | 0.639 | 868 | 0.973 | 948 | 0.232 |
| 712 | 0.135 | 792 | 0.678 | 872 | 0.955 | 952 | 0.199 |
| 716 | 0.146 | 796 | 0.715 | 876 | 0.934 | 956 | 0.169 |
| 720 | 0.160 | 800 | 0.751 | 880 | 0.908 | 960 | 0.143 |
| 724 | 0.176 | 804 | 0.786 | 884 | 0.881 | 964 | 0.120 |
| 728 | 0.194 | 808 | 0.819 | 888 | 0.850 | 968 | 0.100 |
| 732 | 0.215 | 812 | 0.851 | 892 | 0.816 | 972 | 0.0832 |
| 736 | 0.234 | 816 | 0.881 | 896 | 0.780 | 976 | 0.0683 |
| 740 | 0.256 | 820 | 0.908 | 900 | 0.741 | 980 | 0.0556 |
| 744 | 0.279 | 824 | 0.931 | 904 | 0.700 | 984 | 0.0448 |
| 748 | 0.303 | 828 | 0.952 | 908 | 0.657 | 988 | 0.0355 |
| 752 | 0.325 | 832 | 0.968 | 912 | 0.613 | 992 | 0.0274 |
| 756 | 0.350 | 836 | 0.980 | 916 | 0.568 | 996 | 0.0203 |
Figure 19. Spectral shapes of 1PA (purple line) (measured here) and 2PA spectra of LDS 798 in chloroform, green open squares–using fluorescence technique relatively to Styryl 9M, and black squares–using z-scan and absolute method.
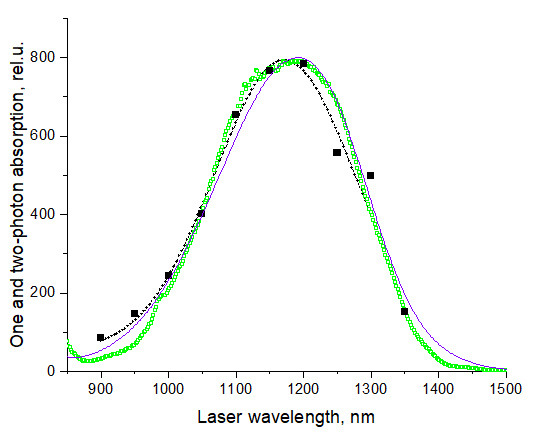
( Makarov et al., 2011 ). All spectra are normalized at their peak values. Black dashed line shows a Gaussian fit to the z-scan data in the region from 900 to 1,300 nm that is used as an A2PA,R(λ) function here. This figure is adapted from ( Makarov et al., 2011 ).
Table 2. Correct 2PA spectral shape of LDS 798 in chloroform from 936-1,300 nm; values are from fitting a Gaussian to the LDS 798 z-scan data from Makarov et al., 2011 .
| Wavelength | Relative value | Wavelength | Relative value | Wavelength | Relative value | Wavelength | Relative value |
| 936 | 0.116 | 1028 | 0.410 | 1120 | 0.847 | 1212 | 0.978 |
| 940 | 0.124 | 1032 | 0.428 | 1124 | 0.864 | 1216 | 0.970 |
| 944 | 0.132 | 1036 | 0.446 | 1128 | 0.879 | 1220 | 0.961 |
| 948 | 0.141 | 1040 | 0.465 | 1132 | 0.894 | 1224 | 0.950 |
| 952 | 0.150 | 1044 | 0.484 | 1136 | 0.907 | 1228 | 0.937 |
| 956 | 0.159 | 1048 | 0.503 | 1140 | 0.920 | 1232 | 0.923 |
| 960 | 0.169 | 1052 | 0.522 | 1144 | 0.933 | 1236 | 0.908 |
| 964 | 0.180 | 1056 | 0.542 | 1148 | 0.944 | 1240 | 0.892 |
| 968 | 0.191 | 1060 | 0.561 | 1152 | 0.954 | 1244 | 0.874 |
| 972 | 0.203 | 1064 | 0.581 | 1156 | 0.963 | 1248 | 0.855 |
| 976 | 0.215 | 1068 | 0.601 | 1160 | 0.972 | 1252 | 0.835 |
| 980 | 0.227 | 1072 | 0.621 | 1164 | 0.979 | 1256 | 0.813 |
| 984 | 0.240 | 1076 | 0.641 | 1168 | 0.985 | 1260 | 0.791 |
| 988 | 0.253 | 1080 | 0.661 | 1172 | 0.991 | 1264 | 0.767 |
| 992 | 0.267 | 1084 | 0.681 | 1176 | 0.994 | 1268 | 0.742 |
| 996 | 0.282 | 1088 | 0.701 | 1180 | 0.997 | 1272 | 0.717 |
| 1000 | 0.296 | 1092 | 0.720 | 1184 | 0.999 | 1276 | 0.692 |
| 1004 | 0.311 | 1096 | 0.740 | 1188 | 1.00 | 1280 | 0.665 |
| 1008 | 0.327 | 1100 | 0.759 | 1192 | 0.999 | 1284 | 0.638 |
| 1012 | 0.343 | 1104 | 0.777 | 1196 | 0.998 | 1288 | 0.611 |
| 1016 | 0.359 | 1108 | 0.795 | 1200 | 0.995 | 1292 | 0.584 |
| 1020 | 0.376 | 1112 | 0.813 | 1204 | 0.991 | 1296 | 0.556 |
| 1024 | 0.393 | 1116 | 0.831 | 1208 | 0.985 | 1300 | 0.529 |
Table 3. Literature data for the two-photon cross section of Rhodamine 6G in methanol or ethanol in the 1,054-1,064 nm region.
Most of the values (column no. 7) group around 10 GM. The average of all 11 measurements provides σ2 = 12 ± 2 GM (average ± SE of mean). The underlined values are obtained either with mode-locked lasers or using the methods where the uncertainty in the second-order time correlation function of laser intensity g(2) was removed. Out of these six measurements, the lowest (4.2 GM) (Kaatz and Shelton, 1999), was obtained by using Hyper Rayleigh scattering technique to calibrate the laser properties, including g(2). The authors found that this method gave underestimated values of σ2, compared to those obtained with standard calibration against one-photon fluorescence. Therefore, the suggested value of σ2 is calculated by excluding this measurement and averaging the numbers selected in italic in column 7.
|
Wavelength (nm) |
Solvent |
Conc. (M) |
Pulse |
Original σ2 (GM) |
Correction 1 σ2 (GM) |
Correction 2 σ2 (GM) (final) |
Ref. |
| 1060 | C2H5OH | n/a | ns | 12.9 ± 6 | 25.8 ± 12a | 10.1 ± 4.7 b | Hermann and Ducuing, 1972 |
| 1060 | C2H5OH | 10-3 | 60 ns | 5.5 | 11a | 5.5c | Bradley et al., 1972 |
| 1060 | C2H5OH | 10-4 | 30 ns | 26 | 52a | 26c | Vsevolodov et al, 1973 |
| 1060 | C2H5OH | 10-3 | ps | 3.6 | 7.2a | 7.2 | Bradley et al., 1972 |
| 1060 | C2H5OH | 10-6 | 110 ns | 11 ± 5 | 22 ± 10a | 11 ± 5c | Li and She, 1982 |
| 1064 | C2H5OH | 10-2 | cw | 12 ± 2 | 48 ± 8d | 24 ± 4c | Catalano and Cingolani, 1982 |
| 1054 | CH3OH | 0.2 | 5 ps | 10 ± 1 | - | 10 ± 1 | Penzkofer and Leupacher, 1987 |
| 1064 | CH3OD | 2.2 10-6 | 125 ns | 4.2 ± 0.8 | - | 4.2 ± 0.8 | Kaatz and Shelton, 1999 |
| 1064 | C2H5OH | 10-4 | 10 ns | 15 ± 1 | 30 ± 2a | 15 ± 1c | Rodriguez, et al, 2007 |
| 1060 | CH3OH | 8 10-6 | 100 fs | 10 ± 1 | - | 10 ± 2 | Makarov et al., 2008 |
| 1060 | CH3OH | n/a | 100 fs | 11 ± 1 | - | 11 ± 1 | de Reguardati et al., 2016 |
| Suggested conditions and cross section value | |||||||
| 1060 | CH3OH | 10-5 | 100 fs | 10 ± 1 | |||
Recipes
-
LDS 798 dye solution in CHCl3:CDCl3 (1:2) mixture
Dissolve 0.1 mg of LDS 798 in 0.75 ml of CHCl3 in a 15 ml screw cap glass vial
Add 1.5 ml of CDCl3. Stir overnight on magnetic stirrer. The optical density of the final solution at 594 nm (spectral maximum) in 3 mm cuvette should be OD ~1.2. This corresponds to a concentration of ~10-4 M
It can be stored in closed vial in the dark at room temperature for at least 2 months
-
Coumarin 540A dye solution in DMSO
Dissolve 0.15 mg of Coumarin 540A in 3.3 ml of DMSO in a 15 ml screw cap glass vial
The optical density of the final solution at 427 nm (spectral maximum) in 3 mm cuvette should be OD ~0.6. This corresponds to a concentration of ~10-4 M
It can be stored in closed vial in the dark at room temperature for at least 2 months
-
Rhodamine 590 dye solution in methanol
Dissolve 0.05 mg of Rhodamine 6G in 10 ml of CH3OH in a 15 ml screw cap glass vial
The optical density of the final solution at 528 nm (spectral maximum) in a 3 mm cuvette should be OD ~0.3. This corresponds to a concentration of ~10-5 M
It can be stored in a closed vial in the dark at room temperature for at least 4 months
Acknowledgments
We thank Alexey Drobizhev for the custom LabView program. This work was supported by the NINDS grants U01 NS094246 and U24 NS109107 for MD, TEH, and RSM, and the Ruth L. Kirschtein National Research Service Award, number F31NS108593 for RSM.
This protocol was derived from Molina, R.S., Qian, Y., Wu, J., Shen, Y., Campbell, R. E., Drobizhev, M. and Hughes, T. E. (2019) Understanding the fluorescence change in red genetically encoded calcium ion indicators. Biophys. J. 116: 1873-1886.
Competing interests
The authors declare no financial and non-financial competing interests.
Citation
Readers should cite both the Bio-protocol article and the original research article where this protocol was used.
Supplementary Data.
References
- 1. Albota M. A., Xu C. and Webb W. W.(1998). Two-Photon Fluorescence Excitation Cross Sections of Biomolecular Probes from 690 to 960 nm. Appl Opt 37(31): 7352-7356. [DOI] [PubMed] [Google Scholar]
- 2. Bradley D. J., Koetser H., and Hutchinson M. H.(1972). Interactions of picosecond laser pulses with organic-molecules.2. 2-photon absorption cross-sections. Proceedings of the Royal Society of London Series A-Mathematical and Physical Sciences 329(1576): 105-119. [Google Scholar]
- 3. Catalano I. M. and Cingolani A.(1982). Multiphoton cross-section measurements with low-power cw laser-induced luminescence. Appl Opt 21(3): 477-480. [DOI] [PubMed] [Google Scholar]
- 4. Denk W., Strickler J. H. and Webb W. W.(1990). Two-photon laser scanning fluorescence microscopy. Science 248(4951): 73-76. [DOI] [PubMed] [Google Scholar]
- 5. de Reguardati S., Pahapill J., Mikhailov A., Stepanenko Y. and Rebane A.(2016). High-accuracy reference standards for two-photon absorption in the 680-1050 nm wavelength range. Opt Express 24(8): 9053-9066. [DOI] [PMC free article] [PubMed] [Google Scholar]
- 6. Helmchen F. and Denk W.(2005). Deep tissue two-photon microscopy. Nat Methods 2(12): 932-940. [DOI] [PubMed] [Google Scholar]
- 7. Hermann J. P. and Ducuing J.(1972). Dispersion of the two-photon cross section in rhodamine dyes. Optics Communications 6: 101-105. [Google Scholar]
- 8. Kaatz P. and Shelton D. P.(1999). Two-photon fluorescence cross-section measurements calibrated with hyper-Rayleigh scattering. J Opt Soc Am B 16(6): 998-1006. [Google Scholar]
- 9. Li S. and She C. Y.(1982). 2-photon absorption cross-section measurements in common laser-dyes at 1.06 mu-m. Optica Acta 29(3): 281-287. [Google Scholar]
- 10. Makarov N. S., Drobizhev M. and Rebane A.(2008). Two-photon absorption standards in the 550-1600 nm excitation wavelength range. Opt Express 16(6): 4029-4047. [DOI] [PubMed] [Google Scholar]
- 11. Makarov N. S., Campo J., Hales J. M. and Perry J. W.(2011). Rapid, broadband two-photon-excited fluorescence spectroscopy and its application to red-emitting secondary reference compounds. Optical Materials Express 1(4): 551-563. [Google Scholar]
- 12. Molina R. S., Qian Y., Wu J., Shen Y., Campbell R. E., Drobizhev M. and Hughes T. E.(2019). Understanding the fluorescence change in red genetically encoded calcium ion indicators. Biophys J 116(10): 1873-1886. [DOI] [PMC free article] [PubMed] [Google Scholar]
- 13. Penzkofer A. and Leupacher W.(1987). s0-s1 2 photon-absorption dynamics of organic-dye solutions. Opt Quant Electron 19(6): 327-349. [Google Scholar]
- 14. Rodriguez L., Echevarria L. and Fernandez A.(2007). I-scan thermal lens experiment in the pulse regime for measuring two-photon absorption coefficient. Opt Commun 277(1): 181-185. [Google Scholar]
- 15. Rodriguez L., Ahn H. Y. and Belfield K. D.(2009). Femtosecond two-photon absorption measurements based on the accumulative photo-thermal effect and the Rayleigh interferometer. Opt Express 17(22): 19617-19628. [DOI] [PubMed] [Google Scholar]
- 16. Rodriguez L. and Chiesa M.(2011). Measurement of the two-photon absorption cross section by means of femtosecond thermal lensing. Appl Opt 50(19): 3240-3245. [DOI] [PubMed] [Google Scholar]
- 17. Rodriguez L. and Chiesa M.(2012). Photothermal phase shift interferometry: an approach for nonlinear absorption measurements. J Opt 14(1): Article Number: 015204. [Google Scholar]
- 18. Rumi M., and Perry J. W.(2010). Two-photon absorption: an overview of measurements and principles. Adv Opt Photonics 2(4): 451-518. [Google Scholar]
- 19. Sperber P. and Penzkofer A.(1986). S0-S1 Two photon absorption dynamics of rhodamine dyes . Opt Quant Electron 18: 381-401. [Google Scholar]
- 20. Vsevolodov N. N., Kostikov A. P., Kayushin L. P., and Gorbatenkov V. I.(1973). Two-photon absorption of laser radiation by chlorophyll a and some organic dyes. Biophysics(GB) 18(4): 807-808. [PubMed] [Google Scholar]
- 21. Wakebe T. and Van Keuren E.(1999). The excitation spectra of two-photon induced fluorescence in xanthene dyes.(Part 1-Regular Papers Short Notes& Review Papers). Jpn J Appl Phys 38(6A): 3556-3561. [Google Scholar]
- 22. Weber H. P.(1971). Two-photon-absorption laws for coherent and incoherent radiation. IEEE J Quantum Elect 7(5): 189-195. [Google Scholar]
- 23. Xu C. and Webb W. W.(1996). Measurement of two-photon excitation cross sections of molecular fluorophores with data from 690 to 1050 nm. JOSA B 13(3): 481-491. [Google Scholar]
- 24. Xu C., Zipfel W., Shear J. B., Williams R. M. and Webb W. W.(1996). Multiphoton fluorescence excitation: new spectral windows for biological nonlinear microscopy. PNAS 93(20): 10763-10768. [DOI] [PMC free article] [PubMed] [Google Scholar]
- 25. Xu C., Guild J., Webb W. W. and Denk W.(1995). Determination of absolute two-photon excitation cross sections by in situ second-order autocorrelation . Optics Letters 20(23): 2372-2374. [DOI] [PubMed] [Google Scholar]
- 26. Zhao Y., Araki S., Wu J., Teramoto T., Chang Y.-F., Nakano M., Abdelfattah A. S., Fujiwara M., Ishihara T., Nagai T. and Campbell R. E.(2011). An expanded palette of genetically encoded Ca2+ indicators . Science 333(6051): 1888-1891. [DOI] [PMC free article] [PubMed] [Google Scholar]
- 27. Zipfel W. R., Williams R. M. and Webb W. W.(2003). Nonlinear magic: multiphoton microscopy in the biosciences. Nat Biotechnol 21(11): 1369-1377. [DOI] [PubMed] [Google Scholar]
Associated Data
This section collects any data citations, data availability statements, or supplementary materials included in this article.


