Abstract
Neuromyelitis optica (NMO) is a severe inflammatory autoimmune CNS disorder triggered by binding of an IgG autoantibody to the aquaporin 4 (AQP4) water channel on astrocytes. Activation of cytolytic complement has been implicated as the major effector of tissue destruction that secondarily involves myelin. We investigated early precytolytic events in the evolving pathophysiology of NMO in mice by continuously infusing IgG (NMO patient serum–derived or AQP4-specific mouse monoclonal), without exogenous complement, into the spinal subarachnoid space. Motor impairment and sublytic NMO-compatible immunopathology were IgG dose dependent, AQP4 dependent, and, unexpectedly, microglia dependent. In vivo spinal cord imaging revealed a striking physical interaction between microglia and astrocytes that required signaling from astrocytes by the C3a fragment of their upregulated complement C3 protein. Astrocytes remained viable but lost AQP4. Previously unappreciated crosstalk between astrocytes and microglia involving early-activated CNS-intrinsic complement components and microglial C3a receptor signaling appears to be a critical driver of the precytolytic phase in the evolving NMO lesion, including initial motor impairment. Our results indicate that microglia merit consideration as a potential target for NMO therapeutic intervention.
Keywords: Autoimmunity, Neuroscience
Keywords: Autoimmune diseases, Macrophages, Neurological disorders
Introduction
Neuromyelitis optica (NMO) is an inflammatory autoimmune disorder of the central nervous system (CNS) with secondary myelin loss. It disproportionately affects women and non-White populations, typically presents as optic neuritis or longitudinally extensive transverse myelitis, and was long considered a severe variant of multiple sclerosis (1). The primary pathogenic effector is an aquaporin 4 (AQP4) water channel–specific immunoglobulin G (IgG) (2–4). AQP4 is concentrated in the CNS at astrocytic end-feet, which embrace capillaries, glutamatergic synapses, nodes of Ranvier, ventricular walls, and pial-glial interfaces (5–8). Cellular and molecular mechanisms that precede the cytolytic astrocyte-centered lesion of NMO are largely unknown.
Binding of IgG to astrocytic AQP4 stimulates synthesis and secretion of complement components, cytokines, and chemokines (9, 10). An immunohistopathological hallmark of advanced NMO lesions is AQP4 loss and massive deposition of IgG and IgM and the cytolytic products of terminal complement activation in AQP4-rich CNS regions (4, 11). Studies to date have highlighted complement-mediated cell lysis as the major pathogenic effector of NMO (12–18). However, the histopathology of sublytic lesions in NMO patients shows prominent microglial activation (19). As sentinels of the CNS, microglia would be the anticipated first responders to signals emanating from astrocytes following their initial activation by AQP4-IgG binding. It is important to understand the role microglia play in the pathogenesis of NMO. To address this question, we developed an informative murine model of NMO by infusing AQP4-specific IgG (AQP4-IgG) continuously into the spinal subarachnoid space without exogenous complement. Unexpectedly, ensuing motor impairment and immunohistopathology compatible with sublytic NMO required microglia and signaling by an early complement cleavage product, C3a. Astrocytes were activated but remained viable. Critical astrocyte-microglia crosstalk in the precytolytic phase of the evolving NMO lesion is a potential target for therapeutic intervention.
Results
A murine model of NMO with evolving motor impairment.
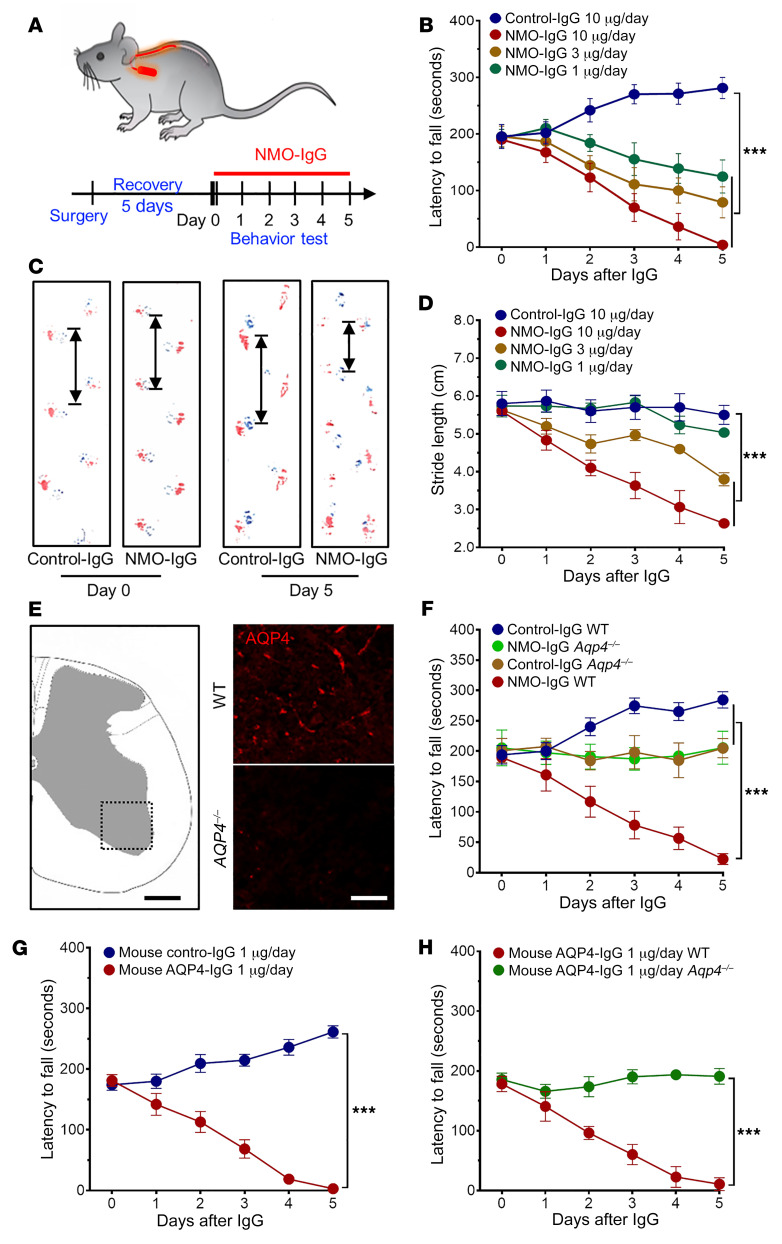
To investigate the cellular and molecular mechanisms underlying NMO pathology, we developed a murine model using IgG isolated from pooled NMO patients’ serum. Control-IgG was from pooled healthy donors’ serum. An osmotic minipump delivery system loaded with either NMO-IgG or control-IgG was placed subcutaneously for continuous 5 to 7 days’ infusion into the spinal subarachnoid space via intrathecal catheter (Figure 1A). Progressive motor deficits and hind limb paralysis developed in NMO-IgG–recipient mice, but not in control-IgG recipients. By rotarod analysis, NMO-IgG induced dose-dependent motor impairment (Figure 1B). Average latencies to fall at day 5 (with infusion of 10, 3, or 1 μg/day IgG), were shortened to 4, 93, and 131 seconds, respectively (average infusion value before NMO-IgG was 190 seconds). In contrast, mice receiving control-IgG did not display motor deficits; their rotarod performance gradually improved when compared with baseline, presumably due to motor learning (Figure 1B). Gait analysis using ink tracking (20) consistently revealed a progressive reduction of stride length in mice receiving NMO-IgG for 5 days (10, 3, or 1 μg/day), from an average of 5.7 cm to 2.6 cm, 3.8 cm, and 5.0 cm, respectively. Stride length did not change significantly in control-IgG recipients (Figure 1, C and D). To examine the concentration of AQP4-IgG achieved in the cerebrospinal fluid (CSF) on day 5 of lumbar subarachnoid infusion (10 μg NMO-IgG/day), we performed a flow cytometric cell-based assay using Aqp4-transfected HEK293 cells (21). We found that the titers exceeded 1:500 in 5 out of 5 NMO-IgG–recipient mouse CSF samples, while CSF titers typical of attack-phase NMO patients range from 1:4 to 1:2048 (22). To determine whether or not the observed motor dysfunction was reversible, we removed the pump after 5 days of NMO-IgG infusion and continued daily rotarod testing. Latency to fall improved over the course of 2 weeks, but motor impairment remained at that point by comparison with control-IgG recipients (Supplemental Figure 1; supplemental material available online with this article; https://doi.org/10.1172/JCI134816DS1).
Figure 1. NMO-IgG intrathecal infusion induces motor impairment.
(A) Timeline for surgery, intrathecal infusions, and motor function testing. (B) Rotarod tests show dose-dependent motor impairment (measured as fall latency) with infusion of NMO-IgG (n = 5 for each group), but not control-IgG (n = 4). (C) Gait illustrated by representative paw print images before and after NMO-IgG or control-IgG infusion. (D) Stride length of NMO-IgG recipients (n = 5 for each group) is shorter than that of control-IgG recipients (n = 4), indicating significant gait impairment. (E) Immunofluorescence staining confirms AQP4 protein expression in the spinal cord of representative WT mouse (top right) and its absence in AQP4null mouse (bottom right). n = 5 mice (4 sections/mouse). Scale bars: 200 μm (left) and 20 μm (right). (F) Rotarod analysis shows NMO-IgG infusion fails to induce motor impairment in AQP4null mice (n = 5 in NMO-IgG group; n = 4 in control-IgG group). Lack of performance improvement in both AQP4null groups concurs with reported AQP4 involvement in learning (24). (G) In WT mice, infusion of AQP4-specific monoclonal mouse IgG induced the same motor impairment phenotype as NMO-IgG (n = 5 in AQP4-IgG group; n = 4 in control-IgG group). (H) In AQP4null mice, AQP4-specific monoclonal mouse IgG did not impair motor function (n = 5 for each group). Data presented as the mean ± SEM. ***P < 0.001 by 2-way ANOVA (B, D, and F–H).
AQP4-IgG is the diagnostically defining autoantibody marker of NMO (2, 3), and is unquestionably pathogenic in vitro (6) and in vivo (20, 23). Because we used IgG prepared from polyclonal human sera, we next compared the motor performance of AQP4-knockout (Aqp4–/–) and WT mice following NMO-IgG infusion. Spinal cord AQP4 deficiency was verified immunohistochemically (Figure 1E). Rotarod performances were equivalent in Aqp4–/– mice receiving NMO-IgG or control-IgG; by contrast, WT mice receiving NMO-IgG had severely impaired motor function (Figure 1F). Motor performance of the Aqp4–/– groups did not improve from baseline in 5 days of testing, supporting suggestions that AQP4 is involved in learning (24). We showed further that an AQP4 extracellular domain–specific mouse monoclonal IgG (1 μg/day) induced similar motor impairment in WT mice (Figure 1G), but not in AQP4null mice (Figure 1H). Together, these results demonstrate that the interaction of IgG in vivo with an AQP4 epitope exposed on the astrocyte plasma membrane initiates evolving motor dysfunction consistent with NMO. Because 10 μg/day of human NMO-IgG and 1 μg/day of mouse monoclonal AQP4-IgG induced significant motor impairment, we used those respective concentrations for all subsequent experiments.
NMO-IgG induces AQP4 loss and activates astrocytes.
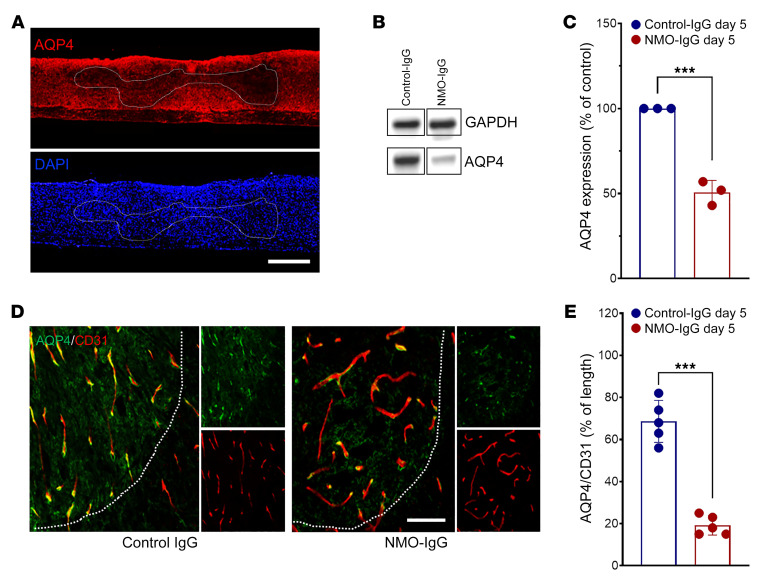
A hallmark of early NMO lesions is loss of astrocytic AQP4 protein (19). Spinal cords from mice infused intrathecally for 5 days with NMO-IgG exhibited significantly reduced AQP4 immunoreactivity in both longitudinal and transverse sections, particularly in regions surrounding the cannula tip (Figure 2A). Western blot of spinal cord tissue homogenates confirmed the lower AQP4 content of NMO-IgG recipients than control-IgG recipients (Figure 2, B and C). In cord tissue of control-IgG recipients, AQP4 colocalized with the vasculature marker CD31, consistent with AQP4 expression in astrocytic end-feet (Figure 2D). The spinal cord vasculature of NMO-IgG–recipient mice was intact despite AQP4 loss (Figure 2E). The area of CD31+ vasculature covered by AQP4+ end-feet was reduced from 68% to 19% (Figure 2E).
Figure 2. NMO-IgG induces AQP4 loss in spinal cord.
(A) Representative staining images show longitudinal sections: AQP4 (top) and DAPI (bottom) in NMO-IgG–recipient mice after 5 days of IgG infusion. n = 5 mice (4 sections/mouse). Scale bar: 1 mm. (B) Representative Western blot images of AQP4 expression in corresponding spinal cord lysates. n = 3 mice. (C) Bar graph shows comparative Western blot quantification of AQP4 protein level (n = 3 mice). (D) L4 cross sections: astrocytic AQP4 (green) and endothelial CD31 (red) after control-IgG or NMO-IgG. n = 5 mice (4 sections/mouse). Scale bar: 20 μm. (E) Bar graph depicts relative length of parenchymal blood vessel (CD31+) covered by AQP4 (L4 level). n = 5 mice (4 sections/mouse). Data presented as the mean ± SEM. ***P < 0.001 by 2-tailed Student’s t test (C and E).
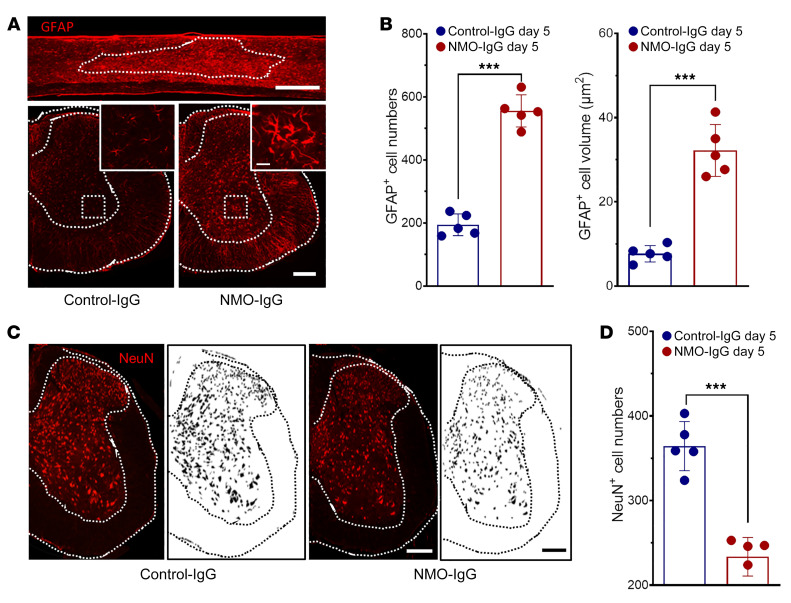
Reduced AQP4 immunoreactivity did not reflect loss of astrocytes; in fact, expression of the astrocyte cytoplasmic marker glial fibrillary acidic protein (GFAP) was substantially increased in dorsal and ventral horns after 5 days of NMO-IgG infusion (Figure 3A). The number of GFAP+ cell bodies increased from 188 ± 35 to 536 ± 72 in L4 spinal cord sections (Figure 3B). Additionally, the soma volume of astrocytes in cord tissue of NMO-IgG recipients was greater, and their processes were thicker than in astrocytes of control-IgG recipients. The average area occupied by GFAP+ cells increased from 7.38 ± 0.76 μm2 to 32.33 ± 2.15 μm2 (Figure 3B). These results are consistent with sublytic histopathological observations in NMO patients (19) and with neuropathology induced by CNS application of NMO-IgG in rodents, without complement (23, 25). However, when NMO-IgG is coapplied with extrinsic complement to rodent CNS tissues or cells, astrocytes are rapidly lysed (18, 20). These results confirm that our murine model of NMO recapitulates the precytolytic activation of spinal astrocytes and the AQP4 downregulation that typify early NMO lesions.
Figure 3. NMO-IgG induces astrocyte activation and neuronal injury.
(A) GFAP immunoreactivity after NMO-IgG (top, longitudinal section; bottom right, L4 cross section) or control-IgG (bottom left, L4 cross section); insets are higher magnifications of areas boxed in ventral horns. n = 5 mice (4 sections/mouse). Scale bars: 1 mm (top), 200 μm (bottom), and 20 μm (insets). (B) Numbers of astrocytes (GFAP+) and astrocyte cell body volume after 5 days of infusion with control-IgG or NMO-IgG. n = 5 mice (4 sections/mouse). (C) NeuN staining and mask figures of NeuN+ cell shapes at L4 cross section after NMO-IgG or control-IgG infusion. n = 5 mice (4 sections/mouse). Scale bars: 200 μm. (D) NeuN+ cell counts at L4 spinal cord after 5 days of NMO-IgG or control-IgG infusion. n = 5 mice (4 sections/mouse). Data presented as the mean ± SEM. ***P < 0.001 by 2-tailed Student’s t test (B and D).
Additionally, despite integrity of DAPI staining in both dorsal and ventral horns of NMO-IgG–recipient mice, by comparison with control-IgG recipients, there was significant loss of NeuN immunoreactivity, a neuronal nuclear marker (Figure 3, C and D). Interestingly, dual immunohistochemical staining for NF200 and myelin basic protein (MBP) revealed that axonal neurofilament staining was preserved but, by comparison with control-IgG recipients, one-third of axons exhibited reduction in surrounding MBP immunoreactivity (Supplemental Figure 2, A and B). Of further note, lack of immunoreactivity for the terminal membrane attack complex of complement (C5b-9) in spinal cord tissue of NMO-IgG–infused mice exhibiting motor impairment (in contrast to mice subjected to mechanical spinal cord injury; Supplemental Figure 2C) excludes complement-dependent cytotoxicity in this precytolytic stage of NMO. Consistently, using caspase-3 staining, we also did not observe neuronal apoptosis in either control or NMO-IgG–infused mice (Supplemental Figure 2D).
Microglia are activated following subarachnoid NMO-IgG infusion.
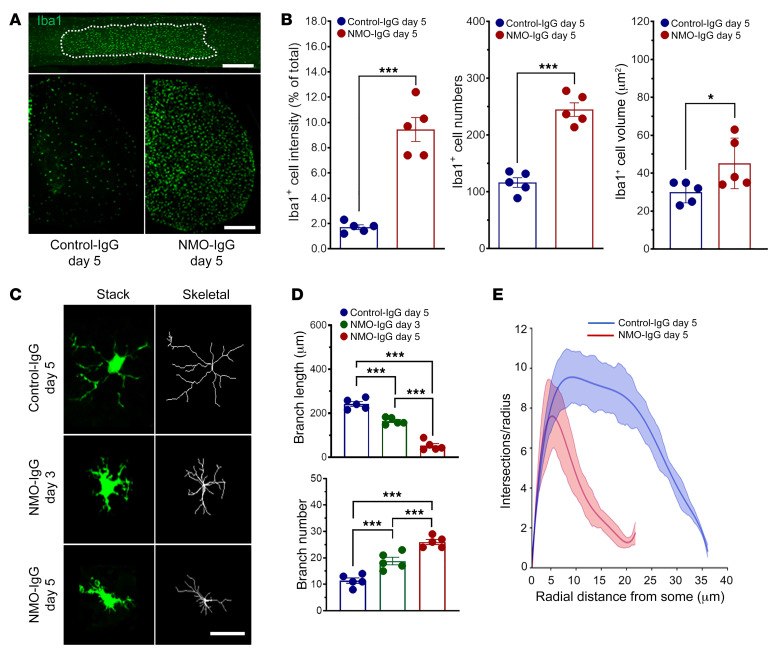
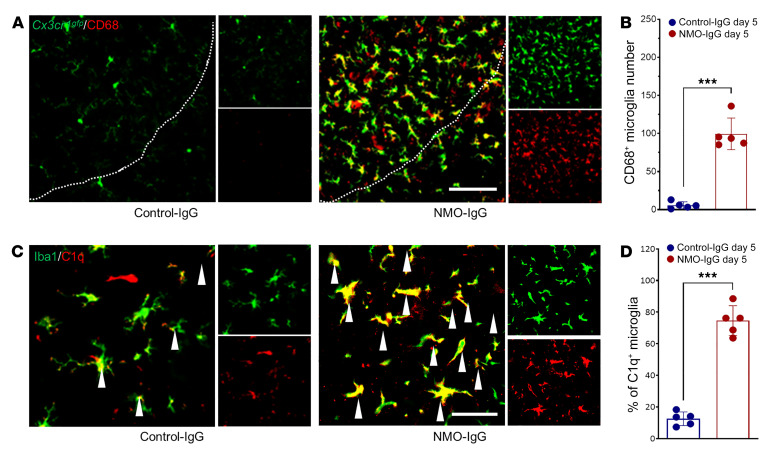
Activation of microglia, the CNS-resident myeloid cells, is seen in posttraumatic, neurodegenerative, and immune-mediated neurological disorders (e.g., neuropathic pain, amyotrophic lateral sclerosis, and multiple sclerosis; refs. 26–28). Activation of spinal and cerebral microglia is generally more pronounced in NMO (7, 19) than in multiple sclerosis (8). To investigate microglial activation in our murine NMO model, we immunostained the microglial marker, Iba1, and revealed robust microglial activation (Figure 4A). By comparison with L4 spinal cord sections of control-IgG recipients, the intensity of Iba1 immunoreactivity, number of Iba1+ microglia, and their volume were all significantly increased in NMO-IgG–recipient mice (Figure 4, A and B). In addition, microglia in NMO-IgG recipients underwent a striking time-dependent morphologic change from a “resting” ramified phenotype to an “activated” bushy phenotype (Figure 4, C and D). Sholl analysis demonstrated a reduction in microglial process complexity after NMO-IgG infusion (Figure 4E). CD68 lysosomal immunoreactivity (largely microglial and enhanced with activation) was increased in cord tissue of NMO-IgG recipients (Figure 5, A and B). C1q immunoreactivity, another microglial activation marker, also was increased after NMO-IgG infusion, but not after control-IgG (Figure 5, C and D). This finding is of particular pertinence to NMO pathogenesis because microglia are the principal CNS source of C1q.
Figure 4. NMO-IgG induces microglial activation.
(A) Iba1+ microglia in representative spinal cord images, longitudinal section (top, after 5 days of NMO-IgG), and L4 cross section (bottom, control-IgG and NMO-IgG). n = 5 mice (4 sections/mouse). Scale bars: 1 mm (top) and 200 μm (bottom). (B) Bar graphs compare, after 5 days of control-IgG or NMO-IgG infusion, intensity of Iba1+ staining: Iba+ cell numbers and Iba+ soma volumes. n = 5 mice (4 sections/mouse). (C) Representative images of microglia morphology (confocal, green; transformed skeletal, gray) in a control-IgG recipient (day 5), and 2 NMO-IgG recipients (days 3 and 5). n = 5 mice (4 sections/mouse). Scale bar: 20 μm. (D) Quantification of microglial process length (top) and branch number (bottom) on day 5 of control-IgG or on day 3 or day 5 of NMO-IgG infusion. n = 5 mice (4 sections/mouse). (E) Sholl analysis of microglia on day 5 of control-IgG or NMO-IgG infusion. n = 5 mice in each group (10 microglia/section, 4 sections/mouse). Data presented as the mean ± SEM. ***P < 0.001; *P < 0.05 by 2-tailed Student’s t test (B) or 1-way ANOVA (D).
Figure 5. NMO-IgG induces microglial phenotypic changes.
(A) CD68 staining in Cx3cr1gfp/+ mice at L4 spinal cord level on day 5 of control-IgG (top) or NMO-IgG (bottom) infusion. n = 5 mice (4 sections/mouse). Scale bar: 200 μm. (B) Bar graph quantifies Cd68+ microglia cell number in both IgG recipient groups. n = 5 mice (4 sections/mouse). (C) Dual staining reveals complement C1q immunoreactivity (red) and Iba1 immunoreactivity (green) in L4 spinal cord cells on day 5 of IgG infusion. The arrowheads indicate colocalization of C1q with Iba1 staining. n = 5 mice (4 sections/mouse). Scale bar: 20 μm. (D) Bar graph quantifies C1q+ microglia percentage in both IgG recipient groups. n = 5 mice (4 sections/mouse). Data presented as the mean ± SEM. ***P < 0.001 by 2-tailed Student’s t test (B and D).
Of note, NMO-IgG infusion into AQP4null mice did not increase Iba1+ cell numbers or CD68 immunoreactivity (Supplemental Figure 3). Monoclonal AQP4-IgG infusion in WT mice also reduced AQP4 immunoreactivity (Supplemental Figure 4) and caused activation of astrocytes (Supplemental Figure 5A) and microglia (Supplemental Figure 5B), as well as loss of NeuN immunoreactivity (Supplemental Figure 5C). Together, these results indicate astrocytic changes induced by primary interaction of NMO-IgG with AQP4, as well as profound microglial activation.
Microglial ablation prevents NMO-IgG–induced motor dysfunction.
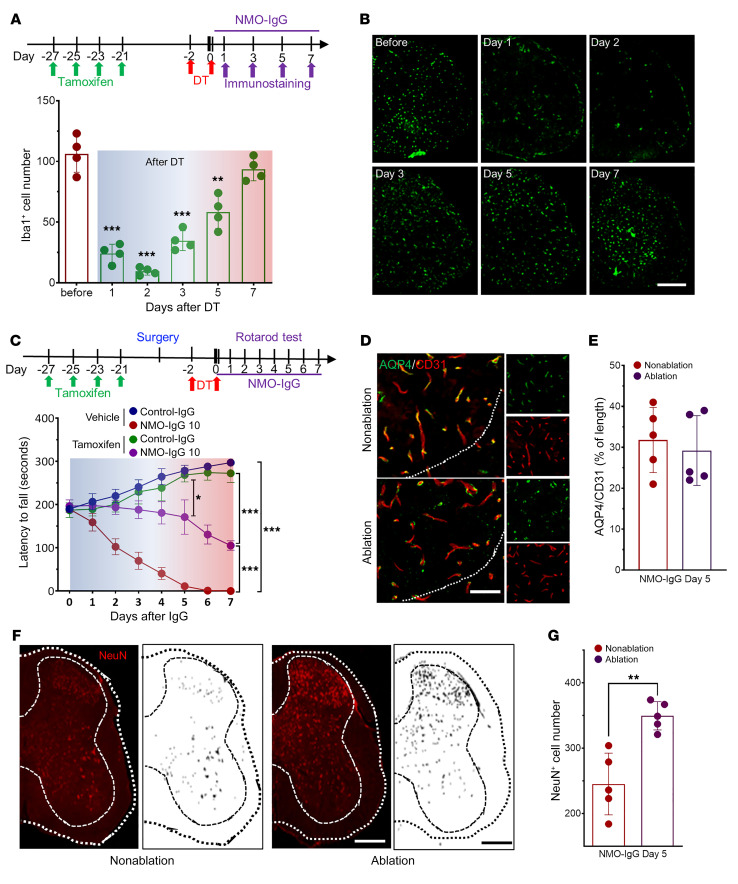
Microglial activation following NMO-IgG infusion indicates a potential role for microglia in NMO pathogenesis. To test this idea, we directly investigated the requirement for microglia in the motor deficits of NMO by a selective cell ablation approach. Tamoxifen administration (150 mg/kg, i.p.) induces diphtheria toxin receptor (DTR) expression in microglia of Cx3cr1CreER/+:R26iDTR/+ mice. One to 3 days after subsequent diphtheria toxin injection (DT, 50 μg/kg, i.p.), most spinal microglia were depleted; by days 5 to 7, microglia were replenished (Figure 6, A and B). This protocol also efficiently depleted microglia in L4 spinal cords of NMO-IgG–recipient mice on day 1 after DT treatment (Supplemental Figure 6). Interestingly, however, when NMO-IgG infusion coincided with the last DT injection, microglia replenishment occurred by day 3, and by day 7 microglia were more abundant than at baseline or in control-IgG recipients (Supplemental Figure 6), suggesting rapid inflammation-promoted replenishment.
Figure 6. Microglial ablation prevents motor impairment by NMO-IgG.
(A) Top: Timeline of i.p. tamoxifen and diphtheria toxin (DT) administration and tissue harvesting for immunostaining. Bottom: Daily enumeration of microglial numbers (Iba1+) in the week following DT administration. n = 4 mice in each group (4 sections/mouse). (B) Representative serial images of Iba+ cells in cross sections of L4 cord. n = 4 mice in each group (4 sections/mouse). Scale bar: 200 μm. (C) Top: Timeline for intrathecal catheter placement, IgG infusion, and motor function evaluation in relation to microglial ablation (sequential tamoxifen and DT). Bottom: Rotarod testing documented that mice were spared motor impairment when microglia were reduced maximally at the time of NMO-IgG infusion. n = 4 mice in each group. (D) Representative images show astrocytic AQP4 and endothelial CD31 after NMO-IgG infusion with and without microglia ablation. n = 5 mice (4 sections/mouse). Scale bar: 20 μm. (E) Bar graph shows insignificant differences in relative length of parenchymal blood vessels (CD31+) covered by AQP4 (L4 level). n = 5 mice (4 sections/mouse). (F) NeuN staining and mask figures of NeuN+ cells at L4 level after NMO-IgG infusion, with or without microglia ablation. n = 5 mice (4 sections/mouse). Scale bar: 200 μm. (G) NeuN+ cell numbers at L4 spinal cord level shows sparing of neuronal marker immunoreactivity on day 5 of NMO-IgG infusion in mice undergoing microglial ablation. n = 5 mice (4 sections/mouse). Data presented as the mean ± SEM. ***P < 0.001; **P < 0.01; *P < 0.05 by 1-way ANOVA (A), 2-way ANOVA (C), or 2-tailed Student’s t test (day 5 in C, E, and G).
To test the effects of microglial depletion and replenishment on NMO-IgG–induced motor dysfunction, we injected DT before infusing NMO-IgG. It is remarkable that NMO-IgG did not induce significant motor impairment during the period of maximal microglial depletion (Figure 6C). However, around day 5 after DT, severe motor impairment was apparent, coinciding with microglial replenishment. Regardless of microglial presence, infusion of NMO-IgG induced loss of AQP4 and of vascular coverage by AQP4 (Figure 6, D and E). In addition, loss of spinal cord NeuN immunoreactivity after 7 days of NMO-IgG infusion (Figure 6, F and G) was less in mice subjected to microglia ablation. These observations implicate microglia as effectors of the neuronal dysfunction responsible for the initial behavioral impairment that follows IgG binding to astrocytic AQP4.
NMO-IgG induces astrocyte-microglia interaction.
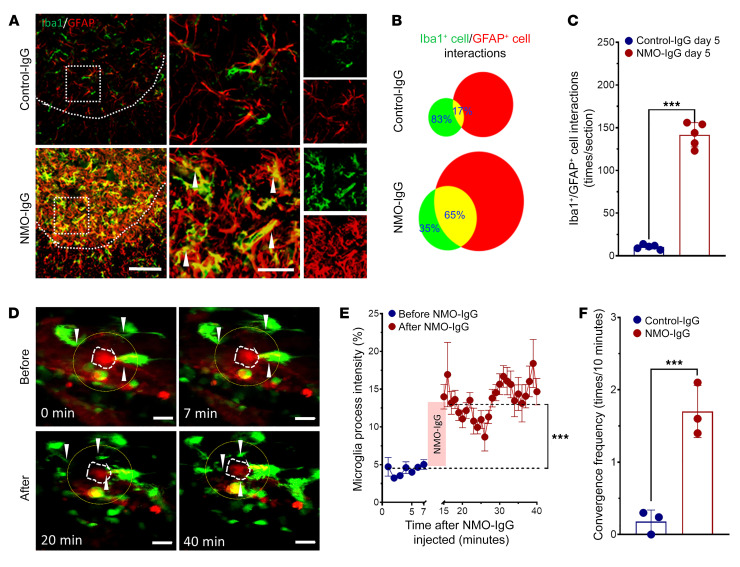
Our observation that microglia make a critical contribution to the evolution of motor impairment in NMO raises the question of the underlying cellular and molecular mechanisms. Confocal images (Figure 7, A and B) revealed an intriguing coalescence of astrocytes and microglia following NMO-IgG infusion. At baseline and during control-IgG infusion, overlap of GFAP+ astrocytes and Iba1+ microglia was infrequent (~17%) (Figure 7B). However, spatial overlap was abundant (~65%) during NMO-IgG exposure; overlapping events increased more than 10-fold (Figure 7C), despite only 2- to 3-fold increases in numbers of each cell type (Figure 3B, Figure 4B, and Figure 7B). To confirm merging of microglia and astrocytes, we employed 2 additional methods to label microglia and astrocytes in fixed spinal cord slices: (a) Cx3cr1gfp/+ mice (microglia genetically labeled with GFP) revealed a consistently increased area of overlap with astrocytes stained for GFAP or Aldh1L1 (Supplemental Figure 7, A and B), (b) dual staining for CD11b (microglial marker) and GFAP also revealed increased merging of astrocytes and microglia in NMO-IgG–infused mice (Supplemental Figure 7C), and (c) monoclonal AQP4-IgG similarly induced interaction of Iba1+ and GFAP+ cells in WT mice (Supplemental Figure 7D). All these data support our conclusion that astrocyte-microglia interaction increases during NMO-IgG infusion and that is not simply attributable to the increased numbers of microglia and astrocytes.
Figure 7. NMO-IgG induces astrocyte-microglia interaction.
(A) Interaction between Iba1+ microglia (green) and GFAP+ astrocytes (red) is inferred from enlargement and overlapping (shown by arrow heads) of those cells and their processes in dual immunostained L4 spinal cord of NMO-IgG–recipient mice compared with control-IgG recipients. n = 5 mice (4 sections/mouse). Scale bars: 200 μm (left) and 20 μm (right). (B) Venn diagram and (C) bar graph quantifies (by ImageJ software) the increase in overlap from 17% (control-IgG recipients) to 65% (NMO-IgG recipients). n = 5 mice (4 sections/mouse). (D) Representative 2-photon images captured in vivo show, at baseline time (top, before NMO-IgG infusion), few processes extending from microglia (green, Cx3cr1gfp/+; astrocytes are labeled red by SR101). After NMO-IgG infusion (bottom), microglial processes converged toward an astrocyte. Arrowheads indicate the converging microglial processes. n = 3 mice. Scale bars: 20 μm. (E) Graph shows quantified Cx3cr1gfp/+ intensity of microglial processes in the area surrounding the SR101-labeled astrocyte (yellow circles in D). n = 3 mice. (F) Bar graph shows the microglial convergence event frequency (convergence events per 10 minutes) after NMO-IgG or control-IgG infusion (for 30 minutes). n = 3 mice. Data presented as the mean ± SEM. ***P < 0.001 by 2-tailed Student’s t test (C, E, and F).
We further investigated this unprecedented astrocyte-microglia interaction in vivo in spinal cord of awake Cx3xr1gfp/+ mice by 2-photon imaging. Microglia were constitutively labeled with GFP and astrocytes were labeled with the dye SR101 (injected i.p.). In response to subarachnoid infusion of NMO-IgG at the L4 level, there was significant convergence of microglial processes toward astrocytes (Figure 7, D and E). The convergence toward astrocytes was reminiscent of the microglial process convergence toward neurons demonstrated by this laboratory under conditions of seizures and stroke (29, 30). The number of microglial process convergence events observed 12 hours after injecting NMO-IgG was significantly increased but fewer convergence events occurred after the same period of control-IgG infusion (Figure 7F). No similar real-time dynamic astrocyte-microglia interaction has been documented in any previous model of NMO or in any other disease context to our knowledge. Our demonstration that AQP4-IgG triggers direct interaction of microglia with astrocytes has pathophysiological implications for evolution of the NMO lesion.
Signaling by the cleavage product of an early complement component is a critical mediator of astrocyte-microglia interaction and NMO lesion progression.
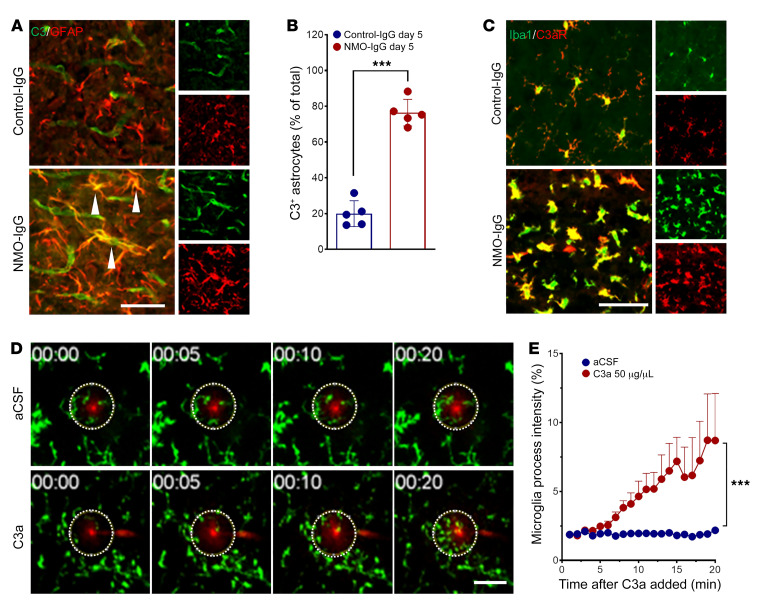
Histopathologic findings in NMO patients and in animal models, and in vitro studies of NMO-IgG–AQP4 interaction, have demonstrated a pivotal role for terminal, membrane-lytic complement components in established NMO lesions. Assigned roles include assembly of the membrane attack complex as effector of astrocyte lysis and tissue destruction (4, 6, 8, 9, 15) and cleaved complement C3 and C5 components (anaphylatoxins C3a and C5a) as chemoattractants for circulating granulocytes and promoters of CNS vascular permeability (14). As an initial response to the binding of NMO-IgG to AQP4 in vitro, astrocytes transcribe and secrete complement component C3; C3 transcripts are upregulated 33-fold (9). We affirmed that observation in vivo by documenting robust enhancement of cytoplasmic C3 immunoreactivity in spinal cord astrocytes of mice infused intrathecally with NMO-IgG (Figure 8, A and B). In contrast, spinal cord C3 immunoreactivity in mice infused with control-IgG was mainly restricted to the lumen of blood vessels, despite PBS washout before tissue fixation (normal plasma concentration is ~8 g/L). The percentage of C3+GFAP+ astrocytes in spinal cord sections of NMO-IgG–recipient mice was approximately 4-fold higher than in control-IgG recipients (Figure 8B). It is noteworthy that C3 was upregulated in astrocytes regardless of the presence of microglia (Supplemental Figure 8).
Figure 8. Complement signaling drives astrocyte-microglia interaction.
(A) Dual staining reveals immunoreactivities for complement C3 (green) and GFAP (red, astrocytes) in L4 spinal cord of representative IgG-recipient mice on day 5 of IgG infusion. C3 is restricted to blood vessel lumen in control-IgG recipient but is expressed robustly in enlarged astrocytes (arrowheads) of NMO-IgG recipient. n = 5 mice (4 sections/mouse). Scale bar: 20 μm. (B) Bar graph quantifies C3+ astrocytes in both IgG recipient groups. n = 5 mice (4 sections/mouse). (C) Complement C3a receptor immunoreactivity (red) is restricted to Iba1+ microglia (green) in spinal cords of both groups of mice, but is greatly upregulated in NMO-IgG recipients (dual immunostaining, day 5 of IgG infusion). n = 5 mice (4 sections/mouse). Scale bar: 20 μm. (D) In ex vivo time-lapse imaging of brain slice from naive Cx3cr1gfp/+ mouse, processes of microglia converge toward pipette tip (red) containing recombinant C3a, by comparison with pipette containing artificial CSF (aCSF). n = 3 mice for each group. Scale bar: 20 μm. (E) Quantified data show the change in microglial process Cx3cr1gfp/+ intensity in the area surrounding the tip (dotted circles in D) in response to C3a. n = 3 mice in each group. Data presented as the mean ± SEM. ***P < 0.001 by 2-tailed Student’s t test (B) or 2-way ANOVA (E).
Microglia in spinal cord sections of NMO-IgG–recipient mice exhibited striking C3a receptor (C3aR) upregulation (Figure 8C). Using our established ex vivo assay for microglial process chemoattraction (31, 32), we demonstrated that pipette application of recombinant C3a induced microglial process chemotaxis within 20 minutes (Figure 8, D and E). Together, these results support the upregulation of complement component synthesis and secretion by astrocytes following the binding of NMO-IgG. It remains to be determined whether, in the context of an intact blood-brain barrier, cleavage of astrocyte-produced C3 occurs extracellularly (requiring progression of the classical complement cascade poised for initiation by AQP4-bound IgG), or whether C3 cleavage is effected within the astrocyte. Binding of the ensuing C3a product with microglial C3aR would augment microglial activation and enhance microglial interaction with astrocytes.
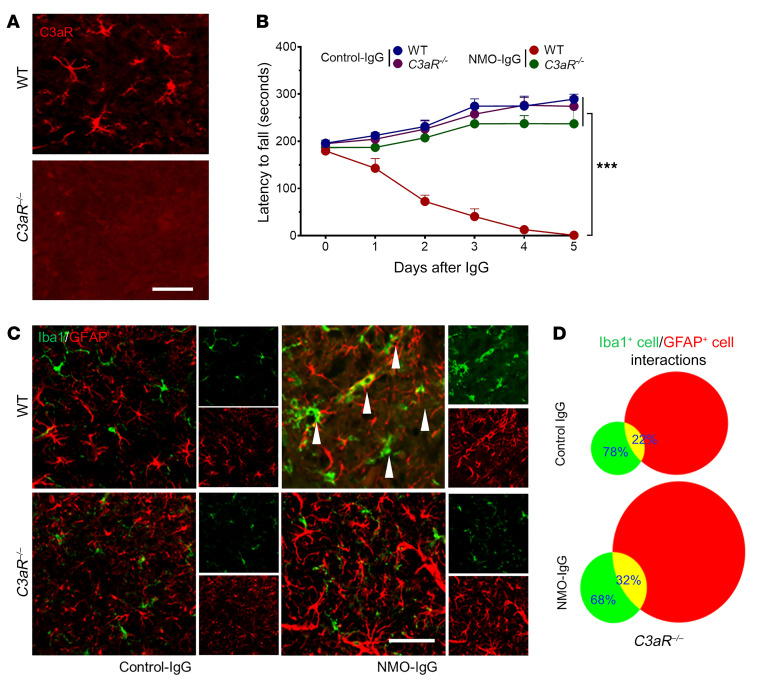
To further investigate the role of complement signaling in the evolving pathology of NMO (preceding astrocyte lysis), we infused NMO-IgG intrathecally into C3aR–/– mice (Figure 9A) or C3–/– mice (Supplemental Figure 9A). No significant motor impairment ensued in C3aR–/– or C3–/– mice (Figure 9B and Supplemental Figure 9B) despite AQP4 loss (Supplemental Figure 10). NMO-IgG–induced astrocyte activation was evident in both C3aR–/– and C3–/– mice, but microglial activation and microglia-astrocyte interactions were largely attenuated (Figure 9, C and D, and Supplemental Figure 9, C and D). Thus, despite astrocyte activation and AQP4 downregulation by NMO-IgG, microglial activation and interaction with astrocytes as well as motor impairment were attenuated in mice lacking C3aR. Together, our results establish a critical role for signaling by CNS-intrinsic early complement components and astrocyte-microglia interaction in the evolution of motor impairment and NMO-consistent CNS immunopathology following initial binding of IgG to astrocytic AQP4.
Figure 9. Complement signaling is critical for NMO-IgG–induced motor impairment and pathology progression.
(A) Spinal cord tissue of C3aRnull mice lacks C3aR immunoreactivity (red) by comparison with WT mice. n = 4 mice (4 sections/mouse). Scale bar: 20 μm. (B) In contrast to WT mice, but similar to control-IgG recipients, intrathecally infused NMO-IgG did not significantly impair rotarod performance of C3aRnull mice. n = 4 mice in each group. (C) Immunostained L4 spinal cord sections showed no significant increase in microglia-astrocyte overlap in C3aRnull mice infused with NMO-IgG, in contrast with WT mice, and similar to control-IgG recipients. Arrowheads indicate microglia (Iba1+) overlap with astrocytes (GFAP+) in WT mice after NMO-IgG infusion. n = 4 mice (4 sections/mouse). Scale bar: 20 μm. (D) Microglia-astrocyte interaction events were quantified by ImageJ on day 5 of IgG infusion. n = 4 mice (4 sections/mouse). Data presented as the mean ± SEM. ***P < 0.001 by 2-way ANOVA (B).
Discussion
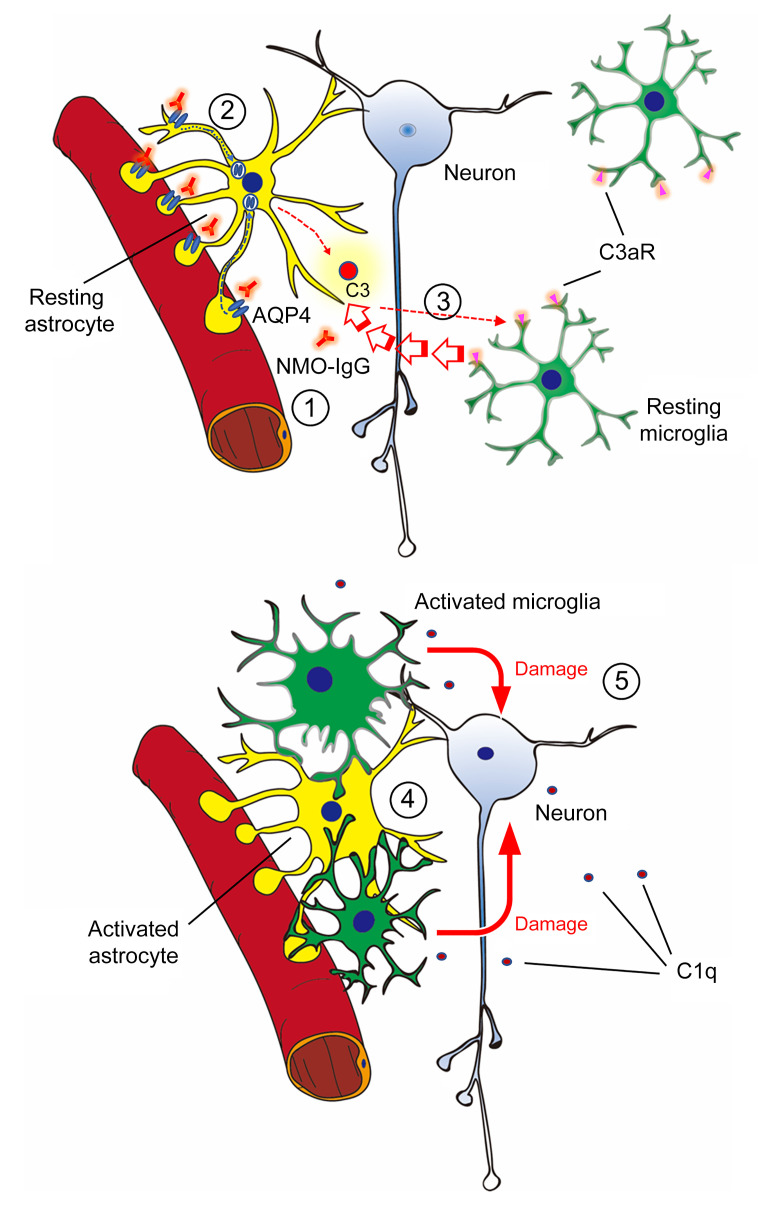
AQP4 water channel–specific IgG targeting CNS astrocytes is recognized to be the primary pathogenic effector of NMO (2–4), but it is unclear what mechanisms link this autoantibody’s binding to the astrocytic plasma membrane and neuronal dysfunction. We therefore implemented a model of NMO in mice by continuously infusing into the lumbar spinal subarachnoid space AQP4-IgG (NMO patient–derived or mouse monoclonal) without exogenous complement. The ensuing motor impairment recapitulated paralytic signs encountered in patients with early-attack-phase autoimmune AQP4 NMO spectrum disorders. Remarkably, when activated by AQP4-IgG, astrocytes engage in unprecedented physical interaction with microglia, but remain viable. By selectively deleting microglia, we demonstrated an unanticipated central role for microglia in NMO pathogenesis that involves early complement component signaling (Figure 10). The apparent microglial dependence for progression of the CNS lesion initiated by AQP4-IgG binding to astrocytes identifies microglia as a potential therapeutic target in NMO.
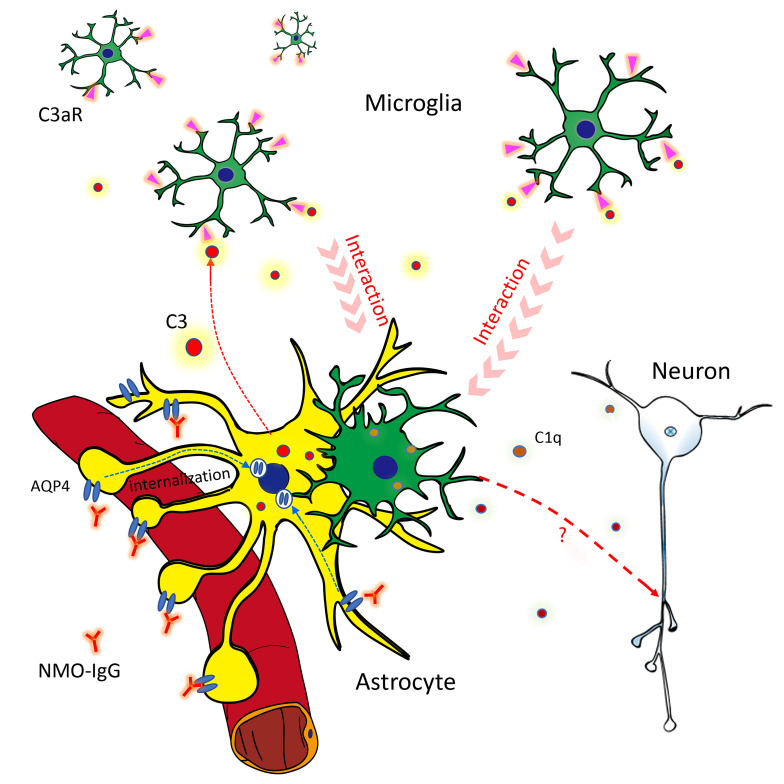
Figure 10. Astrocyte-microglia interaction drives evolving NMO pathology.
Schematic diagram shows the early complement-dependent interaction between microglia and astrocytes that is critical for inducing early NMO pathology. (1) NMO-IgG binds to AQP4 on resting astrocyte end-feet. (2) Binding of IgG activates the astrocyte and induces AQP4 internalization. The activated astrocyte releases complement C3 or C3a. (3) Binding of C3a to the microglial C3a receptor (C3aR) activates microglia and induces process convergence toward astrocytes. (4) Activated microglia upregulate C1q production and interact with astrocytes, and (5) upregulate C1q, which may boost complement cascades leading to neuronal damage.
A murine model of NMO using chronic infusion of NMO patient–derived IgG.
Previously reported mouse models of NMO have required coadministration of exogenous complement, or elimination of complement regulation for AQP4-specific IgG to induce motor dysfunction (20). A recent study involving repeated injection of human IgG into rats by the intrathecal route (polyclonal NMO patient–derived or recombinant AQP4-specific monoclonal) showed that AQP4-IgG itself was sufficient to induce NMO-like pathology with mild, reversible motor impairment without evidence of inflammatory cell infiltration or deposition of the terminal complement membrane attack complex (17, 23). Our continuous infusion of NMO-IgG directly into the lower spinal subarachnoid space for 5 days without exogenous complement produced significant motor impairment. Several lines of evidence support AQP4-specific IgG being the proximal cause of motor impairment in this model: (a) the patient-derived IgG we used was selected for high in vitro reactivity with the extracellular domain of mouse AQP4; (b) this IgG induced no motor dysfunction in AQP4null mice; (c) AQP4 was lost from astrocytes that remained viable, a hallmark of subcytolytic CNS lesions in NMO patients (19); and (d) the motor outcomes and immunopathology induced by an AQP4 extracellular domain–specific monoclonal IgG reproduced the motor dysfunction and subcytolytic pathology induced by patient serum IgG. The earliest discernible CNS lesions in these mice exhibited both AQP4 loss and astrocytic activation (namely, enhanced GFAP and C3 immunoreactivities), reproducing in part the pathological changes observed in subcytolytic lesions of NMO patients (19).
Complement activation products are not detectable in healthy nonperturbed adult CNS parenchyma, but evidence of complement-mediated cytotoxicity is abundant in fully developed cytodestructive NMO lesions (19, 20). Furthermore, AQP4-selective complement-dependent astrocyte cytotoxicity is readily demonstrable experimentally, both in vitro (6) and in vivo when exogenous complement and NMO-IgG are coinjected into the CNS (20). Our in vivo study demonstrates that NMO-IgG induces astrocytic production of complement C3 and microglial production of C1q. We further showed that microglial activation was secondary to C3aR signaling. Of note, previous studies have implicated complement alternative pathway–activated C3-C3aR signaling in demyelination (33) and neurodegeneration (34). In addition, C1q has been shown to induce axon damage in neurodegeneration (35), bind to a “receptor” in mitochondria (36), and induce neuronal stress (37). Thus, following the initial interaction of IgG with astrocytic AQP4, astrocyte-microglia crosstalk leads to mutual activation of 2 CNS-resident effector cells that synergistically drive NMO pathology.
Astrocyte-microglia interaction in NMO.
Astrocytic AQP4 was identified as the principal target of NMO-IgG 15 years ago (3), yet the cellular events leading to neuronal dysfunction after IgG interaction with AQP4 need to be further clarified. By in vivo 2-photon imaging we documented physical interaction between astrocytes and microglia as an early event. Microglial processes converged toward astrocytes in response to NMO-IgG infusion. This did not occur in the AQP4null CNS. This glial convergence phenomenon also followed subarachnoid infusion of an AQP4 extracellular domain–specific monoclonal IgG into AQP4-WT mice. We concluded that microglia are activated by signals emanating from AQP4-IgG–activated astrocytes.
Further investigation revealed that an early complement component (C3) derived from activated astrocytes is a critical mediator of the observed microglia-astrocyte interaction. Activation of terminal complement components, and assembly of the C5b-9 membrane attack complex, is a hallmark of established NMO lesions in patients (4, 8, 11), and is critical for experimental induction of cytodestructive CNS lesions in rodent NMO models (16, 18). The enhanced immunoreactivity of astrocytic cytoplasmic C3 that we demonstrated in mice infused intrathecally with AQP4-IgG is consistent with the upregulated C3 gene transcription reported in cultured rodent astrocytes exposed to NMO-IgG (9). Microglia have receptors for 2 C3 cleavage products, C3a (chemoattractant) and C3b (phagocytosis-enabling opsonin) (38–40). We demonstrated further a striking upregulation of microglial C3aR following intrathecal NMO-IgG infusion, and a profound chemotactic influence of C3a applied by pipette to microglial processes ex vivo. Both observations indicate that C3a, a cleavage product of astrocyte-derived C3, is a critical determinant of microglial process convergence toward astrocytes activated by AQP4-IgG. Failure of NMO-IgG infusion to induce motor impairment or NMO-like pathology in C3aRnull mice, despite upregulated astrocytic C3 synthesis (and presumably secretion), further supports a critical role for C3a in evolving NMO pathology. Classical complement pathway activation is initiated extracellularly by target cell–bound IgG triggering, in the presence of abundant plasma-derived complement components, sequential assembly of proteolytic convertases yielding signaling fragments of C3 and C5. However, with an intact blood-brain barrier, the CNS parenchyma lacks ambient complement components. It is recently recognized that many cell types noncoordinately synthesize and cleave complement components intracellularly, yielding signaling fragments for intracellular receptors (41–44). It is conceivable that activated astrocytes might secrete C3a fragments, thus upregulating C1q synthesis and secretion by microglia, and initiating limited assembly of a procytolytic IgG complement complex on the astrocyte surface. Until all complement components are available in sufficient quantity to effect cytolysis of opsonized astrocytes, extracellularly, released C3a would amplify mutually stimulatory astrocyte-microglia interactions. Further studies are needed to identify other cytokines and chemokines driving microglia-astrocyte interactions in NMO.
The effectors of motor impairment in this model of NMO await identification. We interpret loss of NeuN immunoreactivity, in the face of axonal integrity and lack of apoptotic signaling, to be evidence of neuronal stress (i.e., subcytolytic neuronal pathology; ref. 45). Glutamate excitotoxicity is a plausible mechanism for neuronal and oligodendroglial damage in NMO. The astrocytic glutamate transporter, EAAT2, cointernalizes with AQP4 after IgG cross-linking (10). However, C3null and C3aRnull mice infused with NMO-IgG had no objective motor dysfunction, despite AQP4 loss. Thus glutamate excitotoxicity was an unlikely cause of the neuronal dysfunction observed in the time course of our study. The pertinence of AQP4-specific T cells in NMO pathogenesis, other than as helpers for B cell production of AQP4-IgG, remains the subject of debate. An experimental form of autoimmune encephalomyelitis, with distinctively different histopathology from NMO, is inducible by transferring AQP4 peptide–specific T cells to naive mice (46), as has been shown for 2 other astrocytic antigens, GFAP (47) and S100 (48).
Microglia present an NMO therapeutic target.
In an increasing number of CNS disorders (e.g., stroke, chronic pain, epilepsy, and neurodegenerative diseases), microglia are assigned phagocytic, inflammatory, and antiinflammatory roles (49–52). The informative mouse model of NMO that we describe here reveals an unsuspected role for microglia in the evolution of motor impairment and the neuropathology progression initiated by a targeted IgG attack on astrocytes. Current relapse-sparing treatment options for NMO include intravenous adrenocorticosteroids, immunosuppressants, and agents that reduce circulating immunoglobulin levels, neutralize complement, or block IL-6 or its receptor. Our demonstration that microglial ablation prevents AQP4-IgG–induced motor deficits, while microglial replenishment (in the continuing presence of NMO-IgG) unmasks motor deficits, suggests that targeting microglia may be therapeutically efficacious for ameliorating NMO attacks and preventing relapses.
Targeting of microglia and their bidirectional signals is an attractive therapeutic option because the pertinent molecules are predominantly expressed by activated microglia and not in basal conditions. Several potential therapeutic approaches could be considered for NMO treatment. (a) Minocycline (a second-generation tetracycline antibiotic) selectively inhibits metabolism in activated microglia and has acceptable off-target effects. Clinical trials of minocycline are currently in progress for schizophrenia, autism, anxiety, and bipolar disorders (53, 54). (b) PLX 3397, an oral inhibitor of the receptor for colony-stimulating factor 1 (CSF1), selectively depletes microglia (55). (c) C3aR is an especially attractive target for NMO therapeutics because it is highly expressed in activated microglia. Our present study demonstrated that microglial C3aR is the critical mediator of the astrocyte-microglia interaction essential for motor deficits and evolving NMO-like pathology. Thus, inhibition of microglial C3aR may arrest NMO attacks at a precytolytic stage.
Methods
Animals.
Female mice (6–8 weeks old) were used in accordance with institutional guidelines as approved by the Institutional Animal Care and Use Committee at Mayo Clinic. C57BL/6J (Charles River) and Cx3cr1gfp/+ mice were used as WT animals. Aqp4–/– mice were created and bred in-house (Lennon laboratory in the Mayo Clinic). C3–/– mice (B6;129S4-C3tm1Crr/J) and C3aR–/– mice (C.129S4-C3ar1tm1Cge/J) were purchased from the Jackson Laboratory. Cx3xr1CreER/CreER mice, provided by Wen-Biao Gan (New York University, New York City, New York, USA), were crossed with R26iDTR/iDTR mice [CBy.B6-Gt(ROSA)26Sortm1(HBEGF)Awai/J), Jackson Laboratory] to obtain Cx3cr1CreER/+:R26iDTR/+ mice. Mice were assigned to experimental groups randomly within a litter. Experimenters were blind to drug treatments.
IgG selection and purification.
NMO patient sera were obtained from the Mayo Clinic Neuroimmunology Laboratory with approval of the Institutional Review Board, Biospecimens Subcommittee. Sera were deidentified and complement proteins were heat inactivated. For IgG isolation (by Protein G–agarose adsorption; ref. 10), we pooled 39 sera that, by flow cytometry assay (21) individually contained IgG that bound at 1:100,000 or greater dilution to live HEK293 cells expressing recombinant human AQP4-M1, and at 1:32,000 or greater dilution to cells expressing recombinant mouse AQP4-M23. Control-IgG, similarly prepared from a pool of 100 deidentified healthy donors’ sera, did not bind to live HEK293 cells transfected with mouse or human AQP4.
The hybridoma producing monoclonal mouse IgG specific for the mouse AQP4 extracellular domain (E5415B) was provided by Yoichiro Abe (Institute of Immunology Co., LTD., University of Tokyo, Tokyo, Japan). All IgG preparations were dialyzed against artificial CSF and sterilized by 0.22-μm filtration. Mouse normal IgG was purchased from Santa Cruz Biotechnology (SC-2025).
IgG delivery surgery.
A 3.5-cm polyurethane catheter (Alzet) was inserted at the condylar canal to access the subarachnoid space at the cisterna magna and extended to the spinal lumbar level. Five days later an osmotic minipump delivery system, containing human or mouse IgG, was placed subcutaneously over the right shoulder. IgG was delivered continuously for 5 to 7 days (1.0–10 μg/day; Figure 1A). Osmotic minipump delivery rate, calibrated as (Volume [uploaded] – Volume [remaining])/Infusion days, was approximately 10 μL/day (i.e., 50 μL/5 days).
Microglial ablation.
Tamoxifen (MilliporeSigma) was injected i.p. into mice that were at least 4 weeks of age (150 mg/kg, 20 mg/mL in corn oil; 4 times at 48-hour intervals). Two doses of DT (MilliporeSigma, catalog D0564, 50 mg/kg, 2.5 mg/mL in PBS) were given 3 and 5 days after the last tamoxifen dose to ablate CX3CR1+ cells. Control mice received DT alone (without tamoxifen).
Behavioral testing.
Rotarod performance was tested using a 5-lane apparatus (Med Associates Inc), starting at 4 rounds per minute, and uniformly accelerating over a 5-minute period to 40 rounds per minute. Each mouse was tested 3 times at 15-minute intervals. For gait analysis, forelimbs and hind limbs were dipped in different-colored inks and mice walked freely across a narrow strip of paper. Hind limb stride length was calculated as the mean of 5 sequential steps.
Fluorescent immunostaining.
Mice were deeply anesthetized with isoflurane (5% in O2) and perfused by heart with 20 mL PBS followed by 20 mL of cold 4% paraformaldehyde (PFA) in PBS. The spinal cord was removed and postfixed with 4% PFA (6 hours, 4°C). After holding in 30% sucrose in PBS overnight, the tissue was cryosectioned (15 μm, Leica) onto gelatin-coated glass slides, blocked 60 minutes with 10% goat serum in TBS/0.3% Triton X-100 (MilliporeSigma), and then held 26 hours at 4°C with a primary IgG: rabbit anti-Iba1 (1:500, Abcam, 178847), rabbit anti-CD68 (1:500, Abcam, 125212 ), mouse monoclonal anti-GFAP (1:500, Cell Signaling Technology, 3670), rabbit anti-AQP4 (1:500, MilliporeSigma, A5971), rabbit anti-C3 (1:200, Thermo Fisher Scientific, 21349), mouse anti-C3aR (1:500, Hycult Biotech, 1123), rabbit anti-C5b-9 (1:500, Abcam), rabbit anti-MBP (1:400, Cell Signaling Technology), rabbit anti–cleaved caspase-3 (1:500, Cell Signaling Technology, 5A1E), mouse anti-NF200 (1:500, Abcam), or rat anti-CD31 (1:500, BD, 550274). After washing, appropriate secondary antibody was applied (60 minutes at 22°C; 1:500, Alexa Fluor 594, Life Technologies or Alexa Fluor 488, Life Technologies). For C5b-9 staining, mechanically injured mouse spinal cord was used as positive control. For caspase-3 staining, Jurkat cells (gift provided by Scott Kaufmann, Mayo Clinic, Rochester, Minnesota, USA) were treated with etoposide (40 mg/mL, Biomol, Cay12092-25) for 6 hours, and then fixed in 4% cold PFA immediately for 10 minutes as positive control. Sections were washed and coverslipped with Fluoromount-G (Southern Biotech). Fluorescent images were visualized by confocal microscope (LSM510, Zeiss), and cells of interest were counted and fluorescence signal intensity was quantified using ImageJ software (NIH).
Ex vivo hippocampal slice preparation and imaging.
Hippocampal tissue slices (400 μm thick) prepared from P14–P21 mice were incubated in imaging media. Microglia were identified by genetically induced fluorescence (Cx3cr1gfp/+). For time series, we collected 15 Z-steps per image, spaced 2 mm apart (30 mm total depth). Images were taken up to 1 hour, at 5-minute intervals, on a Scientifica 2-photon microscope with ×20 lens. Image processing and analysis were performed using NIH ImageJ software.
In vivo spinal cord imaging.
Intraspinal cord imaging was recorded using a 2-photon microscope (Scientifica) with a Ti:sapphire laser tuned to 900 nm (Mai Tai; Spectra Physics). Microglia were stained genetically (Cx3cr1gfp/+) and astrocytes by intrathecally injected SR101 (5 μL at 25 μM). After laminectomy (L5 level), the spinal column was stabilized via clamps (model STS-A; Narishige) to minimize movement artefacts. Video and images were captured 100 μm to 150 μm from the surface.
Statistics.
Data are presented as the mean ± SEM. For comparisons between 2 groups, a 2-tailed unpaired Student’s t test was used. For multiple groups, 1-way ANOVA with Tukey’s post hoc analysis (when applicable) were used. Two-way ANOVA with Tukey’s multiple-comparisons test were used to determine significance between time curves of different groups. No statistical methods were used to predetermine sample sizes.
Study approval.
All animal procedures were performed in accordance with NIH guidelines and with the approval of the Institutional Animal Care and Use Committee at the Mayo Clinic.
Author contributions
TC, VAL, and LJW designed the research. TC, YUL, DBB, YL, MHY, and JZ performed the research. TC, YUL, and JZ analyzed data. VAL and SW provided reagents. LJW and VAL wrote the manuscript. All authors revised and approved the manuscript.
Supplementary Material
Acknowledgments
This work was supported by NIH grants (R01NS088627, R01NS110949, and R01NS112144). TC was supported by a postdoctoral fellowship from the Mayo Clinic Center for Multiple Sclerosis and Autoimmune Neurology. We thank Ningling Luo for IgG characterization and purification and Jim Fryer for assistance with flow cytometry and generating AQP4null mice (Neuroimmunology Research Laboratory, Mayo Clinic, Rochester, Minnesota, USA), Yong Guo and Claudia Lucchinetti (Department of Neurology, Mayo Clinic, Rochester, Minnesota, USA) for insightful discussions NMO immunohistopathology, and Scott Kaufmann (Department of Oncology, Mayo Clinic, Rochester, Minnesota, USA) for assistance with assaying caspase-3.
Version 1. 06/22/2020
Electronic publication
Version 2. 08/03/2020
Print issue publication
Footnotes
Conflict of interest: VAL shares in royalties derived from Mayo Clinic licensing of commercial aquaporin 4 autoantibody testing.
Copyright: © 2020, American Society for Clinical Investigation.
Reference information: J Clin Invest. 2020;130(8):4025–4038.https://doi.org/10.1172/JCI134816.
See the related Commentary at Microglia complement astrocytes in neuromyelitis optica.
Contributor Information
Tingjun Chen, Email: Chen.Tingjun@mayo.edu.
Vanda A. Lennon, Email: lennon.vanda@mayo.edu.
Yong U. Liu, Email: liu.yong@mayo.edu.
Dale B. Bosco, Email: Bosco.Dale@mayo.edu.
Yujiao Li, Email: yujiao19910210@gmail.com.
Min-Hee Yi, Email: Yi.Min-Hee@mayo.edu.
Jia Zhu, Email: zhujia0322@163.com.
Shihui Wei, Email: weishihui706@hotmail.com.
Long-Jun Wu, Email: wu.longjun@mayo.edu.
References
- 1.Zekeridou A, Lennon VA. Aquaporin-4 autoimmunity. Neurol Neuroimmunol Neuroinflamm. 2015;2(4):e110. doi: 10.1212/NXI.0000000000000110. [DOI] [PMC free article] [PubMed] [Google Scholar]
- 2.Lennon VA, et al. A serum autoantibody marker of neuromyelitis optica: distinction from multiple sclerosis. Lancet. 2004;364(9451):2106–2112. doi: 10.1016/S0140-6736(04)17551-X. [DOI] [PubMed] [Google Scholar]
- 3.Lennon VA, Kryzer TJ, Pittock SJ, Verkman AS, Hinson SR. IgG marker of optic-spinal multiple sclerosis binds to the aquaporin-4 water channel. J Exp Med. 2005;202(4):473–477. doi: 10.1084/jem.20050304. [DOI] [PMC free article] [PubMed] [Google Scholar]
- 4.Roemer SF, et al. Pattern-specific loss of aquaporin-4 immunoreactivity distinguishes neuromyelitis optica from multiple sclerosis. Brain. 2007;130(Pt 5):1194–1205. doi: 10.1093/brain/awl371. [DOI] [PubMed] [Google Scholar]
- 5.Szu JI, Binder DK. The role of astrocytic aquaporin-4 in synaptic plasticity and learning and memory. Front Integr Neurosci. 2016;10:8. doi: 10.3389/fnint.2016.00008. [DOI] [PMC free article] [PubMed] [Google Scholar]
- 6.Hinson SR, et al. Molecular outcomes of neuromyelitis optica (NMO)-IgG binding to aquaporin-4 in astrocytes. Proc Natl Acad Sci U S A. 2012;109(4):1245–1250. doi: 10.1073/pnas.1109980108. [DOI] [PMC free article] [PubMed] [Google Scholar]
- 7.Guo Y, et al. Pathogenic implications of cerebrospinal fluid barrier pathology in neuromyelitis optica. Acta Neuropathol. 2017;133(4):597–612. doi: 10.1007/s00401-017-1682-1. [DOI] [PMC free article] [PubMed] [Google Scholar]
- 8.Misu T, et al. Loss of aquaporin 4 in lesions of neuromyelitis optica: distinction from multiple sclerosis. Brain. 2007;130(pt 5):1224–1234. doi: 10.1093/brain/awm047. [DOI] [PubMed] [Google Scholar]
- 9.Howe CL, Kaptzan T, Magaña SM, Ayers-Ringler JR, LaFrance-Corey RG, Lucchinetti CF. Neuromyelitis optica IgG stimulates an immunological response in rat astrocyte cultures. Glia. 2014;62(5):692–708. doi: 10.1002/glia.22635. [DOI] [PMC free article] [PubMed] [Google Scholar]
- 10.Hinson SR, Clift IC, Luo N, Kryzer TJ, Lennon VA. Autoantibody-induced internalization of CNS AQP4 water channel and EAAT2 glutamate transporter requires astrocytic Fc receptor. Proc Natl Acad Sci U S A. 2017;114(21):5491–5496. doi: 10.1073/pnas.1701960114. [DOI] [PMC free article] [PubMed] [Google Scholar]
- 11.Lucchinetti CF, et al. A role for humoral mechanisms in the pathogenesis of Devic’s neuromyelitis optica. Brain. 2002;125(Pt 7):1450–1461. doi: 10.1093/brain/awf151. [DOI] [PMC free article] [PubMed] [Google Scholar]
- 12.Bradl M, et al. Neuromyelitis optica: pathogenicity of patient immunoglobulin in vivo. Ann Neurol. 2009;66(5):630–643. doi: 10.1002/ana.21837. [DOI] [PubMed] [Google Scholar]
- 13.Hinson SR, et al. Pathogenic potential of IgG binding to water channel extracellular domain in neuromyelitis optica. Neurology. 2007;69(24):2221–2231. doi: 10.1212/01.WNL.0000289761.64862.ce. [DOI] [PubMed] [Google Scholar]
- 14.Vincent T, et al. Functional consequences of neuromyelitis optica-IgG astrocyte interactions on blood-brain barrier permeability and granulocyte recruitment. J Immunol. 2008;181(8):5730–5737. doi: 10.4049/jimmunol.181.8.5730. [DOI] [PubMed] [Google Scholar]
- 15.Kim JS, et al. Glycyrrhizic acid prevents astrocyte death by neuromyelitis optica-specific IgG via inhibition of C1q binding. Biochem Biophys Res Commun. 2016;478(2):553–558. doi: 10.1016/j.bbrc.2016.07.098. [DOI] [PubMed] [Google Scholar]
- 16.Phuan PW, et al. C1q-targeted monoclonal antibody prevents complement-dependent cytotoxicity and neuropathology in in vitro and mouse models of neuromyelitis optica. Acta Neuropathol. 2013;125(6):829–840. doi: 10.1007/s00401-013-1128-3. [DOI] [PMC free article] [PubMed] [Google Scholar]
- 17.Yao X, Adams MS, Jones PD, Diederich CJ, Verkman AS. Noninvasive, targeted creation of neuromyelitis optica pathology in AQP4-IgG seropositive rats by pulsed focused ultrasound. J Neuropathol Exp Neurol. 2019;78(1):47–56. doi: 10.1093/jnen/nly107. [DOI] [PMC free article] [PubMed] [Google Scholar]
- 18.Saadoun S, Waters P, Bell BA, Vincent A, Verkman AS, Papadopoulos MC. Intra-cerebral injection of neuromyelitis optica immunoglobulin G and human complement produces neuromyelitis optica lesions in mice. Brain. 2010;133(pt 2):349–361. doi: 10.1093/brain/awp309. [DOI] [PMC free article] [PubMed] [Google Scholar]
- 19.Lucchinetti CF, Guo Y, Popescu BF, Fujihara K, Itoyama Y, Misu T. The pathology of an autoimmune astrocytopathy: lessons learned from neuromyelitis optica. Brain Pathol. 2014;24(1):83–97. doi: 10.1111/bpa.12099. [DOI] [PMC free article] [PubMed] [Google Scholar]
- 20.Zhang H, Verkman AS. Longitudinally extensive NMO spinal cord pathology produced by passive transfer of NMO-IgG in mice lacking complement inhibitor CD59. J Autoimmun. 2014;53:67–77. doi: 10.1016/j.jaut.2014.02.011. [DOI] [PMC free article] [PubMed] [Google Scholar]
- 21.Fryer JP, et al. AQP4 autoantibody assay performance in clinical laboratory service. Neurol Neuroimmunol Neuroinflamm. 2014;1(1):e11. doi: 10.1212/NXI.0000000000000011. [DOI] [PMC free article] [PubMed] [Google Scholar]
- 22.Majed M, Fryer JP, McKeon A, Lennon VA, Pittock SJ. Clinical utility of testing AQP4-IgG in CSF: Guidance for physicians. Neurol Neuroimmunol Neuroinflamm. 2016;3(3):e231. doi: 10.1212/NXI.0000000000000231. [DOI] [PMC free article] [PubMed] [Google Scholar]
- 23.Geis C, et al. The intrinsic pathogenic role of autoantibodies to aquaporin 4 mediating spinal cord disease in a rat passive-transfer model. Exp Neurol. 2015;265:8–21. doi: 10.1016/j.expneurol.2014.12.015. [DOI] [PMC free article] [PubMed] [Google Scholar]
- 24.Fan Y, et al. Aquaporin-4 promotes memory consolidation in Morris water maze. Brain Struct Funct. 2013;218(1):39–50. doi: 10.1007/s00429-011-0373-2. [DOI] [PubMed] [Google Scholar]
- 25.Felix CM, Levin MH, Verkman AS. Complement-independent retinal pathology produced by intravitreal injection of neuromyelitis optica immunoglobulin G. J Neuroinflammation. 2016;13(1):275. doi: 10.1186/s12974-016-0746-9. [DOI] [PMC free article] [PubMed] [Google Scholar]
- 26.Peng J, et al. Microglia and monocytes synergistically promote the transition from acute to chronic pain after nerve injury. Nat Commun. 2016;7:12029. doi: 10.1038/ncomms12029. [DOI] [PMC free article] [PubMed] [Google Scholar]
- 27.Spiller KJ, et al. Microglia-mediated recovery from ALS-relevant motor neuron degeneration in a mouse model of TDP-43 proteinopathy. Nat Neurosci. 2018;21(3):329–340. doi: 10.1038/s41593-018-0083-7. [DOI] [PMC free article] [PubMed] [Google Scholar]
- 28.Heppner FL, et al. Experimental autoimmune encephalomyelitis repressed by microglial paralysis. Nat Med. 2005;11(2):146–152. doi: 10.1038/nm1177. [DOI] [PubMed] [Google Scholar]
- 29.Eyo UB, Murugan M, Wu LJ. Microglia-neuron communication in epilepsy. Glia. 2017;65(1):5–18. doi: 10.1002/glia.23006. [DOI] [PMC free article] [PubMed] [Google Scholar]
- 30.Eyo UB, et al. Regulation of physical microglia-neuron interactions by fractalkine signaling after status epilepticus. eNeuro. 2016;3(6):ENEURO.0209-16.2016. doi: 10.1523/ENEURO.0209-16.2016. [DOI] [PMC free article] [PubMed] [Google Scholar]
- 31.Wu LJ, Vadakkan KI, Zhuo M. ATP-induced chemotaxis of microglial processes requires P2Y receptor-activated initiation of outward potassium currents. Glia. 2007;55(8):810–821. doi: 10.1002/glia.20500. [DOI] [PubMed] [Google Scholar]
- 32.Eyo UB, Peng J, Swiatkowski P, Mukherjee A, Bispo A, Wu LJ. Neuronal hyperactivity recruits microglial processes via neuronal NMDA receptors and microglial P2Y12 receptors after status epilepticus. J Neurosci. 2014;34(32):10528–10540. doi: 10.1523/JNEUROSCI.0416-14.2014. [DOI] [PMC free article] [PubMed] [Google Scholar]
- 33.Zhang LY, et al. Microglia exacerbate white matter injury via complement C3/C3aR pathway after hypoperfusion. Theranostics. 2020;10(1):74–90. doi: 10.7150/thno.35841. [DOI] [PMC free article] [PubMed] [Google Scholar]
- 34.Lian H, Litvinchuk A, Chiang AC, Aithmitti N, Jankowsky JL, Zheng H. Astrocyte-microglia cross talk through complement activation modulates amyloid pathology in mouse models of Alzheimer’s disease. J Neurosci. 2016;36(2):577–589. doi: 10.1523/JNEUROSCI.2117-15.2016. [DOI] [PMC free article] [PubMed] [Google Scholar]
- 35.Dejanovic B, et al. Changes in the synaptic proteome in tauopathy and rescue of tau-induced synapse loss by C1q antibodies. Neuron. 2018;100(6):1322–1336.e7. doi: 10.1016/j.neuron.2018.10.014. [DOI] [PubMed] [Google Scholar]
- 36.Gotoh K, et al. Mitochondrial p32/C1qbp is a critical regulator of dendritic cell metabolism and maturation. Cell Rep. 2018;25(7):1800–1815.e4. doi: 10.1016/j.celrep.2018.10.057. [DOI] [PubMed] [Google Scholar]
- 37.Ten VS, et al. Complement component c1q mediates mitochondria-driven oxidative stress in neonatal hypoxic-ischemic brain injury. J Neurosci. 2010;30(6):2077–2087. doi: 10.1523/JNEUROSCI.5249-09.2010. [DOI] [PMC free article] [PubMed] [Google Scholar]
- 38.Ramaglia V, et al. C3-dependent mechanism of microglial priming relevant to multiple sclerosis. Proc Natl Acad Sci U S A. 2012;109(3):965–970. doi: 10.1073/pnas.1111924109. [DOI] [PMC free article] [PubMed] [Google Scholar]
- 39.Ingram G, et al. Complement activation in multiple sclerosis plaques: an immunohistochemical analysis. Acta Neuropathol Commun. 2014;2:53. doi: 10.1186/2051-5960-2-53. [DOI] [PMC free article] [PubMed] [Google Scholar]
- 40.Cowell RM, Plane JM, Silverstein FS. Complement activation contributes to hypoxic-ischemic brain injury in neonatal rats. J Neurosci. 2003;23(28):9459–9468. doi: 10.1523/JNEUROSCI.23-28-09459.2003. [DOI] [PMC free article] [PubMed] [Google Scholar]
- 41.Liszewski MK, et al. Intracellular complement activation sustains T cell homeostasis and mediates effector differentiation. Immunity. 2013;39(6):1143–1157. doi: 10.1016/j.immuni.2013.10.018. [DOI] [PMC free article] [PubMed] [Google Scholar]
- 42.Cardone J, et al. Complement regulator CD46 temporally regulates cytokine production by conventional and unconventional T cells. Nat Immunol. 2010;11(9):862–871. doi: 10.1038/ni.1917. [DOI] [PMC free article] [PubMed] [Google Scholar]
- 43.Ghannam A, Fauquert JL, Thomas C, Kemper C, Drouet C. Human complement C3 deficiency: Th1 induction requires T cell-derived complement C3a and CD46 activation. Mol Immunol. 2014;58(1):98–107. doi: 10.1016/j.molimm.2013.11.010. [DOI] [PubMed] [Google Scholar]
- 44.Satyam A, et al. Intracellular activation of complement 3 is responsible for intestinal tissue damage during mesenteric ischemia. J Immunol. 2017;198(2):788–797. doi: 10.4049/jimmunol.1502287. [DOI] [PubMed] [Google Scholar]
- 45.Vrselja Z, et al. Restoration of brain circulation and cellular functions hours post-mortem. Nature. 2019;568(7752):336–343. doi: 10.1038/s41586-019-1099-1. [DOI] [PMC free article] [PubMed] [Google Scholar]
- 46.Sagan SA, et al. Tolerance checkpoint bypass permits emergence of pathogenic T cells to neuromyelitis optica autoantigen aquaporin-4. Proc Natl Acad Sci U S A. 2016;113(51):14781–14786. doi: 10.1073/pnas.1617859114. [DOI] [PMC free article] [PubMed] [Google Scholar]
- 47.Sasaki K, et al. Relapsing-remitting central nervous system autoimmunity mediated by GFAP-specific CD8 T cells. J Immunol. 2014;192(7):3029–3042. doi: 10.4049/jimmunol.1302911. [DOI] [PMC free article] [PubMed] [Google Scholar]
- 48.Kojima K, et al. Experimental autoimmune panencephalitis and uveoretinitis transferred to the Lewis rat by T lymphocytes specific for the S100 beta molecule, a calcium binding protein of astroglia. J Exp Med. 1994;180(3):817–829. doi: 10.1084/jem.180.3.817. [DOI] [PMC free article] [PubMed] [Google Scholar]
- 49.Salter MW, Stevens B. Microglia emerge as central players in brain disease. Nat Med. 2017;23(9):1018–1027. doi: 10.1038/nm.4397. [DOI] [PubMed] [Google Scholar]
- 50.Qin C, et al. Dual functions of microglia in ischemic stroke. Neurosci Bull. 2019;35(5):921–933. doi: 10.1007/s12264-019-00388-3. [DOI] [PMC free article] [PubMed] [Google Scholar]
- 51.Ransohoff RM, Brown MA. Innate immunity in the central nervous system. J Clin Invest. 2012;122(4):1164–1171. doi: 10.1172/JCI58644. [DOI] [PMC free article] [PubMed] [Google Scholar]
- 52.Eyo UB, Wu LJ. Microglia: Lifelong patrolling immune cells of the brain. Prog Neurobiol. 2019;179:101614. doi: 10.1016/j.pneurobio.2019.04.003. [DOI] [PMC free article] [PubMed] [Google Scholar]
- 53.Delorme R, Ey E, Toro R, Leboyer M, Gillberg C, Bourgeron T. Progress toward treatments for synaptic defects in autism. Nat Med. 2013;19(6):685–694. doi: 10.1038/nm.3193. [DOI] [PubMed] [Google Scholar]
- 54.Chaudhry IB, et al. Minocycline benefits negative symptoms in early schizophrenia: a randomised double-blind placebo-controlled clinical trial in patients on standard treatment. J Psychopharmacol (Oxford) 2012;26(9):1185–1193. doi: 10.1177/0269881112444941. [DOI] [PubMed] [Google Scholar]
- 55.Elmore MR, et al. Colony-stimulating factor 1 receptor signaling is necessary for microglia viability, unmasking a microglia progenitor cell in the adult brain. Neuron. 2014;82(2):380–397. doi: 10.1016/j.neuron.2014.02.040. [DOI] [PMC free article] [PubMed] [Google Scholar]
Associated Data
This section collects any data citations, data availability statements, or supplementary materials included in this article.


