PLOS One logoLink to PLOS One
. 2020 Aug 6;15(8):e0237147. doi: 10.1371/journal.pone.0237147

Spatiotemporal patterns of anemia among lactating mothers in Ethiopia using data from Ethiopian Demographic and Health Surveys (2005, 2011 and 2016)

Alemneh Mekuriaw Liyew 1,*, Sewnet Adem Kebede 1, Chilot Desta Agegnehu 2, Achamyeleh Birhanu Teshale 1, Adugnaw Zeleke Alem 1, Yigizie Yeshaw 1,3, Getayeneh Antehunegn Tesema 1
Editor: William Joe4
PMCID: PMC7410320  PMID: 32760116

Abstract

Introduction

Maternal anemia is a worldwide public health problem especially in developing countries including Ethiopia. The burden of anemia among lactating mothers in Ethiopia was higher than those who were neither pregnant nor breastfeeding. To date, there is limited evidence on spatiotemporal patterns of anemia among lactating mothers in the country. Exploring the spatial patterns of maternal anemia is vital to design and monitor effective intervention programs. Therefore this study aimed to explore spatiotemporal patterns of anemia among lactating mothers in Ethiopia over the past one and half-decades.

Methods

A total of 11,989 lactating mothers were included from the three consecutive Ethiopian Demographic and Health Surveys(2005, 2011, and 2016). The trend of anemia over the three surveys was showed. Furthermore, spatial autocorrelation analysis, cluster and outlier analysis, hotspot analysis, spatial interpolation, and spatial scan statistics were carried out to identify geographically risk areas of anemia among lactating mothers in Ethiopia. Finally, the most anemia risk areas were detected consistently by different spatial analytic methods in each survey.

Results

Anemia during lactation had an increasing trend from 2011 to 2016 in all regions of Ethiopia. It was also spatially clustered over three survey periods (Moran’s I: 0.102–0.256, P<0.01).The hotspot areas were detected in Afar, Somali, Gambela, Dire Dawa, and Oromia regions during the last fifteen years. In 2005 and 2011, a total of 100 most likely clusters (Loglikelihood Ratio(LLR) = 8.8, P<0.05, and LLR = 45.94, P<0.001, respectively) were identified in the Afar region. However, in the 2016 survey period, primary clusters were shifted to the Somali region where 57 clusters (LLR = 72.73, P<0.001) were detected in the entire region. Besides, the risk prediction map showed that the eastern part of the country was at a higher risk of anemia during lactation.

Conclusion

Anemia during lactation was spatially clustered in Ethiopia. High-risk areas were detected in the eastern part of Ethiopia prominently in the Afar and Somali regions. Therefore, public health intervention activities designed in a targeted approach to impact high-risk populations in those hot spot areas wound be helpful to reduce anemia in Ethiopia.

Introduction

Anemia is a condition with a low hemoglobin level with a cutoff point <110 g/L for pregnant women and <120 g/L for non-pregnant women [1]. It is characterized by a decreased number of red blood cells or hemoglobin level that results in the insufficient oxygen-carrying capacity of blood to meet the cellular metabolic demand of the body. Anemia can occur due to nutritional deficiencies (the most common cause), acute and chronic inflammations, parasitic infections, and acquired or inherited disorders that affect the synthesis of hemoglobin and production or survival of red blood cells [2, 3].

Anemia is a worldwide public health problem affecting both developing and developed countries that occurs in all population groups of the human being [2]. Globally, 38% of pregnant women and 29% of non-pregnant women were anemic in 2011.Of these, pregnant women in low-income and middle-income countries (LMICs)had high rates of anemia, in which the highest prevalence rates are reported in Central and West Africa (56%), South Asia (52%) and East Africa (36%) [4]. Similarly, a large proportion of non-pregnant women were reportedly anemic in West and Central Africa (48%), South Asia (47%), and East Africa (28%) [4]. In Ethiopia, anemia prevalence among reproductive-age women declined from 27% in 2005 [5] to 17% in 2011 [6] but it has increased to 24% in 2016 [7]. The prevalence rate of anemia among women who are lactating in Ethiopia was 29% which was higher than those who are neither pregnant nor lactating (21%) [7]. Furthermore, different studies had shown the burden of anemia in Ethiopia varies across different geographic locations [817]. This might be because of the existence of diverse contextual and geographically variable factors like diet and the incidence of infectious diseases [18, 19].

Anemia is associated with poor social and economic development, an increased risk of child mortality [2, 3], maternal mortality [20], depression [21, 22], raised blood pressure [23, 24], low birth weight, and preterm birth [25]. This makes anemia to be one of the global health priority areas, especially in resource-limited areas [18]. Therefore reducing anemia is considered as an essential part of improving the health of women, and the WHO has set a global target of achieving a 50% reduction of anemia among women of reproductive age by 2025 [26].

Lactating mothers are vulnerable to anemia because of maternal iron depletion during lactation as well as blood loss during childbirth [27]. Studies have indicated that, even though breast milk is not a good source of iron, the quality of breast milk is maintained at the expense of maternal stores [28]. The postpartum anemia was highest in mothers who are anemic during their gestational period [29]. Moreover, lactating mothers are highly susceptible to iron depletion if the energy and nutrient intake in their diets is inadequate. Besides, the lactating mothers begin the postnatal period after having iron-depleted through the continuum from pregnancy to childbearing [30].

Though there are studies conducted on the determinants of anemia among lactating mothers [3133] in Ethiopia, to date, the risk areas (hot spot) of anemia among lactating mothers are not identified. Thus, this study aimed to explore the spatiotemporal patterns of anemia among lactating mothers in Ethiopia over the last one and half-decades to point out whether there was either the shift or improvement in anemia risk areas following intervention programs in between the survey periods in Ethiopia. Therefore, detecting the geographic variation of anemia during lactation is important to prioritize and design targeted intervention programs to reduce anemia especially in those areas with a consistently higher risk of anemia over time. Besides, since the burden of anemia has been used as a measurable indicator of soil-transmitted helminthiasis [34], understanding the geographical distribution of anemia can help to target prevention and control mechanisms for these parasitic infections in the area.

Methods

Study design and setting

An in-depth analysis of data from Ethiopian Demographic and Health Surveys (EDHS) 2005, 2011, and 2016 was undertaken for this study. Ethiopia (3o -14o N and 33o - 48°E) is located in the horn of Africa (Fig 1). The country covers 1.1 million Sq. km and has a great geographical diversity, which ranges 4550 m above sea level down to the Afar depression to 110 m below sea level. There are nine regional states(Afar, Amhara, south nation nationality and peoples, Benshangul Gumuz, Gambela, Harari, Oromia, Somalia, and Tigry) and two city administrations(Addis Ababa and Dire Dawa). These regions were again subdivided into 68 zones, 817 districts, and 16,253 kebeles (lowest local administrative units of the country) in the administrative structure of Ethiopia [7].

Fig 1. Map of Ethiopia where the three surveys were undertaken with nine regions and two administrative cities (Source: Shapefile from Central Statistical Agency, Ethiopia, 2013).

Fig 1

Data source and sampling

The Demographic and Health Survey (DHS) Program provides publicly free access to survey data for responsible researchers. Therefore, we accessed the datasets using the website www.measuredhs.com after the reasonable request of the Demographic and Health Survey(DHS).Researchers can access the data free of charge and can replicate our study findings in their entirety by directly obtaining the data. The detailed description of each dataset and other relevant information could be obtained elsewhere [35].

Accordingly, the Ethiopian Demographic and Health Survey (EDHS) was used for the current study which has collected data on national representative samples of all populations including reproductive-age (15–49) women every five years interval. To date, four surveys had been conducted and anemia was included as a key indicator since the 2005 survey.

In 2005 and 2011 surveys, 540 (139 urban and 401 rural areas) and 624 (187 urban and 437 rural) enumeration areas (EAs) were selected using systematic random sampling with probability proportional to size. A total of 14,645 households (17,817 eligible reproductive age women), and 14,645 households (14,717 eligible reproductive age women), respectively, were included. In 2016 EDHS, 645 EAs (202 urban and 443 rural) were selected. Of these, 18008 households and 16,583 eligible reproductive-age women were included. In the current study, a total of 11,989 (weighted) lactating mothers were included from the three surveys (Table 1). Besides, geographic coordinate data (latitude and longitude coordinates) were also taken from selected enumeration areas in all three surveys. These geo-referenced data were accessed through the web page of the international DHS Program after justifying the purpose of the study.

Table 1. Total number of lactating mothers included in 2005, 2011 and 2016 EDHS by region, Ethiopia.

Regions Year of Survey
2005 2011 2016 Total
Tigry 197 446 449 1092
Afar 116 351 332 799
Amhara 327 659 518 1504
Oromia 365 721 621 1707
Somali 186 333 369 888
Benshangul Gumuz 164 438 364 966
SNNP 398 689 556 1643
Gambela 133 393 392 918
Hareri 130 336 287 753
Addiss Ababa 162 350 379 891
Dire Dawa 107 331 390 828
Total 2,285 5,047 4,657 11,989

SNNP: South Nation Nationality and Peoples Region.

Outcome variable

In the three Ethiopian Demographic and Health Surveys, the hemoglobin level was measured for those eligible reproductive age mothers after having consent and it was adjusted for altitude [57]. This altitude adjusted hemoglobin was available in the dataset for each survey. Therefore, the current study was based on the altitude adjusted hemoglobin level which was already provided in the EDHS data. After the categorization of the hemoglobin level, lactating mothers with a hemoglobin level <120 g/L were considered as anemic and otherwise nonanemic. Finally, the weighted proportion of anemia per cluster was used for further spatial analysis.

Spatial analysis

The spatial autocorrelation (Global Moran’s I) statistic was used to evaluate whether the anemia patterns are dispersed, clustered, or randomly distributed during the three survey periods in Ethiopia. The decision was made based on the calculated Moran’s I values. When the Moran’I value is close to−1 indicates anemia is dispersed, whereas Moran’s I close to +1 indicates anemia is clustered in the study area. However, the Moran’s I value zero shows a random distribution of anemia. Once it was confirmed that the global distribution of anemia is nonrandom, the local Moran’s I was used to investigate the local level cluster locations of anemia in Ethiopia. Local Moran’s I identify hotspot clusters (High-High), and cold spot clusters (Low-Low). It also measures outliers where high values were surrounded primarily by low values(High-Low), and outliers in which low values were surrounded primarily by high values (Low-High) [36, 37]. This spatial analysis technique was employed to detect the local level risk areas of anemia and its outliers on a separate map.

In addition to local Moran’s I, Gettis-OrdGi* statistics was computed to measure how spatial autocorrelation of anemia among lactating mothers varies across different locations in Ethiopia. Hotspot analysis computes Z-score and p-value to determine the statistical significance of the clustering of anemia over the study area at different significance levels simultaneously [38]. In this analysis, the p-value associated with a 95%, 90%, and 99% confidence level would have provided to decide the existence of significant clustering. Areas at high risk (hotspot) of lactational anemia (the statistical output with high Gi*) and areas at low risk (cold spot) of anemia during lactation (the statistical output with low Gi*) were detected [36, 37, 39].

The spatial interpolation technique was applied to predict the unsampled areas from sampled measurements [40]. Ordinary Kriging spatial interpolation method was used to predict raster surface from point data. Therefore, smooth surfaces for the risk areas of anemia among lactating mothers was indicated on the anemia risk map.

Identifying most likely clusters was done using the spatial Scan statistical method, a method which is widely recommended as it is very important in detecting local clusters and has higher power than other available spatial statistical methods [41]. Therefore, spatial scan statistical analysis was employed to test for the presence of statistically significant spatial clusters of anemia using Kuldorff'sSaTScan version 9.4 software [42]. The spatial scan statistic uses a scanning window that moves across the study area. Women with anemia were taken as cases and non-anemic ones were considered as controls to fit the Bernoulli model. The default maximum spatial cluster size of <50% of the population was used as an upper limit, which allowed both small and large clusters to be detected and ignored clusters that contained more than the maximum limit. For each potential cluster, a likelihood ratio test statistic was used to determine if the number of observed anemia cases within the potential cluster was significantly higher than expected or not. The primary and secondary clusters are identified and ranked based on their likelihood ratio based on 999 Monte Carlo replications. Therefore most likely risk areas of anemia among lactating mothers in three consecutive surveys were indicated in consecutive spatial maps.

Ethical consideration

Ethical clearance was approved by an Institutional Ethical Review Committee of the Institute of Public Health, College of Medicine and Health Sciences, University of Gondar. The approval letter for the use of the EDHS data set was also gained from the Measure DHS (ORC MACRO). No information obtained from the data set was disclosed to any third person.

Results

Trends and spatial distribution of anemia among lactating mothers

Even though it had decreased from 2005 to 2011 almost in all regions, its prevalence increased from 2011 to 2016 in all regions including the two administrative cities. The highest prevalence was observed in the Somali regional state (68%) and the Afar region (47%) in 2016 (Fig 2).

Fig 2. Trends of anemia among lactating mothers in Ethiopia overtime across regions 2005, 2011, and 2016.

Fig 2

Moreover, the exploratory visualization of the spatial distribution of anemia showed a wide geographic variation across regions in three surveys. The highest proportions were observed in Pastoral regions in all three surveys which were consistent with the observed trend (Fig 3A–3C).

Fig 3.

Fig 3

a-c: Spatial distribution of anemia among lactating mothers in Ethiopia 2005 (a), 2011 (b), 2016 (c) EDHS (Source: Shapefile from Central Statistical Agency, Ethiopia, 2013).

Spatial autocorrelation of anemia among lactating mothers

The spatial patterns of anemia among lactating mothers were found to be non-random during the three study periods EDHS (Fig 4A–4C). The Global Moran's I values ranged from 0.101 to 0.26, indicating that there was significant clustering of anemia among lactating mothers in the country. The clustering pattern in all three study periods was highly significant (>90%) (Fig 4A–4C, Table 2).

Fig 4.

Fig 4

a-c: Spatial autocorrelation of anemia among lactating mothers in Ethiopia, 2005 (a), 2011 (b), 2016 (c) (Source: Shapefile from Central Statistical Agency, Ethiopia, 2013).

Table 2. Spatial autocorrelation analysis of anemia among lactating mothers in Ethiopia, 2005, 2011, and 2016.

EDHS study periods Observed moran’s I Expected moran’s I Z-score P-value
2005 0.13* -0.02 3.97 <0.01*
2011 0.10* -0.01 3.07 <0.05*
2016 0.26* -0.01 15.30 <0.01*

*The observed Moan’s I value is greater than the expected value and the p-value< 0.05, which revealed that the spatial dependency of anemia is statistically significant during three periods.

The clustered patterns (on the right sides) show high rates of anemia occurred over the study area. The outputs have automatically generated keys on the right and left sides of each panel. Auto-generated interpretations available underneath each figure show that the likelihood of clustered patterns occurred by random chance is less than 1%.

Spatial epidemiology of anemia among lactating mothers

Both Figs 5 and 6 indicate the consistently similar geographical distribution of risk areas of anemia among lactating mothers during the three survey periods. Each spot on the map indicates a single enumeration area. The hotspot (enumeration areas with high anemia risk) areas were found in Afar (in all surveys); Somali, Dire Dawa, Harari(in 2011 and 2016 surveys); and Gambella (2005 and 2016 surveys) regions. Whereas, Addis Ababa, Oromia, Amhara, Tigray, SNNP, Benshangul in all surveys; and Gambela in 2011 survey were identified as cold spot(enumeration areas with low anemia risk) regions (Figs 5 and 6). The outliers were found in Addis Ababa, Dire Dawa, Oromia, SNNP, and southern parts of Afar in all surveys; Southwest Amhara and Benshangul-Gumuz in 2016 survey; and Northern part of Gambela in 2005 survey (Fig 5A–5C).

Fig 5.

Fig 5

a-c: Cluster outlier identification ofanemia among lactating mothers in Ethiopia, 2005 (a), 2011 (b), 2016 (c) EDHS (Source: Shapefile from Central Statistical Agency, Ethiopia, 2013).

Fig 6.

Fig 6

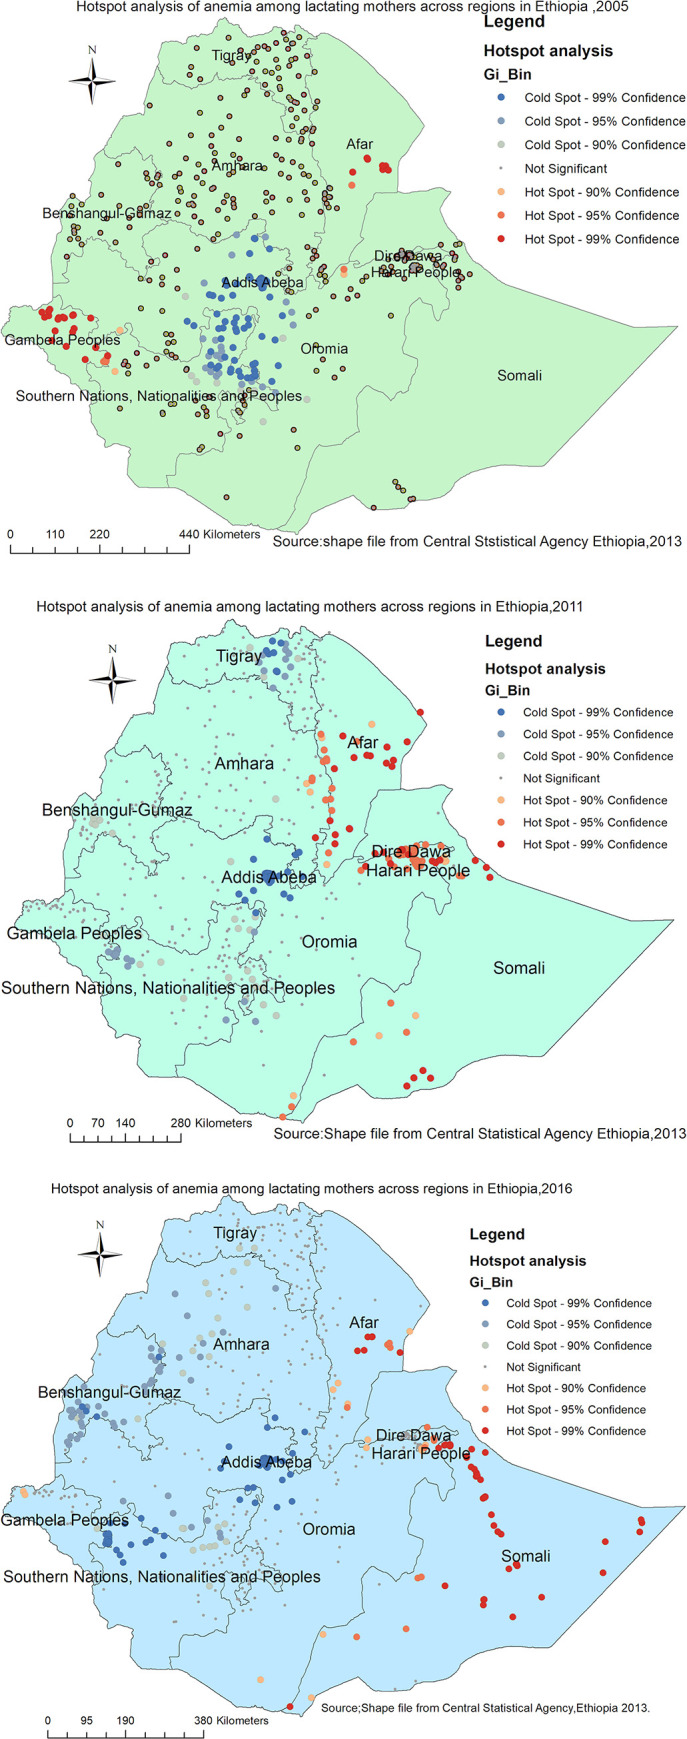
a-c: Hot spot identification of anemia among lactating mothers in Ethiopia 2005 (a), 2011 (b), 2016 (c) EDHS (Source: Shapefile from Central Statistical Agency, Ethiopia, 2013).

Spatial interpolation

In the 2005 survey (Fig 7A), the Afar (Eastern part),Somali (west), and Gambela regions were predicted as a more risky area of anemia during lactation as compared to other regions. Whereas, in the 2011 survey (Fig 7B), the entire Afar, the northern part of Dire Dawa,Somali and eastern border of Oromia regions were identified as risk areas. The predicted risk of anemia during lactation was almost shifted to the entire Somali region in the 2016 survey (Fig 7C).

Fig 7.

Fig 7

a-c: Spatiotemporal interpolation of anemia among lactating mothers in Ethiopia 2005 (a), 2011 (b), 2016 (c) (Source: Shapefile from Central Statistical Agency, Ethiopia, 2013).

Spatial scan statistical analysis

Overall, a total of 157 most likely (primary) clusters were detected across three EDHS surveys. Of these, 8 significant primary clusters were identified in 2005. The spatial scanning window for these clusters was located in the eastern part of the Afar region and border areas of Dire Dawa. It was centered at 11.559215 N, 41.505535 E with a radius of 94.66 km, a relative risk (RR) of 2.65, and a Log-likelihood Ratio (LLR) = 8.80 at p-value<0.05) (Table 3, Fig 8A). The lactating women within the spatial window had 2.65 times higher risk of being anemic as compared to women outside the spatial window.

Table 3. Significant spatial clusters of anemia among lactating mothers in Ethiopia, EDHS 2005, 2011, 2016.

Years Clusters Enumeration areas (clusters) detected Coordinate/radius Population Cases RR LLR P-value
2005 1* 186,248,227,515,59,413,47,18 11.56 N, 41.50 E) / 94.66 km 16 13 2.65 8.80 <0.05
2011 1* 314, 215, 62, 589, 164, 600, 512, 397, 106, 579, 68, 65, 604, 392, 617, 296, 210, 84, 445, 33, 99,414, 643, 577, 191, 79, 85, 67, 26, 231, 478, 293, 423, 433, 549, 133, 44, 323, 596, 572, 366, 59, 590, 616, 529, 464, 159, 581, 205, 629, 501, 110, 376, 645, 308, 194, 400, 182, 203, 170, 352, 455, 285, 448, 446, 499, 602, 345, 371, 420, 421, 386, 138, 560, 270, 95, 286, 51, 236, 436, 200, 66 (11.49 N, 41.57E) / 229.79 km 528 210 1.98 45.9 <0.01
2016 1* 562, 213, 619, 123, 524, 438, 261,46, 138, 92, 490, 543, 492, 85, 358, 164, 77, 171, 198, 629, 95, 497, 278, 521, 588, 458, 553, 269, 318, 378, 187, 630, 214, 251, 573, 556, 239, 116, 22, 520, 33, 568, 277, 480, 527, 208, 64, 439, 57, 8, 210, 186, 394, 454, 436, 566, 212 (6.02 N, 44.81 E) / 462.80 km 277 181 2.27 72.73 <0.01

*primary clusters.

Fig 8.

Fig 8

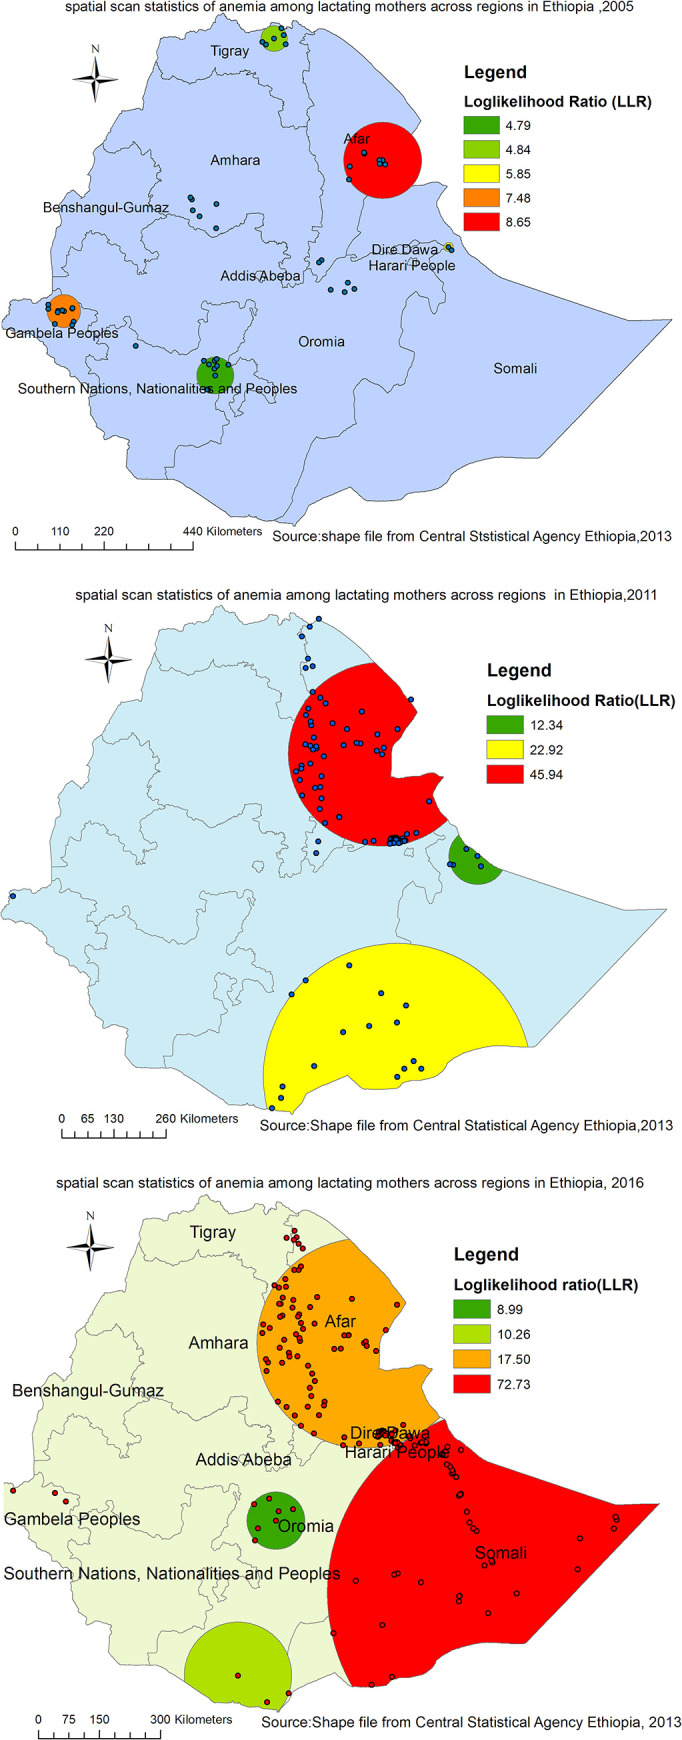
a-c. spatiotemporal patterns of primary clusters of anemia among lactating mothers in Ethiopia 2005 (a), 2011 (b), and 2016 (c) (Source: Shape file from Central Statistical Agency, Ethiopia, 2013).

Where as, in 2011, spatial scan statistics detected a total of 92 primary clusters. The spatial window for these clusters was located in the almost entire Afar, border areas of Southern Tigray and South-Eastern part of Amhara regions. It was centered at 11.494762 N, 41.566624 E with a radius of 229.79 km, RR of 1.98, LLR = 45.94, p-value<0.001 (Table 3, Fig 8B). It showed that lactating women within the spatial window had 2 times higher risk of anemia as compared to women outside the spatial window.

Furthermore, a total of 57 primary clusters were identified in the 2016 survey. The spatial window for these clusters was located in the entire Somali, and eastern border areas of Dire Dawa and Oromia regions, centered at 6.023458 N, 44.807507 E) with a radius of 462.80 km, RR of 2.27, LLR of 72.73 at p-value<0.001 (Table 3, Fig 8C). Lactating women within the spatial window had 2.27 times higher risk of anemia as compared to women outside the spatial window (Table 3, Fig 8C)s.

Discussion

The findings of this study showed that anemia during lactation was non-random at the national and regional levels. Significant clusters were consistently detected in the Afar region during all surveys (2005, 2011 and 2016). A total of 100 (8 in 2005; 92 in 2011) primary clusters were identified in this region. However, in 2016,57 significant primary clusters were shifted to the Somali region. Moreover, anemia risk prediction map showed that the eastern part of the country to be at a higher risk of anemia during lactation in all three surveys. The geographical difference of anemia across the regional states might be attributable to the regional variation of food consumption preferences [43, 44] and differences in availability of healthcare facilities [45]. This study revealed that the regions which were less developed [46] as compared to other Ethiopian states were at high risk of anemia. The possible explanation could be a lack of clean water and unimproved latrine facilities which would increase the occurrence of soil-transmitted infections [47] that might in turn lead to anemia [48]. Besides, the observed geographical variation in anemia risk could be due to the incidence of communicable and non-communicable diseases [49].

Despite several maternal health interventions in Ethiopia, the prevalence of anemia among lactating mothers had shown an increasing trend in all regions from 2011 to 2016 (Fig 2). The largest increase was observed in the Somali and Afar regions. Besides, the spatial autocorrelation analysis result indicated that anemia had a spatial dependency in 2005, 2011, and 2016. This spatial heterogeneity of anemia clustering was again observed prominently in Afar and Somali regions. Thus, the spatial clustering of anemia was more or less consistently higher in the Afar region in all three surveys and the Somali region in the latest two surveys (2011 and 2016). These could be due to the inaccessibility of health services, shortage of safe and adequate drinking water supply, and endemicity of malaria in these areas as compared to other regions of Ethiopia [50]. Though iron supplementation is an essential service for prevention of anemia among lactating mothers [2], its coverage is very low in these pastoral regions (Afar and Somali) which might be responsible for a high prevalence and hotspot areas of anemia in these regions as compared to other parts of Ethiopia [7, 51]. Besides, the compliance of lactating mothers to the use of iron supplementation service in these regions is below the recommended level [52] which might lead to an increased risk of anemia. The other possible reason behind the consistent hotspot areas in these regions could be nutritional problems such as lack of dietary diversity, consumption of camel, and cow milk which had relatively low iron content and the seasonal variation of food they consume (pastoral community) [53].

The findings of this study have valuable policy implications for health program design and interventions. The anemia hotspot areas can be easily identified even at the district level to take local interventions. It may also be helpful to give priority for regions that were consistently at higher risk of anemia over time. In general, these findings are supremely important for the Ministry of Health, Health Bureaus, and partners to develop intervention programs against anemia.

Strength and weakness of the study

This study had several strengths. First, the study was based on nationally representative large datasets, and thus it had adequate statistical power. Second, the estimates of the study were done after the data were weighted for the probability sampling and non-response, to make it representative at national and regional levels. Third, the use of GIS and SaTScan statistical softwares helped to detect statistically significant hotspot areas of anemia across the surveys consistently that will help to design effective public health intervention programs. However, our study is not free from limitations. First, the location data values were shifted 1–2 km for urban and 5 km for rural areas for data confidentiality issues. Consequently, this may lead to a challenge to know the exact location of cases. Second, spatial modeling was not conducted to identify the spatial determinates in those risk areas.

Conclusion

Though a declining pattern of anemia among lactating mothers was observed from 2005 to 2011, it increases from 2011 to 2016 in almost all regions with a higher prevalence in Afar and Somali regions. Besides, it was spatially clustered across regions in Ethiopia. The most prominent risk areas of anemia were again detected in Afar and Somali regions more or less consistently overtime in the last one and half-decade. Therefore, public health intervention activities designed in a targeted approach to impact high-risk populations as well as geographic regions were vital to reduce anemia among lactating mothers in Ethiopia.

Acknowledgments

The authors would like to thank MEASURE DHS for their permission to access the DHS dataset.

List of abbreviation

CSA

Central Statistical Agency

EA

Enumeration Area

EDHS

Ethiopian Demographic and Health survey

SNNP

South Nation Nationality and Peoples Region

WHO

World Health Organization

Data Availability

As Ethiopian demographic and health survey is part of demographic and health survey (DHS), it is publicly available data. Any researcher can access data after becoming an Authorized user. Once registered and access permission has been provided, users may download the datasets from the required countries free of charge. Therefore, all the data underlying the findings are freely available from www.measuredhs.com.

Funding Statement

The author(s) received no specific funding for this work.

References

  • 1.Geneva S. Haemoglobin Concentrations for the Diagnosis of Anaemia and Assessment of Severity. Vitamin and Mineral Nutrition Information System. Document Reference WHO. NMH/NHD/MNM/11.1. http://www.who.int/entity/vmnis/indicators/haemoglobin …, 2011.
  • 2.Organization WH. Assessing the iron status of populations: report of a joint World Health Organization/Centers for Disease Control and Prevention technical consultation on the assessment of iron status at the population level.: Geneva, Switzerland. world health organization, 2007
  • 3.De Benoist B, Cogswell M, Egli I, McLean E. Worldwide prevalence of anaemia 1993–2005; WHO Global Database of anaemia. 2008. [DOI] [PubMed] [Google Scholar]
  • 4.Stevens GA, Finucane MM, De-Regil LM, Paciorek CJ, Flaxman SR, Branca F, et al. Global, regional, and national trends in haemoglobin concentration and prevalence of total and severe anaemia in children and pregnant and non-pregnant women for 1995–2011: a systematic analysis of population-representative data. The Lancet Global Health. 2013;1(1):e16–e25. 10.1016/S2214-109X(13)70001-9 [DOI] [PMC free article] [PubMed] [Google Scholar]
  • 5.Central Statistical Agency (CSA) [Ethiopia] and ICF:2005. Ethiopia Demographic and Health Survey 2005. Addis Ababa, Ethiopia, and Rockville, Maryland, USA: CSA and ICF, 2005. [Google Scholar]
  • 6.Central Statistical Agency (CSA) [Ethiopia] and ICF:2011. Ethiopia Demographic and Health Survey 2011 Addis Ababa, Ethiopia, and Rockville, Maryland, USA: CSA and ICF, 2011. [Google Scholar]
  • 7.Central Statistical Agency (CSA) [Ethiopia] and ICF:2016. Ethiopia Demographic and Health Survey 2016 Addis Ababa, Ethiopia, and Rockville, Maryland, USA: CSA and ICF, 2016. [Google Scholar]
  • 8.Melku M, Addis Z, Alem M, Enawgaw B. Prevalence and predictors of maternal anemia during pregnancy in Gondar, Northwest Ethiopia: an institutional based cross-sectional study. Anemia. 2014;2014. [DOI] [PMC free article] [PubMed] [Google Scholar]
  • 9.Bekele A, Tilahun M, Mekuria A. Prevalence of anemia and Its associated factors among pregnant women attending antenatal care in health institutions of Arba Minch town, Gamo Gofa Zone, Ethiopia: A Cross-sectional study. Anemia. 2016;2016. [DOI] [PMC free article] [PubMed] [Google Scholar]
  • 10.Abriha A, Yesuf ME, Wassie MM. Prevalence and associated factors of anemia among pregnant women of Mekelle town: a cross sectional study. BMC research notes. 2014;7(1):888. [DOI] [PMC free article] [PubMed] [Google Scholar]
  • 11.Kefiyalew F, Zemene E, Asres Y, Gedefaw L. Anemia among pregnant women in Southeast Ethiopia: prevalence, severity and associated risk factors. BMC research notes. 2014;7(1):771. [DOI] [PMC free article] [PubMed] [Google Scholar]
  • 12.Gutema B, Adissu W, Asress Y, Gedefaw L. Anemia and associated factors among school-age children in Filtu Town, Somali region, Southeast Ethiopia. BMC hematology. 2014;14(1):13 10.1186/2052-1839-14-13 [DOI] [PMC free article] [PubMed] [Google Scholar]
  • 13.Asres Y, Yemane T, Gedefaw L. Determinant factors of anemia among nonpregnant women of childbearing age in southwest Ethiopia: a community based study. International scholarly research notices. 2014;2014. [DOI] [PMC free article] [PubMed] [Google Scholar]
  • 14.Haidar JA, Pobocik RS. Iron deficiency anemia is not a rare problem among women of reproductive ages in Ethiopia: a community based cross sectional study. BMC Hematology. 2009;9(1):7. [DOI] [PMC free article] [PubMed] [Google Scholar]
  • 15.Umeta M, Haidar J, Demissie T, Akalu G, Ayana G. Iron deficiency anaemia among women of reproductive age in nine administrative regions of Ethiopia. Ethiop J Health Dev. 2008;22(3):252–8. [Google Scholar]
  • 16.Kibret KT, Chojenta C, D’Arcy E, Loxton D. Spatial distribution and determinant factors of anaemia among women of reproductive age in Ethiopia: a multilevel and spatial analysis. BMJ open. 2019;9(4):e027276 10.1136/bmjopen-2018-027276 [DOI] [PMC free article] [PubMed] [Google Scholar]
  • 17.Ejigu BA, Wencheko E, Berhane K. Spatial pattern and determinants of anaemia in Ethiopia. PloS one. 2018;13(5). [DOI] [PMC free article] [PubMed] [Google Scholar]
  • 18.Kassebaum NJ, Jasrasaria R, Naghavi M, Wulf SK, Johns N, Lozano R, et al. A systematic analysis of global anemia burden from 1990 to 2010. Blood. 2014;123(5):615–24. 10.1182/blood-2013-06-508325 [DOI] [PMC free article] [PubMed] [Google Scholar]
  • 19.Lover AA, Hartman M, Chia KS, Heymann DL. Demographic and spatial predictors of anemia in women of reproductive age in Timor-Leste: implications for health program prioritization. PloS one. 2014;9(3):e91252 10.1371/journal.pone.0091252 [DOI] [PMC free article] [PubMed] [Google Scholar]
  • 20.Ross JS, Thomas EL. Iron deficiency anemia and maternal mortality. Working Notes Series. 1996;3. [Google Scholar]
  • 21.Albacar G, Sans T, Martín-Santos R, García-Esteve L, Guillamat R, Sanjuan J, et al. An association between plasma ferritin concentrations measured 48 h after delivery and postpartum depression. Journal of affective disorders. 2011;131(1–3):136–42. 10.1016/j.jad.2010.11.006 [DOI] [PubMed] [Google Scholar]
  • 22.Corwin EJ, Murray-Kolb LE, Beard JL. Low hemoglobin level is a risk factor for postpartum depression. The Journal of nutrition. 2003;133(12):4139–42. 10.1093/jn/133.12.4139 [DOI] [PubMed] [Google Scholar]
  • 23.Aghamohammadi A, Zafari M, Tofighi M. High maternal hemoglobin concentration in first trimester as risk factor for pregnancy induced hypertension. Caspian journal of internal medicine. 2011;2(1):194 [PMC free article] [PubMed] [Google Scholar]
  • 24.Zafar T, Iqbal Z. Iron status in preeclampsia. The Professional Medical Journal. 2008;15(01):74–80. [Google Scholar]
  • 25.Rahman MM, Abe SK, Rahman MS, Kanda M, Narita S, Bilano V, et al. Maternal anemia and risk of adverse birth and health outcomes in low-and middle-income countries: systematic review and meta-analysis, 2. The American journal of clinical nutrition. 2016;103(2):495–504. 10.3945/ajcn.115.107896 [DOI] [PubMed] [Google Scholar]
  • 26.Targets WGN. 2025: anaemia policy brief Geneva: World Health Organization; 2014. [Google Scholar]
  • 27.Domellöf M, Lönnerdal B, Dewey KG, Cohen RJ, Hernell O. Iron, zinc, and copper concentrations in breast milk are independent of maternal mineral status. The American journal of clinical nutrition. 2004;79(1):111–5. 10.1093/ajcn/79.1.111 [DOI] [PubMed] [Google Scholar]
  • 28.Bodnar LM, Scanlon KS, Freedman DS, Siega-Riz AM, Cogswell ME. High prevalence of postpartum anemia among low-income women in the United States. American journal of obstetrics and gynecology. 2001;185(2):438–43. 10.1067/mob.2001.115996 [DOI] [PubMed] [Google Scholar]
  • 29.Sserunjogi L, Scheutz F, Whyte SR. Postnatal anaemia: neglected problems and missed opportunities in Uganda. Health policy and planning. 2003;18(2):225–31. 10.1093/heapol/czg027 [DOI] [PubMed] [Google Scholar]
  • 30.Axemo P, Liljestrand J, Bergström S, Gebre-Medhin M. Aetiology of late fetal death in Maputo. Gynecologic and obstetric investigation. 1995;39(2):103–9. 10.1159/000292389 [DOI] [PubMed] [Google Scholar]
  • 31.Lakew Y, Biadgilign S, Haile D. Anaemia prevalence and associated factors among lactating mothers in Ethiopia: evidence from the 2005 and 2011 demographic and health surveys. BMJ open. 2015;5(4):e006001 10.1136/bmjopen-2014-006001 [DOI] [PMC free article] [PubMed] [Google Scholar]
  • 32.Roba KT, O'Connor TP, Belachew T, O'Brien NM. Seasonal variation in nutritional status and anemia among lactating mothers in two agro-ecological zones of rural Ethiopia: A longitudinal study. Nutrition. 2015;31(10):1213–8. 10.1016/j.nut.2015.03.007 [DOI] [PubMed] [Google Scholar]
  • 33.Teshale AB. Community and Individual level Factors Associated with Anemia among Lactating mothers in Ethiopia using data from Ethiopian Demographic and Health Survey, 2016; Multilevel analysis. 2020. [DOI] [PMC free article] [PubMed] [Google Scholar]
  • 34.Bates I, McKew S, Sarkinfada F. Anaemia: a useful indicator of neglected disease burden and control. PLoS medicine. 2007;4(8):e231 10.1371/journal.pmed.0040231 [DOI] [PMC free article] [PubMed] [Google Scholar]
  • 35.Rutstein SO, Rojas G. Guide to DHS statistics. Calverton, MD: ORC Macro; 2006;38. [Google Scholar]
  • 36.Anselin L, Sridharan S, Gholston S. Using exploratory spatial data analysis to leverage social indicator databases: the discovery of interesting patterns. Social Indicators Research. 2007;82(2):287–309. [Google Scholar]
  • 37.Krivoruchko K. Empirical bayesian kriging. ArcUser Fall. 2012:6–10. [Google Scholar]
  • 38.Zulu LC, Kalipeni E, Johannes E. Analyzing spatial clustering and the spatiotemporal nature and trends of HIV/AIDS prevalence using GIS: the case of Malawi, 1994–2010. BMC infectious diseases. 2014;14(1):285. [DOI] [PMC free article] [PubMed] [Google Scholar]
  • 39.Naish S, Tong S. Hot spot detection and spatio-temporal dynamics of dengue in Queensland, Australia. The International Archives of Photogrammetry, Remote Sensing and Spatial Information Sciences. 2014;40(8):197. [Google Scholar]
  • 40.Mitas L, Mitasova H. Spatial interpolation. Geographical information systems: principles, techniques, management and applications. 1999;1(2). [Google Scholar]
  • 41.Tiwari N, Adhikari C, Tewari A, Kandpal V. Investigation of geo-spatial hotspots for the occurrence of tuberculosis in Almora district, India, using GIS and spatial scan statistic. International journal of health geographics. 2006;5(1):33. [DOI] [PMC free article] [PubMed] [Google Scholar]
  • 42.Kulldorff M. inventorSaTScan-Software for the Spatial. Temporal and Space-Time Scan Statistic. 2015. [Google Scholar]
  • 43.Institute EPH. Ethiopia national food consumption survey. Ethiopian Public Health Institute (EPHI) Addis Ababa (Ethiopia); 2013. [Google Scholar]
  • 44.Berhane G, Paulos Z, Tafere K, Tamru S. Foodgrain consumption and calorie intake patterns in Ethiopia. IFPRI Ethiopia Strategy Support Program II (ESSP II) Working Paper. 2011;23.
  • 45.Chaya N. Poor access to health Services: Ways Ethiopia is overcoming it. Res Comment. 2007;2(2):1–6. [Google Scholar]
  • 46.Tadesse M, Alemu B, Bekele G, Tebikew T, Chamberlin J, Benson T. Atlas of the Ethiopian rural economy: Intl Food Policy Res Inst; 2006. [Google Scholar]
  • 47.Mara D, Lane J, Scott B, Trouba D. Sanitation and health. PLoS Med. 2010;7(11):e1000363 10.1371/journal.pmed.1000363 [DOI] [PMC free article] [PubMed] [Google Scholar]
  • 48.Tay SCK, Nani EA, Walana W. Parasitic infections and maternal anaemia among expectant mothers in the Dangme East District of Ghana. BMC research notes. 2017;10(1):3 10.1186/s13104-016-2327-5 [DOI] [PMC free article] [PubMed] [Google Scholar]
  • 49.Misganaw A, Haregu TN, Deribe K, Tessema GA, Deribew A, Melaku YA, et al. National mortality burden due to communicable, non-communicable, and other diseases in Ethiopia, 1990–2015: findings from the Global Burden of Disease Study 2015. Population health metrics. 2017;15(1):29. [DOI] [PMC free article] [PubMed] [Google Scholar]
  • 50.Strasser R. Rural health around the world: challenges and solutions. Family practice. 2003;20(4):457–63. 10.1093/fampra/cmg422 [DOI] [PubMed] [Google Scholar]
  • 51.Haile D, Tabar L, Lakew Y. Differences in spatial distributions of iron supplementation use among pregnant women and associated factors in Ethiopia: evidence from the 2011 national population based survey. BMC pregnancy and childbirth. 2017;17(1):33 10.1186/s12884-016-1210-7 [DOI] [PMC free article] [PubMed] [Google Scholar]
  • 52.Gebre A, Debie A, Berhane A, Redddy PS. Determinants of compliance to iron-folic acid supplementation among pregnant women in pastoral communities of Afar region: the cases of Mille and Assaita Districts, Afar, Ethiopia-2015. Medico Res Chronicles. 2017;4:352–62. [Google Scholar]
  • 53.Abdurahman A. Haemoglobin Concentration Among Camel Milk and Cow Milk Consuming Pastoralist Communities of Somali Region, Eastern Ethiopia: Addis Ababa University; 2018. [Google Scholar]

Decision Letter 0

William Joe

15 Jan 2020

PONE-D-19-30322

Spatial patterns of anemia among lactating mothers in Ethiopia: Data from Ethiopian Demographic and Health Surveys (2005, 2011 and 2016)

PLOS ONE

Dear Mr liyew,

Thank you for submitting your manuscript to PLOS ONE. After careful consideration, we feel that it has merit but does not fully meet PLOS ONE’s publication criteria as it currently stands. Therefore, we invite you to submit a revised version of the manuscript that addresses the points raised during the review process.

We would appreciate receiving your revised manuscript by Feb 29 2020 11:59PM. When you are ready to submit your revision, log on to https://www.editorialmanager.com/pone/ and select the 'Submissions Needing Revision' folder to locate your manuscript file.

If you would like to make changes to your financial disclosure, please include your updated statement in your cover letter.

To enhance the reproducibility of your results, we recommend that if applicable you deposit your laboratory protocols in protocols.io, where a protocol can be assigned its own identifier (DOI) such that it can be cited independently in the future. For instructions see: http://journals.plos.org/plosone/s/submission-guidelines#loc-laboratory-protocols

Please include the following items when submitting your revised manuscript:

  • A rebuttal letter that responds to each point raised by the academic editor and reviewer(s). This letter should be uploaded as separate file and labeled 'Response to Reviewers'.

  • A marked-up copy of your manuscript that highlights changes made to the original version. This file should be uploaded as separate file and labeled 'Revised Manuscript with Track Changes'.

  • An unmarked version of your revised paper without tracked changes. This file should be uploaded as separate file and labeled 'Manuscript'.

Please note while forming your response, if your article is accepted, you may have the opportunity to make the peer review history publicly available. The record will include editor decision letters (with reviews) and your responses to reviewer comments. If eligible, we will contact you to opt in or out.

We look forward to receiving your revised manuscript.

Kind regards,

William Joe

Academic Editor

PLOS ONE

Journal requirements:

When submitting your revision, we need you to address these additional requirements.

1. Please ensure that your manuscript meets PLOS ONE's style requirements, including those for file naming. The PLOS ONE style templates can be found at

http://www.journals.plos.org/plosone/s/file?id=wjVg/PLOSOne_formatting_sample_main_body.pdf and http://www.journals.plos.org/plosone/s/file?id=ba62/PLOSOne_formatting_sample_title_authors_affiliations.pdf

2. We noticed you have some minor occurrence of overlapping text with the following previous publication(s), which needs to be addressed:

https://www.ncbi.nlm.nih.gov/pmc/articles/PMC5472978/

https://www.ncbi.nlm.nih.gov/pubmed/30948614

In your revision ensure you cite all your sources (including your own works), and quote or rephrase any duplicated text outside the methods section. Further consideration is dependent on these concerns being addressed.

3. Please ensure you have thoroughly discussed any potential limitations of this study within the Discussion section, for example, the potential impact of confounding variables.

4. We note that Figures 1, 3, 5, 6, 7 and 8 in your submission contain [map/satellite] images which may be copyrighted. All PLOS content is published under the Creative Commons Attribution License (CC BY 4.0), which means that the manuscript, images, and Supporting Information files will be freely available online, and any third party is permitted to access, download, copy, distribute, and use these materials in any way, even commercially, with proper attribution. For these reasons, we cannot publish previously copyrighted maps or satellite images created using proprietary data, such as Google software (Google Maps, Street View, and Earth). For more information, see our copyright guidelines: http://journals.plos.org/plosone/s/licenses-and-copyright.

We require you to either (1) present written permission from the copyright holder to publish these figures specifically under the CC BY 4.0 license, or (2) remove the figures from your submission:

a)    You may seek permission from the original copyright holder of Figures 1, 3, 5, 6, 7 and 8 to publish the content specifically under the CC BY 4.0 license.  

We recommend that you contact the original copyright holder with the Content Permission Form (http://journals.plos.org/plosone/s/file?id=7c09/content-permission-form.pdf) and the following text:

“I request permission for the open-access journal PLOS ONE to publish XXX under the Creative Commons Attribution License (CCAL) CC BY 4.0 (http://creativecommons.org/licenses/by/4.0/). Please be aware that this license allows unrestricted use and distribution, even commercially, by third parties. Please reply and provide explicit written permission to publish XXX under a CC BY license and complete the attached form.”

Please upload the completed Content Permission Form or other proof of granted permissions as an "Other" file with your submission.

In the figure caption of the copyrighted figure, please include the following text: “Reprinted from [ref] under a CC BY license, with permission from [name of publisher], original copyright [original copyright year].”

b)    If you are unable to obtain permission from the original copyright holder to publish these figures under the CC BY 4.0 license or if the copyright holder’s requirements are incompatible with the CC BY 4.0 license, please either i) remove the figure or ii) supply a replacement figure that complies with the CC BY 4.0 license. Please check copyright information on all replacement figures and update the figure caption with source information. If applicable, please specify in the figure caption text when a figure is similar but not identical to the original image and is therefore for illustrative purposes only.

The following resources for replacing copyrighted map figures may be helpful:

USGS National Map Viewer (public domain): http://viewer.nationalmap.gov/viewer/

The Gateway to Astronaut Photography of Earth (public domain): http://eol.jsc.nasa.gov/sseop/clickmap/

Maps at the CIA (public domain): https://www.cia.gov/library/publications/the-world-factbook/index.html and https://www.cia.gov/library/publications/cia-maps-publications/index.html

NASA Earth Observatory (public domain): http://earthobservatory.nasa.gov/

Landsat: http://landsat.visibleearth.nasa.gov/

USGS EROS (Earth Resources Observatory and Science (EROS) Center) (public domain): http://eros.usgs.gov/#

Natural Earth (public domain): http://www.naturalearthdata.com/

5. PLOS requires an ORCID iD for the corresponding author in Editorial Manager on papers submitted after December 6th, 2016. Please ensure that you have an ORCID iD and that it is validated in Editorial Manager. To do this, go to ‘Update my Information’ (in the upper left-hand corner of the main menu), and click on the Fetch/Validate link next to the ORCID field. This will take you to the ORCID site and allow you to create a new iD or authenticate a pre-existing iD in Editorial Manager. Please see the following video for instructions on linking an ORCID iD to your Editorial Manager account: https://www.youtube.com/watch?v=_xcclfuvtxQ

[Note: HTML markup is below. Please do not edit.]

Reviewers' comments:

Reviewer's Responses to Questions

Comments to the Author

1. Is the manuscript technically sound, and do the data support the conclusions?

The manuscript must describe a technically sound piece of scientific research with data that supports the conclusions. Experiments must have been conducted rigorously, with appropriate controls, replication, and sample sizes. The conclusions must be drawn appropriately based on the data presented.

Reviewer #1: No

**********

2. Has the statistical analysis been performed appropriately and rigorously?

Reviewer #1: No

**********

3. Have the authors made all data underlying the findings in their manuscript fully available?

The PLOS Data policy requires authors to make all data underlying the findings described in their manuscript fully available without restriction, with rare exception (please refer to the Data Availability Statement in the manuscript PDF file). The data should be provided as part of the manuscript or its supporting information, or deposited to a public repository. For example, in addition to summary statistics, the data points behind means, medians and variance measures should be available. If there are restrictions on publicly sharing data—e.g. participant privacy or use of data from a third party—those must be specified.

Reviewer #1: No

**********

4. Is the manuscript presented in an intelligible fashion and written in standard English?

PLOS ONE does not copyedit accepted manuscripts, so the language in submitted articles must be clear, correct, and unambiguous. Any typographical or grammatical errors should be corrected at revision, so please note any specific errors here.

Reviewer #1: No

**********

5. Review Comments to the Author

Please use the space provided to explain your answers to the questions above. You may also include additional comments for the author, including concerns about dual publication, research ethics, or publication ethics. (Please upload your review as an attachment if it exceeds 20,000 characters)

Reviewer #1: Reviewer’s Report

Spatial patterns of anemia among lactating mothers in Ethiopia: Data from Ethiopian Demographic and Health Surveys (2005, 2011 and 2016)

Anemia among human population is a major public health problem that affects populations in both rich and poor countries. Its primary cause is iron deficiency (IDA) and other various biological and non-biological factors. Anaemia is a common health problem in Ethiopia also where the latest DHS survey found around 24 percent women of reproductive age (WRA) were anaemic, ranges from a low of around only 16 percent to a high of close to 60 percent in different parts of Ethiopia. In the context, the spatial exploration of anaemia especially among lactating women is also an important issue and the authors have tried to study the concentration and clustering of one of the major health problems but the authors have missed somewhere and needs further improvement in the manuscripts. The constructive comments and suggestions are as follows-

1. Introduction section has started in right way with definition and cause of anaemia with most related to biological factors but missing non-biological factors. Next, anaemia as a public health problem has discuses in brief flowed by global scenario of Anaemia. Then adverse effect of maternal anaemia has been discussed before moving on scenario of anaemia in Ethiopia. Introduction section ends with reason for selecting lactating women for the study purpose.

2. Here, some important aspects found missing. Like, previous studies pertain to anaemia among WRA in Ethiopia, evidences and studies related to spatial pattern of anaemia among WRA in the study country. Reason for considering lactating women for study needs to be strengthened. Authors are also advised to do review of literature extensively as many relevant studies is available on anaemia among WRA in Ethiopia conducted on same data source at different point of time. Some studies are very recent with latest round of country DHS data.

3. Data source, sampling design and setting needs to be rewrite in appropriate manner. Whereas measurements should be different sections and can be written accordingly. It would have been better if researchers would have provided region wise sample over the three study period.

4. As the author mentioned “The haemoglobin level was measured for those eligible mothers after having consent and it was adjusted for altitude”. This needs to be clarified as DHS data for the country provide measured haemoglobin level and the adjusted haemoglobin for altitude. So, which one indicator authors have used in the study. The cut off used in this study has not been mentioned in the methodology section.

5. Spatial analysis section starts with autocorrelation analysis to spatial scan statistical analysis. Here, the concern is that in many section, authors have provided only the theoretical notions of such the method but missed to elaborate in accordance and need of the undertaken study. Like, how SAC has been executed in the study has found missing. Second, section on SAC mentioned somewhere “leads to rejection of null hypothesis and indicates the presence of spatial correlation”. Does the author have posed research question in same way?

6. Hot spot analysis (HSA) using Gettis-OrdGi* statistics is a appropriate way to check the variation in spatiality across the study areas but missed to the process undertaken in the study. It would be better if authors had been reviewed available study for spatial analysis of anaemia in Ethiopia by Kelemu T.K, et (2019) study using latest wave of Ethiopia DHS data. So, author is advised to go through the paper and restructure the section appropriately.

7. Overall methodology section needs to tightened and strengthened.

8. Results are very poorly interpreted, seems researchers are in hurry. So, results sections had to be written in well manner. Figures 3 can be interpreted region wise and changes over period would be better idea. Interpretation in figure heading is not the academic practices, so author is suggested to follow the rigour and pattern/outline to prepare the manuscript.

9. It would have been better to elaborate the section on emerging hotspot areas based on the data available for the areas before doing interpolation analysis to detect the primary and secondary clusters.

10. In spatial scan analysis, authors have tires to provide glimpse of significant clusters separately for each survey period but it they can provide reason wise prominent clusters, it would be better for planning and programme intervention at the regional level within Ethiopia.

11. Table 3 does not have catchy and reliable approach. It would have been better if the researchers would have been mentioned detailed with name or within each of the cluster with maximum and minimum concentration of anaemic lactating mothers. Second, researcher can match for enumeration areas which were found common during the period of 2005, 2011 and 2016, cluster wise. The format of table 3 provided in the text can be produced as supplementary table or appendix table.

12. Discussion section needs to rewrite as it is just findings of study only in very limited way. It is important to discuss the findings of the study with other previous and existing studies on the issues.

13. In the conclusion section authors have mentioned “Findings suggest that giving priority attentions would be important on water, and other nutrition-related interventions on the identified hotspot areas to prevent and control anaemia incidence among lactating mothers”. The concern is that from where these findings emerged as it is not found anywhere and anyway in the manuscript.

14. Maps and figures are also not readable as are very hazy. So authors are also advised to rework for figure and maps to make it clear before submitting it the journal.

Overall, the paper needs to revise with appropriate framework for the country undertaken for the policy and programmatic point of view.

**********

6. PLOS authors have the option to publish the peer review history of their article (what does this mean?). If published, this will include your full peer review and any attached files.

If you choose “no”, your identity will remain anonymous but your review may still be made public.

Do you want your identity to be public for this peer review? For information about this choice, including consent withdrawal, please see our Privacy Policy.

Reviewer #1: Yes: Rajesh Raushan

[NOTE: If reviewer comments were submitted as an attachment file, they will be attached to this email and accessible via the submission site. Please log into your account, locate the manuscript record, and check for the action link "View Attachments". If this link does not appear, there are no attachment files to be viewed.]

While revising your submission, please upload your figure files to the Preflight Analysis and Conversion Engine (PACE) digital diagnostic tool, https://pacev2.apexcovantage.com/. PACE helps ensure that figures meet PLOS requirements. To use PACE, you must first register as a user. Registration is free. Then, login and navigate to the UPLOAD tab, where you will find detailed instructions on how to use the tool. If you encounter any issues or have any questions when using PACE, please email us at figures@plos.org. Please note that Supporting Information files do not need this step.

Attachment

Submitted filename: Reviewer Report.docx

PLoS One. 2020 Aug 6;15(8):e0237147. doi: 10.1371/journal.pone.0237147.r002

Author response to Decision Letter 0


24 Mar 2020

Rebuttal letter Date 1/27/2020

PONE-D-19-30322

Spatial Patterns of Anemia among Lactating Mothers in Ethiopia: Data from Ethiopian Demographic and Health Surveys (2005, 2011 and 2016)

Alemneh Mekuriaw Liyew

Plos One

Dear all,

We would like to thank for these constructive, building and improvable comments on this manuscript that would improve substance and content of the manuscript. We considered each comments and clarification questions of editors and reviewers on the manuscript thoroughly. Our point-by-point responses for each comment and questions are described in detailed on the following pages. Further, the details of changes were shown by track changes in the supplementary document attached. The manuscript language was checked by language professionals and we follow journal guideline. I have attached recent comments in point by point response.

Version

Comments from reviewer

Comment 1: Introduction section has started in right way with definition and cause of anaemia with most related to biological factors but missing non-biological factors. Next, anaemia as a public health problem has discuses in brief flowed by global scenario of Anaemia. Then adverse effect of maternal anaemia has been discussed before moving on scenario of anaemia in Ethiopia. Introduction section ends with reason for selecting lactating women for the study purpose.

Response 1: Thanks in advance both editor and reviewer for your critical view to advance the quality of our manuscript. We improved accordingly.

Comment 2: “Here, some important aspects found missing. Like, previous studies pertain to anaemia among WRA in Ethiopia, evidences and studies related to spatial pattern of anaemia among WRA in the study country. Reason for considering lactating women for study needs to be strengthened. Authors are also advised to do review of literature extensively as many relevant studies is available on anaemia among WRA in Ethiopia conducted on same data source at different point of time. Some studies are very recent with latest round of country DHS data.”

Response 2: Thanks in advance both editor and reviewer for comments. First based on your constructive comment we have improved the justification for why we focused on lactating mothers accordingly. The introduction section Line 23-30 Page 1. Second, even though we considered some publications on anemia among reproductive age women ,our primary intention was focusing on the studies conducted on anemia among lactating mothers. However, your comment strongly convinced as. Therefore, we added the literatures on women of reproductive age like “ Kibret KT, Chojenta C, D’Arcy E, Loxton D. Spatial distribution and determinant factors of anaemia among women of reproductive age in Ethiopia: a multilevel and spatial analysis. BMJ open. 2019;9(4):e027276 and Ejigu BA, Wencheko E, Berhane K. Spatial pattern and determinants of anaemia in Ethiopia. PloS one. 2018;13(5” and others.

Comment 3: Data source, sampling design and setting needs to be rewrite in appropriate manner. Whereas measurements should be different sections and can be written accordingly. It would have been better if researchers would have provided region wise sample over the three study period.

Response 3: Thank you reviewer and editor for your constructive comment. We really appreciated the comment and totally converted sample to region wise approach since the further analysis was region based it is good to provide region based sampling information for the data set. Method section Line 100, page 4. In addition the “Data measurement” was provided in separate section as per your comment and data source, sampling design and setting were strengthened accordingly.

Comment 4: “As the author mentioned “The haemoglobin level was measured for those eligible mothers after having consent and it was adjusted for altitude”. This needs to be clarified as DHS data for the country provide measured haemoglobin level and the adjusted haemoglobin for altitude. So, which one indicator authors have used in the study. The cut off used in this study has not been mentioned in the methodology section.”

Response 4: Thanks reviewer and editor. This section was rewritten again and corrected as follows. “In Ethiopia, Data collection on anemia as key indicator in national surveys was started in 2005 survey and continued in the next two surveys (2011 and 2016). In all surveys , the hemoglobin level was measured for those eligible mothers after having consent and it was adjusted for altitude (18-20). Therefore, the current study was based on the altitude adjusted haemoglobin level which was already provided in the EDHS data. Finally, the women with hemoglobin level <120 g/L were considered as anemic. “Method section Line 89-94, page 4. This cut off point was used from WHO definition of anemia for non-pregnant women as it was indicated in background section.

Comment 5: Spatial analysis section starts with autocorrelation analysis to spatial scan statistical analysis. Here, the concern is that in many section, authors have provided only the theoretical notions of such the method but missed to elaborate in accordance and need of the undertaken study. Like, how SAC has been executed in the study has found missing. Second, section on SAC mentioned somewhere “leads to rejection of null hypothesis and indicates the presence of spatial correlation”. Does the author have posed research question in same way?

Response 5: Thanks reviewer and editor. We have rewritten this section under heading “Spatial analysis” just by avoiding the subsections. We paraphrased each section as a single paragraph in coherent way which shows the sequence of the spatial analysis methods conducted. We again indicated the purpose of conducting each analysis methods in relation with the theoretical notion of the methods. The second point here was the concept of the following sentence. “Leads to rejection of null hypothesis and indicates the presence of spatial correlation”. Does the author have posed research question in same way?” This sentence was used just to indicate that how the spatial autocorrelation works. When we conduct spatial autocorrelation analysis generally the null hypothesis was random distribution of the disease of interest over the study area. Therefore when we get significant global Moran’s index in spatial autocorrelation analysis result we reject the null hypothesis and deal with spatial clustering to detect further the local level clusters by using other analytic methods like hotspot analysis and spatial scan statistics. It was incorporated to indicate this general concept. However we have rephrased in the revised manuscript to avoid such confusion. Method section Line 106-145 Page 6

Comment 6: Hot spot analysis (HSA) using Gettis-OrdGi* statistics is a appropriate way to check the variation in spatiality across the study areas but missed to the process undertaken in the study. It would be better if authors had been reviewed available study for spatial analysis of anaemia in Ethiopia by Kelemu T.K, et (2019) study using latest wave of Ethiopia DHS data. So, author is advised to go through the paper and restructure the section appropriately.

Response 6: Thanks reviewer for your commitment just to improve our manuscript by searching such relevant studies. I hope we have benefited a lot to strengthen the manuscript. Therefore we have restructured the hotspot analysis and even other sections accordingly as I have described in response 5.

Comment 7: Overall methodology section needs to tightened and strengthened

Response 7: Thanks reviewer. Based on recommendation we go through the method section organized it as it was indicated in the track change document.

Comment 8: Results are very poorly interpreted, seems researchers are in hurry. So, results sections had to be written in well manner. Figures 3 can be interpreted region wise and changes over period would be better idea. Interpretation in figure heading is not the academic practices, so author is suggested to follow the rigour and pattern/outline to prepare the manuscript.

Response 8: Thank you reviewer for your valuable comment. Based on your comment the result section is rewritten again. We have avoided the interpretations in the figure heading and adjusted it according to the guideline in all figures. The source for the shape file for maps was also indicated at the figure heading.

Comment 9: It would have been better to elaborate the section on emerging hotspot areas based on the data available for the areas before doing interpolation analysis to detect the primary and secondary clusters.

Response 9: thanks reviewer. We provided the prominent risk areas based on the spatial scan statistics results and the spatial interpolation was conducted to detect the predicted risk areas for anemia in unsampled areas.

Comment 10: In spatial scan analysis, authors have tires to provide glimpse of significant clusters separately for each survey period but it they can provide reason wise prominent clusters, it would be better for planning and programme intervention at the regional level within Ethiopia.

Response 10: Thanks reviewer since the study involved the three surveys separately we were ended up with a number significant clusters. As per your comment currently we have focused on the most likely clusters only in each survey. As you justified in your comment, even the purpose of conducting spatial scan statistics than the hotspot analysis is to detect most prominent cluster for intervention especially in resource limited areas. Therefore, we welcomed your really constructive comment and acted accordingly.

Comment 11: Table 3 does not have catchy and reliable approach. It would have been better if the researchers would have been mentioned detailed with name or within each of the cluster with maximum and minimum concentration of anaemic lactating mothers. Second, researcher can match for enumeration areas which were found common during the period of 2005, 2011 and 2016, cluster wise. The format of table 3 provided in the text can be produced as supplementary table or appendix table

Response 11: thanks reviewer. Here again we appreciated your comment and reorganized the table by focusing on most likely clusters across each survey. However, we fail to provide the enumeration areas which were found common during three surveys. This was because the enumeration areas used in three periods were different in their number and type as it was indicated in the method section.

Comment 12: Discussion section needs to rewrite as it is just findings of study only in very limited way. It is important to discuss the findings of the study with other previous and existing studies on the issues.

Response 12: thanks reviewer as per your recommendation we reorganized the discussion in line with the adjustments made in result section.

Comment 13: In the conclusion section authors have mentioned “Findings suggest that giving priority attentions would be important on water, and other nutrition-related interventions on the identified hotspot areas to prevent and control anaemia incidence among lactating mothers”. The concern is that from where these findings emerged as it is not found anywhere and anyway in the manuscript.

Response 13: thank you reviewer for your wonderful comment. We have completely avoided this sentence and organized accordingly. Line 289-298 page 12.

Comment 14: Maps and figures are also not readable as are very hazy. So authors are also advised to rework for figure and maps to make it clear before submitting it the journal.

Response 14: thank you reviewer. We reworked all the figures and maps carefully. We hope all they are readable and clear in the revised manuscript.

Over all the comments were wonderful and we learn a lot from the comments.

Version two

Issues raised by academic editor

Thank you editor once again for critical consideration of our manuscript. Here is to declare that we have adjusted the following points based on your recommendation. We also reflected accordingly on the issues which require further clarification.

1. We have checked that our manuscript meets the plos one requirement

2. We have rephrased to avoid the text overlap with the previous publications.

3. We have included the potential limitations of the study in the discussion section.

4. Thank you editor for the constructive comments. Here we are interested to clarify the source of the figures. We kindly declare that all the figures and maps are our own works. The shape file for those maps was accessed from Ethiopian Central Statistical Agency and the geographic coordinates were accessed from measure DHS after being authorized and registered user. Therefore, we prepared all the maps used to show the spatial analysis in each survey by ArcGIS10.7 software. We indicated the source of the shape file at the right lower corner of each map and for more clarity we have also included the source of the shape file at the figure heading in all figures.

5. I the crospondng author included the ORCID in the revised submission.

Attachment

Submitted filename: response to reviewers.docx

Decision Letter 1

William Joe

7 May 2020

PONE-D-19-30322R1

Spatial patterns of anemia among lactating mothers in Ethiopia: Data from Ethiopian Demographic and Health Surveys (2005, 2011 and 2016)

PLOS ONE

Dear Mr liyew,

Thank you for submitting your manuscript to PLOS ONE. After careful consideration, we feel that it has merit but does not fully meet PLOS ONE’s publication criteria as it currently stands. Therefore, we invite you to submit a revised version of the manuscript that addresses the points raised during the review process.

We would appreciate receiving your revised manuscript by Jun 21 2020 11:59PM. When you are ready to submit your revision, log on to https://www.editorialmanager.com/pone/ and select the 'Submissions Needing Revision' folder to locate your manuscript file.

If you would like to make changes to your financial disclosure, please include your updated statement in your cover letter.

To enhance the reproducibility of your results, we recommend that if applicable you deposit your laboratory protocols in protocols.io, where a protocol can be assigned its own identifier (DOI) such that it can be cited independently in the future. For instructions see: http://journals.plos.org/plosone/s/submission-guidelines#loc-laboratory-protocols

Please include the following items when submitting your revised manuscript:

  • A rebuttal letter that responds to each point raised by the academic editor and reviewer(s). This letter should be uploaded as separate file and labeled 'Response to Reviewers'.

  • A marked-up copy of your manuscript that highlights changes made to the original version. This file should be uploaded as separate file and labeled 'Revised Manuscript with Track Changes'.

  • An unmarked version of your revised paper without tracked changes. This file should be uploaded as separate file and labeled 'Manuscript'.

Please note while forming your response, if your article is accepted, you may have the opportunity to make the peer review history publicly available. The record will include editor decision letters (with reviews) and your responses to reviewer comments. If eligible, we will contact you to opt in or out.

We look forward to receiving your revised manuscript.

Kind regards,

William Joe

Academic Editor

PLOS ONE

[Note: HTML markup is below. Please do not edit.]

Reviewers' comments:

Reviewer's Responses to Questions

Comments to the Author

1. If the authors have adequately addressed your comments raised in a previous round of review and you feel that this manuscript is now acceptable for publication, you may indicate that here to bypass the “Comments to the Author” section, enter your conflict of interest statement in the “Confidential to Editor” section, and submit your "Accept" recommendation.

Reviewer #1: All comments have been addressed

Reviewer #2: All comments have been addressed

**********

2. Is the manuscript technically sound, and do the data support the conclusions?

The manuscript must describe a technically sound piece of scientific research with data that supports the conclusions. Experiments must have been conducted rigorously, with appropriate controls, replication, and sample sizes. The conclusions must be drawn appropriately based on the data presented.

Reviewer #1: Partly

Reviewer #2: Yes

**********

3. Has the statistical analysis been performed appropriately and rigorously?

Reviewer #1: No

Reviewer #2: Yes

**********

4. Have the authors made all data underlying the findings in their manuscript fully available?

The PLOS Data policy requires authors to make all data underlying the findings described in their manuscript fully available without restriction, with rare exception (please refer to the Data Availability Statement in the manuscript PDF file). The data should be provided as part of the manuscript or its supporting information, or deposited to a public repository. For example, in addition to summary statistics, the data points behind means, medians and variance measures should be available. If there are restrictions on publicly sharing data—e.g. participant privacy or use of data from a third party—those must be specified.

Reviewer #1: No

Reviewer #2: Yes

**********

5. Is the manuscript presented in an intelligible fashion and written in standard English?

PLOS ONE does not copyedit accepted manuscripts, so the language in submitted articles must be clear, correct, and unambiguous. Any typographical or grammatical errors should be corrected at revision, so please note any specific errors here.

Reviewer #1: No

Reviewer #2: Yes

**********

6. Review Comments to the Author

Please use the space provided to explain your answers to the questions above. You may also include additional comments for the author, including concerns about dual publication, research ethics, or publication ethics. (Please upload your review as an attachment if it exceeds 20,000 characters)

Reviewer #1: Spatial Patterns of Anemia among Lactating Mothers in Ethiopia: Data from Ethiopian Demographic and Health Surveys (2005, 2011 and 2016)

Although, the revised paper shows improvement than the previous one but, still there is need to work on it to improve the quality and strength of the paper to meet the criteria of the said journal. Important question is why the spatial hotspot is in those areas. Using data for three points of time to make it comparable also needs logically justification. Some other important comments are as follows-

1. Keep the use of term consistent- like somewhere author used maternal, somewhere lactating and somewhere breastfeeding mothers.

2. Line no 50 are not well connected with line no 49.

3. Authors need to rewrite the data source and sampling section and data measurement section. As these two are overlapping.

4. Authors missed to include anaemia measurement method in Ethiopia and the cut off as well used in the study for lactating mothers.

5. Still results sections needs improvement and there is mismatch on table no, figure no etc. like figure no. 1, 2, 3, 4 etc has mentioned twice with two different headings.

6. Figures are missing at all in the revised edited version.

7. Authors are proving only spatial hotspot and cold spot of the anaemic lactating women, if I am not wrong. But, important is why these are so, is important question and can be worth of the paper.

8. Maps and some tables, figures are missing at all in the revised paper.

9. Authors can have look on the paper related to their concerned issues. https://journals.plos.org/plosone/article?id=10.1371/journal.pone.0197171

Thank you!!!

Reviewer #2: The authors have tried to address the issues raised in the previous review. However, authors still need to expand the discussion section by providing more explanation for the results and relating findings to previuos studies.

Also, weaknesses and strengths stated in the discussion section should be moved to a seperate section titled "Strengths and weaknesses"

**********

7. PLOS authors have the option to publish the peer review history of their article (what does this mean?). If published, this will include your full peer review and any attached files.

If you choose “no”, your identity will remain anonymous but your review may still be made public.

Do you want your identity to be public for this peer review? For information about this choice, including consent withdrawal, please see our Privacy Policy.

Reviewer #1: Yes: Rajesh Raushan

Reviewer #2: No

[NOTE: If reviewer comments were submitted as an attachment file, they will be attached to this email and accessible via the submission site. Please log into your account, locate the manuscript record, and check for the action link "View Attachments". If this link does not appear, there are no attachment files to be viewed.]

While revising your submission, please upload your figure files to the Preflight Analysis and Conversion Engine (PACE) digital diagnostic tool, https://pacev2.apexcovantage.com/. PACE helps ensure that figures meet PLOS requirements. To use PACE, you must first register as a user. Registration is free. Then, login and navigate to the UPLOAD tab, where you will find detailed instructions on how to use the tool. If you encounter any issues or have any questions when using PACE, please email us at figures@plos.org. Please note that Supporting Information files do not need this step.

Attachment

Submitted filename: Reviewer Comments08 April 2020.docx

PLoS One. 2020 Aug 6;15(8):e0237147. doi: 10.1371/journal.pone.0237147.r004

Author response to Decision Letter 1


20 May 2020

Date May 20/2020

To: PLOS ONE Journal

Subject Submitting Revised Manuscript after Reviewers comment

Manuscript title: Spatial Patterns of Anemia among Lactating Mothers in Ethiopia: Data from Ethiopian Demographic and Health Surveys (2005, 2011 and 2016)

Manuscript ID: PONE-D-19-30322R1

Dear editor/reviewers

We would like to thank you for your constructive comments on our manuscript. We really appreciate your continuous effort and academic commitment to strengthen our paper. Our point-by-point responses for each comment and questions are described as follow. The details of these changes were shown by track changes feature attached.

Point by point response for reviewers comment

For reviewer # 1

1. Why the spatial hotspot is in those areas. Authors are proving only spatial hotspot and cold spot of the anemic lactating women, if I am not wrong. But, important is why these are so, is important question and can be worth of the paper.

Author’s response: Thank you. We are very pleased to respond to this comment which is really important point that we missed in previous reflection.

Though iron supplementation is an essential service for prevention of anemia among lactating mothers, its coverage is very low in these pastoral regions (Afar and Somali) which might be responsible for a high prevalence and hotspot areas of anemia in these regions as compared to other parts of Ethiopia. In addition, the compliance of lactating mothers to the use of iron supplementation survice in these regions is below the recommended level (43). This might lead to an increased risk of anemia among lactating mothers in Afar and Somali regions compared to other regions. The other possible reason behind the consistent hotspot areas in these regions could be nutritional problems such as lack of diatery diversity, consumption of camel and cow milk which had relatively low iron content and the seasonal variation of food they consume (pastoral community). We have included this justification in the revised document (see line 393-401 of the discussion section).

2. Using data for three points of time to make it comparable also needs logically justification.

Author’s response: To date, the risk areas (hot spot) of anemia among lactating mothers in Ethiopia are not identified. Thus, this study aimed to explore the spatial pattern of anemia among lactating mothers in Ethiopia over the last one and half-decades at the national level to point out whether there was either the shift or improvement in anemia risk areas following intervention programs in between the survey periods in Ethiopia. Therefore, detecting the geographic variation of anemia during lactation is important to prioritize and design targeted intervention programs to reduce anemia especially in those areas with consistently higher risk of anemia over time (see line 80-86 section of introduction part).

3. Keep the use of term consistent- like somewhere author used maternal, somewhere lactating and somewhere breastfeeding mothers.

Author’s response: Thank you reviewer. We have modified accordingly in the revised manuscript (as you can see the track change feature).

4. Line no 50 are not well connected with line no 49.

Author’s response: thank you. It is corrected accordingly

5. Authors need to rewrite the data source and sampling section and data measurement section. As these two are overlapping.

Author’s response: Thank you. We have reorganized this section in logical and sequential approach

6. Authors missed to include anemia measurement method in Ethiopia and the cutoff point as well used in the study for lactating mothers.

Author’s response: Thank you. We have included the measurement of anemia in the revised manuscript (see line 143 -149 of method section).

7. Still results sections needs improvement and there is mismatch on table no, figure no etc. like figure no. 1, 2, 3, 4 etc has mentioned twice with two different headings.

Author’s response: Thanks. Sorry for the inconvenience we made. We have corrected accordingly and included in the revised manuscript.

8. Maps and some tables, figures are missing and some are not visible at all in the revised paper.

Author’s response: thanks you reviewer. We have reworked all the maps, figures and tables to make them visible. However, as you have observed in the previous two submissions, when we prepare the multi panel figure using GIMP software the quality and visibility of the figure diminishes. Therefore, in this revision we have prepared the figures separately and labeled like Fig 5(a), Fig 5(b), Fig 5(c) e.t.c.

9. Has the statistical analysis been performed appropriately and rigorously?

Authors response: We reanalyzed the data rigorously to make the results more visible and readable using appropriate spatial analytic tool. For this purpose we presented each figure separately ( see the revised manuscript).

10. Have the authors made all data underlying the findings in their manuscript fully available?

Authors response: All the data underlying the findings were fully available in the manuscript. We declare that the authors did not have any special access privileges that others would not have. The data are publicly available upon reasonable request of the DHS MEASURE website through archive@measuredhs.com. after being authorized user. We also included this text in the revised manuscript.

11. Is the manuscript presented in an intelligible fashion and written in Standard English?

Authors response: we reedited the whole manuscript by consulting senior English language professionals in our university to improve the grammatical quality of the article and to meet the journal standard.

For reviewer # 2

1. Authors still need to expand the discussion section by providing more explanation for the results and relating findings to previous studies.

Authors’ response: thank you. We have incorporated your suggestion in the revised manuscript. see line 393-401 of the discussion section and line number _366 -370 of this section.

2. Also, weaknesses and strengths stated in the discussion section should be moved to a seperate section titled "Strengths and weaknesses"

Authors’ response: We put it in separate section in the revised manuscript.

Thank you in advance for your constructive comments!!!

Attachment

Submitted filename: second response to reviewers.docx

Decision Letter 2

William Joe

16 Jun 2020

PONE-D-19-30322R2

Spatial Patterns of Anemia among Lactating Mothers in Ethiopia: Data from Ethiopian demographic And Health Surveys (2005, 2011,and 2016)

PLOS ONE

Dear Dr. liyew,

Thank you for submitting your manuscript to PLOS ONE. After careful consideration, we feel that it has merit but does not fully meet PLOS ONE’s publication criteria as it currently stands. Therefore, we invite you to submit a revised version of the manuscript that addresses the points raised during the review process.

Please submit your revised manuscript by Jul 31 2020 11:59PM. If you will need more time than this to complete your revisions, please reply to this message or contact the journal office at plosone@plos.org. When you're ready to submit your revision, log on to https://www.editorialmanager.com/pone/ and select the 'Submissions Needing Revision' folder to locate your manuscript file.

Please include the following items when submitting your revised manuscript:

  • A rebuttal letter that responds to each point raised by the academic editor and reviewer(s). You should upload this letter as a separate file labeled 'Response to Reviewers'.

  • A marked-up copy of your manuscript that highlights changes made to the original version. You should upload this as a separate file labeled 'Revised Manuscript with Track Changes'.

  • An unmarked version of your revised paper without tracked changes. You should upload this as a separate file labeled 'Manuscript'.

If you would like to make changes to your financial disclosure, please include your updated statement in your cover letter. Guidelines for resubmitting your figure files are available below the reviewer comments at the end of this letter.

If applicable, we recommend that you deposit your laboratory protocols in protocols.io to enhance the reproducibility of your results. Protocols.io assigns your protocol its own identifier (DOI) so that it can be cited independently in the future. For instructions see: http://journals.plos.org/plosone/s/submission-guidelines#loc-laboratory-protocols

We look forward to receiving your revised manuscript.

Kind regards,

William Joe

Academic Editor

PLOS ONE

[Note: HTML markup is below. Please do not edit.]

Reviewers' comments:

Reviewer's Responses to Questions

Comments to the Author

1. If the authors have adequately addressed your comments raised in a previous round of review and you feel that this manuscript is now acceptable for publication, you may indicate that here to bypass the “Comments to the Author” section, enter your conflict of interest statement in the “Confidential to Editor” section, and submit your "Accept" recommendation.

Reviewer #1: All comments have been addressed

Reviewer #2: All comments have been addressed

**********

2. Is the manuscript technically sound, and do the data support the conclusions?

The manuscript must describe a technically sound piece of scientific research with data that supports the conclusions. Experiments must have been conducted rigorously, with appropriate controls, replication, and sample sizes. The conclusions must be drawn appropriately based on the data presented.

Reviewer #1: Partly

Reviewer #2: Yes

**********

3. Has the statistical analysis been performed appropriately and rigorously?

Reviewer #1: Yes

Reviewer #2: Yes

**********

4. Have the authors made all data underlying the findings in their manuscript fully available?

The PLOS Data policy requires authors to make all data underlying the findings described in their manuscript fully available without restriction, with rare exception (please refer to the Data Availability Statement in the manuscript PDF file). The data should be provided as part of the manuscript or its supporting information, or deposited to a public repository. For example, in addition to summary statistics, the data points behind means, medians and variance measures should be available. If there are restrictions on publicly sharing data—e.g. participant privacy or use of data from a third party—those must be specified.

Reviewer #1: Yes

Reviewer #2: Yes

**********

5. Is the manuscript presented in an intelligible fashion and written in standard English?

PLOS ONE does not copyedit accepted manuscripts, so the language in submitted articles must be clear, correct, and unambiguous. Any typographical or grammatical errors should be corrected at revision, so please note any specific errors here.

Reviewer #1: No

Reviewer #2: Yes

**********

6. Review Comments to the Author

Please use the space provided to explain your answers to the questions above. You may also include additional comments for the author, including concerns about dual publication, research ethics, or publication ethics. (Please upload your review as an attachment if it exceeds 20,000 characters)

Reviewer #1: Reviewer Report

Spatial Patterns of Anemia among Lactating Mothers in Ethiopia: Data from Ethiopian Demographic and Health Surveys (2005, 2011 and 2016)

1. In the conclusion of abstract section- Therefore, public health intervention activities designed in a targeted approach to impact high-risk populations as well as the geographic regions is vital to narrow anemia disparity in Ethiopia’- needs attention for correction the statement ‘is vital to narrow anemia disparity in Ethiopia’.

2. To date, the risk areas (hot spot) of anemia among lactating mothers in Ethiopia are not identified- so what are the other studies related to anaemia among lactating mothers would be important to justify the statement (Line 91).

3. Line No 115-120 is not required in the way it has been written. Authors are advised to look for section on data source from various published articles in journal of high repute.

4. In Line number 125, it would be better to mention the age range for ‘reproductive age women’.

5. ‘Data measurement’ heading is not appropriate.

6. In line no 164 as the author has used word ‘location data’. I think those were geo-referencing data. So its always good to use appropriate word.

7. Within the methodology section, spatial analysis section is improved and well written than the previous one.

8. Line no 214-218: “The prevalence of anemia during lactation was intermittently increasing across regions in Ethiopia. Even though it had decreased from 2005 to 2011 almost in all regions, its prevalence increased from 2011 to 2016 in all regions including the two administrative cities. The highest prevalence was observed in the Somali regional state (68%) and the Afar region (47%) in 2016”- The statement should be written very carefully. As line no 214 reflects that since 2005, anaemia among lactating mother is on increase. But, that is not the case as the authors are stating in the line no-215/216 that it had decreased between 2005 and 2011.

9. Don’t use like ‘in the following figure’ or ‘in the above figure/map, tables’ etc, as at many place in the manuscript, it has written like that,

10. As in table 2, keep number of digit identical after the decimal. As somewhere its two digit, somewhere, its three digit in second column. In column 4, keep three digits after decimal. Keep it identical for all the tables.

11. Line no 253- Can be written as all three consecutive survey periods. Because, all surveys has different meaning.

12. Line no 264- 270 needs to be written in well manner as the- In the above figure, HH (High-High) means high rates of anemia surrounded by similar characteristics; HL (High-Low) means high rates of anemia surrounded by low rates of anemia; LH (Low-High) means low rates of anemia cases surrounded by high rates of anemia cases; and LL (Low-Low) means low rates of anemia cases surrounded by similar characteristics. The red (HH) color indicates hotspot areas of anemia, the dark blue (LL) color indicates cold spot areas of anemia, and the dark yellow (HL ) and yellow (LH) colors indicate the outliers.-. Section needs rewrite as writing HL means…., LL means is not the standard writing style in result sections. This is not the right way to interpret the map. The authors can narrate what is emerging out from the said map, not like HL means High-Low. As the Map 5a, 5b, 5c are for three different time period so it would be better to do compare the regions. The colour combination should be part of methodology section.

13. Authors mentioning hot spot, cold spot etc in figure 4,5 6. Which needs proper interpretation like what are those spots, is there any change during the three survey period as authors have written about in very brief in discussion section.

14. ‘This implies, that the special attention of policy makers for anemia reduction should be in those high-risk areas of the country’- this statement needs correction/modification as per the study objectives.

15. ‘This spatial heterogeneity of anemia clustering was again observed prominently in Afar and Somali regions. This showed that the spatial clustering of anemia is more or less consistently higher in the Afar region in all EDHS surveys and the Somali region in the latest two surveys (2011 and 2016)’- Validate your findings with other available studies or is this new finding emerged from your study for the first time.

16. Policy suggestion or public health measures are missing, authors can think on those lines.

Overall, there is improvement in the paper than the previous one, but the scientific rigor in interpreting the results emerging from the map is somewhat missing. Discussion section still needs to strengthen. It would be better to reduce the number of maps wherever it’s possible. The paper still needs English editing as in the data and methodology section flow and consistency was missing as well. Authors can also think about the title of the paper.

Thank You!!!

Reviewer #2: (No Response)

**********

7. PLOS authors have the option to publish the peer review history of their article (what does this mean?). If published, this will include your full peer review and any attached files.

If you choose “no”, your identity will remain anonymous but your review may still be made public.

Do you want your identity to be public for this peer review? For information about this choice, including consent withdrawal, please see our Privacy Policy.

Reviewer #1: Yes: Rajesh Raushan

Reviewer #2: No

[NOTE: If reviewer comments were submitted as an attachment file, they will be attached to this email and accessible via the submission site. Please log into your account, locate the manuscript record, and check for the action link "View Attachments". If this link does not appear, there are no attachment files.]

While revising your submission, please upload your figure files to the Preflight Analysis and Conversion Engine (PACE) digital diagnostic tool, https://pacev2.apexcovantage.com/. PACE helps ensure that figures meet PLOS requirements. To use PACE, you must first register as a user. Registration is free. Then, login and navigate to the UPLOAD tab, where you will find detailed instructions on how to use the tool. If you encounter any issues or have any questions when using PACE, please email PLOS at figures@plos.org. Please note that Supporting Information files do not need this step.

Attachment

Submitted filename: PONE-D-19-30322_R2_Reviewer Report-11062020.docx

PLoS One. 2020 Aug 6;15(8):e0237147. doi: 10.1371/journal.pone.0237147.r006

Author response to Decision Letter 2


24 Jun 2020

Date Jun 24/2020

To: PLOS ONE Journal

Subject Submitting Revised Manuscript after Reviewers comment

Manuscript title: Spatiotemporal Patterns of Anemia among Lactating Mothers in Ethiopia using data from Ethiopian Demographic and Health Surveys (2005, 2011 and 2016)

Manuscript ID: PONE-D-19-30322R2

Dear editor/reviewers

We would like to thank you for your constructive comments on our manuscript. We really appreciate your continuous effort and academic commitment to strengthen our paper. Our point-by-point responses for each comment and questions are described as follow. The details of these changes were shown by track changes feature attached.

Point by point response for reviewers comment

For reviewer # 1

1. In the conclusion of abstract section- Therefore, public health intervention activities designed in a targeted approach to impact high-risk populations as well as the geographic regions is vital to narrow anemia disparity in Ethiopia’- needs attention for correction the statement ‘is vital to narrow anemia disparity in Ethiopia’.

Author’s response: thank you reviewer. We corrected accordingly. (See the abstract section line 41-42)

2. To date, the risk areas (hot spot) of anemia among lactating mothers in Ethiopia are not identified- so what are the other studies related to anemia among lactating mothers would be important to justify the statement (Line 91).

Author’s response: thanks reviewer we have provided additional citations regarding studies conducted on determinants of anemia among lactating mothers. (We kindly request to see introduction section; line 81-82)

3. Line No 115-120 is not required in the way it has been written. Authors are advised to look for section on data source from various published articles in journal of high repute.

Author’s response: Thank you reviewer. We have modified accordingly in the revised manuscript (as you can see the track change feature).

4. In Line number 125, it would be better to mention the age range for ‘reproductive age women’

Author’s response: thank you reviewer we specified it as “reproductive age women (15-49)”

5. Data measurement’ heading is not appropriate.

Author’s response: Thank you. Since this section describes about how anemia is measured which is our problem of interest. Therefore we changed “data management” to “outcome variable” (see line 129)

6. In line no 164 as the author has used word ‘location data’. I think those were geo-referencing data. So it’s always good to use appropriate word

Author’s response: Thank you. We have corrected accordingly. (see line 124 of method section).

7. Within the methodology section, spatial analysis section is improved and well written than the previous one

Author’s response: Thanks reviewer for your critical review.

8. Line no 214-218: “The prevalence of anemia during lactation was intermittently increasing across regions in Ethiopia. Even though it had decreased from 2005 to 2011 almost in all regions, its prevalence increased from 2011 to 2016 in all regions including the two administrative cities. The highest prevalence was observed in the Somali regional state (68%) and the Afar region (47%) in 2016”- The statement should be written very carefully. As line no 214 reflects that since 2005, anemia among lactating mother is on increase. But, that is not the case as the authors are stating in the line no-215/216 that it had decreased between 2005 and 2011.

Author’s response: thanks you reviewer. We have reinterpreted this section.(we kindly request to see the track change feature)

9. Don’t use like ‘in the following figure’ or ‘in the above figure/map, tables’ etc, as at many place in the manuscript, it has written like that

Author’s response: we totally removed such phrases per your comment (see the revised manuscript).

10. As in table 2, keep number of digit identical after the decimal. As somewhere its two digit, somewhere, its three digit in second column. In column 4, keep three digits after decimal. Keep it identical for all the tables

Authors response: thank you reviewer we corrected in the revised manuscript. (See the revised manuscript).

11. Line no 253- Can be written as all three consecutive survey periods. Because, all surveys has different meaning

Authors’ response: thanks reviewer it is corrected accordingly.

12. Line no 264- 270 needs to be written in well manner as the- In the above figure, HH (High-High) means high rates of anemia surrounded by similar characteristics; HL (High-Low) means high rates of anemia surrounded by low rates of anemia; LH (Low-High) means low rates of anemia cases surrounded by high rates of anemia cases; and LL (Low-Low) means low rates of anemia cases surrounded by similar characteristics. The red (HH) color indicates hotspot areas of anemia, the dark blue (LL) color indicates cold spot areas of anemia, and the dark yellow (HL ) and yellow (LH) colors indicate the outliers.-. Section needs rewrite as writing HL means…., LL means is not the standard writing style in result sections. This is not the right way to interpret the map. The authors can narrate what is emerging out from the said map, not like HL means High-Low. As the Map 5a, 5b, 5c are for three different time period so it would be better to do compare the regions. The color combination should be part of methodology section.

Authors’ response: thank you. We have reinterpreted the results from cluster and outlier analysis (we kindly request to see the track change feture)

13. Authors mentioning hot spot, cold spot etc in figure 4,5 6. Which needs proper interpretation like what are those spots, is there any change during the three survey period as authors have written about in very brief in discussion section

Authors’ response: thanks reviewer we improved the interpretation.( see line 211-217 of result section)

14. This implies, that the special attention of policy makers for anemia reduction should be in those high-risk areas of the country’- this statement needs correction/modification as per the study objectives.

Authors’ response; thanks reviewer we critically modified this statement. (See line 266-274 section of discussion)

15. This spatial heterogeneity of anemia clustering was again observed prominently in Afar and Somali regions. This showed that the spatial clustering of anemia is more or less consistently higher in the Afar region in all EDHS surveys and the Somali region in the latest two surveys (2011 and 2016)’- Validate your findings with other available studies or is this new finding emerged from your study for the first time.

Authors’ response; thank you reviewer. As to our knowledge concerned it is new finding. Thus, it is a little bit difficult to validate with other studies.

16.Policy suggestion or public health measures are missing, authors can think on those lines.

Authors’ response; thank you reviewer. We really appreciate the comment. We included the policy implication of the findings in the revised document.(we kindly request to see the line 294-299 section of discussion)

17. Overall, there is improvement in the paper than the previous one, but the scientific rigor in interpreting the results emerging from the map is somewhat missing. Discussion section still needs to strengthen. It would be better to reduce the number of maps wherever it’s possible. The paper still needs English editing as in the data and methodology section flow and consistency was missing as well. Authors can also think about the title of the paper.

Authors’ response; thank you reviewer. We improved the interpretation, Discussion and English editing issues over all readability of the article in the revised manuscript as it can be observed from the track changes.

Thank you in advance for your constructive comments!!!

Attachment

Submitted filename: third response to reviewers.docx

Decision Letter 3

William Joe

22 Jul 2020

Spatiotemporal Patterns of Anemia among Lactating Mothers in Ethiopia using data from Ethiopian demographic And Health Surveys (2005, 2011,and 2016)

PONE-D-19-30322R3

Dear Dr. liyew,

We’re pleased to inform you that your manuscript has been judged scientifically suitable for publication and will be formally accepted for publication once it meets all outstanding technical requirements.

Within one week, you’ll receive an e-mail detailing the required amendments. When these have been addressed, you’ll receive a formal acceptance letter and your manuscript will be scheduled for publication.

An invoice for payment will follow shortly after the formal acceptance. To ensure an efficient process, please log into Editorial Manager at http://www.editorialmanager.com/pone/, click the 'Update My Information' link at the top of the page, and double check that your user information is up-to-date. If you have any billing related questions, please contact our Author Billing department directly at authorbilling@plos.org.

If your institution or institutions have a press office, please notify them about your upcoming paper to help maximize its impact. If they’ll be preparing press materials, please inform our press team as soon as possible -- no later than 48 hours after receiving the formal acceptance. Your manuscript will remain under strict press embargo until 2 pm Eastern Time on the date of publication. For more information, please contact onepress@plos.org.

Kind regards,

William Joe

Academic Editor

PLOS ONE

Additional Editor Comments (optional):

Reviewers' comments:

Reviewer's Responses to Questions

Comments to the Author

1. If the authors have adequately addressed your comments raised in a previous round of review and you feel that this manuscript is now acceptable for publication, you may indicate that here to bypass the “Comments to the Author” section, enter your conflict of interest statement in the “Confidential to Editor” section, and submit your "Accept" recommendation.

Reviewer #1: All comments have been addressed

Reviewer #2: All comments have been addressed

**********

2. Is the manuscript technically sound, and do the data support the conclusions?

The manuscript must describe a technically sound piece of scientific research with data that supports the conclusions. Experiments must have been conducted rigorously, with appropriate controls, replication, and sample sizes. The conclusions must be drawn appropriately based on the data presented.

Reviewer #1: Yes

Reviewer #2: Yes

**********

3. Has the statistical analysis been performed appropriately and rigorously?

Reviewer #1: Yes

Reviewer #2: Yes

**********

4. Have the authors made all data underlying the findings in their manuscript fully available?

The PLOS Data policy requires authors to make all data underlying the findings described in their manuscript fully available without restriction, with rare exception (please refer to the Data Availability Statement in the manuscript PDF file). The data should be provided as part of the manuscript or its supporting information, or deposited to a public repository. For example, in addition to summary statistics, the data points behind means, medians and variance measures should be available. If there are restrictions on publicly sharing data—e.g. participant privacy or use of data from a third party—those must be specified.

Reviewer #1: Yes

Reviewer #2: Yes

**********

5. Is the manuscript presented in an intelligible fashion and written in standard English?

PLOS ONE does not copyedit accepted manuscripts, so the language in submitted articles must be clear, correct, and unambiguous. Any typographical or grammatical errors should be corrected at revision, so please note any specific errors here.

Reviewer #1: Yes

Reviewer #2: Yes

**********

6. Review Comments to the Author

Please use the space provided to explain your answers to the questions above. You may also include additional comments for the author, including concerns about dual publication, research ethics, or publication ethics. (Please upload your review as an attachment if it exceeds 20,000 characters)

Reviewer #1: Minor suggestions

1. Line no 127- Is four survey conducted or typed by mistake. I think it would be three surveys.

2. Line no- 208 can be written as Even though prevalence of Anaemia had decreased between 2005 and 2011.

3. Authors have used somewhere one and half decade. I think from 2005 to 2016, its 11 years. So, please do correct it.

Overall, the revised version seems improved and looks impressive and readable. So authors can take care of minor typo-error and other necessities of the PLOS ONE.

Thank You!!!

Reviewer #2: (No Response)

**********

7. PLOS authors have the option to publish the peer review history of their article (what does this mean?). If published, this will include your full peer review and any attached files.

If you choose “no”, your identity will remain anonymous but your review may still be made public.

Do you want your identity to be public for this peer review? For information about this choice, including consent withdrawal, please see our Privacy Policy.

Reviewer #1: Yes: Rajesh Raushan, PhD

Reviewer #2: No

Acceptance letter

William Joe

24 Jul 2020

PONE-D-19-30322R3

Spatiotemporal Patterns of Anemia among Lactating Mothers in Ethiopia using data from Ethiopian Demographic and Health Surveys (2005, 2011 and 2016)

Dear Dr. Liyew:

I'm pleased to inform you that your manuscript has been deemed suitable for publication in PLOS ONE. Congratulations! Your manuscript is now with our production department.

If your institution or institutions have a press office, please let them know about your upcoming paper now to help maximize its impact. If they'll be preparing press materials, please inform our press team within the next 48 hours. Your manuscript will remain under strict press embargo until 2 pm Eastern Time on the date of publication. For more information please contact onepress@plos.org.

If we can help with anything else, please email us at plosone@plos.org.

Thank you for submitting your work to PLOS ONE and supporting open access.

Kind regards,

PLOS ONE Editorial Office Staff

on behalf of

Dr. William Joe

Academic Editor

PLOS ONE

Associated Data

    This section collects any data citations, data availability statements, or supplementary materials included in this article.

    Supplementary Materials

    Attachment

    Submitted filename: Reviewer Report.docx

    Attachment

    Submitted filename: response to reviewers.docx

    Attachment

    Submitted filename: Reviewer Comments08 April 2020.docx

    Attachment

    Submitted filename: second response to reviewers.docx

    Attachment

    Submitted filename: PONE-D-19-30322_R2_Reviewer Report-11062020.docx

    Attachment

    Submitted filename: third response to reviewers.docx

    Data Availability Statement

    As Ethiopian demographic and health survey is part of demographic and health survey (DHS), it is publicly available data. Any researcher can access data after becoming an Authorized user. Once registered and access permission has been provided, users may download the datasets from the required countries free of charge. Therefore, all the data underlying the findings are freely available from www.measuredhs.com.


    Articles from PLoS ONE are provided here courtesy of PLOS

    RESOURCES