

Abstract
Malaria is one of most important parasitic disease, which is still much prevalent in India. The burden of malaria in India is complex and the proportions of Plasmodium vivax and Plasmodium falciparum vary across India, because of the highly variable malaria eco-epidemiological profiles, transmission factors, and the presence of multiple Plasmodium species and Anopheles vectors. The diagnostic modalities which were being used currently, are at the risk of missing potential malaria cases, if a single test is being used for a given sample. There are some extremely sensitive and specific diagnostic methods available (e.g. PCR, LAMP), but they are expensive, complex, and not readily available in all healthcare setups. Therefore, this study aimed to compare three different types of routinely used diagnostic methods and a novel testing method, the Parasight™ platform, and compare them with the detection ability of the most accurate diagnostic method, that is, PCR. A total of 111 consecutive malaria-positive (proven positive by PCR) patients were taken and tested by the immunochromatographic test or the rapid diagnostic test (RDT), thin and thick blood smears, quantitative buffy coat (QBC). In the last year of study period, 26 PCR positive samples were also taken up for the Parasight™ platform diagnostic test, along with the other routine tests. Among 111 PCR-positive cases, 78.4% samples were positive by Giemsa-stained blood film examination, 80.2% by QBC, 87.4% by RDT. In the last year of study period, among the 26 PCR-positive malaria samples, 80.8% were positive by blood film examination, 84.6% by QBC, 96.2% by RDT and 100% by the Parasight™ platform test. A combination of tests is preferable than a single method, for better detection of Plasmodium species including automated methods. The new testing method, the Parasight™ platform, is emerging to be a very sensitive test for detection of Plasmodium spp., results of which are comparable to PCR.
Introduction
Malaria is one of the most prevalent parasitic disease in the tropics and subtropics. Nearly 80% of global malaria deaths in 2017 were concentrated in 17 countries in the WHO African region and India (World Malaria Report 2018). There is a need for affordable and easy-to-use diagnostic modalities, which do not require much technical expertise and timely detect all the cases of malaria. Early initiation of appropriate antimalarial therapy and ensuring completion of therapy among the patients is crucial since partially treated cases of malaria are contributing to the increase in drug resistance.
Due to the inaccuracies of currently used laboratory diagnostic methods for malaria, clinical diagnosis based on symptoms, remains the basis of starting anti-malarial therapy for the majority of febrile patients in many healthcare facilities of India (Tangpukdee et al. 2009). Diagnosis based on clinical features alone has very low specificity and results in overtreatment and emergence of drug resistant strains. In order to avoid this, WHO recommends confirmed diagnosis of all malaria suspected cases before giving treatment (WHO Fact Sheet about Malaria 2019). For precise malaria diagnosis, several diagnostic approaches are employed in labs including microscopy, immuno-fluorescence technique, immuno-chromatographic testing (ICT), polymerase chain reaction (PCR), and use of haematological analyzers (Mukry et al. 2017).
The microscopic blood film detection of malarial parasite is generally considered as a gold standard in malaria diagnosis (Tangpukdee et al. 2009). Although inexpensive, highly specific and sensitive, this diagnostic method requires observation by an expert microscopist and becomes time-consuming, and labour-intensive in cases of low parasitaemic load (< 1000 parasites/µl) (Azikiwe et al. 2012). Another fluorescence microscopy method, namely the quantitative buffy coat technique (QBC) has been used for malaria diagnosis, but has the disadvantage of being expensive, in comparison to ordinary microscopy (Kochareka et al. 2012). In many malaria-endemic regions, microscopic diagnosis has certain inherent limitations, including the need for highly experienced microscopists, variability in smear quality, the inability to determine malaria species at low parasitaemia levels, the possibility of misdiagnosis due to low parasitaemia or mixed infections and the loss of slide quality with time (Ohrt et al. 2002).
The rapid diagnostic tests (RDTs) were developed to provide reliable, rapid results with an easy-to-use platform at point-of-care settings. These devices are based on various parasite antigens or pan-specific aldolases and are simple and easy to use. The RDTs are inexpensive, easily available and which require no prior training are usually based on principle of sandwich ELISA (Mukry et al. 2017). Still the RDTs have limitations in identifying malaria infections, especially in the low-transmission settings, where there are unexpectedly high proportions of low-density infection, that is, low levels of parasitaemia among symptomatic subjects; it has been observed that RDTs have low sensitivity (Ranadive et al. 2017).
In such cases, only sensitive molecular techniques such as PCR can be used to determine the accuracies of these diagnoses. Furthermore, identification of malaria species causing clinical malaria during routine healthcare can be more accurately determined by PCR as compared to microscopy. Studies have observed PCR and LAMP assays to be more sensitive than microscopy and capable of identifying malarial parasites at the species level when microscopy was equivocal (Johnston et al. 2006; Hopkins et al. 2013). However, these tools are impractical for majority of the malaria-endemic areas, due to their high costs and long turnaround times. A new diagnostic modality, the commercial Parasight™ platform which is an automated device, has been developed for improving the diagnosis of malaria. This device makes use of digital cytometry technique for diagnosis. It utilises a combination of DNA and RNA fluorescent dyes which rapidly stain the parasite’s nuclear material, making it a highly sensitive method of detection (Eshel et al. 2017). Result of the assay is obtained in about 4 min. It simulates an automated microscopist by identifying live intracellular parasites at low levels of parasitaemia with improved speed, cost, and consistency (Eshel et al. 2017).
With this background, a prospective study was undertaken to compare the different, commonly available diagnostic methods for malaria diagnosis, and finally assess the performance of the Parasight™ automated platform.
Aim of the study
This study aimed to compare three different types of diagnostic methods used in malaria diagnosis and co-relate them with the detection ability of the most accurate method, that is, PCR. Also, this study analysed the performance of a new automated method of malaria diagnosis by digital imaging technique (‘Parasight™’ platform) on a small subset of specimens (n = 26).
Materials and methods
This prospective study was undertaken for a period of 4 years in the Department of Microbiology, JIPMER, Puducherry. A total of 111 consecutive Malaria-positive (proven positive by PCR) patients were included in the study group. Written informed consent was taken from all participants, who agreed to participate in the study. About 5 ml of venous blood sample was collected from each of these patients before commencement of anti-malarial therapy and was subjected to PCR, RDT, Giemsa stained blood smear examination, QBC and a small subset of samples was also subjected to Parasight™ platform (Sight Diagnostics, Israel) testing. For each diagnostic test, a known malaria-positive sample and a known malaria-negative sample were taken as positive and negative controls respectively, to validate the testing procedure.
A nested PCR strategy was carried out, where two rounds of amplification were done, with the product of the first reaction serving as the template for a second reaction (Snounou et al. 1993). This strategy targeted sequences of the 18S ribosomal subunit genes of the four malarial parasites for amplification. In the first amplification reaction, the genus specific rPLU5 and rPLU6 primers, hybridized to sequences in the ss rRNA genes of a Plasmodium parasite, amplifying a 1.6–1.7 kb fragment of these genes. When the Plasmodium genus-specific primers rPLU5 (5′CCTGTTGTTGCCTTAAACTTC3′) and rPLU6 (5′TTAAAATTGTTGCAGTTAAAACG3′) were used, detection of a 1100-bp PCR product from the rRNA small subunit gene (18S rRNA) indicated the presence of malarial parasites in the sample. The product of this first reaction was then used as the DNA template for a second amplification reaction, in which the oligonucleotide primers recognized sequences contained within the DNA fragment amplified in the first reaction. The oligonucleotide primers used in second reaction were specific to the four Plasmodium species which infect humans, that is, rFAL1 and rFAL2 for P. falciparum (product of 206 bp), rMAL1 and rMAL2 for P.malariae (product of 145 bp), rVIV1 and rVIV2 for P. vivax (product of 121 bp) and rOVA1 and rOVA2 have been used for P. ovale.
For each sample, PCR amplifications were carried out in a final volume of 25 μl, which included 10 pmol of each primer, 0.2 mM of dNTPs, 1 unit of Taq DNA polymerase, 1X Taq DNA polymerase buffer and 1 μl of DNA. Cycling conditions for the first step included an initial denaturation at 95 °C for 5 min followed by 30 cycles of 1 min denaturation at 94 °C, 2 min annealing at 60 °C and 2 min of extension at 72 °C followed by 10 min final extension at 72 °C. The cycling conditions for second step included an initial denaturation at 95 °C for 5 min followed by 30 cycles of 1 min denaturation at 94 °C, 2 min annealing at 55 °C and 2 min of extension at 72 °C followed by 10 min final extension at 72 °C. Following PCR, gel electrophoresis was done using 5 μl of PCR amplified product on a 2% agarose gel and was compared with a 100-bp ladder for confirming amplicon size. One set of known positive and known negative controls were used for validating the PCR procedure (Siwal et al. 2018).
Each PCR positive blood sample was subjected to testing by three different types of diagnostic methods, like RDT, Giemsa stained thick and thin blood film examination and quantitative buffy coat (QBC) examination. In the last year of study period, 26 PCR positive samples were also taken up for the Parasight™ platform (Sight Diagnostics, Israel) diagnostic test (Fig. 1), in addition to the routine tests like RDT, blood film examination and QBC.
Fig. 1.
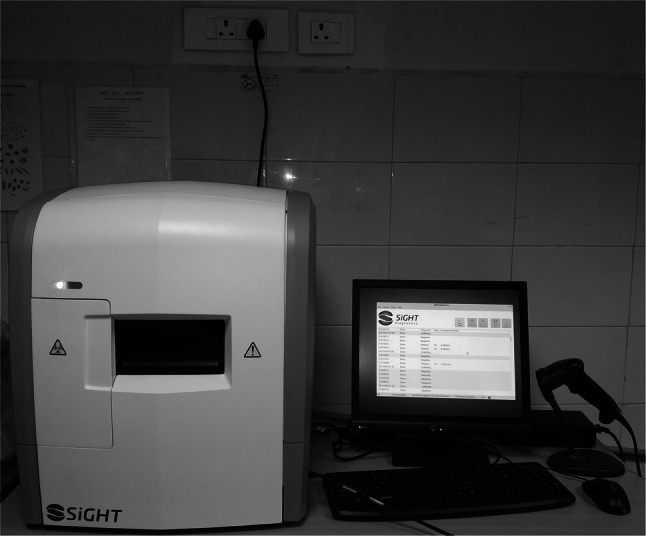
Parasight™ platform with its accessories
All the PCR positive blood samples were subjected to immunochromatographic test. Again, two different types of RDT (FalciVax® device & Advantage Malaria Pan Pf®) were used to test each sample. The samples which came positive in both the immunochromatographic tests were taken as RDT positive samples.
Following RDT, each of the PCR positive blood sample was taken up for Giemsa stained thick and thin smear examination. Each blood film was examined separately by two independent observers and each observer was blinded to the results of the other observer. Each observer recorded the blood film examination findings in terms of presence or absence of malarial parasite and the percent parasitaemia was calculated using both the thick and thin smear technique, in case of microscopy positive cases.
For sample loading onto the novel Parasight™ device (Sight Diagnostics, Israel), about 5 µl of EDTA blood sample was mixed thoroughly with 500 µl fluorescent stain solution and 35 µl of stained blood was then loaded into a chamber row in the Parasight™ cartridge (Fig. 2). The cartridge was then loaded onto the Parasight™ device. Once the cartridge was inside the device, a sample monolayer was formed in the cartridge, with minimal overlap between the blood cells. This monolayer was analyzed under high resolution imaging by tripartite wavelength excitation. During scanning, the device differentiated the fluorescent stained white blood cells, platelets, red blood cells (RBCs), and various stages of Plasmodium spp. like ring-stage parasites, trophozoites, schizonts, and gametocytes and thus speciated the malarial parasite and directly displayed the result on screen (Fig. 3). The device recorded and digitally analyzed images of about 1.5 million red blood cells (0.3 μl of blood). The processing of results was done by an algorithm that performs special parasite feature extraction by a computerised vision support vector machine (SVM) classifier, and the parasite was classified according to the SVM score obtained. Basically, this next generation algorithm analyzed unique morphological features of the parasite, to reach a final diagnosis that detected, quantified, and identified the malarial parasite up to species level.
Fig. 2.

Loading of sample on the cartridge chambers for creating a monolayer
Fig. 3.

Format of result output of the Parasight™ platform after analysing the sample
The study compared three different types of diagnostic methods used in malaria diagnosis and co-related them with the detection ability of the most accurate method, that is, PCR.
Results
A total of 111 malaria positive (confirmed by PCR) patients were included in the study group. There was a male predominance among the positive cases with majority of cases belonging to 15–35 years age group (Table 1). It was observed that among the total 111 malaria positive blood samples, 87 (78.4%) samples were positive by blood smear examination, 89 (80.2%) samples were positive by QBC technique, 97 (87.4%) samples were found positive by RDT (Table 2). Among the total blood smear positive cases, 62 (71.3%) cases were caused due to P. vivax (Pv) and 21 (24.1%) were due to P. falciparum (Pf) and three cases were due to co-infection by Pf and Pv. Out of the QBC positive cases, P. vivax accounted for 45 (50.6%) cases while P. falciparum were 11 (12.4%) cases and 3 (3.4%) cases had co-infection. Again, in the RDT positive cases, P. vivax were detected in 53 (54.6%) cases, P. falciparum in 40 (41.2%) cases and co-infection was seen in 4 (4.1%) cases (Table 2).
Table 1.
Age and sex distribution of cases
| Age | Male | % | Female | % |
|---|---|---|---|---|
| 0–14 | 9 | 10.7 | 3 | 11.1 |
| 15–25 | 20 | 23.8 | 9 | 33.3 |
| 26–35 | 24 | 28.6 | 9 | 33.3 |
| 36–45 | 17 | 20.2 | 4 | 14.8 |
| 46–55 | 11 | 13.1 | 1 | 3.7 |
| > 55 | 3 | 3.6 | 1 | 3.7 |
| Total | 84 | 100 | 27 | 100 |
Table 2.
Result showing the comparative performance of different diagnostic methods
| Result | Microscopy | % | QBC (no.) | % | ICT (no.) | % |
|---|---|---|---|---|---|---|
| Negative | 24/111 | 21.6 | 22/111 | 19.8 | 14/111 | 12.6 |
| Positive | 87/111 | 78.4 | 89/111 | 80.2 | 97/111 | 87.4 |
| Pf | 21/87 | 24.1 | 11/89 | 12.4 | 40/97 | 41.2 |
| Pv | 62/87 | 71.3 | 45/89 | 50.6 | 53/97 | 54.6 |
| Co-infection (Pf & Pv) | 3/87 | 3.4 | 3/89 | 3.4 | 4/97 | 4.1 |
Pf P. falciparum, Pv P. vivax
In the last one year of study period, all the 26 PCR positive malaria samples were taken up for testing by Parasight™ platform, apart from the routine blood smear examination, QBC and RDT tests. Of the 26 malaria positive cases detected by PCR, 5 (19.2%) were due to P. falciparum, 19 (73.1%) were due to P. vivax and 2 (7.7%) were due to co-infection by Pf and Pv. Among the other diagnostic tests, it was observed that, among the 26 PCR-positive samples, 21 (80.8%) were positive by blood film examination, 22 (84.6%) were positive by QBC, 25 (96.2%) were positive by RDT and all the 26 (100%) were positive by the Parasight™ platform test (Table 3). In the blood film positives, 3 (14.3%) were due to P. falciparum, 17 (81%) were due to P. vivax and 1 (4.8%) were due to co-infection by Pf and Pv. In the QBC positives, 3 (13.6%) were due to P. falciparum, 18 (81.8%) were due to P. vivax and 1 (4.5%) were due to co-infection by Pf and Pv. In the RDT positives, 5 (20.0%) were due to P. falciparum and 18 (72.0%) were due to P. vivax and 2 (8.0%) were due to co-infection by Pf and Pv. Among the Parasight™ test positives, 5 (19.2%) were due to P. falciparum, 19 (73.1%) were due to P. vivax and 2 (7.7%) were due to co-infection by Pf and Pv. (Table-3).
Table 3.
PCR positive samples of the last year of the study period
| N = 26 | Microscopy | QBC | ICT | Parasight™ | ||||
|---|---|---|---|---|---|---|---|---|
| Number | % | Number | % | Number | % | Number | % | |
| Negative | 5/26 | 19.2 | 4/26 | 15.4 | 1/26 | 3.8 | 0/26 | 0 |
| Positive | 21/26 | 80.8 | 22/26 | 84.6 | 25/26 | 96.2 | 26/26 | 100 |
| P.falciparum | 3/21 | 14.3 | 3/22 | 13.6 | 5/25 | 20.0 | 5/26 | 19.2 |
| P.vivax | 17/21 | 81.0 | 18/22 | 81.8 | 18/25 | 72.0 | 19/26 | 73.1 |
| Co-infection (Pf & Pv) | 1/21 | 4.8 | 1/22 | 4.5 | 2/25 | 8.0 | 2/26 | 7.7 |
In the last year of study period, the different diagnostic tests were compared in terms of their sensitivities, which showed conventional microscopy had 80.77% sensitivity, QBC had 84.62%, RDT had 96.15% whereas Parasight™ platform testing had 100% sensitivity, which was comparable to PCR (Table 4). The percent parasitaemia was calculated using both thick and thin smear technique, but for the purpose of comparison with Parasight™ platform results, the thin smear technique was used for percent parasitaemia calculation. A minimum of 10 oil immersion fields were analyzed for at least ten fields, with approximately 100 RBCs being counted per field. The percent parasitemia levels were then calculated as the ratio of number of infected RBCs to number of total RBCs. During calculation of percent parasitaemia, only the asexual forms of parasites were included in the final parasite counts. Then the percent parasitaemia results obtained by conventional microscopy were compared with the percent parasitaemia results given by the Parasight™ platform device (Table 5). A matrix showing the results of various diagnostic tests, in the PCR positive samples obtained in the last year of study was done to show correlation between different diagnostic modalities (Table 6).
Table 4.
Comparison of sensitivities and specificities of each diagnostic test in comparison with PCR used in the study (n = 26)
| Diagnostic modality for malarial parasite detection | Sensitivity (%) | Specificity (%) |
|---|---|---|
| Peripheral blood film examination by microscopy | 80.77 | Undefined |
| QBC technique | 84.62 | Undefined |
| RDT | 96.15 | Undefined |
| Parasight™ platform | 100 | Undefined |
Table 5.
Percent parasitaemia comparison (n = 26)
| S. no | Percent parasitaemia by microscopy | Percent parasitaemia by Parasight™ platform |
|---|---|---|
| 1 | 0.01 | 0.023 |
| 2 | 0.07 | 0.081 |
| 3 | 0.01 | 0.012 |
| 4 | 0.01 | 0.23 |
| 5 | 0.1 | 0.15 |
| 6 | – | 0.004 |
| 7 | 0.02 | 0.037 |
| 8 | 0.01 | 0.019 |
| 9 | – | 0.0012 |
| 10 | – | 0.0022 |
| 11 | 0.01 | 0.52 |
| 12 | 0.03 | 0.059 |
| 13 | 0.02 | 0.044 |
| 14 | 0.09 | 0.82 |
| 15 | 0.5 | 0.61 |
| 16 | 0.6 | 0.73 |
| 17 | 0.3 | 0.77 |
| 18 | 0.1 | 0.48 |
| 19 | 0.1 | 0.88 |
| 20 | – | 0.008 |
| 21 | 0.06 | 0.091 |
| 22 | 0.01 | 0.21 |
| 23 | 0.31 | 0.51 |
| 24 | 0.51 | 0.74 |
| 25 | – | 0.007 |
| 26 | 0.6 | 0.82 |
Table 6.
Comparison of four diagnostic test results in the small subset of specimens (n = 26)
| S. no | Microscopy | QBC | RDT | Parasight™ platform | PCR |
|---|---|---|---|---|---|
| 1 | + | + | + | + | + |
| 2 | + | + | + | + | + |
| 3 | + | + | + | + | + |
| 4 | + | + | + | + | + |
| 5 | + | + | + | + | + |
| 6 | − | − | + | + | + |
| 7 | + | + | + | + | + |
| 8 | + | + | + | + | + |
| 9 | − | + | + | + | + |
| 10 | − | − | + | + | + |
| 11 | + | + | + | + | + |
| 12 | + | + | + | + | + |
| 13 | + | + | + | + | + |
| 14 | + | + | − | + | + |
| 15 | + | + | + | + | + |
| 16 | + | + | + | + | + |
| 17 | + | + | + | + | + |
| 18 | + | + | + | + | + |
| 19 | + | + | + | + | + |
| 20 | − | − | + | + | + |
| 21 | + | + | + | + | + |
| 22 | + | + | + | + | + |
| 23 | + | + | + | + | + |
| 24 | + | + | + | + | + |
| 25 | − | − | + | + | + |
| 26 | + | + | + | + | + |
Discussion
Malaria in India remains a major public health problem till date. It is still a leading parasitic cause of morbidity and mortality in our country. While, P. falciparum is the most common causative agent among the malaria cases across the country, P. vivax contributes to most of the malaria burden in the region of Puducherry. Prompt and early diagnosis of malaria is essential not only for administering the correct treatment regimen, but also for implementing effective malaria control strategies, especially in Plasmodium-endemic regions.
The present study evaluated the utility in terms of efficiency of existing routine malaria diagnostic tests compared with that of the PCR. Among the total 111 malaria positive blood samples, 87 (78.4%) samples were positive by blood smear examination, 89 (80.2%) samples were positive by QBC technique, 97 (87.4%) samples were found positive by RDT. Similar results are observed in study by Berzosa et al. (2018) and Rodulfo et al. (2007). Since microscopy requires skilled observation, some cases which were positive by RDT, have been missed by microscopy, probably the parasite might have been mistaken to be an artifact. QBC being a concentration technique is more sensitive than the conventional blood film microscopy, in detecting parasites.
In the blood smear positive cases, 62 (71.3%) cases were caused due to P. vivax and 21 (24.1%) were due to P. falciparum and three cases were due to co-infection by P. falciparum and P. vivax. Similar finding was also observed in two other studies conducted on the same parasites. (Rodulfo et al. 2007; Singh et al. 2015) Of the QBC positive cases, P. vivax accounted for 45 (50.6%) cases while P. falciparum was 11 (12.4%) cases and 3 (3.4%) cases had co-infection. Again, in the RDT positive cases, P. vivax were detected in 53 (54.6%) cases, P. falciparum in 40 (41.2%) cases and co-infection was seen in 4 (4.1%) cases. Other studies also have reported the same findings (Berzosa et al. 2018; Singh et al. 2015). Due to higher incidence of P. vivax in this region of Puducherry, more number of cases were observed in the current study.
In the last 1 year of study period, among the 26 PCR positive malaria samples, 21 (80.8%) were positive by blood film examination, 22 (84.6%) were positive by QBC, 25 (96.2%) were positive by RDT and all the 26 (100%) were positive by the Parasight™ platform test. A study by Eshel et al. (2017) reports similar findings. Since all the PCR positive cases gave a positive result with Parasight™ platform testing, sensitivities of both the methods were comparable. The percent parasitaemia results obtained by conventional microscopy were lower as compared to the percent parasitaemia results given by the Parasight™ platform device, since the device uses fluorescent staining method of parasite detection, which has a higher sensitivity of detection than conventional microscopy. Several updates are currently under development to improve the diagnostic performance of the Parasight™ system. The present device has a limit of detection of 20 parasites/μl. Future versions of the algorithm will provide detection capabilities that could be as low as 5 parasites/μl and also provide better differentiation between species. The matrix displaying the results of various diagnostic tests, in the PCR positive samples obtained in the last year of study shows that using a combination of different diagnostic modalities increases the chance of detection, and thus decreases the risk of missing a malaria case. The Parasight platform was used only for a small subset of specimens (n = 26) since the device was installed in the last year of the study period, during which we got only 26 PCR positive malaria samples.
Summary and conclusion
Detection of malaria by blood smear microscopic examination is the gold standard but has few limitations like requirement of technical expert personnel, proper staining techniques etc. QBC requires observation by an expert microscopist and the consumables are expensive, in comparison to conventional microscopy. Therefore, it cannot be used as routine diagnostic method in resource poor settings. Methods using fluorescence microscopy have only helped improve the sensitivity but not the specificity. Another limitation is that microscopy cannot be used in situations like large field surveys for malaria, where RDTs are preferred. PCR is a sensitive and confirmatory method for diagnosis of all five species of human malarial parasites. It even exceeds the sensitivity of microscopic blood film examination. However, PCR is an impractical standard to measure routine acute malaria diagnosis because of the time and cost involved and also the requirement of technical expertise. Due to the above limitations of these routine diagnostic tests, it is advisable to include more than one test for accurate case detection. The new diagnostic method, the Parasight™ platform, is emerging as a very sensitive method of malaria detection, up to the species level, with sensitivity comparable to results by PCR.
Author contributions
SD was responsible for sample and data collection, its processing and microscopy. She was responsible for writing the manuscript and its submission. NR was responsible for the conceptualization of the study, counterchecking the results and monitoring of the work carried out and analysis of the results. She also checked and refined the manuscript and also gave critical inputs to the paper. UR helped in the statistical modelling of the study, selection of the study parameters as well as gave critical inputs to the study and helped in refining the final manuscript. AG helped in data collection.
Funding
The machine and the consumables were bought by JIPMER, Puducherry in the last year of study period, and till date have been successfully performing the routine tests without any discrepancies. It is not a manufacturer’s funded study.
Compliance with ethical standards
Conflict of interest
All authors declare that they have no conflict of interest. There is no conflict of interest with the company of Parasight™ (Sight Diagnostics, Israel).
Human and animal rights statement
This research only included human patients as the study group.
Informed consent
Written informed consent was taken from all adult participants and parents of minor participants, who agreed to be enrolled in the study group after getting approval from the JIPMER Ethical Committee, JIPMER.
Footnotes
Publisher's Note
Springer Nature remains neutral with regard to jurisdictional claims in published maps and institutional affiliations.
Contributor Information
Sindhusuta Das, Email: sindhusuta87@gmail.com.
Nonika Rajkumari, Email: nonika.raj@gmail.com.
U. Revathi, Email: urevathibds@gmail.com
Anusha Gururajan, Email: gururajananusha6@gmail.com.
References
- (2020) Epidemiology of Plasmodium Vivax Malaria in India. https://www.ncbi.nlm.nih.gov/pmc/articles/PMC5201217/. Accessed 28 Feb
- (2018) World Health Organisation. World Malaria Report 2018. http://who.int/malaria/publication/world-malaria-report-2018/report/en/. Accessed 16 Apr 2020
- Tangpukdee N, Duangdee C, Wilairatana P, Krudsood S. Malaria diagnosis: a brief review. Korean J Parasitol. 2009;47(2):93–102. doi: 10.3347/kjp.2009.47.2.93. [DOI] [PMC free article] [PubMed] [Google Scholar]
- (2019) Fact sheet about Malaria. https://www.who.int/news-room/fact-sheets/detail/malaria. Accessed 4 Nov 2019
- Mukry SN, Saud M, Sufaida G, Shaikh K, Naz A, Shamsi TS. Laboratory diagnosis of malaria: comparison of manual and automated diagnostic tests. Can J Infect Dis Med Microbiol. 2017 doi: 10.1155/2017/9286392. [DOI] [PMC free article] [PubMed] [Google Scholar]
- Azikiwe CC, Ifezulike CC, Siminialayi IM, Amazu LU, Enye JC, Nwakwunite OE. A comparative laboratory diagnosis of malaria: microscopy versus rapid diagnostic test kits. Asian Pac J Trop Biomed. 2012;2(4):307–310. doi: 10.1016/S2221-1691(12)60029-X. [DOI] [PMC free article] [PubMed] [Google Scholar]
- Kochareka M, Sarkar S, Dasgupta D, Aigal U. A preliminary comparative report of quantitative buffy coat and modified quantitative buffy coat with peripheral blood smear in malaria diagnosis. Pathog Global Health. 2012;106(6):335–339. doi: 10.1179/2047773212Y.0000000024. [DOI] [PMC free article] [PubMed] [Google Scholar]
- Ohrt C, Sutamihardja MA, Tang D, Kain KC. Impact of microscopy error on estimates of protective efficacy in malaria-prevention trials. J Infect Dis. 2002;186(4):540–546. doi: 10.1086/341938. [DOI] [PubMed] [Google Scholar]
- Ranadive N, Kunene S, Darteh S, Ntshalintshali N, Nhlabathi N, Dlamini N, Chitundu S, et al. Limitations of rapid diagnostic testing in patients with suspected malaria: a diagnostic accuracy evaluation from Swaziland, a low-endemicity country aiming for malaria elimination. Clin Infect Dis. 2017;64(9):1221–1227. doi: 10.1093/cid/cix131. [DOI] [PMC free article] [PubMed] [Google Scholar]
- Johnston SP, Pieniazek NJ, Xayavong MV, Slemenda SB, Wilkins PP, da Silva AJ. PCR as a confirmatory technique for laboratory diagnosis of malaria. J Clin Microbiol. 2006;44(3):1087–1089. doi: 10.1128/JCM.44.3.1087-1089.2006. [DOI] [PMC free article] [PubMed] [Google Scholar]
- Hopkins H, González IJ, Polley SD, Angutoko P, Ategeka J, Asiimwe C, Agaba B, et al. Highly sensitive detection of malaria parasitemia in a malaria-endemic setting: performance of a new loop-mediated isothermal amplification kit in a remote clinic in Uganda. J Infect Dis. 2013;208(4):645–652. doi: 10.1093/infdis/jit184. [DOI] [PMC free article] [PubMed] [Google Scholar]
- Eshel Y, Houri-Yafin A, Benkuzari H, Lezmy N, Soni M, Charles M, Swaminathan J, et al. Evaluation of the parasight platform for malaria diagnosis. J Clin Microbiol. 2017;55(3):768–775. doi: 10.1128/JCM.02155-16. [DOI] [PMC free article] [PubMed] [Google Scholar]
- Snounou G, Viriyakosol S, Zhu XP, Jarra W, Pinheiro L, do Rosario VE, Thaithong S, Brown KN. High sensitivity of detection of human malaria parasites by the use of nested polymerase chain reaction. Mol Biochem Parasitol. 1993;61(2):315–320. doi: 10.1016/0166-6851(93)90077-B. [DOI] [PubMed] [Google Scholar]
- Siwal N, Singh US, Dash M, Kar S, Rani S, Rawal C, Singh R, Anvikar AR, Pande V, Das A. Malaria diagnosis by PCR revealed differential distribution of mono and mixed species infections by Plasmodium falciparum and P. vivax in India. PLoS ONE. 2018;13(3):e0193046. doi: 10.1371/journal.pone.0193046. [DOI] [PMC free article] [PubMed] [Google Scholar]
- Berzosa P, de Lucio A, Romay-Barja M, Herrador Z, González V, García L, Fernández-Martínez A, et al. Comparison of three diagnostic methods (microscopy, RDT, and PCR) for the detection of malaria parasites in representative samples from equatorial guinea. Malar J. 2018;17(1):333. doi: 10.1186/s12936-018-2481-4. [DOI] [PMC free article] [PubMed] [Google Scholar]
- Rodulfo H, De Donato M, Mora R, Gonzalez L, Contreras CE. Comparison of the diagnosis of malaria by microscopy, immunochromatography and PCR in endemic areas of Venezuela. Braz J Med Biol Res. 2007;40(4):535–543. doi: 10.1590/S0100-879X2007000400012. [DOI] [PubMed] [Google Scholar]
- Singh G, Urhekar AD, Singh R. Comparison of different methods for diagnosis of malarial parasites comparison of different methods for diagnosis of malarial parasites. MGM J Med Sci. 2015;2:131–136. doi: 10.5005/jp-journals-10036-1058. [DOI] [Google Scholar]
- Moody A. Rapid diagnostic tests for malaria parasites. Clin Microbiol Rev. 2002;15(1):66–78. doi: 10.1128/CMR.15.1.66-78.2002. [DOI] [PMC free article] [PubMed] [Google Scholar]