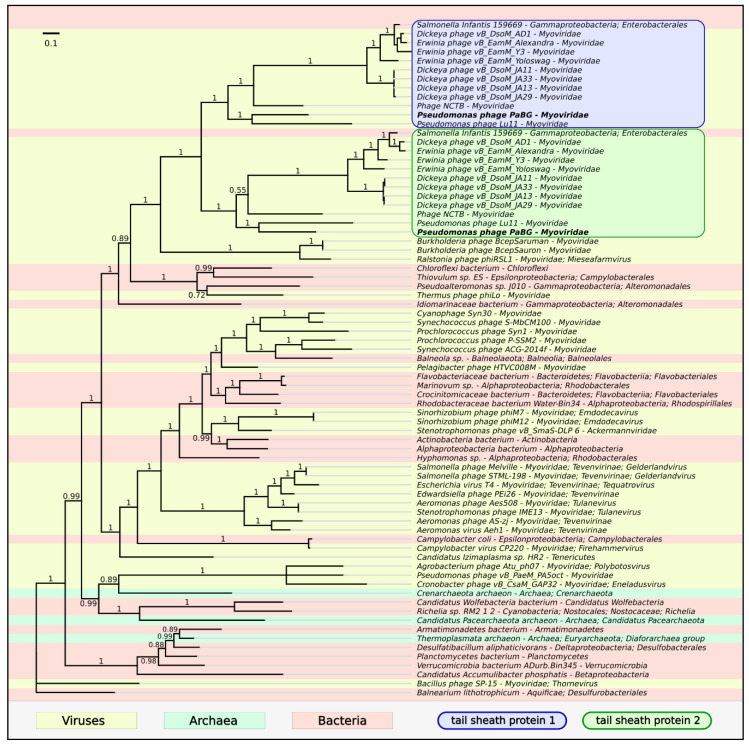
Figure 10.
Phylogenetic tree obtained with MrBayes based on tail sheath protein sequences and homologous sequences found with a BLAST search of NCBI databases. Bayesian posterior probabilities are indicated above their branch. Taxonomic classification is taken from NCBI sequence attributes and is shown to the right of the organism name. The scale bar shows 0.1 estimated substitutions per site and the tree was rooted to Bacillus phage SP-15; 1,100,000 generations sampled every 200 generations and an average standard deviation of split frequencies of 0.0036.

