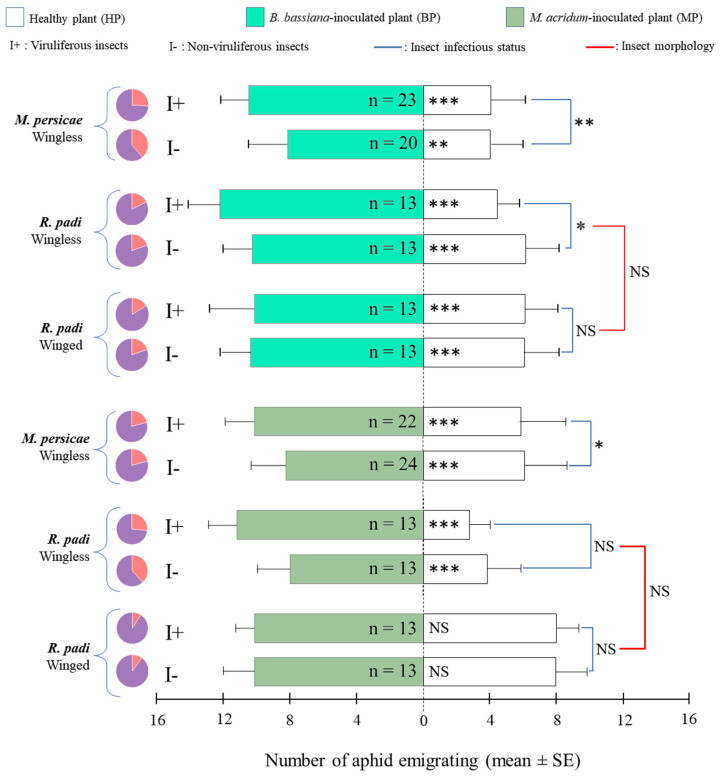
Figure 3.
Mean ± SE of insects migrating on healthy (HP) and EEPF-inoculated (MP and BP) plants pairwise-compared during dual-choices tests. Each test was performed by releasing 20 viruliferous (I+) or non-viruliferous (I-) insects and observed after 60 min. Pie charts denote the proportion of responding (purple) versus non-responding individuals (orange). n: number of replicates; *, **, *** and NS for p ≤ 0.05, p ≤ 0.01, p ≤ 0.001 and not significant at α = 0.05, respectively.

