

SUMMARY
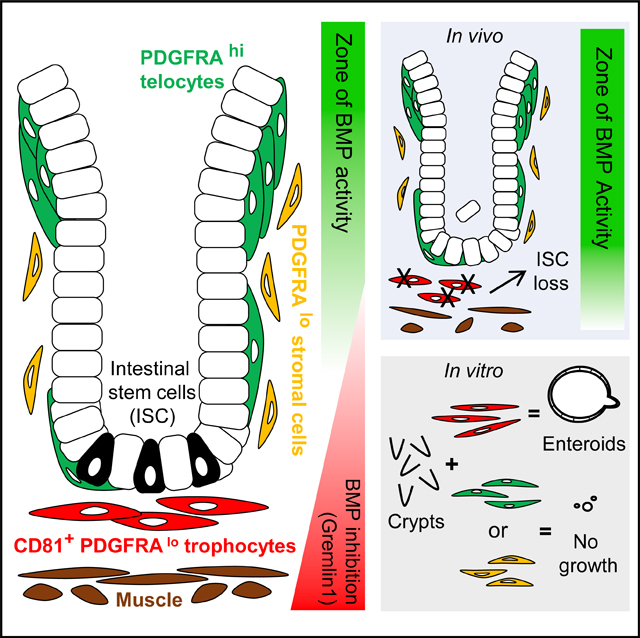
Intestinal stem cells (ISCs) are confined to crypt bottoms and their progeny differentiate near crypt-villus junctions. Wnt and bone morphogenic protein (BMP) gradients drive this polarity, and colorectal cancer fundamentally reflects disruption of this homeostatic signaling. However, sub-epithelial sources of crucial agonists and antagonists that organize this BMP gradient remain obscure. Here, we couple whole-mount high-resolution microscopy with ensemble and single-cell RNA sequencing (RNA-seq) to identify three distinct PDGFRA+ mesenchymal cell types. PDGFRA(hi) telocytes are especially abundant at the villus base and provide a BMP reservoir, and we identified a CD81+ PDGFRA(lo) population present just below crypts that secretes the BMP antagonist Gremlin1. These cells, referred to as trophocytes, are sufficient to expand ISCs in vitro without additional trophic support and contribute to ISC maintenance in vivo. This study reveals intestinal mesenchymal structure at fine anatomic, molecular, and functional detail and the cellular basis for a signaling gradient necessary for tissue self-renewal.
In Brief
Sub-epithelial mesenchyme generates signal gradients that sustain intestinal stem cells (ISCs). McCarthy and colleagues show that anatomically and functionally distinct cells produce the BMP gradient: telocytes predominate at the crypt-villus junction and express abundant BMPs, whereas trophocytes lie near ISCs at the crypt base and express the BMP inhibitor Grem1.
Graphical abstract
INTRODUCTION
Self-renewing tissues maintain a precise balance between stem and progenitor proliferation on the one hand and terminal differentiation on the other. Much attention now centers on tissue microenvironments that underlie this balance. The small intestine lends itself well to study niche structure and function, because Lgr5+ intestinal stem cells (ISCs) and transit-amplifying progenitors reside and replicate exclusively within crypts of Lieberkühn, while their post-mitotic progeny lie along contiguous villus structures (Clevers, 2013; Potten, 1998). At the crypt-villus junction, the transition between replicating and differentiated cells is abrupt, likely reflecting local signaling centers.
ISC function and crypt cell proliferation depends on canonical Wnt ligands and their Rspondin (RSPO) co-factors (Kim et al., 2005; Kuhnert et al., 2004; Pinto et al., 2003), whereas villus cell differentiation requires bone morphogenetic protein (BMP) signaling (Chen et al., 2019; He et al., 2004; Kosinski et al., 2007). Forced BMP inhibitor (BMPi) expression in mouse intestines induces ectopic ISCs and crypts along villi (Batts et al., 2006; Davis et al., 2015; Haramis et al., 2004), indicating that BMPi specifically promote ISC activity Qi et al., 2017. Furthermore, mutations that activate Wnt signaling are obligate events in colorectal cancer (CRC) and inactivating SMAD4 and SMAD2 mutations, which override BMP differentiation activity, are also common somatic defects (Fearon and Vogelstein, 1990; Cancer Genome Atlas Network, 2012). Mutations that increase expression of the BMPi gene GREM1 underlie a familial polyposis syndrome with elevated CRC risk (Davis et al., 2015; Jaeger et al., 2012). Thus, early intestinal tumorigenesis reflects liberation from physiologic constraints on Wnt and BMP signaling. In line with these physiologic signals, expansion of crypt epithelium or isolated ISCs into intestinal organoids requires recombinant (r) factors that activate Wnt and inhibit BMP signaling (Sato et al., 2009). Thus, homeostatic Wnt and BMP signals are accurately mirrored in intestinal tumors and organoid cultures.
Cells at the crypt-villus junction must therefore encounter signals that inhibit mitosis and trigger terminal differentiation. Sub-epithelial mesenchyme is a principal source of deterministic signals (Farin et al., 2012; Haramis et al., 2004; Kabiri et al., 2014), with the peri-cryptal stroma believed to create a Wnt/RSPO-enriched and BMP-poor milieu, while the villus lamina propria produces the reverse. The microenvironment is therefore classically depicted in terms of opposing gradients (Clevers, 2013; Roulis and Flavell, 2016; Sailaja et al., 2016), whose cellular basis remains obscure. Myofibroblasts (MFs) are commonly regarded as a source of trophic factors (Powell et al., 2011; Roulis and Flavell, 2016) but experimental evidence for this function is scant and, without other input, MFs may lack the heterogeneity to create sharp gradients. Recent studies implicate various mesenchymal cells as potential sources, including populations that express CD34, Foxl1, PDGFRA, or Gli1 (Aoki et al., 2016; Degirmenci et al., 2018; Greicius et al., 2018; Shoshkes-Carmel et al., 2018; Stzepourginski et al., 2015). However, the overlap and heterogeneity among these cells and functions, their roles in generating physiologic gradients, and the cellular basis of crucial BMP signal polarity remain unknown.
Using confocal microscopy of whole-mount intestinal tissue from wild-type and PdgfraH2BeGFP transgenic mice (Hamilton et al., 2003; Kurahashi et al., 2013), we examined the mesenchyme at high resolution. Coupled with ensemble and single-cell (sc) RNA sequencing (RNA-seq) of defined cell populations and unfractionated mesenchyme, this investigation identified likely sources of the physiologic BMP gradient: PDGFRAhi telocytes embedded in the basement membrane provide a reservoir of BMP ligands at the villus base, while a distinct pool of PDGFRAlo mesenchymal cells found exclusively beneath crypts expresses the surface protein CD81 and high RNA levels of the BMP inhibitor (BMPi) Grem1. Because the latter cells help sustain ISC in vivo and alone support ISC expansion into enteroid structures in vitro, in the absence of exogenous trophic Wnt/RSPO and BMPi factors, we call them trophocytes. Our findings thus reveal the functional architecture of an epithelial stem-cell niche, with two distinct and spatially polarized cell populations providing BMP ligands and antagonists at villus and crypt bases, respectively.
RESULTS
Stereotypic Organization of Small Intestine Mesenchyme
Mesenchymal signals responsible for intestinal epithelial self-renewal were once thought to originate largely in smooth muscle actin (SMA or ACTA2)-expressing MFs (Powell et al., 2011; Roulis and Flavell, 2016). Recent studies, however, implicate CD34+ (Stzepourginski et al., 2017), PDGFRA+ (Greicius et al., 2018), Foxl1+ (Aoki et al., 2016; Shoshkes-Carmel et al., 2018), and Gli1+ (Degirmenci et al., 2018) stromal cells as alternative sources of Wnt, RSPO, and BMP factors. We used whole-mount confocal microscopy (Bernier-Latmani et al., 2015) to resolve cell populations in the mouse small intestine. CD31+ capillaries abutting the basement membrane provided landmarks in each villus lamina propria, feeding into large blood vessels in the muscularis (Figure S1A). Every capillary plexus had adjacent TUJ1+ neuronal processes and enveloped classical SMA+ MFs and LYVE1+ lacteal vessels (Figures S1A–S1D). PdgfraH2BeGFP knockin mice (Hamilton et al., 2003; Kurahashi et al., 2013) revealed sub-epithelial cells in which GFP+ nuclei serve as a proxy for PDGFRA expression (Figure S1E). All nuclei between the capillary plexus and intestinal epithelium gave high GFP signals and were embedded in the basal lamina (Figures S1F and S1G). These cells were distinct from GFPhi Purkinje-like neural cells in the muscularis (Kurahashi et al., 2012) and their PDGFRA+ cell membranes enveloped the mucosa from the crypt base to villus tips (Figures 1A, 1B, S1H, and S1I), indicating that sub-mucosal GFPhi cells correspond to Foxl1+ telocytes (Aoki et al., 2016; Shoshkes-Carmel et al., 2018). Notably, telocyte distribution along the crypt-villus long axis is non-uniform. We did not detect enrichment in crypts, but found substantially higher cell density at the villus base and a second, lesser concentration at villus tips (Figures 1A, 1B, and S1J; Videos S1 and S2). This axial asymmetry was evident throughout the small intestine, implying that along the crypt-villus axis, secreted telocyte products concentrate at these levels.
Figure 1. Anatomically and Molecularly Distinct PDGFRA+ Populations in Small Intestine Mesenchyme.
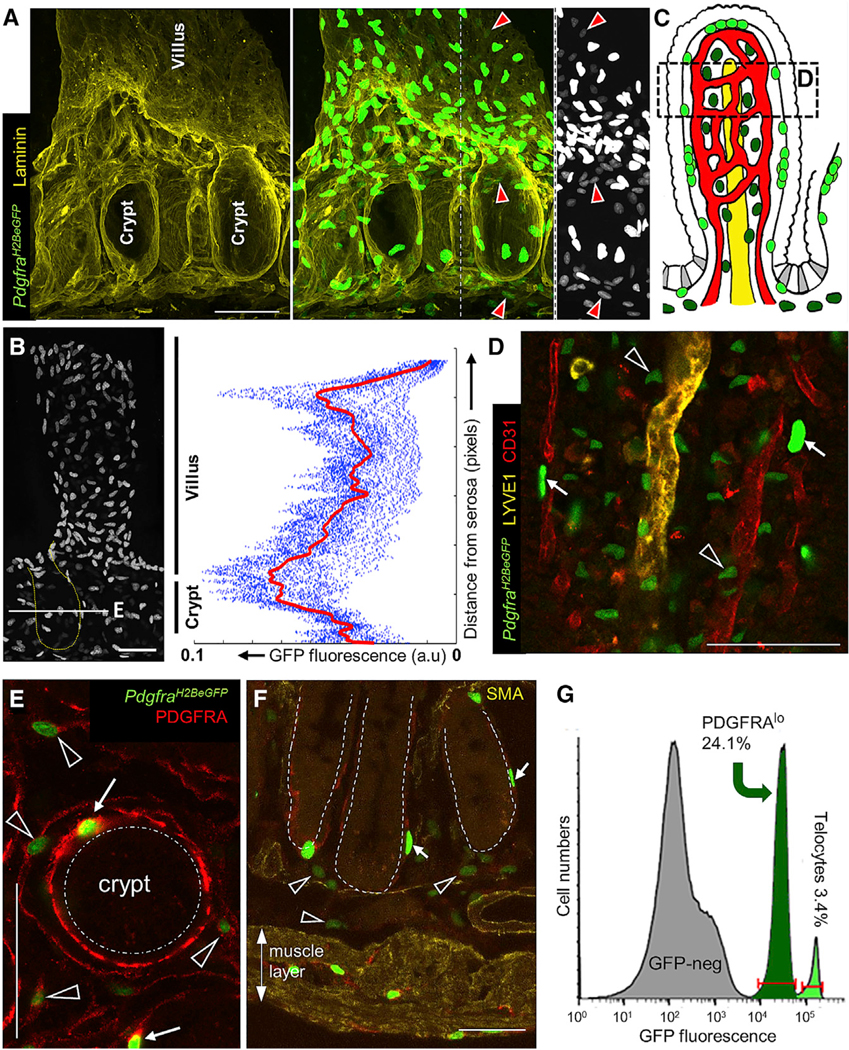
(A) 3D-rendered image of representative intestinal crypts in PdgfraH2BeGFP mice (left: laminin immunostain, right: laminin + GFP, far right: single crypt showing only GFP in grayscale). Telocytes with bright nuclear fluorescence concentrate at the crypt-villus junction; a separate population of Pdgfralo cells (red arrowheads) is best appreciated in the grayscale image on the far right.
(B) Single crypt-villus unit (crypt outline dotted), showing non-uniform telocyte abundance along the vertical axis. Right: GFPhi signals quantified along crypt-villus units. Dots represent the signal quantified along each unit; the red line represents the mean signal. The white line in the micrograph indicates the level represented in (E).
(C) Telocyte (neon green) and PDGFRAlo cell (bottle green) distributions illustrated in relation to blood (red) and lymphatic (yellow) vessels, epithelium (white), and Lgr5+ ISC (gray). The region represented in (D) is boxed.
(D) 3D-rendered image of telocyte (arrows) and PDGFRAlo cell (arrowheads) positions along the villus radial axis, shown over a region represented by the box in (C). Telocytes are apposed to the epithelium, whereas PDGFRAlo cell lie deeper, intermingled with capillaries.
(E) Crypt cross-section (approximate level marked by the line in B), showing relative positions, PDGFRA expression levels, and cytoplasmic sweep of telocytes (arrows) and PDGFRAlo cells (arrowheads).
(F) PDGFRAlo cells (arrowheads) are present below crypts (dotted outlines), in the submucosa; PDGFRAhi cells (arrows) include telocytes and other cells in the muscularis, as described previously (Kurahashi et al., 2012; Shoshkes-Carmel et al., 2018). All scale bars, 50 μm.
(G) GFP flow cytometry separates telocytes from the larger population of PDGFRAlo cells.
See also Figure S1.
PdgfraH2BeGFP mice revealed a second population of cells with lower GFP signals. GFPlo cells in the lamina propria lie deep to the vascular plexus (Figure 1C-D), distinct from GFPhi telocytes. Even around crypts, GFPlo cells lie farther from the epithelium than telocytes (Figure 1E) and are plentiful between crypt bases and external muscle layers (Figure 1F). By immunostaining and flow cytometry, GFPlo cells express less PDGFRA than telocytes, outnumber the latter cells several-fold, and have an expansive cytoplasm (Figures 1E and 1G). GFPlo nuclei were not associated with SMA+ cytoplasm or peri-endothelial NG2+ cells (Figures S1K–S1O), indicating that PDGFRAlo cells are not MFs or pericytes. Together, these findings reveal stereotypical organization of intestinal mesenchyme, with telocytes, blood endothelium, pericytes, MFs, and lymphatic channels present at increasing distance from the mucosa. Judging by both microscopy and flow cytometry, distinctive PDGFRAlo cells represent approximately a quarter of the stroma and intersperse among MFs from villus tips into the deep sub-mucosa.
Distinctive Global and Signaling Profiles of Telocytes and PDGFRAlo Sub-epithelial Cells
Previous studies refer to PDGFRA+ sub-mucosal cells collectively as “myofibroblasts” and implicate telocytes and unfractionated PDGFRA+ cells as Wnt and RSPO sources, respectively (Aoki et al., 2016; Greicius et al., 2018; Shoshkes-Carmel et al., 2018). To resolve cellular identities and function, first we stripped away the external muscle to eliminate GFPhi Purkinje-like cells (Figure S2A). Flow cytometry with PDGFRA antibody (Ab) detected a fraction of PDGFRA+ cells, especially PDGFRAhi (GFPhi) but discriminated the two populations less well than GFP (Figures 1G and S2B), which we used instead to purify these populations. Because endothelium supports other tissues (Ding et al., 2012; Shen et al., 2004; Yoshida et al., 2007), we also used CD31 and LYVE1 Ab to isolate blood and lymphatic endothelial cells (Figure S2C). The four transcriptomes were distinct from one another and from those of Lgr5+ ISC or other epithelial cells (Figures S2D and S2E). Known marker genes indicated cell purity, confirmed telocytes as unique Pdgfrahi Foxl1+ cells, and indicated that markers recently used to isolate mesenchymal populations (Degirmenci et al., 2018; Greicius et al., 2018; Shoshkes-Carmel et al., 2018; Stzepourginski et al., 2017) are not restricted to single cell types (Figure 2A). Specifically, Cd34 and Pdpn (Glp38) levels are highest in PDGFRAlo cells and telocytes, respectively, while Gli1 is expressed equally in these populations. Notably, PDGFRAlo cells and telocytes differ in expression of >2,400 genes (Figure 2B, q < 0.05, log2 fold-difference >1.5), verifying that they are distinct from one another.
Figure 2. Distinct Niche Signals and Epithelial Supportive Functions of Intestinal Telocytes and PDGFRAlo Stromal Cells.
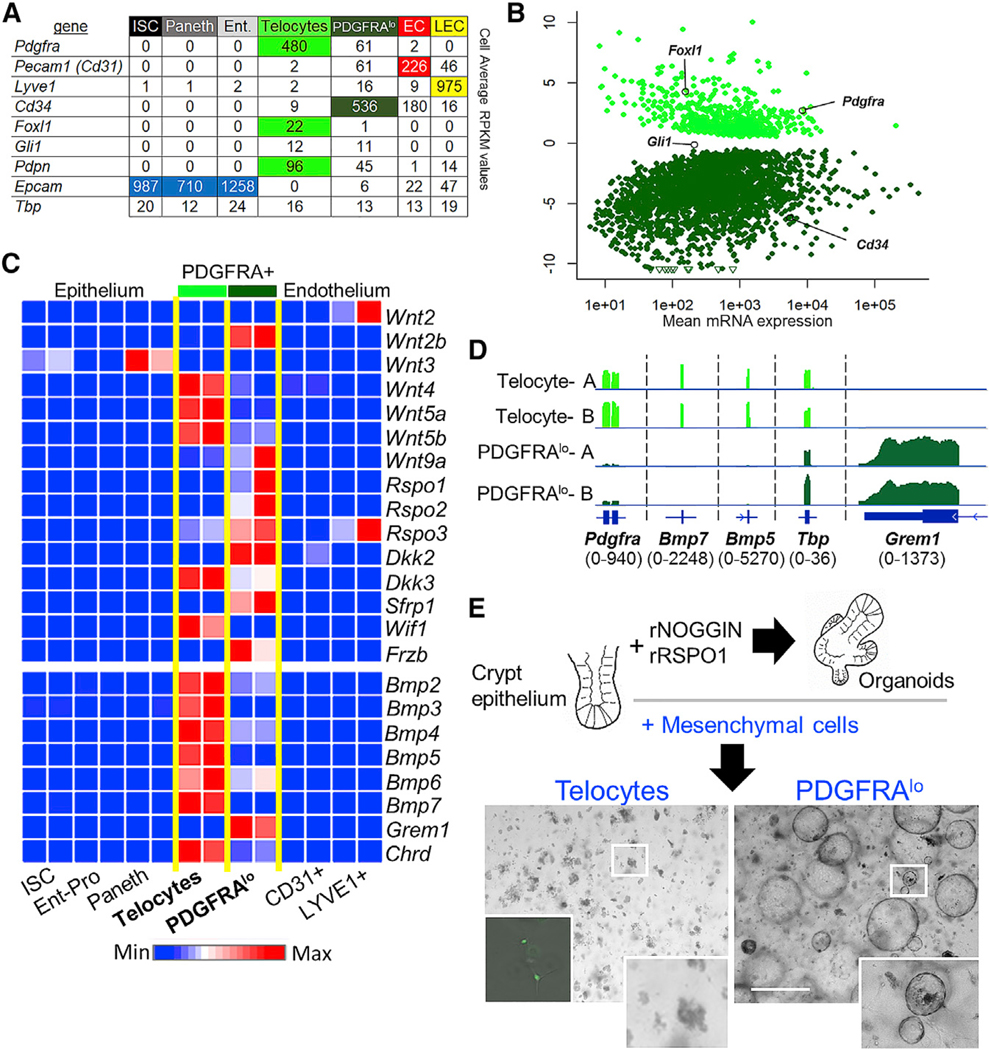
(A) Average normalized reads per kilobase per million (RPKM) values of known marker genes from duplicate RNA-seq libraries of the indicated cell types. Telocytes express the highest Pdgfra levels and alone express Foxl1, while PDGFRAlo cells express Cd34 and are the only other Pdgfra- expressing cell type. Pdpn and Gli1, markers recently ascribed to stromal cell populations (Degirmenci et al., 2018; Stzepourginski et al., 2017), express at roughly equal levels in telocytes and PDGFRAlo cells. Tbp, a representative house-keeping gene, confirms accurate library normalization.
(B) Differential expression of >2,400 transcripts (q < 0.05, log2 fold-difference >1.5) in telocytes and PDGFRAlo cells; selected genes are shown.
(C) Relative expression of secreted niche factor mRNAs in purified epithelial and mesenchymal cell populations, selected from a full set of Wnt and BMP pathway agonists and antagonists (Table S1). The heatmap is prepared from normalized values for RPKM averaged from duplicate RNA-seq libraries of each cell type.
(D) Integrative genome viewer (IGV) tracks showing RNA-seq data for Bmp5, Bmp7, Grem1, and Pdgfra in duplicate cell isolates. Tbp controls for proper normalization of read counts and the numbers in parentheses refer to the range of signal values.
(E) Co-culture of isolated mouse small intestine crypts in Matrigel, showing that PDGFRAlo cells (n = 12), but not telocytes (n = 7, left inset shows viable GFP+ telocytes), substitute for recombinant factors NOGGIN and RSPO1 to generate abundant spherical enteroid structures. Boxed areas are magnified in the bottom right insets. Scale bar, 1 mm.
Although some PDGFRA— cells express Rspo3, Wnt2, and Wnt3, as other groups have noted (Gregorieff et al., 2005; Ogasawara et al., 2018), RNAs encoding Wnt- and BMP-pathway factors are especially enriched in telocytes and PDGFRAlo cells (selected transcripts shown in Figure 2C, full list in Table S1). In particular, PDGFRAlo cells express the canonical ligand Wnt2b and three Wnt-potentiating Rspo factors, while telocytes mainly express non-canonical Wnt4, Wnt5a, and Wnt5b ligands and less Rspo mRNA than PDGFRAlo cells; both cell types express Wnt inhibitors. Intestinal Wnt gradients are therefore not readily attributed to any cell type. In contrast, transcripts for BMP signaling were polarized, with multiple agonists present largely in telocytes. In other tissues, BMP2/7 and BMP4/7 heterodimers signal more potently than BMP2 or BMP4 homodimers (Aono et al., 1995; Kaito et al., 2018; Kim et al., 2019), and Bmp7 transcripts are confined to telocytes. Among BMPi, Grem1 is restricted to PDGFRAlo stromal cells, while Chrd is expressed higher in telocytes (Figures 2C and 2D; Table S1).
Because both PDGFRA+ cell types express positive and negative regulators of crypt epithelium, we examined their niche functions in co-cultures with isolated crypt epithelium. In Matrigel supplemented with RSPO1 and NOGGIN, isolated crypt epithelium robustly generates organoid structures (Sato et al., 2009), and in lieu of these factors, we added 4 × 10⁴ cells of each PDGFRA+ type, purified by GFP flow cytometry. Although GFP+ telocytes persisted in co-culture for many days, crypt epithelium routinely died within 48 h; in contrast, PDGFRAlo cells robustly induced large spheroid epithelial structures (Figure 2E). Thus, GFPlo cells substitute effectively for RSPO and BMPi to generate enteroid structures in vitro. However, the structures propagated inefficiently in serial passage (Figure S2F); we return to this point below.
Pdgfra Marks Three Distinct Mesenchymal Cell Populations
Because both PDGFRAlo cells and telocytes appear throughout the crypt-villus axis, we applied single-cell (sc) RNA-seq to identify molecularly defined subpopulations. Among 2,595 PDGFRA+ cells, each providing information on at least 2,000 transcripts, graph-based clustering (STAR Methods) revealed 3 distinct cell types (Figure 3A). Known molecular markers identified these as Cd34— Pdgfrahi Foxl1+ telocytes and two Cd34+ Pdgfralo Foxl1— subpopulations, Lo-1 and Lo-2 (Figures 3A and S3A). Further characterization revealed each population to be homogeneous and different from the others (Figure 3B). Among genes that discriminate between the three PDGFRA+ cell types, Bmp5, Bmp7, and Bmp3 ranked just below Pdgfra; Grem1 was the 3rd best marker of Lo-1 cells; and Sfrp1, a Wnt antagonist, best distinguished PDGFRAlo cells from telocytes (Figures 3C and 3D; Table S2). Single-cell RNA (scRNA) analysis also revealed stark differential expression of various BMP and Wnt agonists, co-factors, and inhibitors (Figure S3B). These data thus identify two PDGFRAlo populations with distinctive signaling potential. Of note, PDGFRAlo cells support isolated crypt epithelium in vitro (Figure 2E) despite high levels of Wnt antagonist mRNAs (Figure S3B), implying again that loco-regional Wnt control has a likely complex basis.
Figure 3. sc-RNA Sequencing Reveals Three Distinct PDGFRA+ Populations.
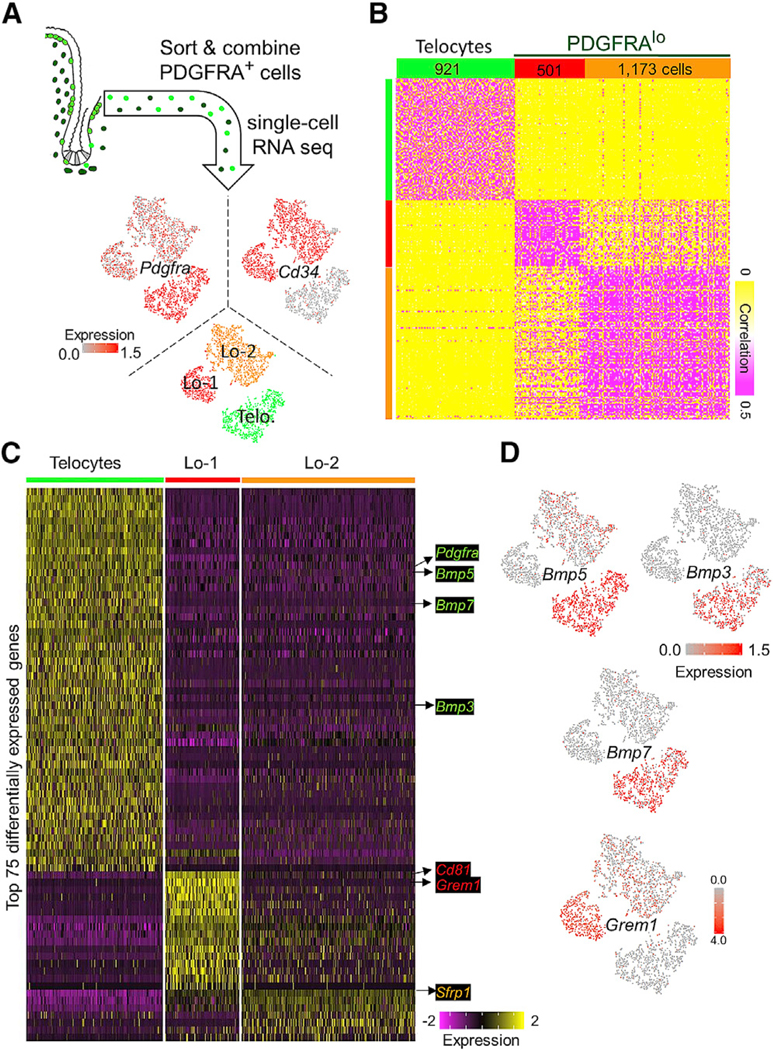
(A) GFPhi and GFPlo cells were sorted from PdgfraH2BeGFP mouse intestinal mesenchyme and combined for single-cell (sc) RNA-seq. t-Distributed stochastic network embedding (t-SNE) of data from 921 GFPhi and 1,674 GFPlo (PDGFRAlo) cells reveals three populations. Cd34—Pdgfrahi telocytes are distinct from two novel Cd34+ PDGFRAlo subpopulations.
(B) Unsupervised clustering verified the similarities within, and differences between, the three cell groups.
(C) Genes differentially expressed among the three PDGFRA+ mesenchymal cell types (p < 0.01, average log2 fold change >1). BMP ligand transcripts are highly enriched in telocytes, Cd81, and Grem1 are two of the three best distinguishers of Lo-1 cells, and Sfrp1 best distinguishes both PDGFRAlo populations from telocytes.
(D) Projection of Bmp5, Bmp3, Bmp7, and Grem1 single-cell transcript density onto the t-SNE map.
Above, we compared PDGFRA+ cell transcriptomes with those of endothelial and epithelial cells (Figure 2). To study their broader relationship to the tissue, we profiled transcripts in external muscle-depleted whole small intestine mesenchyme by scRNA-seq. As expected, a large fraction of the tissue consisted of Cd45+ (Ptprc+) leukocytes, which we do not consider further, except for a small Ptprc+ immune cluster that co-expresses Pdgfra and Cd52 (Figure S4A). The remaining 3,763 cells included glial (Gfap+ S110b+), pericyte (Rgs5+ Pdgfrb+), lymphatic (Lyve1+) and blood (Pecam1+) endothelial, and Ptprc+ Cd52+ immune cells (Figures 4A and S4B). Pdgfra+ cells clustered distinctly and outnumbered all other populations, followed by MFs (Acta2hi Myh11hi). Consistent with PgfraH2BeGFP histology and flow cytometry (Figure 1), Pdgfralo cells were in the majority (Figure 4A-B). The global analysis confirmed that Gli1, Pdpn, and other markers previously used to investigate the intestinal mesenchyme are expressed broadly (Figure 4B), and Pdgfralo cells form two abundant Cd34+ sub-clusters, with uniformly high Grem1 in one (Figure 4C). Of note, Foxl1 was not confined to telocytes, but also expressed in MFs (Figure 4C); conversely, Acta2 was not restricted to MFs, but also present in pericytes and telocytes. Bmp7, which is necessary in other tissues to generate active BMP heterodimers (Aono et al., 1995; Kaito et al., 2018; Kim et al., 2019), was absent from cells other than telocytes (Figure 4C). Few cell types showed high levels of Wnt signaling factors, beyond those we identified from bulk RNA data (Figure 2) and additional Wnt inhibitors in MF, immune, and glial cells (Figure 4D). Only three canonical ligands were appreciable: Wnt2 in lacteal endothelium, low-level Wnt2b in Pdgfralo cells and MFs, and Wnt6 in glial cells.
Figure 4. Pdgfralo Cells Are the Dominant Resident Population in the Small Bowel Mesenchyme.
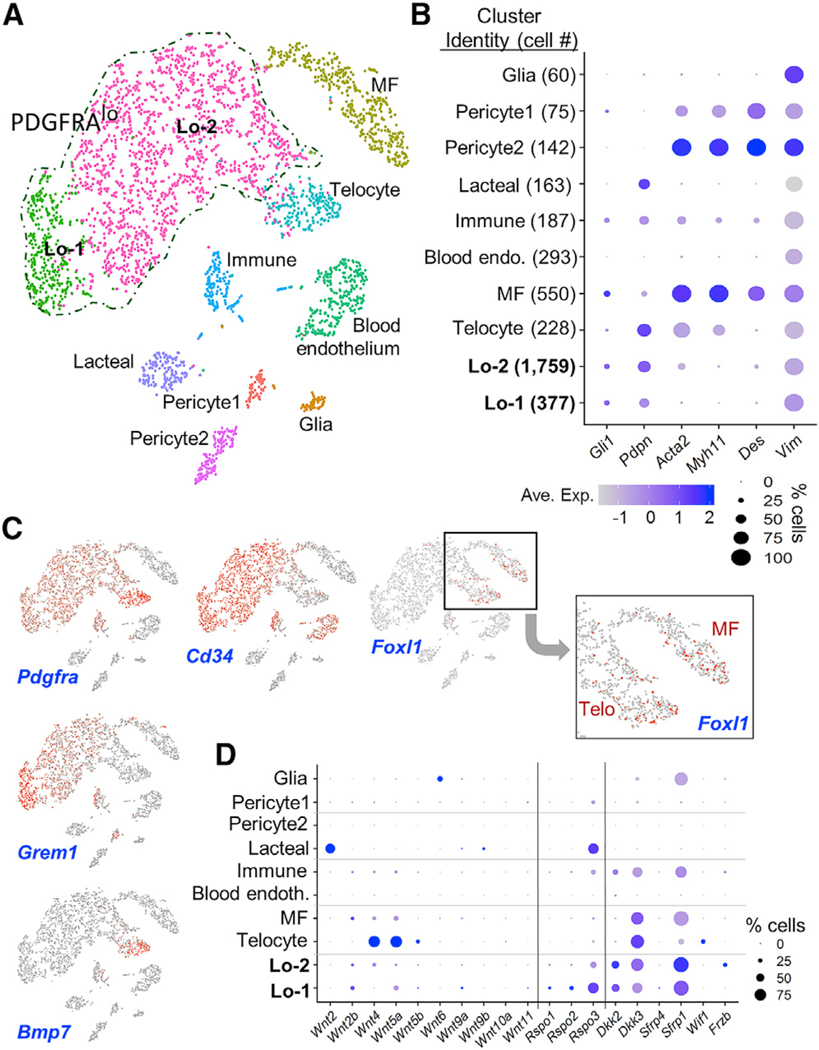
(A) Clustering of 10 discrete cell populations by t-SNE of RNA profiles from 3,763 single mesenchymal cells, excluding Ptprc+ leukocytes.
(B) Relative expression of known stromal cell markers in cell clusters identified by scRNA-seq. Circle sizes represent the within-cluster probability of gene detection and fill colors represent normalized mean expression levels.
(C) Projection of Pdgfra, Cd34, Foxl1, Grem1, and Bmp7 single-cell transcript density onto the t-SNE map. Foxl1+ cell clusters are magnified, showing expression in both telocytes and MFs.
(D) Relative expression of Wnt, Rspo, and Wnt inhibitor transcripts in the single-cell clusters.
See also Figure S4.
To resolve the anatomic distribution of Pdgfra+ cells, we used RNA in situ hybridization. Grem1, a distinctive Lo-1 marker, was previously shown to be restricted to the deep intestinal sub-mucosa (Davis et al., 2015; Worthley et al., 2015). We found that its expression domain encompasses external smooth muscle and cells that are prominently and uniformly arrayed just below intestinal crypts (Figure 5A). In PdgfraH2BeGFP intestines, Grem1 was confined to PDGFRAlo cells in this location and, in agreement with absence of Grem1 mRNA in telocytes and low expression in Lo-2 cells (Figures 3D and 4C), neither basement membrane-embedded telocytes nor PDGFRAlo cells situated above and around crypts gave signals (Figure 5A). Cells lying between Grem1+ PDGFRAlo cells (Lo-1) and crypt epithelium also lacked Grem1 (Figure 5A), suggesting that any signal transmission between these compartments is likely paracrine. In contrast, Bmp5 and Bmp7 predominate in telocytes and concentrate at the villus base (Figure 5B), where telocytes congregate (Figure 1A). Peri-cryptal telocytes also express Bmp transcripts (Figure 5C), consistent with scRNA evidence for uniform Bmp expression in PDGFRAhi cells (Figure 3D). scRNA data from whole mesenchyme confirmed that Bmp ligands, including Bmp7, predominate in telocytes (Figure 5D). These data collectively implicate telocytes as the dominant source of mesenchymal BMP signals and Grem1+ Lo-1 cells as a unique sub-cryptal population that may neutralize those signals. We propose that polarized distribution of these distinctive cells underlies the intestinal BMP gradient (Figure 5E).
Figure 5. Spatial Polarity of Grem1 and Bmp Expression.
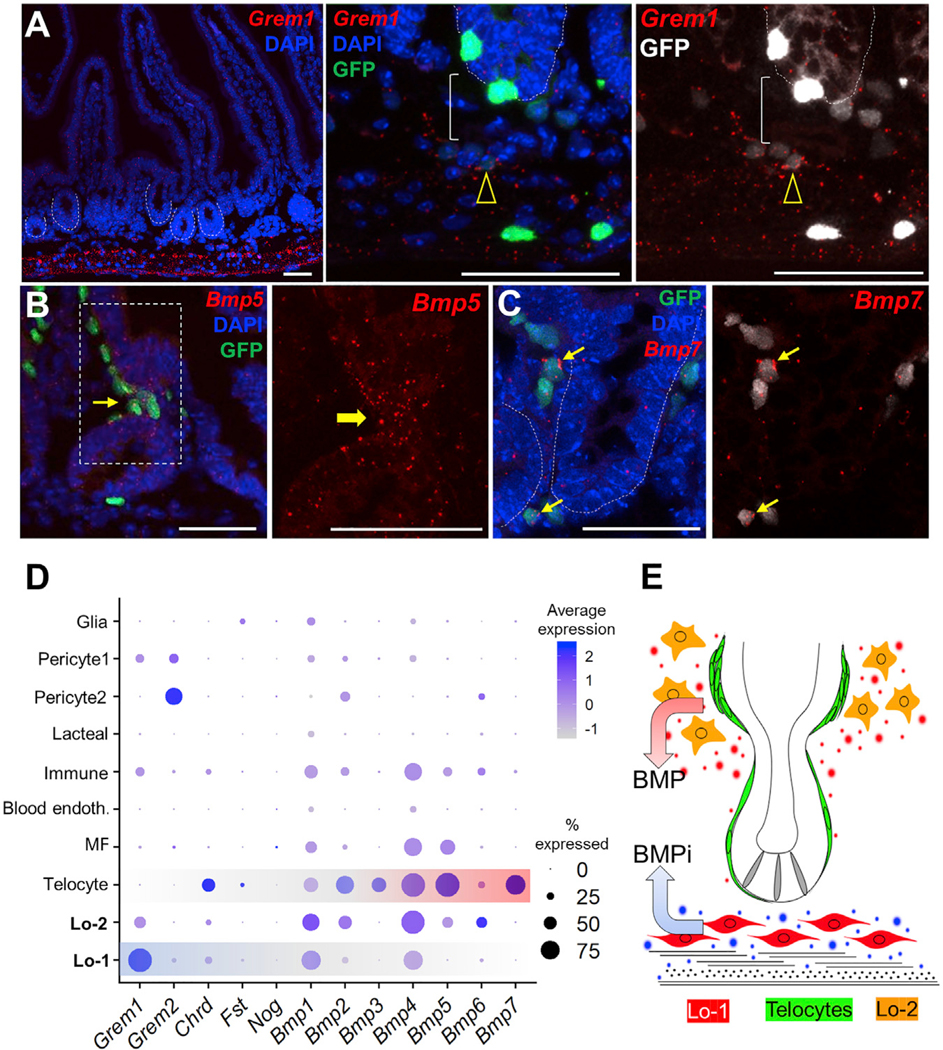
(A) RNA in situ hybridization localizes Grem1 transcripts largely in two parallel stripes. Beneath the crypt epithelium (dotted outlines), confocal microscopy further localizes Grem1 mRNA in PDGFRAlo cells (arrowhead), revealing a gap (bracket) between these sub-cryptal cells and the epithelium. To highlight this gap, GFP signal is rendered in gray to the right. PDGFRAhi pericryptal (telocytes) and muscularis (Purkinje-like) cells lack Grem1. Images represent dozens of microscopic fields examined in three independent experiments.
(B and C) In situ hybridization localizes Bmp5 (B) and Bmp7 (C) mRNAs in telocytes (arrows), which embrace the epithelium and concentrate at the crypt-villus boundary. Images represent dozens of microscopic fields examined in three independent experiments, and boxed regions are magnified in panels to the right. In light of the absence of Bmp5 mRNA in crypt epithelial cells (Table S1), the faint epithelial signal is likely background noise. All scale bars, 50 μm.
(D) Relative expression of BMP inhibitors and ligands in single-cell clusters identified in unfractionated mesenchyme.
(E) Model of the mesenchymal BMP gradient, showing telocytes (green) as the major and Lo-2 cells (orange) as possibly minor sources of BMP agonists concentrated at the villus base, with sub-cryptal Lo-1 cells (red) providing BMPi near the crypt base to oppose that signal (ISCs in gray).
Lo-1 Cells Contribute to Sustain Lgr5+ ISC In Vivo and Organoid Growth In Vitro
scRNA data from PDGFRA+ cells identified unique molecular markers. Cd81, which encodes a cell surface tetraspanin, best distinguished Lo-1 from other PDGFRA+ cells (Figure 3C; Table S2) and was useful to separate PDGFRA+ subpopulations, as we show below. However, Cd81 expression in epithelial and other mesenchymal cells (Figure S4C) precludes its utility in depleting Lo-1 cells selectively. Grem1 being more restricted (Figures 3D, 4C, 5A, and 5D), we crossed Grem1Cre-ER(T2) mice (STAR Methods) with Rosa26L-S-L(EYFP) reporter mice (Srinivas et al., 2001). After CRE induction, YFP was evident in SMA+ external muscle (cells excluded from the preceding analyses) and in SMA— mesenchymal cells lying just above the muscularis (Figure S4D), in the same region as Lo-1 cells. Pdpn is abundant in PDGFRA+ cells (Figures 2A and 4B), and immunohistochemistry (IHC) and flow cytometry also localized YFP (Grem1) to a small PDPN+ fraction, as expected for Lo-1 (Figure S4E). We therefore generated Grem1Cre-ER(T2);Rosa26L-S-L(DTR) mice (Buch et al., 2005), expecting tamoxifen to induce Diphtheria toxin (DT) receptor in Grem1+ cells. As Grem1 is absent from the epithelium (Figures 2C and 5A), the effects of treating the mice with DT will reflect ablation of stromal cells, including Lo-1 and the external muscles, but not MFs or telocytes. Indeed, treatment of Grem1Cre-ER(T2);Rosa26iDTR/YFP mice with DT depleted Grem1+ cells efficiently within 2 days (Figures 6A and S5A), including external muscle, but sparing PDPN+ cells other than the Grem1+ subpopulation (Figures S5B and S5C). DT-treated mice survived 8–9 days and necropsies showed edematous intestinal dilation (Figure S5D). Histology over the preceding days showed muscle loss, leukocyte infiltration, and progressive crypt degeneration with attenuation of villus height; the ileum was affected more severely than the duodenum (Figures 6B and S5E).
Figure 6. Grem1+ Mesenchymal Cells Sustain ISC In Vivo.
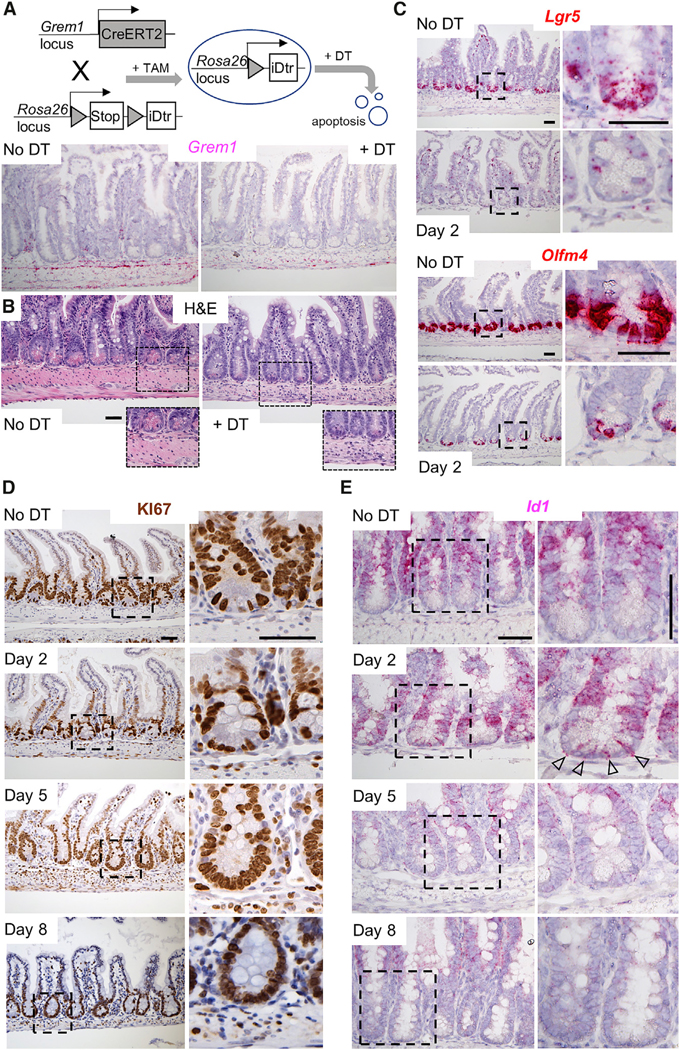
(A) Targeting strategy for depletion of Grem1+ cells. Ablation of Grem1+ cells is verified by absence of Grem1 mRNA (in situ hybridization) two days after the second of 2 DT injections.
(B) Histology (H&E) shows reduced external muscle, inflammatory infiltrates, and disrupted epithelial morphology within 5 days of Grem1+ cell ablation. Boxed regions are magnified in the insets.
(C) Expression of ISC markers Lgr5 and Olfm4 is markedly attenuated within two days of Grem1+ cell ablation.
(D) Replicating (KI67+) TA cells remain in intestines depleted of Grem1+ cells and occupy the crypt bottoms, which are depleted of Lgr5+ ISC.
(E) BMP target gene Id1 is increased two days after Grem1+ cell ablation, selectively in crypt base columnar cells, and subsequently lost, coincident with ISC attrition.
All images depict data from three or four independent mice. Boxed areas in each image are magnified to the immediate right. All scale bars, 50 μm.
See also Figures S5 and S6.
ISCs, represented by the markers Lgr5 and Olfm4, were substantially reduced, starting by the 2nd day after DT exposure and remaining low to absent thereafter (Figures 6C and S6A). TA cells, which normally reside above the ISC and Paneth cell zone, continued to replicate and extended into the space previously occupied by ISCs (Figure 6D). Paneth cells, which normally lie between ISCs, were also reduced, either as a direct effect of Grem1+ cell deficiency or a secondary consequence of ISC depletion, whereas goblet cells were substantially increased (Figures 6D, S5E, and S6B). Because Lo-1 cells express Rspo mRNAs, and PDGFRAlo cells support enteroid growth without supplemental factors, we expected Grem1+ cell loss to possibly affect TA cells, but their continued replication indicates that Grem1+ cells are dispensable for Wnt-dependent TA cell proliferation. Nevertheless, the canonical Wnt target gene Axin2 was decreased in all DT-treated Grem1Cre;Rosa26iDTR mice at all times (Figure S6B). Among many possibilities, one is that Grem1+ Rspo3hi sub-epithelial cells increase Wnt tone to the levels necessary for Axin2 expression, while cell replication requires lesser Wnt signaling.
Our hypothesis that ISCs depend on sub-cryptal Lo1-cells for BMPi predicts increased BMP signaling in DT-treated Grem1Cre;Rosa26iDTR ISC. To test this postulate, we performed in situ hybridization for the well-known intestinal BMP target gene Id1 (Ogata et al., 1993; Valdimarsdottir et al., 2002). Id1 mRNA was absent from the crypt base before DT exposure, as expected; it appeared there on day 2 in cells with ISC morphology, reflecting increased BMP signaling, and was absent thereafter, consistent with ISC attrition (Figures 6E and S6C). Together, these findings implicate some combination of sub-cryptal Grem1+ cells (i.e., Lo-1 and/or external smooth muscle) as a crucial source of BMPi in vivo. To interrogate the specific role of Grem1+ Lo-1 cells, we returned to enteroid co-cultures.
Lo-1 Cells (Trophocytes) Alone Sustain Organoid Growth In Vitro
Unfractionated PDGFRAlo cells support enteroid growth (Figure 2E) and to distinguish which subpopulation carries this trophic activity, we sought to separate Lo-1 from Lo-2 cells. Among PDGFRA+ cells, Cd81 is highly enriched in the Lo-1 group and flow cytometry readily separated PDGFRAlo cells into CD81+ (Lo-1) and CD81— (Lo-2) fractions (Figures 7A and S4C). Isolated cells retained their molecular signatures in vitro (Figure S7A) and when mixed with isolated crypt epithelium, Lo-1 cells robustly expanded enteric spheroids, whereas equal numbers of Lo-2 cells allowed only a few crypts to survive but barely expand (Figure 7B). Enteroid growth was proportional to the number of CD81+ PDGFRAlo cells (Figure S7B) and, in contrast to unfractionated PDGFRAlo cells, the structures stimulated by CD81+ PDGFRAlo cells could be passaged (Figure 7C), indicating ISC self-renewal. Because these cultures occurred in Matrigel, a matrix of unknown composition, we repeated them in collagen. Culture of crypt epithelium and CD81+ PDGFRAlo cells in adjacent collagen droplets stimulated enteroid growth at the interface (Figure S7C). Thus, sub-cryptal Lo-1 cells provide diffusible trophic factors sufficient to potentiate Wnt and oppose BMP signals, effectively replicating crypt conditions in vitro; hence we call these cells trophocytes. Unfractionated PDGFRAlo cells likely failed to support long-term ISC self-renewal (Figure S2F) because factors in the dominant Lo-2 population, which lies far from the crypt bottom, limit trophocyte-induced ISC expansion.
Figure 7. Grem1+PDGFRAlo Cells Selectively Express CD81 and Support Enteroid Growth.
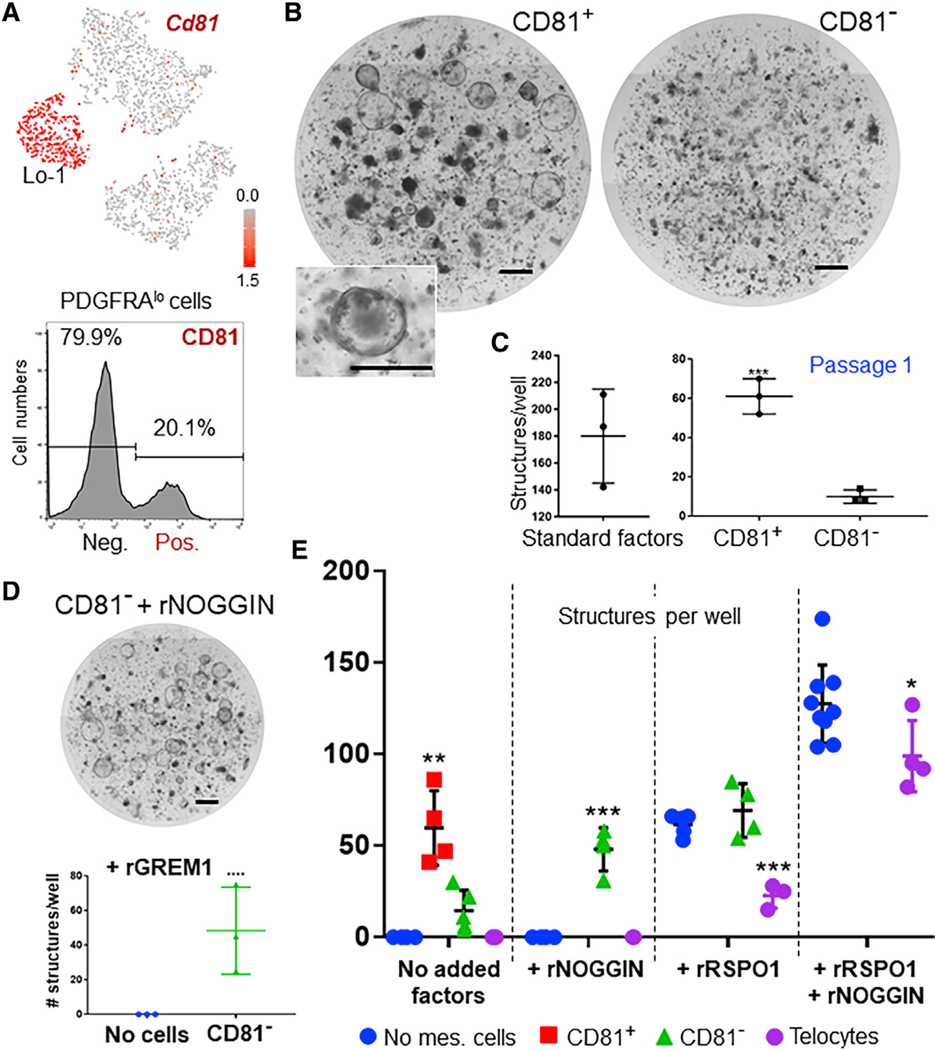
(A) Top: Cd81 transcript levels projected onto the t-SNE map of scRNA-seq data (Figure 3), showing highly enriched expression in Lo-1 cells. Bottom: PDGFRAlo cell separation into CD81+ and CD81+ subpopulations by flow cytometry with CD81 Ab.
(B) Co-culture of isolated crypt epithelium with CD81+ and CD81— PDGFRAlo cells in the absence of recombinant trophic factors, showing enteroid growth stimulated by the CD81+ but not by the CD81— fraction. Inset shows one magnified enteroid.
(C) Successful propagation of structures produced in CD81+ co-cultures. Standard conditions: rRSPO1, rNOGGIN, and rEGF. n = 3 experiments each.
(D) Addition of rNOGGIN or rGREM1 to CD81— crypt co-cultures overcomes their inability to support enteroid growth.
(E) Quantitation of spheroid structures from multiple (n, 3 to 5) experiments of crypt epithelium co-culture with the indicted mesenchymal cells and recombinant (r) factors. Bars represent mean ± SEM values. Significance of differences was determined by two-tailed t test, one-way ANOVA.
**p < 0.01; ***p < 0.001; n.s., not significant. All scale bars, 1 mm.
See also Figure S7.
Rspo RNA levels being more comparable in CD81+ and CD81— PDGFRAlo cells than Grem1 RNA (Figures 4D and S3B), we asked whether a BMPi alone might explain their contrasting effects on enteroid growth. In control experiments, individual factors replicated the activities reported in the absence of other cells (Sato et al., 2009) (Figure S7D). Supplementation of CD81— cell co-cultures with rNOGGIN or rGREM1 robustly stimulated enteroids, while rRSPO1 only promoted growth to the levels seen with corresponding controls (Figures 7D, 7E, and S7E). Thus, BMPi is a key niche component that distinguishes trophocytes from supra-cryptal CD81— PDGFRAlo cells. Supplemental rNOGGIN did not confer trophic potential on telocytes and crypts co-cultured with telocytes developed fewer spheroids with either rRSPO1 or in complete medium (Figure 7E). These findings reveal telocyte limitations in supporting spheroid growth and suggest that they may even exert suppressive effects.
DISCUSSION
Brisk self-renewal of the intestinal epithelium ensures a steady supply of short-lived enterocytes and secretory cells to digest food, secrete hormones, and resist microbial entry. The intestinal lumen is not a sterile space and microbe-induced inflammation and cell loss trigger adaptive crypt responses. Normal cell turnover and these homeostatic responses require epidermal growth factor (EGF), Wnt, BMP, and other signals secreted from the underlying stroma (Farin et al., 2012; Haramis et al., 2004; Kabiri et al., 2014), and inadequate epithelial repair is a prominent feature of inflammatory bowel disorders. Conversely, clonal ISC expansion and malignant transformation invariably reflect activating Wnt pathway mutations and are frequently associated with defects that suppress BMP signaling (Cancer Genome Atlas Network, 2012). The opposing effects of Wnt and BMP signaling on ISC and villus cells therefore predict functional gradients wherein agonists dominate near the bottom (Wnt) or top (BMP) of crypts, and inhibitory activity or absence of ligands prevails at the other end (Clevers, 2013; Roulis and Flavell, 2016; Sailaja et al., 2016; Qi et al., 2017); similar arrangements may apply to niche signals in the skin, bone marrow, and other stem cell-dependent organs. The small intestine houses unique, well-characterized tissue compartments and organoid culture allows examination of stem cell activity in vitro. We took advantage of both features to uncover the likely basis of the intestinal BMP gradient.
There are many possible ways to generate signaling gradients (Barkai and Shilo, 2009). For example, cells that differ only in a few specific products might secrete different factors at various points along the crypt-villus continuum. Telocytes, for example, express agonists as well as inhibitors of Wnt signaling, and investigators who recently characterized these Foxl1+ cells proposed such a basis for the Wnt gradient (Aoki et al., 2016; Shoshkes-Carmel et al., 2018). Alternatively, agonist and antagonist sources could be physically separate, with diffusion of both types of molecules resulting in finely graded signaling centers. Although secreted antagonists may sharpen a signaling gradient (Barkai and Shilo, 2009), inhibitory activities are not imperative; effective gradients may form in their absence, by virtue of limited agonist diffusion (Wolpert, 1971). This study reveals simple design elements in the intestinal BMP gradient. Near crypt tops, where epithelial cells stop dividing and start to mature, the requisite BMP reservoir does not result from presence of a unique cell. Rather, ostensibly homogeneous Pdgfrahi Foxl1+ telocytes that express BMPs and are present throughout the crypt-villus axis merely concentrate in high numbers at the villus base. To limit or preclude BMP signaling at the crypt base, the intestine seems not to rely on diffusional decay of BMPs from this source. Instead, distinctive PDGFRAlo CD81+ trophocytes positioned beneath the ISC compartment express the BMPi Grem1. Counter-diffusion of telocyte-derived BMPs and trophocyte-derived GREM1 likely produces a graded signal, so that progenitor cells moving along intestinal crypts serially encounter less GREM1 and more BMPs. Notably, among all resident stromal cells, Bmp7, a ligand required for active BMP2/7 and BMP4/7 heterodimers in other tissues (Aono et al., 1995; Kaito et al., 2018; Kim et al., 2019), is restricted to telocytes.
CD81+ trophocytes represent a fraction of the PDGFRAlo cell pool, expressing Grem1 almost exclusively. mRNA data further indicate that PDGFRAlo cells and telocytes are especially enriched for positive and negative regulators of various pathways, indicating that most signals pertinent to crypt-villus epithelial physiology originate in mesenchymal PDGFRA+ cells. We do not yet know the signaling function of abundant CD81— PDGFRAlo lamina propria cells or that of the telocyte-enriched compartment at villus tips; one or both populations may modulate mature cell behaviors, such as anoikis. Of note, purified telocytes express some Rspo3, but only non-canonical Wnt transcripts (Wnt4, Wnt5a, Wnt5b; Table S1), suggesting that the consequences of telocyte depletion in embryos (Aoki et al., 2016) and impaired Wnt secretion in adult Foxl1-Cre;PorcnFl mice (Shoshkes-Carmel et al., 2018) may reflect non-canonical functions. scRNA analysis of whole mesenchyme also identified MFs as a second Foxl1-expressing cell type that might potentially express Foxl1-Cre. Moreover, telocytes suppressed organoid growth in our crypt co-cultures, a finding that pairs with their abundant expression of Bmp, compared to Wnt or Rspo transcripts. In contrast, trophocytes and other PDGFRAlo cells express the canonical ligand Wnt2b and three Rspo genes. These products explain why trophocytes replace both an RSPO and a BMPi in enteroid cultures, while the CD81- PDGFRAlo cells can substitute for RSPO1. Although we did not evaluate which cells contribute to local Wnt gradients, we observed expression of Wnt antagonists Sfrp1, Frzb, Wif1, and Dkk2 in PDGFRA+ as well as other mesenchymal cells. Thus, among signals that help distinguish ISC from terminally differentiated villus cells, the Wnt network is likely complex and architecturally nuanced. Some evidence even suggests that Wnt3 travels away from an epithelial origin not by diffusion, but by binding to cells that replicate (Farin et al., 2016). We propose that the intestinal BMP gradient follows a simpler logic: polarized restriction of BMPs in telocyte aggregates and of GREM1 in trophocytes.
Ablation of Grem1+ stromal cells resulted in substantial ISC loss, while TA cells continued to proliferate. These findings imply that ISC uniquely depend on sub-cryptal trophocytes and possibly also on superficial Grem1+ smooth muscle, while the TA compartment withstands higher BMP tone. Grem1 null mice are, however, viable, with ostensibly intact crypt function (Davis et al., 2015). One possibility is that Grem1 null trophocytes compensate by expressing other BMPi; alternatively, ablation of Grem1+ cells likely diminishes multiple signals, such as RSPO support for Wnt ligands, and therefore the outcome is more severe than with loss of Grem1 alone. As Grem1Cre-ER mice could not resolve these possibilities in vivo, we used crypt co-cultures to delineate trophocyte capacity in the absence of any recombinant factor and of other stromal cells supplemented with specific factors. Beyond the functional assessments in vivo and in vitro, our conclusions rest on meticulous examination of intestinal mesenchyme by advanced microscopy, coupled with transcriptome analysis of unfractionated mesenchyme and well-defined populations at single-cell resolution. Inspection of whole-mount tissues resolved cell identities and relationships to an unprecedented degree and identified PDGFRAlo cells as a dominant mesenchymal population, distinct from SMA+ MFs, NG2+ pericytes, CD31+ endothelial cells or PDGFRAhi telocytes, and accounting for the largest fraction of resident sub-epithelial cells. The stereotypic arrangement of diverse cells at uniform distances from the epithelium and from each other likely reflects various signaling roles in intestinal homeostasis. These high-resolution anatomic and molecular maps of the mesenchyme provide a foundation for future investigation.
Many prevailing views on stem cell properties originated in studies of bone marrow, where a few hematopoietic stem cells (HSCs) divide infrequently and asymmetrically. The bone marrow niche, now increasingly understood in cellular and molecular terms (Baryawno et al., 2019; Ding et al., 2012; Kunisaki et al., 2013), supports these behaviors in the local tissue context, which lacks distinct landmarks such as crypt units. Importantly, ISC properties differ materially from those of HSCs (Clevers, 2015). Each crypt contains up to a dozen Lgr5+ cells that replicate symmetrically every 2–4 days (Kozar et al., 2013; Lopez-Garcia et al., 2010; Snippert et al., 2010) and when ISCs are ablated by g-irradiation or other injury, various crypt progenitors quickly dedifferentiate to restore the ISC compartment (Tetteh et al., 2016; Tian et al., 2011; van Es et al., 2012). Unlike bone marrow, the intestinal stroma therefore rapidly senses ISC loss and supports robust replication of stem and progenitor cells, thus helping restore epithelial integrity. Our detailed cellular and molecular delineation of mesenchymal populations sets a stage to ask which cells sense and respond to ISC deficits, and because impaired BMP signaling influences intestinal tumorigenesis (Davis et al., 2015; Jaeger et al., 2012; Cancer Genome Atlas Network, 2012), also whether the native signaling gradient can be exploited to limit excessive ISC activity in tumors. As a start, it will be instructive to know how the native mesenchyme is possibly restructured in cancers.
STAR★METHODS
Detailed methods are provided in the online version of this paper and include the following:
LEAD CONTACT AND MATERIALS AVAILABILITY
Further information and requests for resources and reagents should be directed to and will be fulfilled by the Lead Contact, Ramesh Shivdasani (ramesh_shivdasani@dfci.harvard.edu). This study did not generate any unique reagents and the Grem1Cre mouse line generated in this study is available upon request to Shannon Turley (Genentech, turley.shannon@gene.com) after execution of a Materials Transfer Agreement.
EXPERIMENTAL MODEL AND SUBJECT DETAILS
Mice
PdgfraH2BeGFP mice (Hamilton et al., 2003) were purchased from Jackson Laboratories (stock 007669). Grem1Cre-ER(T2) mice were generated by inserting a CreER(T2) cassette into the second Grem1 exon (V.N.K. et al., unpublished data) and crossed with both ROSA26YFP (Srinivas et al., 2001) (Jackson Laboratories stock 006148) and ROSA26iDTR mice (Buch et al., 2005) (Jackson Laboratories stock 007900) to ablate Grem1+ cells. Mice were at least 8 weeks old at the age of experimental treatments and cell isolations. Mice of both sexes were used in all experiments and littermates were used as controls. All animal procedures and experiments were approved and monitored by Animal Care and Use Committees at the Dana-Farber Cancer Institute (wild-type and PdgfraH2BeGFP) or Genentech (Grem1Cre-ER(T2)).
METHOD DETAILS
Experimental Design
The number of independent replicates and statistical methods is given in the respective figure legends. No sample size estimations and no blinding were performed. Further information on statistical tests is provided in the respective STAR Methods section.
Mouse treatments
Grem1CreERT2;ROSA26iDTR mice received 4-OH tamoxifen (Sigma-Aldrich, 20 mg/ml) by intra-peritoneal injection for 5 consecutive days to allow recombination at LoxP sites. Between 15 and 25 days later, Grem1CreERT2;ROSA26iDTR mice received intra-peritoneal injections of Diphtheria toxin (Enzo Life Sciences, 25 ng/g weight) on 2 consecutive days and were euthanized for tissue harvest 2, 5, and 8 days after the second dose.
Immunohistochemistry
Whole-mount tissue immunohistochemistry was performed as described (Bernier-Latmani and Petrova, 2016). Mice were perfused with cold phosphate-buffered saline (PBS), followed by 4% paraformaldehyde (PFA). Muscle layers were removed manually and strips of small intestine were pinned onto agarose plates and fixed overnight with 15% picric acid and 0.5% PFA in PBS. In this and all subsequent steps, the tissue was rocked gently. After rinsing in PBS, the tissue was placed in 10%, then 20% sucrose over the span of 1 day, followed by blocking buffer (PBS containing 0.125%BSA, 0.003%Triton X-100, 0.05% donkey serum, and 0.0005% NaN3) for 6 h and overnight incubation with primary antibodies (Ab). After 5 hourly washes in PBS, tissues were incubated overnight with secondary Ab conjugated with Alexa Fluor (Invitrogen) in buffer containing 4ʹ,6-diamidino-2-phenylindole (DAPI), then washed in PBS for 5 h with a change of buffer every 30 min and post-fixed in 4% PFA for 2 days. Cut 1-mm fragments of tissue were then placed on glass slides with spacers (Grace Bio-Labs, 654002), cleared using FocusClear (CelExplorer, FC-101) for 30 min, and VectaShield mounting medium (Vector Laboratories) and a coverslip were applied. Imaging was performed on tissues from at least 3 independent animals to generate representative and comprehensive anatomical resolution.
Routine immunohistochemistry was performed on tissues fixed as described above and placed in OCT compound (Tissue-Tek, VWR Scientific catalog no. 4583) or embedded in paraffin. 7 μm OCT-sections were prepared using a Leica CM3050 cryostat and paraffin sections were cut on a Leica RM2255 microtome. The following Ab were used: LYVE1 (Angiobio 11–034; RRID: AB_2813732); CD31 (BD 557355; RRID: AB_396660); NG2 (Millipore AB5320; RRID: AB_11213678); Laminin (Sigma L9393; RRID: AB_477163); PDGFRA (1:100, R&D Systems AF1062; RRID: AB_2236897); Alpha-smooth muscle actin (Abcam ab5694; RRID: AB_2223021); TUJ1 (Abcam ab18207; RRID: AB_444319); KI67 (Gentex, GTX16667; RRID: AB_422351); GFP (Abcam ab6662; RRID: AB_305635); PDPN (Biolegend 127410; RRIDs: AB_10613649); Lysozyme (Dako A0099; RRID: AB_2341230); Secondary antibodies (Alexa Fluor, Invitrogen). All antibodies at 1:1000 dilution (unless indicated). PdgfraH2BeGFP mouse sections were viewed on a Leica SP5X laser scanning confocal microscope and Grem1Dtr sections on a Leica DM4B microscope. Images and movies were further processed using ImageJ Fiji software (Schindelin et al., 2012). Schematic illustrations were hand-drawn and processed using Adobe Photoshop CC 2018. Figure S1E was generated as a composite of two images overlaid using Microsoft 365 ProPlus Office Powerpoint.
Mesenchymal cell isolation and flow cytometry
Intestinal mesenchyme was isolated similar to previous reports (Kurahashi et al., 2013; Stzepourginski et al., 2015). Small intestines were harvested after perfusing adult wild-type or PdgfraH2BeGFP mice (Hamilton et al., 2003) with ice-cold PBS. Outer muscle layers were stripped manually using fine tweezers and the epithelium was denuded by shaking the tissue in pre-warmed Hank’s Balanced Salt Solution (HBSS, Life Technologies) containing 10 mM EDTA for 20 min at 37°C. The remaining tissue was rinsed with PBS, minced using a scalpel, and digested by rotating at 37°C in 1.5 mg/ml collagenase II (Worthington, LS004176) diluted in Dulbecco’s Modified Eagle Medium (DMEM) containing 5% fetal bovine serum (FBS). The tissue suspension was passed through a pipette gently every 10 min, cells were extracted 3 times every 20 min, and the enzyme solution was replaced at each harvest. Extracted cells were centrifuged at 500 g for 5 min, washed with PBS containing 2 mM EDTA and 2% FBS (FACS buffer), and resuspended in the same buffer for Ab staining. To isolate CD31+ vascular (LYVE1-) and lymphatic (LYVE1-) endothelial cells, LYVE1 Ab (1:100, AngioBio 11–034; RRID: AB_2813732) was applied for 30 min and cells were washed in FACS buffer, followed by further staining with FITC-conjugated anti-rabbit IgG (1:1000, Jackson ImmunoResearch 2337972) and APC-conjugated CD31 Ab (1:100, BD Biosciences 551262; RRID: AB_398497). Grem1Cre;Ros26YFP/iDtr mouse ilea were incubated in a chelation buffer (RPMI with 5 mM EDTA) with shaking for 40 min, vortexed gently, and washed to remove epithelium. The mesenchyme was digested in a solution containing 5 mg/ml DNaseI and 100 U/ml Collagenase VIII for 1 h at 37°C with shaking. The material was then passed through a pipet 5 times, strained, stained with PDPN (1:200, Biolegend 127412; RRID: AB_10613648) and PDGFRA (1:200, Invitrogen 12–1401-81; RRID: AB_657615) Ab, and analyzed in a BD Fortessa or Aria instrument. CD81+ and CD81- mesenchymal PDGFRAlo cell fractions were isolated from PdgfraH2BeGFP mouse intestines. CD81 Ab (1:100, Invitrogen 13–0811-81; RRID: AB_466514) and PDGFRA Ab (1:100, Invitrogen 13–1401-80; RRID: AB_466606) was applied for 30 min, followed by washing and staining with APC-conjugated streptavidin (Invitrogen, 17–4317-82). Cells were detected and sorted on a Sony SH800z flow cytometer, with gating against DAPI to identify live cells.
In situ RNA hybridization
mRNAs were localized in specific cells by the RNAscope (Advanced Cell Diagnostics) method (Wang et al., 2012a) on intestines collected from at least 3, and up to 4, different animals. Advanced Cell Diagnostics designed probe sets for Grem1, Bmp5, Bmp7, Lgr5, and Olmf4. After the hybridization protocol, which destroys GFP fluorescence, GFP signals were revealed by immunohistochemistry. Slides were washed for 5 min in PBS containing 0.1% Tween-20, blocked for 1 hr at room temperature in PBS containing 5%NGS, and exposed overnight at 4°C to GFP Ab (1:100, Abcam ab6556; RRID: AB_305564). After multiple 5-min washes in PBS and 90-min incubation with secondary Ab (AlexaFluor, Invitrogen) at room temperature, DAPI was applied and slides were mounted according to the RNAscope protocol. Grem1, Bmp5, and Bmp7 images in PdgfraH2BEGFP mice were obtained on a Leica SP5X laser scanning confocal microscope; Grem1, Lgr5, Id1, Axin2, and Olfm4 images in Grem1Dtr mice were obtained on a Zeiss Axioskop 40 microscope.
In vitro co-cultures
Unfractionated mesenchyme extracted from PdgfraH2BeGFP mice was plated on non-pyrogenic, gas plasma surface treated polystyrene tissue culture plates (Falcon) in DMEM and F12 medium (GIBCO, 12634–010) supplemented with 10% FBS (Corning, 35–010-CV), penicillin, streptomycin, Glutamax, and HEPES buffer (Basal media + FBS). The medium was replaced 24 h after plating; 5 to 7 days later, cells were removed using 1X TrypLE Express (GIBCO, 15 min at 37°C), washed in FACS buffer, and stained with CD81 Ab for flow cytometry as described above. To determine the stability of molecular signatures in these short-term cultures, we performed qRT-PCR on 3 different samples of GFPhi telocytes and CD81+ and CD81- PDGFRAlo cells. mRNA expression values were quantified relative to Gapdh (2-DCT).
Crypt epithelium was isolated and passaged as described (Sato and Clevers, 2013). For co-cultures, ~100 crypts were cultured in 24-well tissue culture plates loaded with 20 mL drops of Matrigel (Corning) or type I rat tail collagen (First Link, UK) together with 4×10⁴ mesenchymal cells sorted by flow cytometry, after short-term culture as described above, and recombinant EGF (Thermo Fisher, 50 ng/mL). Basal Media (described above) was supplemented with either Noggin (Peprotech, 100 ng/mL), Rspo1 (cell culture supernatant from 293T-HA-RspoI-Fc cells, 1 ug/mL), both, or Gremlin1 (Thermo Fisher, 2 ug/ul). Colonies were imaged using an Evos FL microscope (Thermo Scientific).
QUANTIFICATION AND STATISTICAL ANALYSIS
Quantitation of GFP signals
GFPhi signals were quantified by inputting confocal microscopy image z stacks into MATLAB (The Mathworks Inc.) as monochrome single-image series for the DAPI and green fluorescence (GFP) channels. The serosa was identified in valid z-slices and vectors parallel to the crypt-villus axis were defined along the serosal surface to quantify the distribution of the GFP signal along a total of 137 crypts and 53 villi from 3 independent animals. The signal threshold allowed only GFPhi cells to register in this quantitation.
Quantitation of co-culture assays
Organoid (spheroid) structures were counted with a Nikon Eclipse TS100 microscope 6 days after co-culture (P0) or 3 days after the first passage (P1). Graphs and associated statistics were generated using GraphPad Prism v7.03.
Computational analysis for RNA sequencing
Cell populations, isolated as described above, were placed in Trizol Reagent (ThermoFisher) and RNA was purified using the RNeasy Microkit (QIAGEN). Total RNA (5–10ng) was used to prepare libraries with the SMART-Seq v4 Ultra Low Input RNA kit (Clontech) and libraries were sequenced on a NextSeq500 instrument (Illumina) to obtain 75-bp single-end reads. Data were analyzed using the VIPER pipeline with default settings (Cornwell et al., 2018) and aligned to mouse reference genome mm10 using the STAR aligner (Dobin et al., 2013). RPKM (reads per kilobase per million) values were generated from STAR counts, data quality was verified using RSeQC (Wang et al., 2012b), and further statistical analyses occurred on the R platform (R Development Core Team, 2013). Data were normalized and differential gene expression (Padj < 0.05, absolute log2 fold-change > 1.5) was determined in the DESeq2 package (Love et al., 2014). Pearson correlation coefficients were calculated from DESeq2 normalized counts and plotted using the Corrplot package (Wei et al., 2017) in R. Relationship among samples was also assessed by principal component analysis (PCA) of DESeq2 rlog-transformed counts (Love et al., 2014) and the expression heatmap (Figure 2A) was generated using Morpheus (Broad Institute). To generate the Integrative Genome Viewer Tracks (Figure 2A), we generated RPKM-normalized bigwigs using the bamCoverage tool from the DeepTools package (Ramírez et al., 2016) and loaded into IGV v2.3 (Broad Institute). Epithelial cell mRNA data were published previously (Jadhav et al., 2017) and are available in Gene Expression Omnibus series GSE83394 and GSE71713 (Libraries - Lgr5+ ISC: GSM2201132 and GSM2201133, Paneth cells: GSM2201146 and GSM2201148, crypt enterocyte progenitors: GSM2201137 and GSM2201138, unfractionated villus epithelium: GSM1843521 and GSM1843522).
For scRNA sequencing, PDGFRAhi and PDGFRAlo cells were isolated by flow cytometry at a ratio of 1:2 from a male PdgfraH2BeGFP mouse. Using the Single Cell 30 V2 assay, we loaded 8,700 cells onto a Chromium Controller (10x Genomics). Reverse transcription, cDNA amplification, and library preparation were completed according to the manufacturer’s recommendations. scRNA libraries were sequenced on a HiSeq4000 instrument (Illumina).
Computational analysis for scRNA-seq
Pre-processing
Libraries were de-multiplexed, aligned to the mm10 mouse transcriptome, and unique molecular identifiers (UMIs) were counted using Cell Ranger (10X Genomics) v2.1.1 for PDGFRA+ cells (Figure 3) and v3.1.1 for unfractionated mesenchyme (Figure 4). Data were analyzed using the Seurat package v2.3.3 in R. PDGFRA+ cells with ≥ 1,500 detected transcripts and genes expressed in ≥ 100 single cells were retained, resulting in 9,334 detectable genes in 2,894 single cells (Figure 3). Further exclusion of cells with > 3% mitochondrial transcripts gave a final count of 2,595 informative single cells. Data were normalized and log-transformed using the “LogNormalize” function in Seurat. For unfractionated mesenchyme, we enhanced cell-sequencing depth by generating and then merging two separate libraries. Cells with ≥ 1,500 transcripts and < 10% mitochondrial transcripts were retained (total 9,353 cells – Figure S4). We removed all clusters showing Cd45 (Ptprc) expression, other than one small Pdgfra-expressing cluster. This left a total of 3,763 resident sub-epithelial stromal cells (Figure S4). Clusters were assigned to known cell types by signature markers using the “FindAllMarkers” function in Seurat, with parameters: min.pct 0.25 and logfc.threshold 0.25. Markers were then queried using known mouse colon mesenchymal cell-specific genes (Kinchen et al., 2018).
Dimensionality reduction and clustering
For PDGFRA+ cells, we selected the top 714 variable genes using the “FindVariableGenes” function in Seurat using parameters: x.low.cutoff 0.0125, x.high.cutoff 3, and y.cutoff 1 for principal component analysis. The top 7 principal components were selected for PDGFRA+ cells and top 10 principal components for whole mesenchyme, based on the Jackstraw approach implemented in Seurat (p < 1e—50) and visualized using the Barnes–Hut approximate version of t-distributed Stochastic Neighbor Embedding (t-SNE) algorithm (van der Maaten, 2014). We then identified clusters using the “FindClusters” function in Seurat, which implements an algorithm based on optimization nearest-neighbor modularity, using the parameter resolution 0.2 for PDGFRA+ cells and 0.4 for unfractionated mesenchyme. This approach identified 3 distinct Pdgfra+ clusters which were overlaid on the t-SNE plot from PDGFRA+ cell scRNA. Marker genes for each cluster were identified using the MAST algorithm (Finak et al., 2015). The correlation heatmap (Figure 3B) was generated using the Spearman correlation of all PDGFRA+ cells across the top 7 principal components. After clustering cells from whole mesenchyme, those expressing Cd34 and Pdgfra, but lacking Cd81 were designated as Lo-2 in the final group of 10 clusters (Figure S4).
Supplementary Material
KEY RESOURCES TABLE
| REAGENT or RESOURCE | SOURCE | IDENTIFIER |
|---|---|---|
| Antibodies | ||
| LYVE1 | AngioBio | 11–034; RRID: AB_2813732 |
| CD31 | BD | 557355; RRID: AB_396660 |
| NG2 | Millipore | 5320; RRID: AB_11213678 |
| Laminin | Sigma | L9393; RRID: AB_477163 |
| PDGFRA (IHC) | R&D Systems | AF1062; RRID: AB_2236897 |
| PDGFRA (FACS) | Invitrogen | 13–1401-80/12–1401-81; RRIDs: AB_466606 and AB_657615 |
| Alpha-smooth muscle actin | Abcam | 5694; RRID: AB_2223021 |
| TUJ1 | Abcam | 18207; RRID: AB_444319 |
| KI67 | Gentex | 16667; RRID: AB_422351 |
| APC-conj. CD31 | BD | 551262; RRID: AB_398497 |
| CD81 | Invitrogen | 13–0811-81; RRID: AB_466514 |
| GFP | Abcam | 6556/6662; RRIDs: AB_305564 and AB_305635 |
| Podoplanin | Biolegend | 127410/127412; RRIDs: AB_10613649 and AB_10613648 |
| Lysozyme | Dako | A0099; RRID: AB_2341230 |
| Chemicals, Peptides, and Recombinant Proteins | ||
| TrypLE Express | ThermoFisher | 12604–021 |
| Trizol reagent | ThermoFisher | 15596026 |
| Collagenase II | Worthington | LS004176 |
| NOGGIN | Peprotech | 120–10C |
| RSPONDIN1 | R&D Systems | 3710–001-01 |
| EGF | ThermoFisher | PHG0311 |
| GREMLIN1 | ThermoFisher | 956GR050 |
| Matrigel | Corning | 356231 |
| Diphtheria Toxin | Enzo Life Sciences | BML-G135–0001 |
| 4-OH Tamoxifen | Sigma | T5648 |
| DMEM/F12 Media | GIBCO | 12634–010 |
| Fetal Bovine Serum | Corning | 35–010-CV |
| Penicillin/Streptomycin | Life Technologies | 15140163 |
| Glutamax | GIBCO | 35050–661 |
| N-2 Supplement (100X) | Life Technologies | 17502001 |
| B-27 Supplement (50X) | Life Technologies | 17504001 |
| NICOTINAMIDE | Sigma | 72340 |
| N-Acetylcysteine | Sigma | A9165 |
| Normal Goat Serum | Cell Signaling | 5425S |
| DAPI | BD PharMingen | 5649097 |
| DMEM | Corning | 17–205-CV |
| HBSS (10X) | GIBCO | 14065–056 |
| PBS (10X) | Corning | 46–013-CM |
| AlexaFluor Goat 546 anti-rat IgG | Invitrogen | A11081 |
| AlexaFluor Goat 633 anti-rabbit IgG | Invitrogen | A21071 |
| AlexaFluor 594 donkey anti-goat IgG | Invitrogen | A11058 |
| Biotin | Invitrogen | 17–4317-82 |
| Bovine Serum Albumin | Sigma | A9647 |
| Paraformaldehyde | EMS | 15714-S |
| Picric Acid | Fluka | 80456 |
| FocusClear | CElExplorer | FC-101 |
| Triton X-100 | Sigma | T8787 |
| Sodium azide | Sigma | S2002 |
| HEPES | Sigma | H3375 |
| VectaShield mounting medium | Vector Laboratories | H-1000 |
| Critical Commercial Assays | ||
| RNAscope Multiplex Fluorescent Reagent Kit v2 | ACD | 323100 |
| RNeasy microkit | QIAGEN | 74004 |
| SMART-Seq v4 Ultra Low Input RNA kit | Clontech | 634890 |
| Single Cell 3ʹ V2 assay | 10X Genomics | PN-120237 |
| Deposited Data | ||
| Raw and analyzed data | This paper; Tables S1 and S2 | GEO: GSE130681 |
| Mouse reference genome Mm10, GRCm38 | Genome Reference Consortium | https://www.ncbi.nlm.nih.gov/grc/mouse |
| Epithelial RNA datasets | Jadhav et al., 2017 | GEO: GSE83394; GSE71713 |
| Experimental Models: Organisms/Strains | ||
| Mouse: PdgfraH2BeGFP | The Jackson Laboratory | 007669 |
| Mouse: ROSA26iDTR | The Jackson Laboratory | 007900 |
| Mouse: Grem1CreER(T2) | This study | None |
| Mouse: ROSA26YFP | The Jackson Laboratory | 006148 |
| Oligonucleotides | ||
| Grem1 probes | ACD | 314741 |
| Bmp5 probes | ACD | 401241 |
| Bmp7 probes | ACD | 407901 |
| Lgr5 probes | ACD | 312171 |
| Olfm4 probes | ACD | 311831 |
| Id1 | ACD | 312221 |
| Axin2 | ACD | 400331 |
| Oligonucleotides | This paper | Figure S7C |
| Software and Algorithms | ||
| VIPER | Cornwell et al., 2018 | https://bitbucket.org/cfce/viper/ |
| STAR | Dobin et al., 2013 | https://github.com/alexdobin/STAR/releases |
| Integrated Genomics Viewer | Robinson et al., 2011 | http://software.broadinstitute.org/software/igv/ |
| DeSeq2 | Love et al., 2014 | https://bioconductor.org/packages/release/bioc/html/DESeq2.html |
| RSeQC | Wang et al., 2012 | http://rseqc.sourceforge.net/ |
| R | R Development Core Team, 2013 | https://cran.r-project.org/bin/windows/ |
| Corrplot | Wei et al., 2017 | https://github.com/taiyun/corrplot |
| Morpheus | Broad Institute | https://software.broadinstitute.org/morpheus/ |
| DeepTools | Ramírez et al., 2016 | https://github.com/deeptools/deepTools |
| Seurat package v2.3.3 |
Butler et al., 2018 |
https://github.com/satijalab/seurat |
| Cell Ranger v2.1.1 | 10X Genomics | https://support.10xgenomics.com/single-cell-gene-expression/software/pipelines/latest/installation |
| ImageJ Fiji | Schindelin et al., 2012 | https://imagej.net/Fiji/ |
| MATLAB | The Mathworks Inc. | N/A |
| t-SNE algorithm | van der Maaten, 2014 | https://lvdmaaten.github.io/tsne/ |
| MAST algorithm | Finak et al., 2015 | https://github.com/RGLab/MAST |
| ACD HybEZ II Hybridization System | ACD | 321710 |
| 10X Genomics Controller | 10X Genomics | N/A |
| Slide Spacers | Grace Bio-Labs | 654002 |
Highlights.
PDGFRA+ stromal cells express trophic factors implicated in intestinal self-renewal
PDGFRA marks distinct intestinal cells: telocytes, CD81— stromal cells, trophocytes
Villus-dominant telocytes express BMPs; PDGFRAlo trophocytes express Grem1
CD81+ trophocytes sustain ISC in vivo and alone promote ISC expansion in vitro
ACKNOWLEDGMENTS
We thank J. Bernier-Latmani and T. Petrova for valuable advice on whole-mount tissue processing; D. Hansen and L. Li for helpful discussions on mesenchymal cell isolation; members of the ISC Consortium and D. Kaplan laboratory for critical feedback; and D. Breault and the Harvard Digestive Diseases Center (P30DK034854) organoid facility for reagents, advice, and photomicrography. This work was supported by US National Institutes of Health grants U01DK103152 (Intestinal Stem Cell Consortium of the NIDDK and NIAID), R01DK121540 (to R.A.S.), and R01HG009663 (to G.-C.Y.); fellowships T32EB016652 (Training in Organ Design and Engineering) and F32DK118862 (to N.M.); and gifts from the Lind family.
Footnotes
DATA AND CODE AVAILABILITY
Data generated in this study are deposited in GEO, with the accession number GEO:GSE130681 https://www.ncbi.nlm.nih.gov/geo/query/acc.cgi?acc=GSE130681. No new software code was developed for this study.
DECLARATION OF INTERESTS
E.E.S., V.N.K., C.C., S.K., F.J.d.S., and S.J.T. are employees of Genentech and own shares in Roche. The other authors declare no competing interests.
SUPPLEMENTAL INFORMATION
Supplemental Information can be found online at https://doi.org/10.1016/j.stem.2020.01.008.
REFERENCES
- Aoki R, Shoshkes-Carmel M, Gao N, Shin S, May CL, Golson ML, Zahm AM, Ray M, Wiser CL, Wright CV, and Kaestner KH (2016). Foxl1-expressing mesenchymal cells constitute the intestinal stem cell niche. Cell. Mol. Gastroenterol. Hepatol 2, 175–188. [DOI] [PMC free article] [PubMed] [Google Scholar]
- Aono A, Hazama M, Notoya K, Taketomi S, Yamasaki H, Tsukuda R, Sasaki S, and Fujisawa Y. (1995). Potent ectopic bone-inducing activity of bone morphogenetic protein-4/7 heterodimer. Biochem. Biophys. Res. Commun 210, 670–677. [DOI] [PubMed] [Google Scholar]
- Barkai N, and Shilo BZ (2009). Robust generation and decoding of morphogen gradients. Cold Spring Harb. Perspect. Biol 1, a001990. [DOI] [PMC free article] [PubMed] [Google Scholar]
- Baryawno N, Przybylski D, Kowalczyk MS, Kfoury Y, Severe N, Gustafsson K, Kokkaliaris KD, Mercier F, Tabaka M, Hofree M, et al. (2019). A cellular taxonomy of the bone marrow stroma in homeostasis and leukemia. Cell 177, 1915–1932. [DOI] [PMC free article] [PubMed] [Google Scholar]
- Batts LE, Polk DB, Dubois RN, and Kulessa H. (2006). Bmp signaling is required for intestinal growth and morphogenesis. Dev. Dyn 235, 1563–1570. [DOI] [PubMed] [Google Scholar]
- Bernier-Latmani J, and Petrova TV (2016). High-resolution 3D analysis of mouse small-intestinal stroma. Nat. Protoc 11, 1617–1629. [DOI] [PubMed] [Google Scholar]
- Bernier-Latmani J, Cisarovsky C, Demir CS, Bruand M, Jaquet M, Davanture S, Ragusa S, Siegert S, Dormond O, Benedito R, et al. (2015). DLL4 promotes continuous adult intestinal lacteal regeneration and dietary fat transport. J. Clin. Invest 125, 4572–4586. [DOI] [PMC free article] [PubMed] [Google Scholar]
- Buch T, Heppner FL, Tertilt C, Heinen TJ, Kremer M, Wunderlich FT, Jung S, and Waisman A. (2005). A Cre-inducible diphtheria toxin receptor mediates cell lineage ablation after toxin administration. Nat. Methods 2, 419–426. [DOI] [PubMed] [Google Scholar]
- Butler A, Hoffman P, Smibert P, Papalexi E, and Satija R. (2018). Integrating single-cell transcriptomic data across different conditions, technologies, and species. Nat Biotechnol 36, 411–420. [DOI] [PMC free article] [PubMed] [Google Scholar]
- Cancer Genome Atlas Network (2012). Comprehensive molecular characterization of human colon and rectal cancer. Nature 487, 330–337. [DOI] [PMC free article] [PubMed] [Google Scholar]
- Chen L, Toke NH, Luo S, Vasoya RP, Fullem RL, Parthasarathy A, Perekatt AO, and Verzi MP (2019). A reinforcing HNF4-SMAD4 feed-forward module stabilizes enterocyte identity. Nat. Genet 51, 777–785. [DOI] [PMC free article] [PubMed] [Google Scholar]
- Clevers H. (2013). The intestinal crypt, a prototype stem cell compartment. Cell 154, 274–284. [DOI] [PubMed] [Google Scholar]
- Clevers H. (2015). STEM CELLS. What is an adult stem cell? Science 350, 1319–1320. [DOI] [PubMed] [Google Scholar]
- Cornwell M, Vangala M, Taing L, Herbert Z, Köster, J., Li, B., Sun, H., Li, T., Zhang, J., Qiu, X., et al. (2018). VIPER: Visualization Pipeline for RNA-seq, a Snakemake workflow for efficient and complete RNA-seq analysis. BMC Bioinformatics 19, 135. [DOI] [PMC free article] [PubMed] [Google Scholar]
- Davis H, Irshad S, Bansal M, Rafferty H, Boitsova T, Bardella C, Jaeger E, Lewis A, Freeman-Mills L, Giner FC, et al. (2015). Aberrant epithelial GREM1 expression initiates colonic tumorigenesis from cells outside the stem cell niche. Nat. Med 21, 62–70. [DOI] [PMC free article] [PubMed] [Google Scholar]
- Degirmenci B, Valenta T, Dimitrieva S, Hausmann G, and Basler K. (2018). GLI1-expressing mesenchymal cells form the essential Wnt-secreting niche for colon stem cells. Nature 558, 449–453. [DOI] [PubMed] [Google Scholar]
- Ding L, Saunders TL, Enikolopov G, and Morrison SJ (2012). Endothelial and perivascular cells maintain haematopoietic stem cells. Nature 481, 457–462. [DOI] [PMC free article] [PubMed] [Google Scholar]
- Dobin A, Davis CA, Schlesinger F, Drenkow J, Zaleski C, Jha S, Batut P, Chaisson M, and Gingeras TR (2013). STAR: ultrafast universal RNA-seq aligner. Bioinformatics 29, 15–21. [DOI] [PMC free article] [PubMed] [Google Scholar]
- Farin HF, Van Es JH, and Clevers H. (2012). Redundant sources of Wnt regulate intestinal stem cells and promote formation of Paneth cells. Gastroenterology 143, 1518–1529. [DOI] [PubMed] [Google Scholar]
- Farin HF, Jordens I, Mosa MH, Basak O, Korving J, Tauriello DV, de Punder K, Angers S, Peters PJ, Maurice MM, and Clevers H. (2016). Visualization of a short-range Wnt gradient in the intestinal stem-cell niche. Nature 530, 340–343. [DOI] [PubMed] [Google Scholar]
- Fearon ER, and Vogelstein B. (1990). A genetic model for colorectal tumorigenesis. Cell 61, 759–767. [DOI] [PubMed] [Google Scholar]
- Finak G, McDavid A, Yajima M, Deng J, Gersuk V, Shalek AK, Slichter CK, Miller HW, McElrath MJ, Prlic M, et al. (2015). MAST: a flexible statistical framework for assessing transcriptional changes and characterizing heterogeneity in single-cell RNA sequencing data. Genome Biol. 16, 278. [DOI] [PMC free article] [PubMed] [Google Scholar]
- Gregorieff A, Pinto D, Begthel H, Destrée O, Kielman M, and Clevers H. (2005). Expression pattern of Wnt signaling components in the adult intestine. Gastroenterology 129, 626–638. [DOI] [PubMed] [Google Scholar]
- Greicius G, Kabiri Z, Sigmundsson K, Liang C, Bunte R, Singh MK, and Virshup DM (2018). PDGFRa + pericryptal stromal cells are the critical source of Wnts and RSPO3 for murine intestinal stem cells in vivo. Proc. Natl. Acad. Sci. USA 115, E3173–E3181. [DOI] [PMC free article] [PubMed] [Google Scholar]
- Hamilton TG, Klinghoffer RA, Corrin PD, and Soriano P. (2003). Evolutionary divergence of platelet-derived growth factor alpha receptor signaling mechanisms. Mol. Cell. Biol 23, 4013–4025. [DOI] [PMC free article] [PubMed] [Google Scholar]
- Haramis AP, Begthel H, van den Born M, van Es J, Jonkheer S, Offerhaus GJ, and Clevers H. (2004). De novo crypt formation and juvenile polyposis on BMP inhibition in mouse intestine. Science 303, 1684–1686. [DOI] [PubMed] [Google Scholar]
- He XC, Zhang J, Tong WG, Tawfik O, Ross J, Scoville DH, Tian Q, Zeng X, He X, Wiedemann LM, et al. (2004). BMP signaling inhibits intestinal stem cell self-renewal through suppression of Wnt-beta-catenin signaling. Nat. Genet 36, 1117–1121. [DOI] [PubMed] [Google Scholar]
- Jadhav U, Saxena M, O’Neill NK, Saadatpour A, Yuan GC, Herbert Z, Murata K, and Shivdasani RA (2017). Dynamic reorganization of chromatin accessibility signatures during dedifferentiation of secretory precursors into Lgr5+ intestinal stem cells. Cell Stem Cell 21, 65–77. [DOI] [PMC free article] [PubMed] [Google Scholar]
- Jaeger E, Leedham S, Lewis A, Segditsas S, Becker M, Cuadrado PR, Davis H, Kaur K, Heinimann K, Howarth K, et al. ; HMPS Collaboration (2012). Hereditary mixed polyposis syndrome is caused by a 40-kb upstream duplication that leads to increased and ectopic expression of the BMP antagonist GREM1. Nat. Genet 44, 699–703. [DOI] [PMC free article] [PubMed] [Google Scholar]
- Kabiri Z, Greicius G, Madan B, Biechele S, Zhong Z, Zaribafzadeh H, Edison, Aliyev J, Wu Y, Bunte R, et al. (2014). Stroma provides an intestinal stem cell niche in the absence of epithelial Wnts. Development 141, 2206–2215. [DOI] [PubMed] [Google Scholar]
- Kaito T, Morimoto T, Mori Y, Kanayama S, Makino T, Takenaka S, Sakai Y, Otsuru S, Yoshioka Y, and Yoshikawa H. (2018). BMP-2/7 heterodimer strongly induces bone regeneration in the absence of increased soft tissue inflammation. Spine J. 18, 139–146. [DOI] [PubMed] [Google Scholar]
- Kim KA, Kakitani M, Zhao J, Oshima T, Tang T, Binnerts M, Liu Y, Boyle B, Park E, Emtage P, et al. (2005). Mitogenic influence of human R-spondin1 on the intestinal epithelium. Science 309, 1256–1259. [DOI] [PubMed] [Google Scholar]
- Kim HS, Neugebauer J, McKnite A, Tilak A, and Christian JL (2019). BMP7 functions predominantly as a heterodimer with BMP2 or BMP4 during mammalian embryogenesis. eLife 8, e48872. [DOI] [PMC free article] [PubMed] [Google Scholar]
- Kinchen J, Chen HH, Parikh K, Antanaviciute A, Jagielowicz M, Fawkner-Corbett D, Ashley N, Cubitt L, Mellado-Gomez E, Attar M, et al. (2018). Structural remodeling of the human colonic mesenchyme in inflammatory bowel disease. Cell 175, 372–386. [DOI] [PMC free article] [PubMed] [Google Scholar]
- Kosinski C, Li VS, Chan AS, Zhang J, Ho C, Tsui WY, Chan TL, Mifflin RC, Powell DW, Yuen ST, et al. (2007). Gene expression patterns of human colon tops and basal crypts and BMP antagonists as intestinal stem cell niche factors. Proc. Natl. Acad. Sci. USA 104, 15418–15423. [DOI] [PMC free article] [PubMed] [Google Scholar]
- Kozar S, Morrissey E, Nicholson AM, van der Heijden M, Zecchini HI, Kemp R, Tavaré S, Vermeulen L, and Winton DJ (2013). Continuous clonal labeling reveals small numbers of functional stem cells in intestinal crypts and adenomas. Cell Stem Cell 13, 626–633. [DOI] [PubMed] [Google Scholar]
- Kuhnert F, Davis CR, Wang HT, Chu P, Lee M, Yuan J, Nusse R, and Kuo CJ (2004). Essential requirement for Wnt signaling in proliferation of adult small intestine and colon revealed by adenoviral expression of Dickkopf-1. Proc. Natl. Acad. Sci. USA 101, 266–271. [DOI] [PMC free article] [PubMed] [Google Scholar]
- Kunisaki Y, Bruns I, Scheiermann C, Ahmed J, Pinho S, Zhang D, Mizoguchi T, Wei Q, Lucas D, Ito K, et al. (2013). Arteriolar niches maintain haematopoietic stem cell quiescence. Nature 502, 637–643. [DOI] [PMC free article] [PubMed] [Google Scholar]
- Kurahashi M, Nakano Y, Hennig GW, Ward SM, and Sanders KM (2012). Platelet-derived growth factor receptor a-positive cells in the tunica muscularis of human colon. J. Cell. Mol. Med 16, 1397–1404. [DOI] [PMC free article] [PubMed] [Google Scholar]
- Kurahashi M, Nakano Y, Peri LE, Townsend JB, Ward SM, and Sanders KM (2013). A novel population of subepithelial platelet-derived growth factor receptor a-positive cells in the mouse and human colon. Am. J. Physiol. Gastrointest. Liver Physiol 304, G823–G834. [DOI] [PMC free article] [PubMed] [Google Scholar]
- Lopez-Garcia C, Klein AM, Simons BD, and Winton DJ (2010). Intestinal stem cell replacement follows a pattern of neutral drift. Science 330, 822–825. [DOI] [PubMed] [Google Scholar]
- Love MI, Huber W, and Anders S. (2014). Moderated estimation of fold change and dispersion for RNA-seq data with DESeq2. Genome Biol. 15, 550. [DOI] [PMC free article] [PubMed] [Google Scholar]
- Ogasawara R, Hashimoto D, Kimura S, Hayase E, Ara T, Takahashi S, Ohigashi H, Yoshioka K, Tateno T, Yokoyama E, et al. (2018). Intestinal lymphatic endothelial cells produce R-Spondin3. Sci. Rep 8, 10719. [DOI] [PMC free article] [PubMed] [Google Scholar]
- Ogata T, Wozney JM, Benezra R, and Noda M. (1993). Bone morphogenetic protein 2 transiently enhances expression of a gene, Id (inhibitor of differentiation), encoding a helix-loop-helix molecule in osteoblast-like cells. Proc. Natl. Acad. Sci. USA 90, 9219–9222. [DOI] [PMC free article] [PubMed] [Google Scholar]
- Pinto D, Gregorieff A, Begthel H, and Clevers H. (2003). Canonical Wnt signals are essential for homeostasis of the intestinal epithelium. Genes Dev. 17, 1709–1713. [DOI] [PMC free article] [PubMed] [Google Scholar]
- Potten CS (1998). Stem cells in gastrointestinal epithelium: numbers, characteristics and death. Philos. Trans. R. Soc. Lond. B Biol. Sci 353, 821–830. [DOI] [PMC free article] [PubMed] [Google Scholar]
- Powell DW, Pinchuk IV, Saada JI, Chen X, and Mifflin RC (2011). Mesenchymal cells of the intestinal lamina propria. Annu. Rev. Physiol 73, 213–237. [DOI] [PMC free article] [PubMed] [Google Scholar]
- Ramírez F, Ryan DP, Grüning B, Bhardwaj V, Kilpert F, Richter AS, Heyne S, Dündar F, and Manke T. (2016). deepTools2: a next generation web server for deep-sequencing data analysis. Nucleic Acids Res. 44 (W1), W160–5. [DOI] [PMC free article] [PubMed] [Google Scholar]
- Qi Z, Li Y, Zhao B, Xu C, Liu Y, Li H, Zhang B, Wang X, Yang X, Xie W, et al. (2017). BMP restricts stemness of intestinal Lgr5(+) stem cells by directly suppressing their signature genes. Nat Commun 8, 13824. [DOI] [PMC free article] [PubMed] [Google Scholar]
- R Development Core Team (2013). R: A language and environment for statistical computing (R Foundation for Statistical Computing; ). [Google Scholar]
- Robinson JT, Thorvaldsdottir H, Winckler W, Guttman M, Lander ES, Getz G, and Mesirov JP (2011). Integrative genomics viewer. Nat Biotechnol 29, 24–26. [DOI] [PMC free article] [PubMed] [Google Scholar]
- Roulis M, and Flavell RA (2016). Fibroblasts and myofibroblasts of the intestinal lamina propria in physiology and disease. Differentiation 92, 116–131. [DOI] [PubMed] [Google Scholar]
- Sailaja BS, He XC, and Li L. (2016). The regulatory niche of intestinal stem cells. J. Physiol 594, 4827–4836. [DOI] [PMC free article] [PubMed] [Google Scholar]
- Sato T, and Clevers H. (2013). Primary mouse small intestinal epithelial cell cultures. Methods Mol. Biol 945, 319–328. [DOI] [PubMed] [Google Scholar]
- Sato T, Vries RG, Snippert HJ, van de Wetering M, Barker N, Stange DE, van Es JH, Abo A, Kujala P, Peters PJ, and Clevers H. (2009). Single Lgr5 stem cells build crypt-villus structures in vitro without a mesenchymal niche. Nature 459, 262–265. [DOI] [PubMed] [Google Scholar]
- Schindelin J, Arganda-Carreras I, Frise E, Kaynig V, Longair M, Pietzsch T, Preibisch S, Rueden C, Saalfeld S, Schmid B, et al. (2012). Fiji: an open-source platform for biological-image analysis. Nat. Methods 9, 676–682. [DOI] [PMC free article] [PubMed] [Google Scholar]
- Shen Q, Goderie SK, Jin L, Karanth N, Sun Y, Abramova N, Vincent P, Pumiglia K, and Temple S. (2004). Endothelial cells stimulate self-renewal and expand neurogenesis of neural stem cells. Science 304, 1338–1340. [DOI] [PubMed] [Google Scholar]
- Shoshkes-Carmel M, Wang YJ, Wangensteen KJ, Tóth B, Kondo A, Massasa EE, Itzkovitz S, and Kaestner KH (2018). Subepithelial telocytes are an important source of Wnts that supports intestinal crypts. Nature 557, 242–246. [DOI] [PMC free article] [PubMed] [Google Scholar]
- Snippert HJ, van der Flier LG, Sato T, van Es JH, van den Born M, Kroon-Veenboer C, Barker N, Klein AM, van Rheenen J, Simons BD, and Clevers H. (2010). Intestinal crypt homeostasis results from neutral competition between symmetrically dividing Lgr5 stem cells. Cell 143, 134–144. [DOI] [PubMed] [Google Scholar]
- Srinivas S, Watanabe T, Lin CS, William CM, Tanabe Y, Jessell TM, and Costantini F. (2001). Cre reporter strains produced by targeted insertion of EYFP and ECFP into the ROSA26 locus. BMC Dev. Biol 1, 4. [DOI] [PMC free article] [PubMed] [Google Scholar]
- Stzepourginski I, Eberl G, and Peduto L. (2015). An optimized protocol for isolating lymphoid stromal cells from the intestinal lamina propria. J. Immunol. Methods 421, 14–19. [DOI] [PubMed] [Google Scholar]
- Stzepourginski I, Nigro G, Jacob JM, Dulauroy S, Sansonetti PJ, Eberl G, and Peduto L. (2017). CD34+ mesenchymal cells are a major component of the intestinal stem cells niche at homeostasis and after injury. Proc. Natl. Acad. Sci. USA 114, E506–E513. [DOI] [PMC free article] [PubMed] [Google Scholar]
- Tetteh PW, Basak O, Farin HF, Wiebrands K, Kretzschmar K, Begthel H, van den Born M, Korving J, de Sauvage F, van Es JH, et al. (2016). Replacement of lost Lgr5-positive stem cells through plasticity of their enterocyte-lineage daughters. Cell Stem Cell 18, 203–213. [DOI] [PubMed] [Google Scholar]
- Tian H, Biehs B, Warming S, Leong KG, Rangell L, Klein OD, and de Sauvage FJ (2011). A reserve stem cell population in small intestine renders Lgr5-positive cells dispensable. Nature 478, 255–259. [DOI] [PMC free article] [PubMed] [Google Scholar]
- Valdimarsdottir G, Goumans MJ, Rosendahl A, Brugman M, Itoh S, Lebrin F, Sideras P, and ten Dijke P. (2002). Stimulation of Id1 expression by bone morphogenetic protein is sufficient and necessary for bone morphogenetic protein-induced activation of endothelial cells. Circulation 106, 2263–2270. [DOI] [PubMed] [Google Scholar]
- van der Maaten L. (2014). Accelerating t-SNE using tree-based algorithms. J. Mach. Learn. Res 15, 3221–3245. [Google Scholar]
- van Es JH, Sato T, van de Wetering M, Lyubimova A, Yee Nee AN, Gregorieff A, Sasaki N, Zeinstra L, van den Born M, Korving J, et al. (2012). Dll1+ secretory progenitor cells revert to stem cells upon crypt damage. Nat. Cell Biol 14, 1099–1104. [DOI] [PMC free article] [PubMed] [Google Scholar]
- Wang F, Flanagan J, Su N, Wang LC, Bui S, Nielson A, Wu X, Vo HT, Ma XJ, and Luo Y. (2012a). RNAscope: a novel in situ RNA analysis platform for formalin-fixed, paraffin-embedded tissues. J. Mol. Diagn 14, 22–29. [DOI] [PMC free article] [PubMed] [Google Scholar]
- Wang L, Wang S, and Li W. (2012b). RSeQC: quality control of RNA-seq experiments. Bioinformatics 28, 2184–2185. [DOI] [PubMed] [Google Scholar]
- Wei T, Simko V, Levy M, Xie Y, Jin Y, and Zemla J. (2017). R package “corrplot”: Visualization of a correlation matrix (version 0.84). https://github.com/taiyun/corrplot. [Google Scholar]
- Wolpert L. (1971). Positional information and pattern formation. Curr. Top. Dev. Biol 6, 183–224. [DOI] [PubMed] [Google Scholar]
- Worthley DL, Churchill M, Compton JT, Tailor Y, Rao M, Si Y, Levin D, Schwartz MG, Uygur A, Hayakawa Y, et al. (2015). Gremlin 1 identifies a skeletal stem cell with bone, cartilage, and reticular stromal potential. Cell 160, 269–284. [DOI] [PMC free article] [PubMed] [Google Scholar]
- Yoshida S, Sukeno M, and Nabeshima Y. (2007). A vasculature-associated niche for undifferentiated spermatogonia in the mouse testis. Science 317, 1722–1726. [DOI] [PubMed] [Google Scholar]
Associated Data
This section collects any data citations, data availability statements, or supplementary materials included in this article.