Abstract
Background:
Screening for prostate cancer with prostate specific antigen and digital rectal examination allows early diagnosis of prostate malignancy but has been associated with poor sensitivity and specificity. There is also a considerable risk of over-diagnosis and over-treatment, which highlights the need for better tools for diagnosis of prostate cancer. This study investigates the potential of high throughput Raman and Fourier Transform Infrared (FTIR) spectroscopy of liquid biopsies for rapid and accurate diagnosis of prostate cancer.
Methods:
Blood samples (plasma and lymphocytes) were obtained from healthy control subjects and prostate cancer patients. FTIR and Raman spectra were recorded from plasma samples, while Raman spectra were recorded from the lymphocytes. The acquired spectral data was analysed with various multivariate statistical methods, principal component analysis (PCA), partial least squares discriminant analysis (PLS-DA) and classical least squares (CLS) fitting analysis.
Results:
Discrimination was observed between the infrared and Raman spectra of plasma and lymphocytes from healthy donors and prostate cancer patients using PCA. In addition, plasma and lymphocytes displayed differentiating signatures in patients exhibiting different Gleason scores. A PLS-DA model was able to discriminate these groups with sensitivity and specificity rates ranging from 90% to 99%. CLS fitting analysis identified key analytes that are involved in the development and progression of prostate cancer.
Conclusions:
This technology may have potential as an alternative first stage diagnostic triage for prostate cancer. This technology can be easily adaptable to many other bodily fluids and could be useful for translation of liquid biopsy-based diagnostics into the clinic.
Keywords: FTIR spectroscopy, liquid biopsy, partial least squares discriminant analysis and classical least squares fitting analysis, principal component analysis, prostate cancer, Raman spectroscopy
Introduction
Prostate cancer is the second most frequently diagnosed cancer and the third most common cause of death from cancer in men in western countries.1 Prostate cancer constitutes about 11% of all cancers and accounts for 9% of all the cancer deaths among the male population within Europe.2 Despite the high survival rates for men with prostate cancer, it has been estimated that 1.3 million new cases of prostate cancer and 359,000 associated deaths occurred worldwide in 2018.3 Prostate cancer is frequently diagnosed in the preliminary stages before it has begun to spread to other parts of the body. The prostate gland is initially assessed with a prostate specific antigen (PSA) blood test and a digital rectal examination (DRE). The extensive use of PSA has proven controversial because of poor sensitivity and specificity and is prone to false positives and false negatives in men with symptoms suggestive of a possible diagnosis of prostate cancer.4 The newly approved 4K score test5 and prostate health index test6 has improved the PSA test but only one biomarker is measured in these tests. DRE has also been typically employed to screen for prostate cancer. Even though DRE has long been used to detect prostate cancer, no controlled studies have shown its association with a decrease in the prostate cancer mortality rates.7 The screening for prostate cancer with PSA and DRE has been regarded as controversial despite the significant number of publications in medical and scientific journals on its use.8 This suggests the need for new biomarkers which can be used to improve on (a) the early detection of prostate cancer, (b) overall prognosis and (c) offer options for treatment monitoring. More recently, several studies9 have used biofluids (liquid biopsies) such as plasma, serum and urine for the detection of potential new biomarkers for prostate cancer diagnostics and these may offer an option to satisfy these clinical needs.
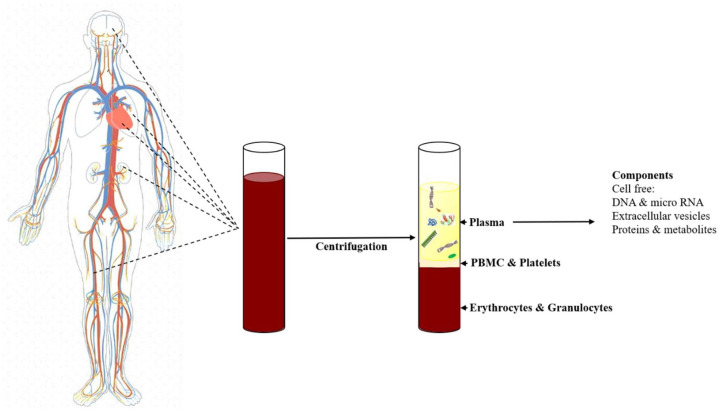
Liquid biopsies as a minimally invasive diagnostic option for the detection of various cancers10 have several key advantages (less invasive, easily accessible, repeated availability) and can be implemented in a variety of healthcare scenarios, from being part of routine health checks to intra-operative monitoring of biofluids or therapeutic agents.11 Blood plasma and serum are frequently used for detection of circulating biomarkers as plasma and serum can contain cell free DNA, micro RNA, proteins, extracellular vesicles and various analytes (Figure 1). Peripheral blood mononuclear cells (PBMCs) are peripheral blood cells with a round nucleus.12 In humans, lymphocytes constitute the majority of the PBMC population13 and play a key role in the immune system. Thus, the characterization of this cell fraction is also important to gain insights into disease status and systemic response.
Figure 1.
Isolation of plasma from whole blood. Circulating cell free plasma biomarkers includes DNA, micro RNA, extracellular vesicles, proteins and other analytes from both cancerous and non-cancerous sites (inspired from14).
PBMC, peripheral blood mononuclear cells.
Most liquid biopsy studies have focused on cell free nucleic acids (cfNA) and circulating tumour cells found in the blood plasma for the identification of prognostic, diagnostic and/or predictive biomarkers in cancer. However, other components, such as circulating proteins, analytes and exosomes are not as widely studied. Despite several approaches having been developed for detection of circulating DNA,15,16 circulating tumour cells17,18 and exosomes19,20 from liquid biopsies of cancer patients, these assays have not seen translation to the clinic.
Vibrational spectroscopy techniques, such as Raman and infrared (IR) spectroscopy are non-destructive, non-invasive and reagent free, providing biochemical profiles of cells, tissues and biofluids. IR spectroscopy is based on the absorption of IR radiation by the sample under study and the fact that molecules absorb specific frequencies of the incident light which are characteristic of their structure. Raman spectroscopy is based on inelastic scattering of monochromatic light, usually from a laser source. Inelastic scattering means that the frequency of photons in monochromatic light change upon interaction with a sample.21 These techniques have been applied to biofluids (serum or plasma) for discriminating between non cancer controls and head and neck cancer patients,22,23 breast cancer patients,24 cervical cancer patients25 and prostate cancer patients26 with sensitivities and specificities above 75%.
In the present study, Raman and IR spectra were recorded from plasma samples obtained from healthy donors and prostate cancer patients, while Raman spectra were recorded from the lymphocytes. Significant spectral differences were observed between the Raman and IR spectra of plasma and lymphocyte samples from healthy donors and prostate cancer patients. Similarly, significant spectral differences were observed in the plasma and lymphocytes between patients exhibiting different Gleason scores (GS). The acquired Raman and IR spectra were also analysed by principal component analysis (PCA), partial least squares discriminant analysis (PLS-DA) and classical least squares (CLS) fitting analysis to discriminate individuals with and without disease and provide insights into the underlying molecular species providing this discrimination. The PLS-DA classifier was able to classify the presence of disease with sensitivities and specificities ranging from 90% to 99%. The CLS fitting analysis identified several analytes that are involved in the development and progression of prostate cancer.
Materials and methods
Ethical approval
Ethical approval was awarded by the Technological University Dublin Research Ethics Committee (REC number 15-32) for the collection of blood samples from healthy donors. The prostate cancer patients for this study were recruited from the Cancer Trials Ireland (formerly All Ireland Cooperative Oncology Research Group, ICORG) trial 08−17 which is entitled ‘A Prospective phase II Dose Escalation Study Using intensity modulated radiotherapy (IMRT) for High Risk N0 M0 Prostate Cancer (ClinicalTrials.gov identifier: NCT00951535)’. The primary endpoint is to determine if dose escalation up to 81 Gy using IMRT for high risk localised prostate cancer can provide PSA relapse-free survival similar to that previously reported.27 A subgroup of patients were recruited for a translational study on vibrational spectroscopy for monitoring radiation therapy response28 related to the present study. The translational research study was approved by the St Luke’s Radiation Oncology Network Research Ethics Committee and all research was performed in accordance with relevant guidelines and regulations. Informed consent was obtained from all participants covering the donation of the blood sample and access to the de-identified clinical data. Fresh whole blood was drawn into Li-heparin tubes at St. Luke`s Radiation Oncology Network in Dublin and were coded before being transferred to the Technological University (TU) Dublin laboratory. For this study, a total of 43 prostate cancer patients and 33 healthy control volunteers were recruited. Of these cohorts, plasma samples were collected from 37 prostate cancer patients and 33 healthy control subjects and lymphocyte samples were collected from 29 prostate cancer patients and 26 healthy control subjects. The demographics of healthy donors and prostate cancer patients recruited for this study are detailed in Table 1.
Table 1.
Summary of subjects recruited in the study.
| Prostate cancer | Healthy donors | |
|---|---|---|
| Subjects recruited | 43 | 33 |
| Sex | M | M |
| Age (years) | ||
| Mean | 68.26 | 39.6 |
| Median | 69.5 | 37.0 |
| Range | 57–79 | 23–60 |
| PSA (ng/ml) | ||
| Mean | 17.22 | Not measured |
| Median | 9.4 | |
| T Stage | ||
| T2a to T2c | 11 (26%) | NA |
| T3a | 23 (53%) | |
| T3b | 08 (19%) | |
| T4a | 01 (2%) | |
| Gleason score | ||
| 7 | 14 (33%) | NA |
| 8 | 16 (37%) | |
| 9 | 13 (30%) | |
PSA, prostate specific antigen.
Plasma isolation
Plasma was isolated from these blood samples by centrifugation at 3500 g for 5 min at 18°C. The samples were subsequently stored at −80°C prior to Fourier Transform Infrared (FTIR) and Raman acquisition.
Isolation of lymphocytes
Fresh whole blood was drawn from healthy donors and patients into lithium-heparin tubes and PBMCs were isolated within 24 h of collection as described previously.29 A total of 6 ml of Dulbecco’s modified phosphate buffered saline (DPBS; Sigma Aldrich LLC, St Louis, MO) was added to 6 ml of heparinised blood, mixed by gentle inversion and overlaid onto 15 ml of Histopaque (Sigma Aldrich LLC). Samples were centrifuged at 400 g for 30 min at room temperature. The PBMC layer was removed using a pipette and the rest of the contents were discarded. PBMCs were washed by adding 10 ml of DPBS (Sigma Aldrich LLC) and gently mixed by inversion.
Samples were washed a total of three times. Finally, cells were pelleted by centrifugation at 250 g for 5 min at room temperature. Supernatant was discarded and the cell pellet was resuspended in 3 ml of full media (RPMI + 12.5% (v/v) FBS + 2 mM L-glutamine; Sigma Aldrich LLC) supplemented with 2.5% (v/v) phytohaemagglutinin (PAA Laboratories Ltd, Somerset, UK). A total of 1 ml of cell suspension was transferred to a T25 flask containing 4 ml of full media. A total of three flasks were prepared for each donor. Flasks were placed on their side and incubated for 72 h at 37°C and 5% CO2 to allow separation of lymphocytes and monocytes by plastic adherence.
FTIR spectroscopy
The sample preparation and acquisition methodology for FTIR spectra has been detailed previously.28 The acquired FTIR spectra were subjected to a quality test (OPUS v6.5) as previously described.30,31 Spectra that passed the quality test were pre-processed and analysed in the wavenumber range from 800 cm−1 to 4000 cm−1.
Raman spectroscopy
Blood plasma
Raman spectroscopy was performed using an in house developed high throughput (HT)-Raman spectroscopy method32 on a Horiba Jobin Yvon Labram HR800 UV micro-spectroscopy system (Horiba UK Ltd, Middlesex, UK). Briefly, 20 µl of liquid plasma was deposited on a cover glass bottomed 96 well plate (MatTek corporation) and Raman spectra of the plasma samples were acquired using a 785 nm laser focused through a 10× objective (N.A. 0.25). Spectra were recorded using a diffraction grating ruled with 300 lines/mm giving a spectral resolution of ~2.1 cm−1. Spectra were recorded automatically from each well where the spectrometer was programmed using an in-house developed high throughput macro template. Each spectrum was acquired over the region from 400 cm−1 to 1800 cm−1. Ten spectra were recorded from each sample for each patient with a 20 s × 2 integration time. Multiple wavenumber calibration spectra of 1,4-Bis (2-methylstyryl) benzene and intensity calibration spectra of National Institute of Standards and Technology (NIST) Standard Reference Material (SRM) no. 2241 were recorded along with each sample acquisition and used in spectral post-processing.
Lymphocytes
For Raman spectroscopy, cells were fixed using 4% paraformaldehyde (AppliChem GmbH, Darmstadt, Germany) in DPBS (Sigma Aldrich LLC). From the suspension, 40 µl was drop cast onto calcium fluoride (CaF2) slides. The slides were then washed in deionised water and the samples were allowed to dry. Raman spectroscopic measurements were performed using a Horiba Jobin Yvon Labram HR800 UV micro-spectroscopy system (Horiba UK Ltd, Middlesex, UK) equipped with a 660 nm solid-state diode laser and calibrated using silicon.
A 100× objective (N.A. 0.95) and a diffraction grating of 300 lines/mm (centred at 1450 cm−1) were used. The laser intensity was set to 100% and the confocal hole was set to 100 μm. A total of 30 spectra were collected from each patient sample. Spectra were recorded with a 20 s integration time and averaged over 3 integrations. Each spectrum was recorded using a 4 × 4 µm raster scan of the centre of each cell.
Pure molecular reference species
All pure molecular reference species (Tables 2 and 3) were purchased from Sigma Aldrich in lyophilised form. Approximately 1–2 mg of each lyophilised analyte or 10 µl of liquid analyte was deposited on a calcium fluoride slide and Raman spectra were recorded with a 660 nm and 785 nm laser excitation. The laser was focused through a 10× objective (N.A. 0.25) using a diffraction grating ruled with a grating of 300 lines per mm. Five spectra per sample were recorded with an acquisition time of 10 s and averaged over 2 accumulations. FTIR spectra of all analytes were recorded using an attenuated total reflectance (ATR)-FTIR crystal (Perkin Elmer). Approximately 1 mg of lyophilised sample or 5 µl of liquid analyte (allowed to dry at room temperature) was placed on the ATR crystal (diamond/zinc selenide with refractive index 2.4) and FTIR spectra were acquired in the transmission mode using the spectrum software and using the following conditions: wavenumber range from 700 cm−1 to 4000 cm−1, spectral resolution of 4 cm−1, and each spectrum was averaged over 8 scans. Tables 2 and 3 shows the list of pure molecular reference species used in the plasma and lymphocyte study, respectively.
Table 2.
Pure molecular reference species used in the plasma study.
| Category | Pure molecular reference species |
|---|---|
| Protein and related compounds | Albumin, Apolipoprotein E4, Keratin, Interleukin-1, Interleukin-6, Interleukin-8 and Ubiquitin, |
| Lipids and Fatty acids | Arachidonic acid, Cholesterol, Linolenic acid, Linoleic acid, Oleic acid, Triglyceride, PUFA, Sphingomyelin, Phosphatidylcholine, Phosphatidylethanolamine, Phosphatidylserine, Prostaglandin E1, Phosphatidylinositol |
| Nucleic acids | DNA and RNA |
| Growth factors | Epidermal growth factor and KGF |
| Antioxidants and free radical scavengers | Uric acid and β-carotene, |
| Metabolism | Glucose, Glycogen, Creatinine |
| Enzymes | Carbonic anhydrase |
PUFA, polyunsaturated fatty acid; KGF, keratinocyte growth factor.
Table 3.
Pure molecular reference species used in the lymphocyte study.
| Category | Pure molecular reference species |
|---|---|
| Protein and related compounds | Actin, Histone (type 2A), Keratin, Ubiquitin, Interleukin-8, Tumour necrosis factor-alpha, |
| Lipids and Fatty acids | Arachidonic acid, Cholesterol, Linolenic acid, Linoleic acid, Triglycerides, PUFA, Phosphatidylcholine, Prostaglandin E1 (PGE1) |
| Nucleic acids and related compounds | DNA, RNA, Deoxyuridine and Thymidine |
| Other analytes | ATP, β-carotene, Glycogen, Uric acid and Cytochrome C |
PUFA, polyunsaturated fatty acid.
Data analysis
All spectral processing procedures were carried out within MATLAB (R2017a; Mathworks Inc., Natick, MA), along with in-house developed algorithms and procedures available within the PLS Toolbox (v 8.0.2, Eigenvector Research Inc., Wenatchee, MA).
Pre-processing
Plasma FTIR spectra
Pre-processing of FTIR spectra includes baseline correction, calculation of second derivative spectra and vector normalisation. Baseline correction was performed using the rubberband baseline subtraction.33 Second derivative spectra were calculated using the Savitzky–Golay algorithm34 and a window length of nine points. All spectra were standardised using vector normalisation before analysis.
Plasma Raman spectra
The acquired Raman spectra were wavenumber calibrated relative to an in-house standard of 1,4-Bis (2-methylstyryl) benzene using in-house developed calibration procedures35 and the instrument response correction was performed using the spectrum of NIST SRM no. 2241, according to the method described.36 The wavenumber and instrument response corrected Raman spectra were smoothed using a Savitzky–Golay filter. Background and baseline correction were performed using extended multiplicative scattering correction. All spectra were standardised using vector normalisation before analysis.
Lymphocyte Raman spectra
All spectra were wavenumber calibrated using an in-house standard of 1,4-Bis (2-methylstyryl) benzene in conjunction with in-house developed algorithms in Matlab v.9.3 (Mathworks Inc., Natick, MA). Spectra from NIST SRM no. 2245 were used to perform instrument response correction according to the method described.37 Baseline correction was performed using a rubberband baseline subtraction, and all spectra were standardised before analysis.
Multivariate analyses
Pre-processed FTIR and Raman spectra were analysed using PCA, PLS-DA and CLS fitting analysis. Second derivative FTIR spectra were used for the multivariate analysis because this allows more distinct identification of small and adjacent lying absorption peaks which are not clearly distinguishable in the original spectrum.
PCA
PCA was performed as described previously.28 In brief, PCA is a commonly used method for multivariate data compression and visualization. It describes data variance by identifying a new set of orthogonal features, called principal components (PCs).
PLS-DA
PLS-DA is a linear classification model based on partial least squares regression,38 where the y variable (the regression target) is encoded as the discrete spectral class (cancer or control).39 PLS-DA aims to obtain maximum covariance between the independent and dependent variables of a multidimensional dataset by finding a linear subspace. This new subspace allows the prediction of dependent variables using a reduced number of factors, known as latent variables (LVs).40 The details of the PLS-DA approach used in this study are fully described by us previously.28
CLS fitting analysis
In this study, CLS fitting analysis was performed on the vector normalised second derivative FTIR spectra and vector normalised Raman spectra to estimate the relative fraction (a proxy for concentration) of reference spectra (of pure components) within a sample spectrum. The use of CLS fitting analysis to determine the relative concentrations of cellular components have been reported previously.41–43 The pure components used in this study are given in Table 2 and 3. All these pure molecular reference species are directly or indirectly related to the development and progression of cancer. CLS is an exploratory method that assumes that any complex spectrum is the linear sum of contributions from spectra of pure components that contribute to the spectrum as described in the following equation44
Where S represents a sample spectrum, a1 and a2 are component spectra and C1 and C2 are the weights or concentrations assigned to each component spectrum. In the case of a Raman or FTIR spectrum, not all contributing pure components are known. Therefore, E represents the error or residual matrix. CLS therefore aims to minimise the squared differences between the fit and the spectrum using a set of reference pure molecular spectra.
Results
Spectral features: healthy donors versus prostate cancer patients
For comparison of spectral features, a mean spectrum was computed for each class. To explain the differences between each group, difference spectra were computed by subtracting the mean spectra of plasma from healthy donors from the mean spectra of plasma from prostate cancer patients. The resulting mean and difference Raman spectra of plasma from healthy donors (n = 33) and prostate cancer patients (n = 37) are presented in Figure 2. Statistically significant differences (p < 0.001) were observed between the classes. Differences in the form of intensity-related variations were observed across these mean spectra. Major differences were observed for tyrosine (830, 850 cm−1), DNA/RNA (940, 1085, 1340, 1420 cm−1), β-carotene (1160, 1525 cm−1), amide linkages (1302, 1340 cm−1), CH2 deformation (1340), tryptophan ( ~ 1332–1363 cm−1), phenylalanine (1006 cm−1, 1210 cm−1), lipids and proteins (622 cm−1, 644 cm−1, 1300 cm−1, 1400–1470 cm−1, 1640–1670 cm−1) in all the spectra. The tentative band assignment of the observed spectral features is based on the existing literature.45
Figure 2.
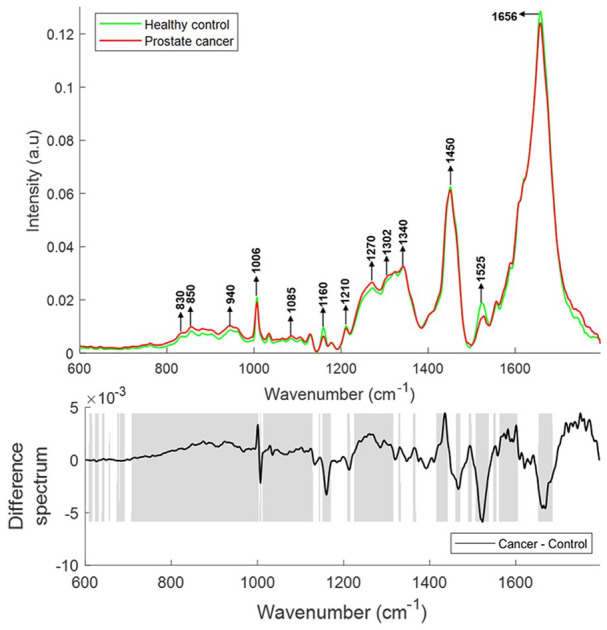
Mean Raman spectra of plasma from healthy donors and prostate cancer patients (top panel). Difference spectrum of cancer and control spectra (bottom panel). The shaded regions depict the spectral regions which are significantly different between each sample set using a two-tailed t-test with p < 0.001.
The mean and difference Raman spectra of lymphocytes from healthy donors (n = 26) and prostate cancer patients (n = 29) are presented in Figure 3. Differences in the form of intensity related variations were observed across the mean spectra. Decreases were observed in bands corresponding to cholesterol and C-C twisting of proteins (616–622 cm−1), C-C twisting of tyrosine (637–644 cm−1), ring breathing modes of DNA/RNA bases and O-P-O stretching of DNA (721–809 cm−1), saccharides and ring breathing mode of tyrosine (848–863 cm−1), carbohydrates, proline and hydroxyproline (925–941 cm−1), phenylalanine (998–1013 cm−1), DNA, lipids and carbohydrates (1088–1113 cm−1), tyrosine, lipids and DNA/RNA bases (1165–1191 cm−1), amide III (1245–1279 cm−1), CH3/CH2 twisting and bending of lipids and collagen (1310–1403 cm−1), DNA/RNA bases and β-carotene (1460–1525 cm−1) in prostate cancer patients when compared with healthy controls. In addition, increases were observed in bands corresponding to the CH2 deformation of lipids (1423–1443 cm−1), guanine and adenine (1573 cm−1), cytosine, tyrosine and phenylalanine (1606–1612 cm−1) and tryptophan and amide I (1618–1669 cm−1) in prostate cancer patients when compared with healthy donors.
Figure 3.
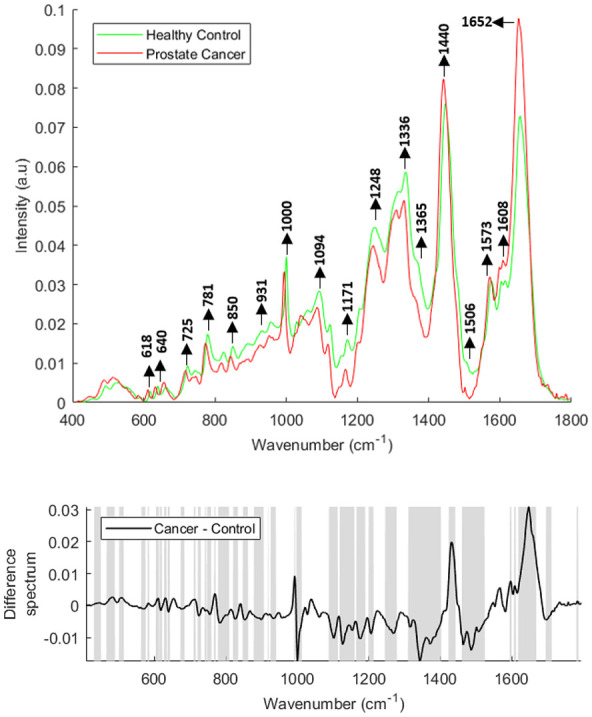
Mean Raman spectra of lymphocytes from healthy donors and prostate cancer patients (top panel). Raman difference spectrum of lymphocytes from healthy controls and prostate cancer patients (bottom panel). The shaded regions depict the spectral regions which are significantly different between each sample set using a two-tailed t-test with p < 0.001.
Figure 4 shows the vector normalised mean FTIR spectra of plasma from healthy donors (n = 33) and prostate cancer patients (n = 37). Differences in the form of intensity-related variations were observed across these mean spectra. Major differences in the regions around 1020–1040 cm−1 (C-O stretching and bending vibrations of glycogen), 1070–1090 cm−1 (symmetric stretching of PO2−, nucleic acids, phospholipids and saccharides), 1120–1170 cm−1 [stretching vibrations of (C-O) and ν(C-O-C) of carbohydrates], 1240 cm−1 (nucleic acids), 1300–1400 cm−1 (amide III), 1544 cm−1 (Amide II), 1656 cm−1 (Amide 1), 1740–1760 cm−1 [stretching vibrations of (C=O) of fatty acids, triglycerides and cholesterol esters], 2800–2965 cm−1 [stretching vibrations of (CH2/CH3) of lipids, fatty acids, triglycerides and proteins] 3300 cm−1 (Amide A), and 3400–3600 cm−1 (OH stretch of carboxylic acids) were observed in the plasma spectra of healthy donors and prostate cancer patients.
Figure 4.
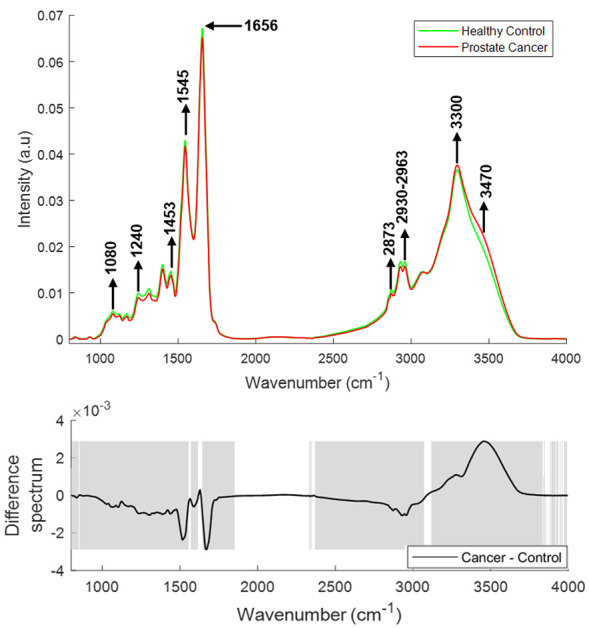
Mean FTIR spectra of plasma from healthy donors and prostate cancer patients (top panel). Difference spectrum of cancer and control spectra (bottom panel). The shaded regions depict the spectral regions which are significantly different between each sample set using a two-tailed t-test with p < 0.001.
FTIR, Fourier Transform Infrared.
Spectral features varying with Gleason score
The mean and difference Raman spectra of plasma from prostate cancer patients with varying GS [GS 7 (n = 10), GS 8 (n = 11), GS 9 (n = 09)] are presented in Figure 5. Significant differences were observed for tyrosine (830, 850 cm−1), DNA/RNA (940, 1085, 1340 and 1588 cm−1), phenylalanine (1007, 1210 cm−1), β-carotene (1155 and 1525 cm−1), amide linkages (1302, 1340 cm−1), CH2 deformation (1340), tryptophan (∼1332–1363 cm−1), phospholipids (1450 cm−1) and lipids/proteins (1640–1660 cm−1) in all the spectra. An increase in the bands related to tyrosine, tryptophan, DNA/RNA, amide linkages and CH2 deformation and a decrease in the bands related to phenylalanine, β-carotene, lipids and proteins was observed with an increase in GS.
Figure 5.
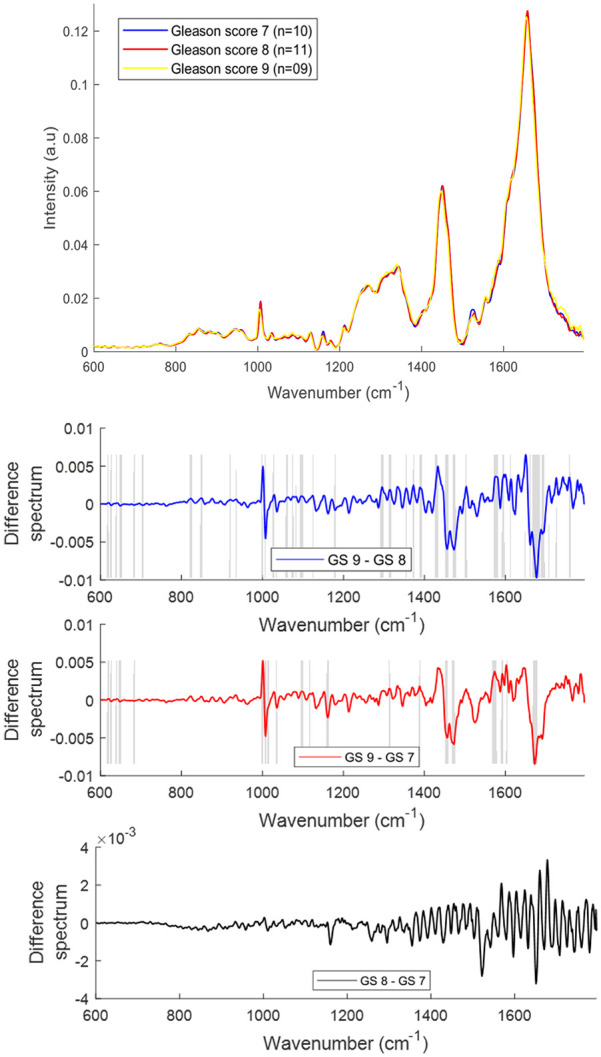
Mean Raman spectra of plasma from prostate cancer patients with Gleason scores (GS) 7, 8 and 9 (top panel). Difference spectra of plasma from patients with different GS (bottom three panels). The shaded regions depict the spectral regions which are significantly different between each sample set using a two-tailed t-test with p < 0.001.
The mean and difference Raman spectra of lymphocytes from prostate cancer patients with different GS [GS 7 (n = 07), GS 8 (n = 13), GS 9 (n = 09)] are presented in Figure 6. Differences in the form of intensity-related variations were observed across the mean spectra. The bands corresponding to phosphodiester, saccharides and deoxyribose (850–980 cm−1), phospholipids, lipids and C-C stretching in carbohydrates (991–1098 cm−1) and amide I and fatty acids (1649–1666 cm−1) were increased with an increase in GS.
Figure 6.
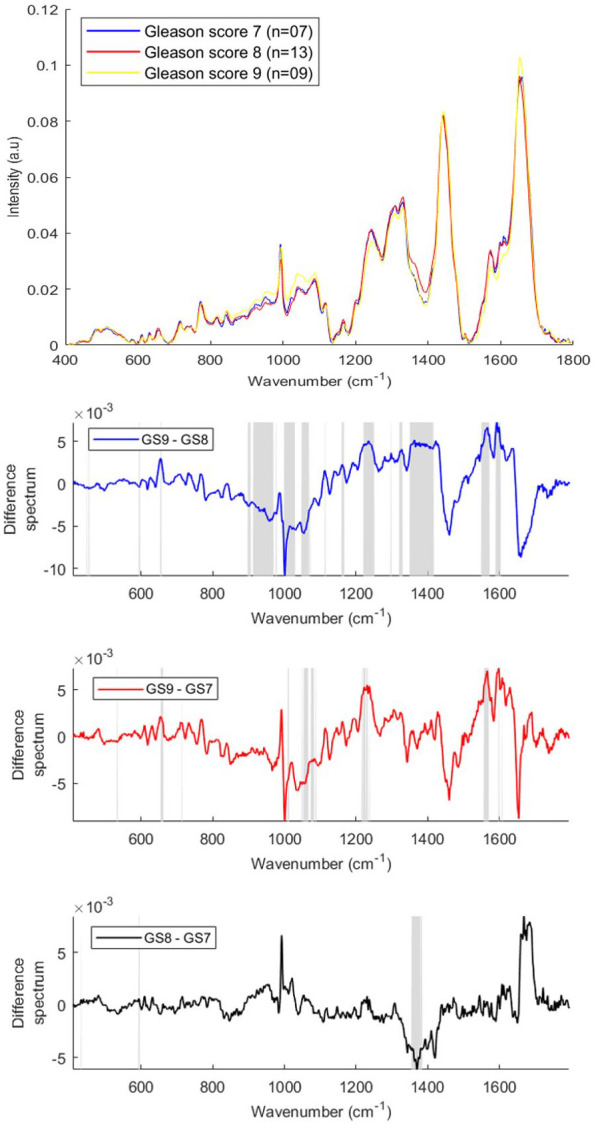
Mean Raman spectra of lymphocytes from prostate cancer patients with Gleason scores (GS) 7, 8 and 9 (top panel). GS difference spectra for Raman lymphocyte spectra (bottom three panels). The shaded regions depict the spectral regions which are significantly different between each sample set using a two-tailed t-test with p < 0.001.
The bands corresponding to hydroxyproline, tyrosine, amide III, C-C and C-N stretching (1197–1264 cm−1), CH3CH2 wagging of nucleic acids, CH2 twisting and wagging of lipids, triglycerides and guanine (1293–1336 cm−1), RNA/DNA and tryptophan (1344–1420 cm−1) and carotenoid, Amide II, tryptophan, RNA/DNA, tyrosine and phenylalanine (1504–1626 cm−1) were decreased with an increase in GS.
The mean and difference FTIR spectra of plasma from prostate cancer patients with different GS [GS 7 (n = 10), GS 8 (n = 11), GS 9 (n = 09)] are presented in Figure 7. Differences in the form of intensity-related variations were observed in the regions around 1040–1080 cm−1, 1120–1170 cm−1, 1240 cm−1, 1300–1400 cm−1, 1545 cm−1, 1656 cm−1, 1738 cm−1, 2800–2963 cm−1 and 3300–3500 cm−1 in the plasma spectra of prostate cancer patients with different GS. The bands corresponding to DNA/RNA (1080, 1240 cm−1), carbohydrates (1120, 1170 cm−1), proteins (1300–1700 cm−1), fatty acids (1740 cm−1), lipids (2800–2950 cm−1) were increased with an increase in Gleason score and the bands corresponding to Amide A (3300 cm−1) and OH stretch (3400–3600 cm−1) were decreased with an increase in GS.
Figure 7.
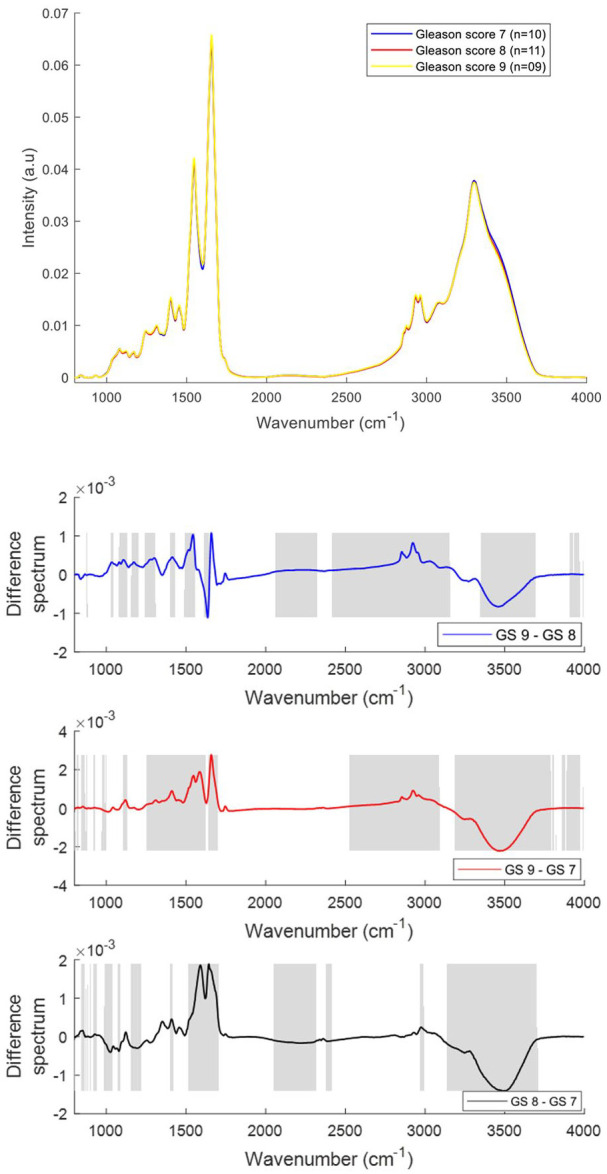
Mean FTIR spectra of plasma from prostate cancer patients with Gleason scores (GS) 7, 8 and 9 (top panel). Difference spectra of plasma from patients with different GS (bottom three panels). The shaded regions depict the spectral regions which are significantly different between each sample set using a two-tailed t-test with p < 0.001.
Multivariate analyses
PCA
PCA was performed on the mean Raman spectra of plasma from healthy donors and prostate cancer patients using the wavenumber range of 600–1800 cm−1. The first two PCs accounted for ~53% of the total percentage variance and the scatter plot of PC 1 versus PC 2 revealed two overlapped clusters between the two classes (Figure 8).
Figure 8.
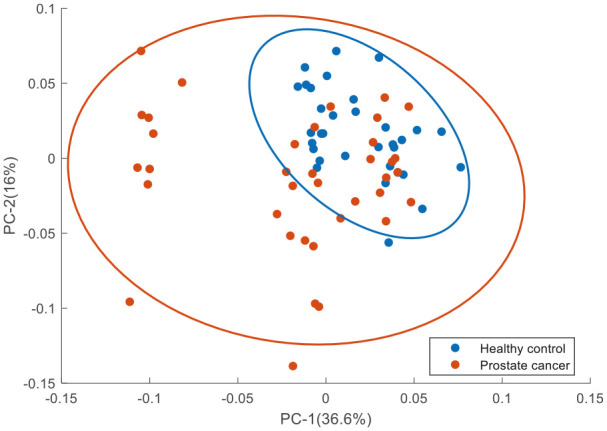
PCA for Raman spectra of plasma from healthy donors and prostate cancer patients. Covariance ellipse (95% confidence) are shown for each class.
PCA, principal component analysis.
Figure 9 shows the PCA performed on the mean Raman spectra of lymphocytes from healthy donors and prostate cancer patients using the wavenumber range of 400–1800 cm−1. The first two PCs accounted for 71% of the total percentage variance and the scatter plot of PC 1 versus PC 2 revealed two minimally overlapping clusters between the two classes.
Figure 9.
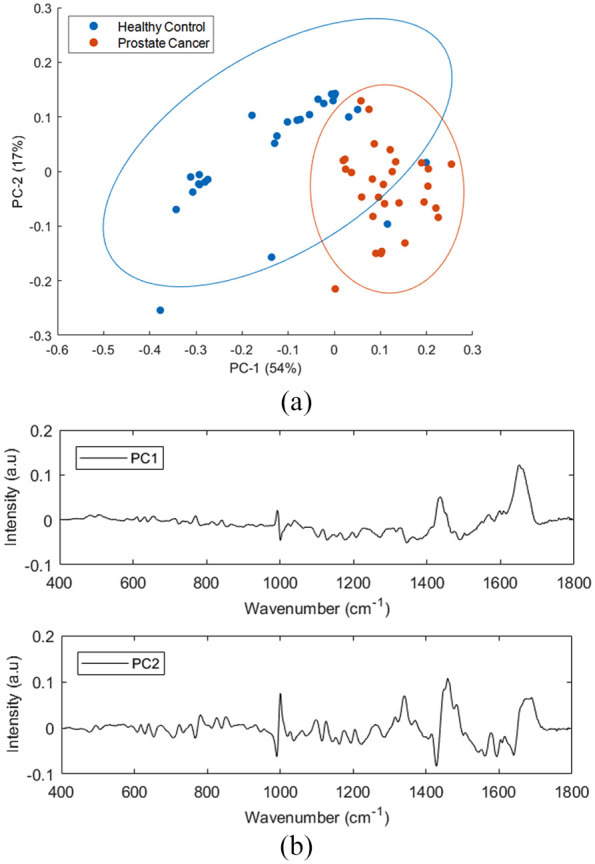
PCA for Raman spectra of healthy donors and prostate cancer lymphocyte samples. (a) Score plot (b) PC1 and PC2 loading plots. Covariance ellipses (95% confidence) are shown for each class.
PCA, principal component analysis.
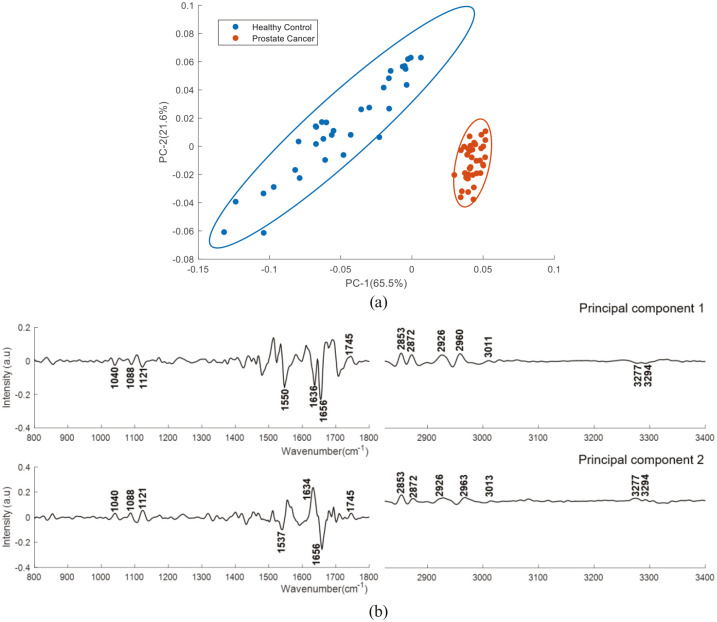
Figure 10 shows the PCA results performed on second derivative mean FTIR spectra using the wavenumber range of 800-4000 cm−1. The first two PCs accounted for ~86% of the total percentage variance and the scatter plot of PC1 versus PC2 revealed two well differentiated clusters between the classes.
Figure 10.
PCA for FTIR spectra of plasma from healthy donors and prostate cancer patients’ samples. (a) Score plot (b) PC1 and PC2 loading plot. Covariance ellipse (95% confidence) are shown for each class.
PCA, principal component analysis.
Figure 11 shows the PCA results performed on the mean Raman spectra of plasma and lymphocytes from prostate cancer patients with different GS. For plasma spectra, the first two PCs accounted for 66.7% of the total percentage variance and were used to visualise the classification between the groups. For lymphocyte spectra, PC1 and PC2 accounted for 56% of the total percentage variance and were used to visualise the classification between the groups. The scatter plot revealed overlapping clusters between the analysed classes without any discrimination
Figure 11.
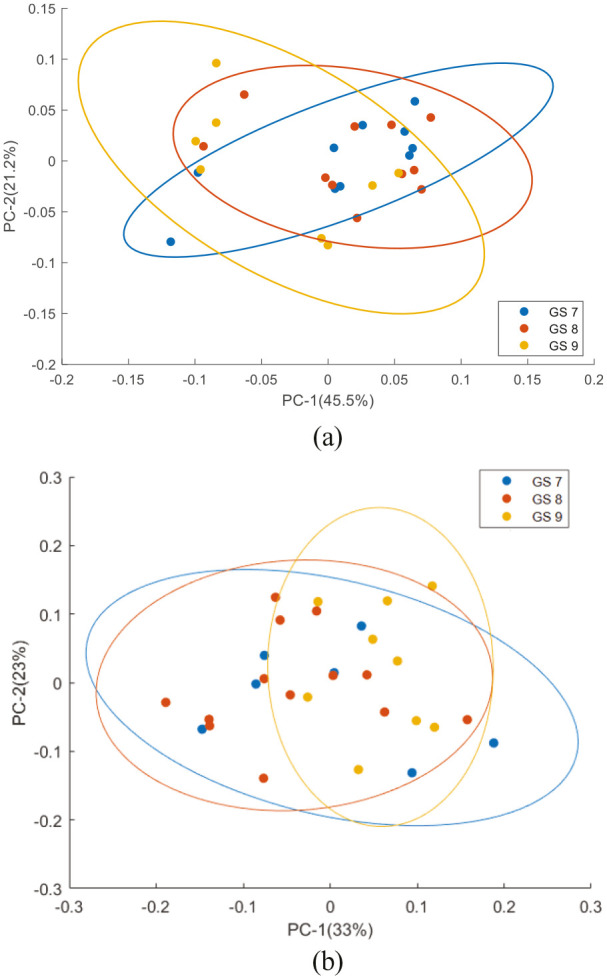
PCA scatter plot for Raman spectra from (a) plasma and (b) lymphocytes from prostate cancer patients with different Gleason score. Covariance ellipse (95% confidence) are shown for each class.
PCA, principal component analysis.
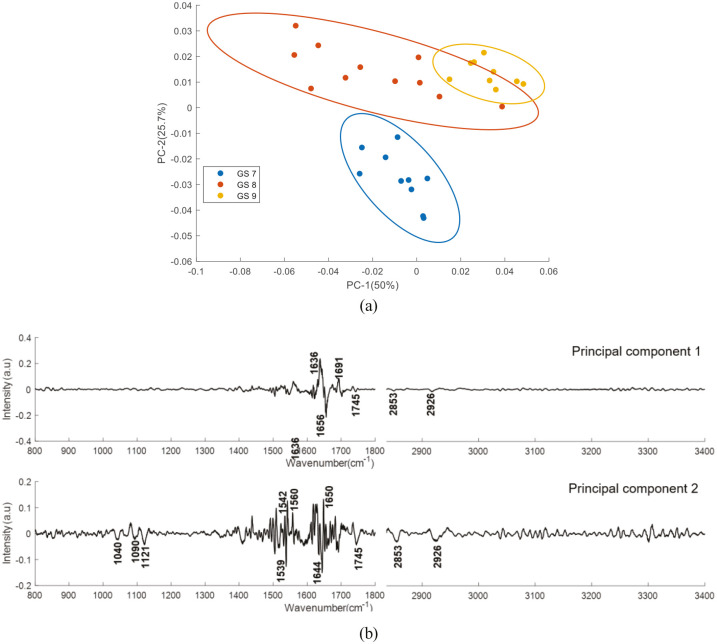
Figure 12 shows the PCA results performed on second derivative mean FTIR spectra of plasma from prostate cancer patients with different GS. The first two PCs accounted for 75.7% of the total percentage variance. The scatter plot of PC1 versus PC2 revealed three well differentiated clusters between the classes.
Figure 12.
PCA for FTIR spectra of plasma from prostate cancer patients with different Gleason score samples. (a) Score plot (b) PC1 and PC2 loading plot. Covariance ellipse (95% confidence) are shown for each class.
PCA, principal component analysis.
PLS-DA
PLS-DA analysis was performed to classify plasma and lymphocyte spectra from healthy donors and prostate cancer patients, as well as from prostate cancer patients with different GS based on the observed spectral features. Table 4 shows the classification sensitivities and specificities for Raman spectra and are calculated for the cross validated PLS-DA model. Table 5 shows the results of PLS-DA performed on the Raman spectra of lymphocytes.
Table 4.
Sensitivities and specificities for the PLS-DA classification of Raman spectra from plasma of healthy donors and prostate cancer patients, as well as plasma spectra from patients with different GS.
| Patients | Number of LVs | Sensitivity | Specificity |
|---|---|---|---|
| Healthy donors versus prostate cancer patients | 06 | 89.6% | 90% |
| GS 9 versus GS 8 | 07 | 78.7% | 80% |
| GS 9 versus GS 7 | 04 | 70% | 75.7% |
| GS 8 versus GS 7 | 04 | 63.3% | 66.5% |
GS, Gleason score; PLS-DA, partial least squares discriminant analysis.
Table 5.
Sensitivities and specificities for the PLS-DA classification of Raman spectra from lymphocytes of healthy donors and prostate cancer patients, as well as lymphocytes spectra from patients with different GS.
| Patients | Number of LVs | Sensitivity | Specificity |
|---|---|---|---|
| Healthy donors versus prostate cancer patients | 07 | 92% | 90% |
| GS 9 versus GS 8 | 03 | 65% | 85% |
| GS 9 versus GS 7 | 10 | 85% | 95% |
| GS 8 versus GS 7 | 13 | 80% | 75% |
GS, Gleason score; PLS-DA, partial least squares discriminant analysis.
Table 6 shows the classification sensitivities and specificities for FTIR spectra and are calculated for the cross validated PLS-DA model.
Table 6.
Sensitivities and specificities for the PLS-DA classification of plasma FTIR spectra from healthy donors and prostate cancer patients, as well as plasma spectra from patients with different GS.
| Patients | Number of LVs | Sensitivity | Specificity |
|---|---|---|---|
| Healthy controls versus prostate cancer patients | 12 | 99% | 98.4% |
| GS 9 versus GS 8 | 08 | 78.3% | 77% |
| GS 9 versus GS 7 | 14 | 82.6% | 80% |
| GS 8 versus GS 7 | 04 | 73.6% | 64.6% |
FTIR, Fourier Transform Infrared; GS, Gleason score; PLS-DA, partial least squares discriminant analysis.
CLS fitting analysis
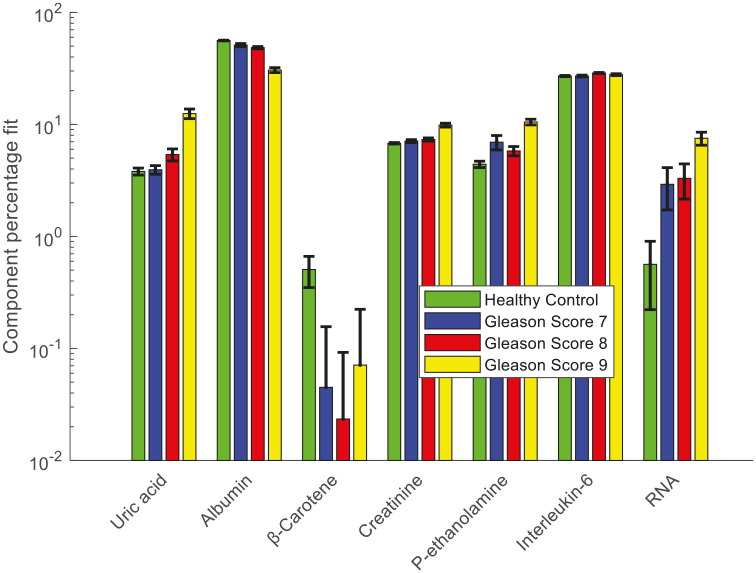
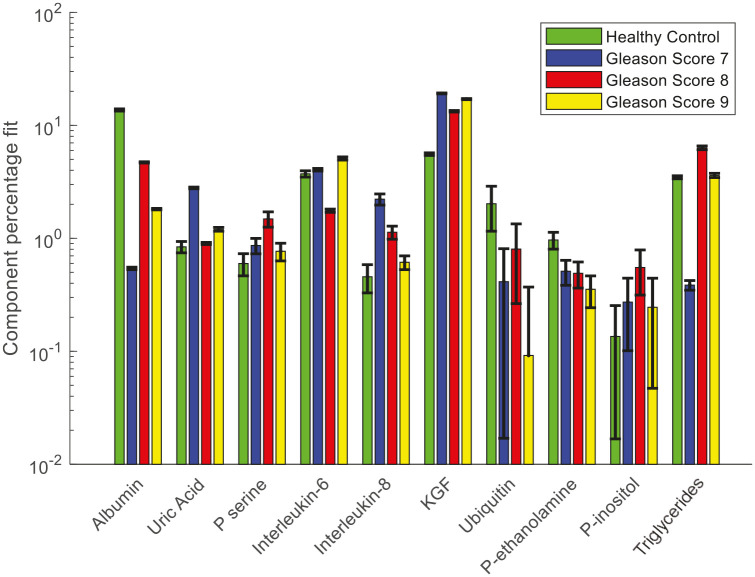
CLS fitting analysis was performed on the Raman spectra and second derivative FTIR spectra of plasma from healthy donors and prostate cancer patients to identify the biochemical species that are involved in the development and progression of prostate cancer. The reference biochemical spectra used in the plasma study are listed in Table 2. Figure 13 shows the results of CLS fitting analysis performed on the Raman spectra of plasma from healthy donors and prostate cancer patients with different GS. An increased weighting of uric acid, interleukin-6, phosphatidylethanolamine, creatinine and RNA and a decreased weighting of albumin and β-carotene was observed in the Raman spectra of plasma from prostate cancer patients compared with the healthy donors.
Figure 13.
Relative weightings of pure molecular reference species from least squares fit of Raman spectra of plasma from healthy donors and prostate cancer patients with different Gleason scores.
Error bars represent the standard error.
Figure 14 shows the results of CLS fitting analysis performed on the second derivative FTIR spectra of plasma from cancer and control cohorts. A decreased weighting of albumin, phosphatidyl-ethanolamine, ubiquitin and increased weighting of interleukin-6, interleukin-8, keratinocyte growth factor (KGF), phosphatidyl-inositol, phosphatidyl-serine, uric acid and triglyceride was observed in the plasma from prostate cancer patients compared with healthy donors. A decreased weighting of albumin and increased weighting of uric acid and interleukin-6 were also observed in the Raman spectral analysis. Elevated serum levels of Interleukin-8 were reported in patients with localised disease and androgen independent prostate cancer.46 Decreasing levels of plasma Interleukin-8 was observed with increasing GS.
Figure 14.
Relative weightings of pure molecular reference species from least squares fit of FTIR spectra of healthy donors and different Gleason scores of prostate cancer plasma samples.
Error bars represent the standard error.
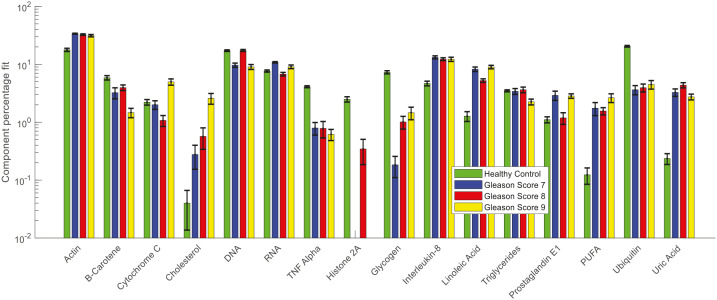
Figure 15 shows the results of CLS fitting analysis performed on the Raman spectra of lymphocytes from cancer and control cohorts. The list of pure molecular reference species used in this study is given in Table 3. These pure molecular reference species include cellular components and other analytes involved in the development and progression of cancer. The alterations in the weighing of actin, cholesterol, RNA, interleukin-8, linoleic acid, prostaglandin E1, polyunsaturated fatty acid (PUFA), uric acid, β-carotene, tumour necrosis factor alpha (TNF-α), histone (or histone 2A), glycogen, and ubiquitin were observed between the lymphocyte spectra of healthy donors and prostate cancer patients with different GS.
Figure 15.
Relative weightings of pure molecular reference species from least squares fit of Raman spectra of lymphocytes from healthy donors and prostate cancer patients with different Gleason scores.
Error bars represent the standard error.
Discussion
The mean and difference Raman spectra of plasma from healthy donors and prostate cancer patients show significant contributions from various biochemical components such as DNA, amino acids, proteins, lipids and β-carotene. The bands of the DNA backbone (940, 1085 cm−1) and nitrogenous bases (1340, 1420 and 1556 cm−1) were more intense in the mean spectrum of prostate cancer patients when compared with that of healthy donors. The presence of more intense DNA bands in prostate cancer samples may indicate high levels of cell-free DNA under cancer conditions.47 An increased expression of cfNA such as DNA, RNA and mRNA has been detected in the blood circulation of cancer patients.48 This might be due to the increased incidence of necrosis and apoptosis, or the release of intact cells in the bloodstream and their subsequent lysis.48 Moreover, the changes in the levels of cfNA have also been associated with tumour burden and tumour progression.47 An increased intensity in bands corresponding to amide linkages (1302, 1340 cm−1) were observed in the spectra from prostate cancer patients relative to healthy donors. This might be due to some proteomic perturbations such as changes in secondary structure. In addition, the bands corresponding to CH2 deformation (1340 cm−1) and lipids (1300, 1430–1440 cm−1) were also found to be more intense in prostate cancer, whereas the bands associated with proteins and phospholipids (1450–1470, 1666 cm−1) were more intense in healthy donors. Several studies have reported an increase serum/plasma lipids including phospholipids and fatty acids during prostate cancer progression.49,50 Higher levels of β-carotene (1160, 1525 cm−1) were observed in the spectra of healthy donors in comparison with prostate cancer patients. It has been previously reported that the amount of β-carotene present in the blood decreases during cancer conditions. Carotenoid abundance has been shown to be depleted in the cancerous state of several organs including breast, lung, liver and colon51 and to contribute to the discrimination between normal, benign and malignant breast tissues.52 Translocation of plasma free fatty acids to support visceral or tumour protein synthesis is an important feature observed in cancer patients. Previous studies have reported that levels of phenylalanine, tyrosine and tryptophan may be altered in different cancers.22 Amino acids as tyrosine (830, 850 cm−1) and tryptophan (~1332–1363 cm−1) also showed relatively higher levels in plasma from cancer patients in comparison with plasma from healthy donors. On the other hand, peaks for phenylalanine (1007, 1210 cm−1) were found to be more intense in plasma from healthy donors. Similarly, an increase in CH2 deformation of lipids, tryptophan, nucleobases and decrease in β-carotene were also observed in the Raman spectra of lymphocytes from prostate cancer compared with the healthy donors.
FTIR spectra of plasma from healthy donors shows high intense bands at 1080 cm−1 and 1240 cm−1 compared with plasma from cancer patients. The two bands in this region at 1080 cm−1 and 1240 cm−1 are primarily due to the symmetric and asymmetric stretching modes of phosphodiester groups respectively.53 As phosphodiester groups are found in nucleic acids, these two bands are associated with the nucleic acid content of a cell.54 The increase in the bands at 1120 and 1170 cm−1 are associated with carbohydrates. These bands were highly intense in plasma from healthy donors compared with that from cancer patients. The protein spectra (region 1300–1800 cm−1) were relatively weak in the plasma from cancer patients compared with that from healthy donors. The decreased protein content in the malignant condition suggests an induced diversification of energy to meet high energy demands during the malignant stress of cell.55 A decreased protein content was also observed in the FTIR spectra of serum from patients with lung cancer compared with healthy controls.56 The bands at 2800–3000 cm−1 and 1740–1750 cm−1 were reduced, representing the depletion of lipids and fatty acids in the plasma from prostate cancer patients. This may be because of the decreased levels of triglycerides and fat in the region of malignant tissue due to the enhanced demand of energy in the development and progression of carcinoma.57 The mean Raman and FTIR spectrum analysis showed more intense bands related to proteins and lipids in the plasma from healthy controls compared with prostate cancer patients. An increase in the bands associated with nucleic acids were observed in the Raman spectra of plasma from prostate cancer patients. Conversely, a decreased vibration of nucleic acids was observed in the FTIR spectra of prostate cancer patients.
The same spectral features that discriminates the Raman spectra of plasma from healthy control and prostate cancer patients were also found to discriminate Raman spectra of plasma from different GS prostate cancer patients. Increases in nucleic acids were observed in prostate cancer of different Gleason score compared with benign prostatic hyperplasia.58 This study suggests that the increase in DNA/RNA, plasma free amino acids such as tyrosine, tryptophan and decrease in phenylalanine and β-carotene may plays a crucial role in progression from low to high GS. Similarly, the Raman spectral analysis of lymphocytes also shows an increase in lipids, phospholipids and nucleic acids and a decrease in β-carotene with an increase in GS. The FTIR spectral analysis of prostate cancer patients with different GS shows an increase in the protein bands with an increase in GS. This suggests a difference in the protein content of the cancerous tissue with progression to a more aggressive state. Differentiation based on DNA, carbohydrates and lipid content has already been proven useful in the discrimination of benign from malignant breast disease.59 An increase in these spectral features was observed as the breast cancer progressed from benign to malignant. In this study also, an increase in the same spectral features was also observed with an increase in GS. An increase in the protein (1300–1700 cm−1) and lipid (2800–2963 cm−1) regions of the spectra with an increase in GS has also been reported previously.60
The PCA analysis performed on the Raman spectra of plasma from healthy control and prostate cancer patients, as well as on the Raman spectra of plasma and lymphocytes from patients with different GS showed no discrimination between the analysed groups. However, some discrimination was observed between the spectra of lymphocytes from healthy donors and prostate cancer patients. PC1 shows positive bands associated with glycogen (484 cm−1), glycerol (630 cm−1), lipids (1436 cm−1), DNA/RNA (1608 cm−1) and amide I (1650 cm−1) and negative bands associated with proteins (618, 640, 755, 935, 1128 and 1206 cm−1), carbohydrates (1128, 1153 and 1343 cm−1), DNA/RNA (725, 785, 828, 1177, 1317, 1373, 1487 and 1510 cm−1), saccharides (854 and 898 cm−1), phenylalanine (1001 and 1104 cm−1) and amide II (1544 cm−1). PC2 shows positive bands related to proteins (618, 640, 754, 850 cm−1), DNA/RNA (722, 781, 826, 896, 1315, 1342, 1459, 1485 cm−1), phenylalanine (1001 cm−1), lipids (1126, 1260 cm−1), amide I (1673 cm−1), amide II (1260 cm−1) and saccharides (1370 cm−1) and negative bands related to cholesterol (608 cm−1), glycerol (630 cm−1), lipids and fatty acids (733, 1070 cm−1), DNA/RNA (766, 1070, 1287, 1609 cm−1), amide III (1224 cm−1), amide II (1544 cm−1) proteins (1161, 1406, 1392, 1560, 1593 cm−1).
The PCA analysis performed on the second derivative FTIR spectra of plasma from healthy donors and prostate cancer patients, as well as on the second derivative FTIR spectra of plasma from patients with different GS showed good discrimination between the analysed groups. For healthy donors versus prostate cancer patients, the PC1 shows positive bands related to fatty acids, triglycerides, cholesterol, lipids (1745, 2953, 2972, 2926, 2960 and 3011 cm−1) and negative bands related to glycogen (1040 cm−1), DNA/RNA (1088 and 1121cm−1) and proteins (1550, 1636, 1656, 3277 and 3294 cm−1). PC2 shows positive bands related to glycogen (1040 cm−1), DNA/RNA (1088 and 1121cm−1), fatty acids, triglycerides, cholesterol, lipids (1745, 2853, 2872, 2926, 2963 and 3013 cm−1), amide I (1634 cm−1) and amide A (3277, 3294 cm−1) and negative bands related to amide I (1537 cm−1) and amide II (1636 cm−1). This analysis confirms the significant discriminating features between the two groups belong to DNA/RNA, proteins and lipids. For the GS study, PC1 shows positive bands related to amide I (1636 and 1691 cm−1) and negative bands related to amide I (1656 cm−1) and fatty acids, triglycerides and lipids (1745, 2873 and 2926 cm−1). PC2 shows positive bands related to amide II (1542, 1560 cm−1), amide I (1650 cm−1) and negative bands related to glycogen (1040 cm−1), DNA/RNA (1088 and 1121cm−1), amide I (1644 cm−1), amide II (1539 cm−1) fatty acids, triglycerides and lipids (1745, 2853 and 2926 cm−1).
The PLS-DA model classified Raman spectra of plasma from healthy donors and prostate cancer patients with a sensitivity and specificity of 89.6% and 90%, respectively. The model classified plasma Raman spectra from patients with different GS with a sensitivity and specificity ranging from 67% to 80%. Similarly, the PLS-DA classified Raman spectra of lymphocytes from healthy donors and prostate cancer patients with a sensitivity and specificity of 92% and 90%, respectively, and Raman spectra of lymphocytes from patients with different GS with a sensitivity and specificity ranging from 65% to 95%. The PLS-DA model classified FTIR spectra of plasma from healthy donors and prostate cancer patients with a sensitivity and specificity of 99% and 98.4%, respectively, and FTIR spectra of plasma from patients with different GS with a sensitivity and specificity ranging from 65% to 80%.
As mentioned earlier, the CLS fitting analysis showed an increased weighting of uric acid, interleukin-6, phosphatidylethanolamine, creatinine and RNA and a decreased weighting of albumin and β-carotene in the Raman spectra of plasma from prostate cancer patients compared with the healthy donors (Figure 13). The increased weighting of RNA and decreased weighting of β-carotene in the plasma from prostate cancer patients was discussed earlier. The weighting of RNA was also increased with an increase in GS. This suggests that an increase in RNA or micro RNAs may be responsible for progression to high GS. The elevated uric acid level was observed in plasma from prostate cancer patients compared with that from healthy donors and this increased weighting was also found with an increase in GS. Sangkop et al. reported that the increase in plasma uric acid levels has an impact on prostate cancer cell growth and suggested that lowering plasma uric acid levels is likely to be therapeutically beneficial.61
The albumin weighting was found to be higher in plasma from healthy donors compared with cancer patients.62 Previous studies have found low serum albumin concentration in cancer patients and also suggested serum albumin levels as a prognostic marker for various cancers.63,64 The weighting of plasma albumin was also found to decrease with an increase in GS. Lower albumin concentration, or hypoalbuminemia, is a rather late phenomenon with cancer progression.62,65 Lower albumin levels in advanced cancer stages are associated with an inflammatory response with the release of interleukin-6, cytokines and other factors.62 An increase in interleukin-6 levels was observed in the plasma from cancer patients compared with that from healthy donors.66 In our study, interleukin-6 levels were found to increase with an increase in GS. Interleukin-6 is a pro-inflammatory cytokine that is expressed in prostate tumours and the stromal tumour micro-environment.67 Baillargeon et al. reported that increased serum and plasma interleukin-6 levels are associated with progression and poor prognosis in prostate cancer patients.68 Serum interleukin-6 was found to be significantly elevated in patients with GS > 6.69 Shariat et al. observed that preoperative interleukin-6 levels were elevated in patients with a final Gleason sum of 7 or greater.70
An increased weighting of phosphatidyl-ethanolamine (P-ethanolamine) was observed in plasma from cancer patients compared with healthy donors. A lipidomic study by Zhou et al. reported an increase in plasma phosphatidyl-ethanolamine levels in prostate cancer patients compared with healthy control subjects.71 Increased levels of plasma creatinine were found in the cancer patients compared with healthy donors. Weinstein et al. reported an increased level of pre-diagnostic serum creatinine in prostate cancer patients compared with controls.72 However, serum creatinine concentrations can also be influenced by various other factors such as age, sex, muscle mass, diet, physical activity, blood pressure, diseases such as diabetes, hypertension and heart disease.73,74
The CLS fitting analysis performed on the second derivative FTIR spectra (Figure 14) of plasma from healthy control and prostate cancer patients with different GS showed increased levels of KGF in the plasma from healthy donors compared with that from cancer patients. KGF is a stromally derived, androgen dependent epithelial mitogen that has been implicated in the regulation of cell growth and differentiation in prostate tissue. Higher concentrations of KGF have been found in the serum of patients with benign prostatic hyperplasia compared with those with prostate cancer.75 Also, the experimental data here demonstrated decreased levels of phosphatidyl-ethanolamine and increased levels of phosphatidyl-inositol and phosphatidyl-serine were observed in the plasma samples from prostate cancer patients compared with heathy donors. In addition, the weighting of plasma ubiquitin was decreased in the prostate cancer patients compared with heathy donors.
The CLS fitting analysis performed on the FTIR spectra identified more pure components compared with the Raman spectra. A decreased weighing of albumin and an increased weighing of uric acid and interleukin-6 were observed in both FTIR and Raman spectra of plasma from prostate cancer patients. An increased weighing of p-ethanolamine was observed in the Raman spectra of plasma from cancer patients, whereas decreased weighing of p-ethanolamine was observed in the FTIR spectra of plasma from cancer patients. In addition, two more phospholipids, p-serine and p-inositol, were observed with an increased weighting in the FTIR spectra of prostate cancer patients. Similarly, an increased weighing of KGF, triglyceride, interleukin-8 and decreased weighing of ubiquitin were also observed in the FTIR spectra of prostate cancer patients. These pure components were not observed in the CLS fitting analysis performed on the Raman spectra of plasma from control and cancer patients. A decreased weighing of β-carotene and increased weighing of creatine and RNA which were seen in the Raman spectral analysis was not observed in the FTIR spectral analysis. The variations in the CLS fitting analysis results of FTIR and Raman spectra may be due to the employment of different pre-processing and sample preparation methods. Second derivative FTIR spectra and underivatized Raman spectra were used in this analysis. The FTIR spectra were recorded from diluted and dried plasma samples whereas Raman spectra were recorded from liquid plasma samples. The changes in the sample preparation methods might also affect the identification of plasma components. However, further studies are required to investigate these variations due to the different sample preparation methods.
The CLS fitting analysis performed on the Raman spectra of lymphocytes (Figure 15) showed an increased weighing of actin, cholesterol, RNA, interleukin-8, linoleic acid, prostaglandin E1, PUFA and uric acid and decreased weighing of β-carotene, tumour necrosis factor alpha (TNF-α), histone (or histone 2A), glycogen and ubiquitin were observed in the lymphocyte spectra of cancer patients compared with controls. The decreased weighing of β-carotene and increased weighing of RNA and uric acid were also observed in the Raman spectra of patient plasma samples (Figure 13). Similarly, an increased weighing of interleukin-8 and a decreased weighing of ubiquitin were observed in the FTIR spectra of patient plasma samples (Figure 14). The increased actin in patient lymphocytes might be due to the accumulation of actin in the cell nucleus during cancer conditions.76 The increase in cholesterol in cancer patients might be due to diet-induced hypercholesterolemia. Moon et al. reported that diet-induced hypercholesterolemia promoted metastasis in orthotopic xenograft PC-3 cells (a prostate cancer cell line) by increasing the expression of the metastasis-associated protein IQGAP1.77 Recent studies also suggest a positive relationship between hypercholesterolemia and carcinogenesis in some cancers like breast and prostate.78 TNF-α is an inflammatory cytokine frequently found in the tumour microenvironment and a decreased weighing of TNF-α was observed in the lymphocytes of prostate cancer patients. A study by Zhao et al. reported that low concentrations of TNF-α significantly enhanced colon cancer cell migration and invasion by upregulating TROP-2 via the ERK1/2 signalling pathway.79 As mentioned earlier, a decreased weighting of histone 2A was observed in the lymphocytes of prostate cancer patients and no expression of histone 2A was observed in the lymphocytes from prostate cancer patients with GS 7 and GS 9. A study by Vieira-Silva et al. reported the downregulation of histone 2A variants in prostate cancer compared with normal prostate tissue.80 The increased weighing of linoleic acid and PUFA suggests an increase of polyunsaturated fatty acids although there is little evidence of an association of polyunsaturated fatty acids with risk of prostate cancer.81
It is acknowledged that a limitation of the present study is that only a few age matched controls were available for inclusion in the healthy donor cohort. To investigate any age-related differences, PCA was performed on the age matched healthy controls (n = 5), non-age matched healthy controls (n = 28) and prostate cancer plasma samples (n = 37). PCA showed overlapped clusters for age and non-age matched controls (Online Supplementary Figure S1). This suggests that the differences observed between the control and cancer patients are not related to age. Since PCA is a tool for data visualization and trends, CLS fitting analysis was also performed to confirm the effect of age on identification of cancer analytes. Similar differences were observed in the weighing of plasma analytes between age and non-age matched versus prostate cancer patients as reported earlier. More interestingly, significant differences were also observed between the age matched controls versus cancer patients compared with non-age matched controls versus cancer patients (Online Supplementary Figure S2). This confirms that these differences can be attributed to the development of cancer. However, this study must be validated on a larger number of age matched controls to confirm these findings.
Conclusion
In this study, HT-Raman and HT-FTIR spectroscopy of blood plasma and Raman spectroscopy of lymphocytes along with machine learning procedures were used to evaluate the spectral differences between plasma from healthy donors and prostate cancer patients as well as between prostate cancer patients with varying GS. The Raman and FTIR mean spectral analysis of blood plasma and lymphocytes exhibited consistent changes related to proteins, lipids and nucleic acids in plasma from healthy donors and prostate cancer patients with varying GS. PCA demonstrated discrimination between the Raman and FTIR spectra of plasma and lymphocytes from healthy donors and prostate cancer patients. The PLS-DA model classified Raman spectra of plasma from healthy donors and prostate cancer patients with a sensitivity and specificity of 89.6% and 90%, respectively, and Raman spectra of lymphocytes from healthy donors and prostate cancer patients with a sensitivity and specificity of 92% and 90%, respectively. Similarly, the PLS-DA model classified FTIR spectra of plasma from healthy donors and prostate cancer patients with a sensitivity and specificity of 99% and 98.4%, respectively. The model classified Raman and FTIR plasma and lymphocytes spectra from patients with varying GS with a sensitivity and specificity ranging from 65% to 95%. The CLS fitting analysis performed on the Raman and FTIR spectra of blood plasma and Raman spectra of lymphocytes from healthy donors and prostate cancer patients with different GS identified a panel of analytes that may be involved in the development and progression of prostate cancer. The current study focused on the discrimination of control and prostate cancer patients with different GS using vibrational spectroscopy of liquid biopsies. However, most patients present with low risk localised tumours and active surveillance is usually recommended whereas aggressive treatment is required for patients with intermediate and high-risk prostate cancer. Thus, further work will be required to identify patients with clinically significant prostate cancer from those with low risk disease. Previous work on FTIR spectroscopy of DNA from prostate tissues showed a cancer DNA phenotype that could be used as a biomarker for cancer progression.82
In addition, validation of this exploratory study on a larger cohort using age matched controls will be necessary to evaluate the efficacy of HT-Raman and HT-FTIR spectroscopy of liquid biopsies for prostate cancer screening. Future work should also involve biological assays showing proteins, lipids, circulating nucleic acids and other analyte levels to corroborate these findings. Biofluid based vibrational spectroscopy is reagent free, label free, cost effective, rapid and can be used to quantity multiple analytes in a single measurement83 and this study has shown that this technology may also have potential for the translation of liquid biopsy based diagnostics into the clinic.
Supplemental Material
Supplemental material, Supplementary_material for Vibrational spectroscopy of liquid biopsies for prostate cancer diagnosis by Dinesh K. R. Medipally, Daniel Cullen, Valérie Untereiner, Ganesh D. Sockalingum, Adrian Maguire, Thi Nguyet Que Nguyen, Jane Bryant, Emma Noone, Shirley Bradshaw, Marie Finn, Mary Dunne, Aoife M. Shannon, John Armstrong, Aidan D. Meade and Fiona M Lyng in Therapeutic Advances in Medical Oncology
Acknowledgments
Cancer Trials Ireland acted as sponsor for the CTRIAL-IE (ICORG) 08-17 study, providing project management, protocol development and monitoring, patient information leaflet and case report form (CRF) development, ethics application and amendments. The authors are very grateful to the patients who participated in the CT-IE 08-17 study and donated blood samples for this translational research study.
Footnotes
Conflict of interest statement: The authors declare that there is no conflict of interest.
Funding: This work was financially supported by Science Foundation Ireland (15/TIDA/2883) and EU FP7 Network of Excellence DoReMi (Grant Number 249689). DC was supported by a TU Dublin Fiosraigh Postgraduate Scholarship and DKRM was supported by an Irish Research Council Postgraduate Scholarship (Grant number PB04200). Work at Université de Reims-Champagne Ardennes was supported by an EU COST Action Short Term Scientific Mission Award (ECOST-STSM-BM1401-021115-063046) and Irish Research Council-Ulysses Award (Grant Number PJ29007). AMeade and TNQN were supported by the Health Research Board under Grant Agreement No. HRB-POR-2015-1314 at the ADAPT SFI Research Centre at TU Dublin. The ADAPT SFI Centre for Digital Media Technology is funded by Science Foundation Ireland through the SFI Research Centres Programme and is co-funded under the European Regional Development Fund (ERDF) through Grant # 13/RC/2106.
ORCID iDs: Dinesh K.R. Medipally  https://orcid.org/0000-0002-6353-1808
Aidan D Meade  https://orcid.org/0000-0003-0353-9768
Supplemental material: Supplemental material for this article is available online.
Contributor Information
Dinesh K. R. Medipally, Radiation and Environmental Science Centre, Focas Research Institute, Technological University Dublin, Dublin, Ireland School of Physics & Clinical & Optometric Sciences, Technological University Dublin, Dublin, Ireland.
Daniel Cullen, Radiation and Environmental Science Centre, Focas Research Institute, Technological University Dublin, Dublin, Ireland; School of Physics & Clinical & Optometric Sciences, Technological University Dublin, Dublin, Ireland.
Valérie Untereiner, Université de Reims Champagne−Ardenne, BioSpecT EA 7506, UFR Pharmacie, Reims, France; Université de Reims Champagne−Ardenne, PICT, Reims, France.
Ganesh D. Sockalingum, Université de Reims Champagne−Ardenne, BioSpecT EA 7506, UFR Pharmacie, Reims, France
Adrian Maguire, Radiation and Environmental Science Centre, Focas Research Institute, Technological University Dublin, Dublin, Ireland; School of Physics & Clinical & Optometric Sciences, Technological University Dublin, Dublin, Ireland.
Thi Nguyet Que Nguyen, Radiation and Environmental Science Centre, Focas Research Institute, Technological University Dublin, Dublin, Ireland; School of Physics & Clinical & Optometric Sciences, Technological University Dublin, Dublin, Ireland.
Jane Bryant, Radiation and Environmental Science Centre, Focas Research Institute, Technological University Dublin, Dublin, Ireland.
Emma Noone, Clinical Trials Unit, St Luke’s Radiation Oncology Network, St Luke’s Hospital, Dublin, Ireland.
Shirley Bradshaw, Clinical Trials Unit, St Luke’s Radiation Oncology Network, St Luke’s Hospital, Dublin, Ireland.
Marie Finn, Clinical Trials Unit, St Luke’s Radiation Oncology Network, St Luke’s Hospital, Dublin, Ireland.
Mary Dunne, Clinical Trials Unit, St Luke’s Radiation Oncology Network, St Luke’s Hospital, Dublin, Ireland.
Aoife M. Shannon, Cancer Trials Ireland, Dublin, Ireland
John Armstrong, Cancer Trials Ireland, Dublin, Ireland; Department of Radiation Oncology, St Luke’s Radiation Oncology Network, St Luke’s Hospital, Dublin, Ireland.
Aidan D. Meade, School of Physics & Clinical & Optometric Sciences, Technological University Dublin, Kevin Street, Dublin, Dublin D08 NF82, Ireland; Radiation and Environmental Science Centre, Focas Research Institute, Technological University Dublin, Dublin, Ireland.
Fiona M Lyng, Radiation and Environmental Science Centre, Focas Research Institute, Technological University Dublin, Dublin, Dublin D08 NF82, Ireland; School of Physics & Clinical & Optometric Sciences, Technological University Dublin, Dublin, Ireland.
References
- 1. Ferlay J, Colombet M, Soerjomataram I, et al. Estimating the global cancer incidence and mortality in 2018: GLOBOCAN sources and methods. Int J Cancer 2019; 144: 1941–1953. [DOI] [PubMed] [Google Scholar]
- 2. Aus G, Abbou CC, Bolla M, et al. EAU guidelines on prostate cancer. Eur Urol 2005; 48: 546–551. [DOI] [PubMed] [Google Scholar]
- 3. Bray F, Ferlay J, Soerjomataram I, et al. Global cancer statistics 2018: GLOBOCAN estimates of incidence and mortality worldwide for 36 cancers in 185 countries. CA Cancer J Clin 2018; 68: 394–424. [DOI] [PubMed] [Google Scholar]
- 4. Thompson IM, Ankerst DP, Chi C, et al. Operating characteristics of prostate-specific antigen in men with an initial PSA level of 3.0 ng/ml or lower. JAMA 2005; 294: 66–70. [DOI] [PubMed] [Google Scholar]
- 5. Punnen S, Pavan N, Parekh DJ. Finding the wolf in sheep’s clothing: the 4Kscore is a novel blood test that can accurately identify the risk of aggressive prostate cancer. Rev Urol 2015; 17: 3–13. [PMC free article] [PubMed] [Google Scholar]
- 6. Loeb S, Catalona WJ. The prostate health index: a new test for the detection of prostate cancer. Ther Adv Urol 2014; 6: 74–77. [DOI] [PMC free article] [PubMed] [Google Scholar]
- 7. US Preventive Services Task Force, Grossman DC, Curry SJ,et al. Screening for prostate cancer: US preventive services task force recommendation statement. JAMA 2018; 319: 1901–1913. [DOI] [PubMed] [Google Scholar]
- 8. Albin RJ, Haythorn MR. Screening for prostate cancer: controversy? What controversy? Curr Oncol 2009; 16:1–2. [DOI] [PMC free article] [PubMed] [Google Scholar]
- 9. Neuhaus J, Yang B. Liquid biopsy potential biomarkers in prostate cancer. Diagnostics (Basel) 2018; 8: 68. [DOI] [PMC free article] [PubMed] [Google Scholar]
- 10. Perakis S, Speicher MR. Emerging concepts in liquid biopsies. BMC Med 2017; 15: 75. [DOI] [PMC free article] [PubMed] [Google Scholar]
- 11. Kong K, Kendall C, Stone N, et al. Raman spectroscopy for medical diagnostics - from in-vitro biofluid assays to in-vivo cancer detection. Adv Drug Deliv Rev 2015; 89: 121–134. [DOI] [PubMed] [Google Scholar]
- 12. Delves PJ, Martin SJ, Burton DR, et al. Roitt’s essential immunology, 12th ed., Chichester: Wiley-Blackwell, 2011, pp. 4–5. [Google Scholar]
- 13. Verhoeckx K, Cotter P, López-Expósito I, et al. The impact of food bioactives on health: in vitro and ex vivo models. Switzerland: Springer, 2015, pp. 293–304. [PubMed] [Google Scholar]
- 14. Rapisuwon S, Vietsch EE, Wellstein A. Circulating biomarkers to monitor cancer progression and treatment. Comput Struct Biotechnol J 2016; 14: 211–222. [DOI] [PMC free article] [PubMed] [Google Scholar]
- 15. Bettegowda C, Sausen M, Leary RJ, et al. Detection of circulating tumor DNA in early- and late-stage human malignancies. Sci Transl Med 2014; 6: 224ra24. [DOI] [PMC free article] [PubMed] [Google Scholar]
- 16. Diehl F, Li M, Dressman D, et al. Detection and quantification of mutations in the plasma of patients with colorectal tumors. Proc Natl Acad Sci 2005; 102: 16368–16373. [DOI] [PMC free article] [PubMed] [Google Scholar]
- 17. Miyamoto DT, Zheng Y, Wittner BS, et al. RNA-Seq of single prostate CTCs implicates noncanonical Wnt signaling in antiandrogen resistance. Science 2015; 349: 1351–1356. [DOI] [PMC free article] [PubMed] [Google Scholar]
- 18. Yu M, Bardia A, Wittner BS, et al. Circulating breast tumor cells exhibit dynamic changes in epithelial and mesenchymal composition. Science 2013; 339: 580–584. [DOI] [PMC free article] [PubMed] [Google Scholar]
- 19. Balaj L, Lessard R, Dai L, et al. Tumour microvesicles contain retrotransposon elements and amplified oncogene sequences. Nat Commun 2011; 2: 180. [DOI] [PMC free article] [PubMed] [Google Scholar]
- 20. Kahlert C, Melo SA, Protopopov A, et al. Identification of doublestranded genomic dna spanning all chromosomes with mutated KRAS and P53 DNA in the serum exosomes of patients with pancreatic cancer. J Biol Chem 2014; 289: 3869–3875. [DOI] [PMC free article] [PubMed] [Google Scholar]
- 21. Keller MD, Kanter EM, Mahadevan-jansen A. Raman spectroscopy for cancer diagnosis. Spectroscopy 2006; 21: 33–41. [Google Scholar]
- 22. Harris AT, Lungari A, Needham CJ, et al. Potential for Raman spectroscopy to provide cancer screening using a peripheral blood sample. Head Neck Oncol 2009; 1: 34. [DOI] [PMC free article] [PubMed] [Google Scholar]
- 23. Sahu A, Sawant S, Mamgain H, et al. Raman spectroscopy of serum: an exploratory study for detection of oral cancers. Analyst 2013; 138: 4161–4174. [DOI] [PubMed] [Google Scholar]
- 24. Pichardo-Molina JL, Frausto Reyes C, Barbosa Garcia O, et al. Raman spectroscopy and multivariate analysis of serum samples from breast cancer patients. Lasers Med Sci 2007; 22: 229–236. [DOI] [PubMed] [Google Scholar]
- 25. González-Solís JL, Martínez-Espinosa JC, Torres-González LA, et al. Cervical cancer detection based on serum sample Raman spectroscopy. Lasers Med Sci 2014; 29: 979–985. [DOI] [PubMed] [Google Scholar]
- 26. Chen N, Rong M, Shao X, et al. Surface-enhanced Raman spectroscopy of serum accurately detects prostate cancer in patients with prostate-specific antigen levels of 4–10 ng/mL. Int J Nanomedicine 2017; 12: 5399–5407. [DOI] [PMC free article] [PubMed] [Google Scholar]
- 27. Alicikus ZA, Yamada Y, Zhang Z, et al. Ten-year outcomes of high-dose, intensity-modulated radiotherapy for localized prostate cancer. Cancer 2011; 117: 1429–1437. [DOI] [PubMed] [Google Scholar]
- 28. Medipally DKR, Nguyen TNQ, Bryant J, et al. Monitoring radiotherapeutic response in prostate cancer patients using high throughput FTIR spectroscopy of liquid biopsies. Cancers (Basel) 2019; 11: pii: E925. [DOI] [PMC free article] [PubMed] [Google Scholar]
- 29. Maguire A, Vegacarrascal I, White L, et al. Analyses of ionizing radiation effects in vitro in peripheral blood lymphocytes with Raman spectroscopy. Radiat Res 2015; 183: 407–416. [DOI] [PubMed] [Google Scholar]
- 30. Helm D, Labischinski H, Naumann D. Elaboration of a procedure for identification of bacteria using Fourier-Transform IR spectral libraries: a stepwise correlation approach. J Microbiol Methods 1991; 14: 127–142. [Google Scholar]
- 31. Lacombe C, Untereiner V, Gobinet C, et al. Rapid screening of classic galactosemia patients: a proof-of-concept study using high-throughput FTIR analysis of plasma. Analyst 2015; 140: 2280–2286. [DOI] [PubMed] [Google Scholar]
- 32. Medipally DKR, Maguire A, Bryant J, et al. Development of a high throughput (HT) Raman spectroscopy method for rapid screening of liquid blood plasma from prostate cancer patients. Analyst 2017; 142: 1216–1226. [DOI] [PubMed] [Google Scholar]
- 33. Bruker. OPUS 5 reference manual. Ettlingen, Germany; Bruker OPTIK GmbH, 2004. [Google Scholar]
- 34. Savitzky A, Golay MJE. Smoothing and differentiation of data by simplified least squares procedures. Anal Chem 1964; 36: 1627–1639. [Google Scholar]
- 35. Meade AD, Maguire A, Bryant J, et al. Prediction of DNA damage and G2 chromosomal radio-sensitivity ex vivo in peripheral blood mononuclear cells with label-free Raman micro-spectroscopy. Int J Radiat Biol 2018; 95: 44–53. [DOI] [PubMed] [Google Scholar]
- 36. Choquette SJ, Etz ES, Hurst WS, et al. Relative intensity correction of Raman spectrometers: NIST SRMs 2241 through 2243 for 785 nm, 532 nm, and 488 nm/514.5 nm excitation. Appl Spectrosc 2007; 61: 117–129. [DOI] [PubMed] [Google Scholar]
- 37. National Institute of Standards and Technology (NIST). New and Renewal NIST SRMs/RMs. (2012). [Google Scholar]
- 38. Wold S, Sjöström M, Eriksson L. PLS-regression: a basic tool of chemometrics. Chemometr Intell Lab Syst 2001; 58: 109–130. [Google Scholar]
- 39. Brereton RG, Lloyd GR. Partial least squares discriminant analysis: taking the magic away. J Chemom 2014; 28: 213–225. [Google Scholar]
- 40. Gromski PS, Muhamadali H, Ellis DI, et al. A tutorial review: metabolomics and partial least squares-discriminant analysis - a marriage of convenience or a shotgun wedding. Analytica Chimica Acta 2015; 879: 10–23. [DOI] [PubMed] [Google Scholar]
- 41. Notingher I, Jell G, Notingher PL, et al. Raman spectroscopy: potential tool for in situ characterization of bone cell differentiation. Key Eng Mater 2005; 284–286: 545–548. [Google Scholar]
- 42. Medipally DKR, Cullen D, Untereiner V, et al. Effect of hemolysis on Fourier transform infrared and Raman spectra of blood plasma. J. Biophotonics. 2020; e201960173. doi:10.1002/jbio.201960173 [DOI] [PubMed] [Google Scholar]
- 43. Wu Y, Dong Y, Jiang J, et al. Evaluation of the bone-ligament and tendon insertions based on Raman spectrum and its PCA and CLS analysis. Sci Rep 2017; 7: 38706. [DOI] [PMC free article] [PubMed] [Google Scholar]
- 44. Stanimirovic O, Boelens HF, Mank AJ, et al. Profiling of liquid crystal displays with Raman spectroscopy: preprocessing of spectra. Appl Spectrosc 2005; 59: 267–274. [DOI] [PubMed] [Google Scholar]
- 45. Talari ACS, Movasaghi Z, Rehman S, et al. Raman spectroscopy of biological tissues. Appl Spectrosc Rev 2015; 50: 46–111. [Google Scholar]
- 46. Seaton A, Scullin P, Maxwell PJ, W, et al. Interleukin-8 signaling promotes androgen-independent proliferation of prostate cancer cells via induction of androgen receptor expression and activation. Carcinogenesis 2008; 29: 1148–1156. [DOI] [PubMed] [Google Scholar]
- 47. Schwarzenbach H, Hoon DS, Pantel K. Cell-free nucleic acids as biomarkers in cancer patients. Nat Rev Cancer 2011; 11: 426–437. [DOI] [PubMed] [Google Scholar]
- 48. Gormally E, Hainaut P, Caboux E, et al. Amount of DNA in plasma and cancer risk: a prospective study. Int J Cancer 2004; 111: 746–749. [DOI] [PubMed] [Google Scholar]
- 49. Duscharla D, Bhumireddy SR, Lakshetti S, et al. Prostate cancer associated lipid signatures in serum studied by ESI-tandem mass spectrometryas potential new biomarkers. PLoS One 2016; 11: e0150253. [DOI] [PMC free article] [PubMed] [Google Scholar]
- 50. Patel N, Vogel R, Chandra-Kuntal K, et al. A novel three serum phospholipid panel differentiates normal individuals from those with prostate cancer. PLoS One 2014; 9: e88841. [DOI] [PMC free article] [PubMed] [Google Scholar]
- 51. Abramczyk H, Brozek-Pluska B. New look inside human breast ducts with Raman imaging. Raman candidates as diagnostic markers for breast cancer prognosis: mammaglobin, palmitic acid and sphingomyelin. Anal Chim Acta 2016; 909: 91–100. [DOI] [PubMed] [Google Scholar]
- 52. Abramczyk H, Brozek-Pluska B. Raman imaging in biochemical and biomedical applications. Diagnosis and treatment of breast cancer. Chem Rev 2013; 113: 5766–5781. [DOI] [PubMed] [Google Scholar]
- 53. Banyay M, Sarkar M, Gräslund A. A library of IR bands of nucleic acids in solution. Biophys Chem 2003; 104: 477–488. [DOI] [PubMed] [Google Scholar]
- 54. Wong PT, Wong RK, Caputo TA, et al. Infrared spectroscopy of exfoliated human cervical cells: evidence of extensive structural changes during carcinogenesis. Proc Natl Acad Sci U S A 1991; 88: 10988–10992. [DOI] [PMC free article] [PubMed] [Google Scholar]
- 55. Cazares LH, Adam BL, Ward MD, et al. Normal, benign, preneoplastic, and malignant prostate cells have distinct protein expression profiles resolved by surface enhanced laser desorption/ionization mass spectrometry. Clin Cancer Res 2002; 8: 2541–2552. [PubMed] [Google Scholar]
- 56. Wang Q, Gao P, Cheng F, et al. Measurement of salivary metabolite biomarkers for early monitoring of oral cancer with ultra performance liquid chromatography-mass spectrometry. Talanta 2014; 119: 299–305. [DOI] [PubMed] [Google Scholar]
- 57. Li QB, Xu Z, Zhang NW, et al. In vivo and in situ detection of colorectal cancer using Fourier transform infrared spectroscopy. World J Gastroenterol 2005; 11: 327–330. [DOI] [PMC free article] [PubMed] [Google Scholar]
- 58. Crow P, Stone N, Kendall CA, et al. The use of Raman spectroscopy to identify and grade prostatic adenocarcinoma in vitro. Br J Cancer 2003; 89: 106–108. [DOI] [PMC free article] [PubMed] [Google Scholar]
- 59. Fabian H, Thi NA, Eiden M, et al. Diagnosing benign and malignant lesions in breast tissue sections by using IR-microspectroscopy. Biochim Biophys Acta 2006; 1758: 874–882. [DOI] [PubMed] [Google Scholar]
- 60. Baker MJ, Gazi E, Brown MD, et al. FTIR-based spectroscopic analysis in the identification of clinically aggressive prostate cancer. Br J Cancer 2008; 99: 1859–1866. [DOI] [PMC free article] [PubMed] [Google Scholar]
- 61. Sangkop F, Singh G, Rodrigues E, et al. Uric acid: a modulator of prostate cells and activin sensitivity. Mol Cell Biochem 2016; 414: 187–199. [DOI] [PubMed] [Google Scholar]
- 62. Wajsman Z. Prostate cancer recurrence – new prognostic factors are needed. Cent Eur J Urol 2013; 66: 133–134. [DOI] [PMC free article] [PubMed] [Google Scholar]
- 63. Gupta D, Lis CG. Pretreatment serum albumin as a predictor of cancer survival: a systematic review of the epidemiological literature. Nutr J 2010; 9: 69. [DOI] [PMC free article] [PubMed] [Google Scholar]
- 64. Konigsbrugge O, Posch F, Riedl J, et al. Association between decreased serum albumin with risk of venous thromboembolism and mortality in cancer patients. Oncologist 2016; 21: 252–257. [DOI] [PMC free article] [PubMed] [Google Scholar]
- 65. Seve P, Ray-Coquard I, Trillet-Lenoir V, et al. Low serum albumin levels and liver metastasis are powerful prognostic markers for survival in patients with carcinomas of unknown primary site. Cancer 2006; 107: 2698–2705. [DOI] [PubMed] [Google Scholar]
- 66. Azevedo A, Cunha V, Teixeira AL, et al. IL-6/IL-6R as a potential key signaling pathway in prostate cancer development. World J Clin Oncol 2011; 2: 384–396. [DOI] [PMC free article] [PubMed] [Google Scholar]
- 67. Culig Z, Puhr M. Interleukin-6 and prostate cancer: current developments and unsolved questions. Mol Cell Endocrinol 2018; 462: 25–30. [DOI] [PubMed] [Google Scholar]
- 68. Baillargeon J, Platz EA, Rose DP, et al. Obesity, adipokines, and prostate cancer in a prospective population-based study. Cancer Epidemiol Biomarkers Prev 2006; 15: 1331–1335. [DOI] [PubMed] [Google Scholar]
- 69. Michalaki V, Syrigos K, Charles P, et al. Serum levels of IL-6 and TNF-α correlate with clinicopathological features and patient survival in patients with prostate cancer. Br J Cancer 2004; 90: 2312–2316. [DOI] [PMC free article] [PubMed] [Google Scholar]
- 70. Shariat SF, Andrews B, Kattan MW, et al. Plasma levels of interleukin-6 and its soluble receptor are associated with prostate cancer progression and metastasis. Urology 2001; 58: 1008–1015. [DOI] [PubMed] [Google Scholar]
- 71. Zhou X, Mao J, Ai J, et al. Identification of plasma lipid biomarkers for prostate cancer by lipidomics and bioinformatics. PLoS One 2012; 7: e48889. [DOI] [PMC free article] [PubMed] [Google Scholar]
- 72. Weinstein SJ, Mackrain K, Stolzenberg-Solomon RZ, et al. Serum creatinine and prostate cancer risk in a prospective study. Cancer Epidemiol Biomarkers Prev 2009; 18: 2643–2649. [DOI] [PMC free article] [PubMed] [Google Scholar]
- 73. Levey A. Serum creatinine and renal function. Annu Rev Med 1988; 39: 465–490. [DOI] [PubMed] [Google Scholar]
- 74. Baxmann AC, Ahmed MS, Marques NC, et al. Influence of muscle mass and physical activity on serum and urinary creatinine and serum cystatin C. Clin J Am Soc Nephrol 2008; 3: 348–354. [DOI] [PMC free article] [PubMed] [Google Scholar]
- 75. Mehta PB, Robson CN, Neal DE, et al. Serum keratinocyte growth factor measurement in patients with prostate cancer. J Urol 2000; 164: 2151–2155. [PubMed] [Google Scholar]
- 76. Izdebska M, Zielińska W, Grzanka D, et al. The role of actin dynamics and actin-binding proteins expression in epithelial-to-mesenchymal transition and its association with cancer progression and evaluation of possible therapeutic targets. Biomed Res Int 2018; 2018: 4578373. [DOI] [PMC free article] [PubMed] [Google Scholar]
- 77. Moon H, Ruelcke JE, Choi E, et al. Diet-induced hypercholesterolemia promotes androgen-independent prostate cancer metastasis via IQGAP1 and caveolin-1. Oncotarget 2015; 6: 7438–7453. [DOI] [PMC free article] [PubMed] [Google Scholar]
- 78. Ding X, Zhang W, Li S, et al. The role of cholesterol metabolism in cancer. Am J Cancer Res 2019; 9: 219–227. [PMC free article] [PubMed] [Google Scholar]
- 79. Zhao P, Zhang Z. TNF-α promotes colon cancer cell migration and invasion by upregulating TROP-2. Oncol Lett 2018; 15: 3820–3827. [DOI] [PMC free article] [PubMed] [Google Scholar]
- 80. Vieira-Silva TS, Monteiro-Reis S, Barros-Silva D, et al. Histone variant MacroH2A1 is downregulated in prostate cancer and influences malignant cell phenotype. Cancer Cell Int 2019; 19: 112. [DOI] [PMC free article] [PubMed] [Google Scholar]
- 81. Astorg P. Dietary n - 6 and n - 3 polyunsaturated fatty acids and prostate cancer risk: a review of epidemiological and experimental evidence. Cancer Causes Control 2004; 15: 367–386. [DOI] [PubMed] [Google Scholar]
- 82. Malins DC, Polissar NL, Gunselman SJ. Models of DNA structure achieve almost perfect discrimination between normal prostate, benign prostatic hyperplasia (BPH), and adenocarcinoma and have a high potential for predicting BPH and prostate cancer. Proc Natl Acad Sci U S A 1997; 94: 259–264. [DOI] [PMC free article] [PubMed] [Google Scholar]
- 83. Jessen TE, Höskuldsson AT, Bjerrum PJ, et al. Simultaneous determination of glucose, triglycerides, urea, cholesterol, albumin and total protein in human plasma by Fourier transform infrared spectroscopy: direct clinical biochemistry without reagents. Clin Biochem 2014; 47: 1306–1312. [DOI] [PubMed] [Google Scholar]
Associated Data
This section collects any data citations, data availability statements, or supplementary materials included in this article.
Supplementary Materials
Supplemental material, Supplementary_material for Vibrational spectroscopy of liquid biopsies for prostate cancer diagnosis by Dinesh K. R. Medipally, Daniel Cullen, Valérie Untereiner, Ganesh D. Sockalingum, Adrian Maguire, Thi Nguyet Que Nguyen, Jane Bryant, Emma Noone, Shirley Bradshaw, Marie Finn, Mary Dunne, Aoife M. Shannon, John Armstrong, Aidan D. Meade and Fiona M Lyng in Therapeutic Advances in Medical Oncology


