

Graphical Abstarct
Summary
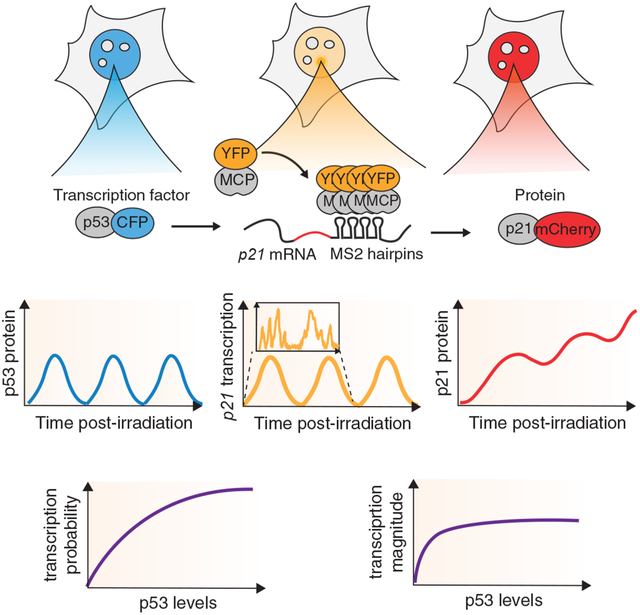
Transcription factors (TFs) integrate signals to regulate target gene expression, but we generally lack a quantitative understanding of how changes in TF levels regulate mRNA and protein production. Here, we established a system to simultaneously monitor the levels of p53, a TF that shows oscillations following DNA damage, and the transcription and protein levels of its target p21 in individual cells. p21 transcription tracked p53 dynamics, while p21 protein steadily accumulated. p21 transcriptional activation showed bursts of mRNA production, with p53 levels regulating the probability but not magnitude of activation. Variations in p53 levels between cells contributed to heterogeneous p21 transcription while independent p21 alleles exhibited highly correlated behaviors. Pharmacologically elevating p53 increased the probability of p21 transcription with minor effects on its magnitude, leading to a strong increase in p21 protein levels. Our results reveal quantitative mechanisms by which TF dynamics can regulate protein levels of its targets. A record of this paper’s Transparent Peer Review process is included in the Supplemental Information.
eTOC Blurb
Hafner, Reyes, et al. developed a system to quantify the oscillatory dynamics of the transcription factor p53, together with transcription and protein levels of its downstream target p21 in live single cells. They leveraged heterogeneity in p53 levels to determine the input-output relationships linking p53 and p21. Their analysis revealed that transcription probability scales with p53 levels, whereas transcription magnitude saturates at low p53 levels. This relationship serves to limit p21 protein accumulation in response to DNA damage-induced p53 oscillations.
Introduction
The Central Dogma, first proposed in 1958 (Crick 1958), describes the fundamental relationships of information that flows between DNA, RNA, and protein. It has proven to be true across all life forms, but turned to be more complex than originally proposed. Specifically, each step is subject to a plethora of regulatory events, complicating the quantitative relationships and correlation between them. For example, mRNA and protein levels often show a relatively poor correlation in a given dataset (de Sousa Abreu et al. 2009; Taniguchi et al. 2010; Csardi et al. 2015). For large scale datasets, it has been shown that this correlation for steady state levels can be improved by a statistical model that accounts for colinear variation of both entities (Csardi et al. 2015). However, in dynamic systems, such as development or stress response, post-transcriptional and post-translational regulation need to be accounted for in order for mRNA levels to be predictive of protein abundance (Peshkin et al. 2015; Hafner et al. 2017). Quantitative understanding of the relationship between the levels of transcription factor (‘input’) and the transcription and translation of its target gene (‘output’) requires quantifying a range of concentrations for the input and the resulting output species. In vitro assays, such as measuring transcription from purified templates (Tyree et al. 1993; Wang and Kudlow 1999; Espinosa and Emerson 2001; Ishibashi et al. 2014), provide accurate measurements but do not recapitulate the intracellular environment or concentrations of factors experienced by living cells. Bulk measurements of RNA or protein levels provide population averages, but obscure cell-to-cell variations, limiting mechanistic interpretations. Simultaneous detection of TF levels by immunofluorescence together with RNA levels by fluorescent in-situ hybridization has enabled characterization of the input-output functions at the single cell level in a few systems (Tkačik, Callan, and Bialek 2008). However, imaging of fixed cells provides a snapshot and does not allow for following the same cell over time. Live cell imaging followed by single cell RNA sequencing has been used to understand how temporal dynamics of the TF affect the downstream transcription and cell fate (Lane et al. 2017), but this approach does not account for time delays between the changing TF protein levels and transcription. Live cell imaging of transcriptional dynamics, both in vivo and ex vivo, has revealed insights into multiple aspects of transcriptional regulation such as inheritance of transcriptional memory (Ferraro et al. 2016; Dufourt et al. 2018), transcription induction in response to stimuli (Park et al. 2014; Fritzsch et al. 2018; Wilson et al. 2017), and the stochastic nature of promoter activation (Bothma et al. 2018; Sepúlveda et al. 2016). These studies prompted us to use live cell imaging to study how changes in the dynamics of TF levels quantitatively influence downstream gene expression.
The complex dynamics of the tumor-suppressor transcription factor p53 make it an attractive model for studying the input-output relationship between its levels and the expression of its target genes. In response to irradiation (IR), which induces DNA double strand breaks, p53 is activated in the form of periodic pulses with a period of ~5.5h (Lahav et al. 2004). Therefore, each cell exhibits different levels of p53 over time, thus providing natural conditions to measure target gene transcription and protein levels over a range of TF levels in a cell. The relationships between p53 dynamics and the dynamics of its target genes’ mRNA levels have been examined by us and others at the population level (Hafner et al. 2017; Porter, Fisher, and Batchelor 2016) and in fixed cells (Friedrich et al. 2019). Such approaches do not allow examining the extent to which variation in p53 signaling translates into heterogeneity in target gene expression in individual cells over time. Here we have established a system of fluorescent reporters to monitor, in live cells, p53 levels and the transcription and protein levels of its well-characterized target gene and critical cell cycle regulator, p21. Our experimental system enables tracking the dynamics of p53 protein, p21 transcription and p21 protein over long time scales, as well as analyzing short-term fluctuations in these species. Our study introduces a system to study the information flow from input transcription factor levels, to transcription and protein levels of a downstream target gene, revealing dynamical processes that shape the input-output relationships between p53 levels and downstream gene expression that are lost in studies that average the behavior in a population of cells or look at a few snapshots.
Results
Fixed snapshots reveal weak correlations between transcription factor and target gene RNA and protein levels in the p53 pathway
We first investigated the correlations between p53 protein levels and the transcription and protein levels of its canonical target p21 by quantifying these entities in fixed cells after irradiation. We introduced a p53-CFP transgene to monitor p53 levels, and tagged one copy of p21 with mCherry at its endogenous locus to monitor its protein levels (Fig. 1A, S1A). p53 levels and oscillations were equivalent at a range of radiation doses (Fig. S2) (Lahav et al. 2004), allowing us to focus on p53 levels and dynamics, rather than on the extent of DNA damage, as the input to the network. p21 transcription was quantified by fluorescence in situ hybridization (FISH) (Fig. 1A). The levels of p21 were determined by fluorescent labeling as was described (Stewart-Ornstein and Lahav 2016; Reyes et al. 2018) (Fig. S1). To avoid the confounding effect of the active p21 protein degradation program present during S-phase (Stewart-Ornstein and Lahav 2016), cells with low p21 protein levels were excluded from the protein analyses. Cells were treated with IR to generate DNA damage in order to induce p53 and expression of its downstream targets. To investigate how p53 levels correspond with p21 transcription, we measured the average p53 signal and the intensity of the brightest p21 FISH focus in the nucleus, which represents nascent transcription (Yang et al. 2017).
Figure 1. Quantifying the central dogma in live individual cells.
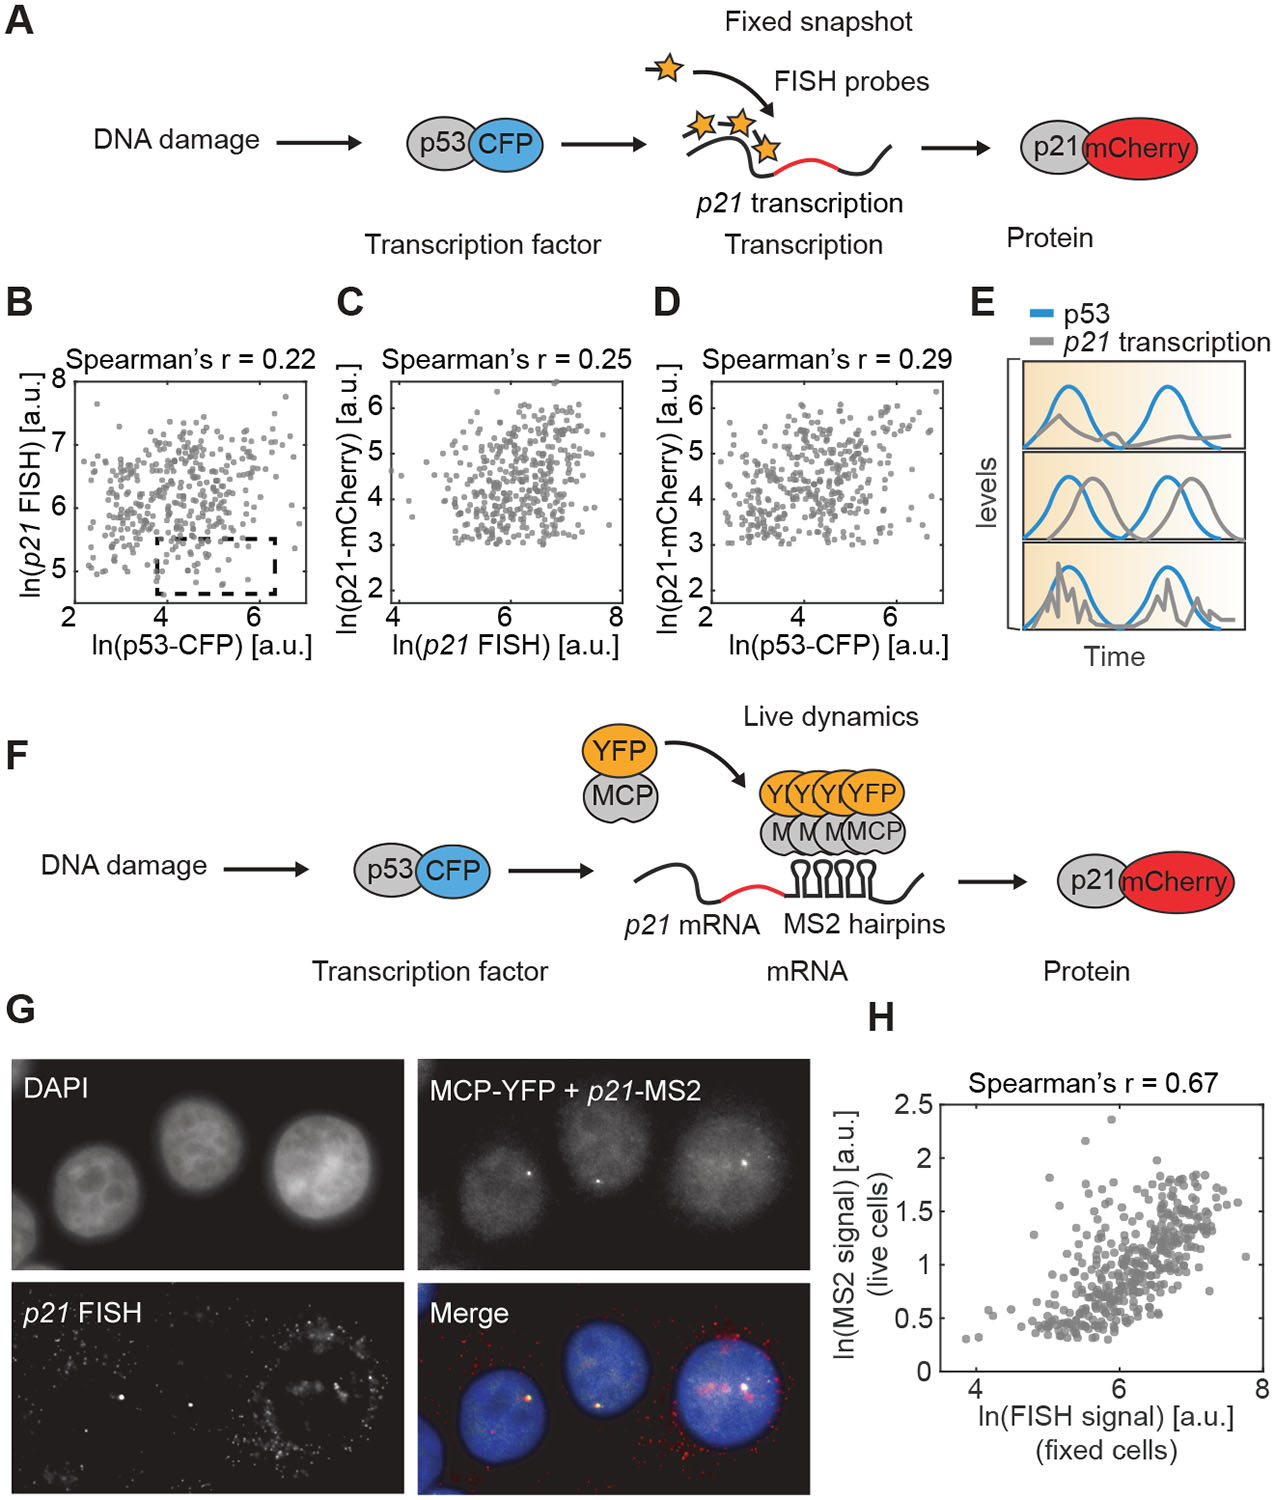
(A) Experimental approaches using fixed cells provide access to single snapshots of the relationships between transcription factors, mRNA and proteins. (B-D) Cells received IR. p53 and p21 reporter protein levels were imaged in live cells 8h post-IR, fixed immediately afterwards and probed for p21 transcription using FISH. Scatter plots show p53 protein levels and p21 transcription (B), p21 transcription and p21 protein levels (C) and p53 and p21 protein levels (D) (n > 200 cells). Dashed box highlights cells with high p53 levels but low p21 transcription. Cells that lacked evidence of p21 protein induction were excluded from the analysis (STAR Methods). (E) Distinct models can explain low correlations between molecular species at fixed timepoints. (F) Schematic of experimental system to track live p21 transcription dynamics. Endogenous tagging of the p21 locus allows quantification of p21 mRNA production and p21 protein. MS2 repeats in p21 3’ UTR fold into hairpins that are recognized by the constitutively expressed MCP-YFP. (G) Comparison of MCP-YFP foci (p21-MS2 signal) and p21 FISH. Bright foci in nuclei correspond to sites of nascent transcription. p21 transcription was induced by treating with the MDM2 inhibitor nutlin-3a and images were obtained after 2.5h. (H) Comparison of signal intensity of p21-MS2 signal in live-cells and p21 FISH in fixed cells 8h after irradiation, when cells exhibit substantial heterogeneity in p53 levels. Cells that lacked evidence of p21 protein induction were excluded from the analysis (STAR Methods). See also Figures S1 and S2.
Pairwise comparisons between p53 protein, p21 transcription, and p21 protein showed positive but weak correlations (Fig. 1B–D). The poor correlations could result from extensive transcriptional and post-transcriptional regulation of p21 (Jung et al. 2010) such that p53 levels play a minor role in governing p21 amounts (Fig. 1E, top panel). We noted that a population of cells showed low p21 mRNA even at high p53 levels (Fig. 1B, dashed box), which could arise from a failure of p53 to activate its transcriptional program in some cells, or from complex dynamical relationships between p53 levels and the activation of p21. Alternatively, there may be stronger correlations that are offset by a time delay (Fig. 1E, middle panel) or that occur over long time-scales, which may be missed by analyzing each cell at a single time-point (Fig. 1E, bottom panel). The multiple plausible explanations for the low correlations between p53, and p21 transcription and protein prompted us to establish a system to track their dynamics in living individual cells.
Establishment of a live-cell reporter system to track TF, target gene transcription, and target protein levels
To account for a possible temporal component in the relationship between the various entities in the central dogma - TF, RNA, and protein - we tracked their levels live in single cells over time. p53 and p21 protein levels were monitored via their respective fluorescent protein tags. To monitor p21 transcription, this cell line also included 24 MS2 stem-loops in the 3’ UTR of the mCherry-tagged p21 allele. Upon co-expression of transgenic MS2 coat protein (MCP) fused to YFP, which is ubiquitously expressed in the same cells, each stem-loop may be bound by an MCP dimer, resulting in fluorescent tagging of the nascent mRNAs at their transcription site (Fig. 1F) (Ben-Ari et al. 2010). To determine whether MS2 tagging accurately reported on the site and magnitude of p21 transcription, we verified that MS2 foci were marked by p21 FISH foci (Fig. 1G) and that the intensities of the two signals were correlated (Fig. 1H). In addition, we verified that both the tagged and untagged p21 alleles showed similar mRNA and protein expression in response to IR (Fig. S1C–D), indicating that the tags did not affect p21 regulation.
Having validated the live cell reporters for p53 protein, p21 mRNA and protein, we tracked these species in single cells following ionizing radiation (Movie S1). As reported previously, p53-CFP levels oscillated with a period of 5.5 hours (Lahav et al. 2004; Geva-Zatorsky et al. 2006). The intensities of p21-MS2 foci also oscillated in correspondence (Fig. 2A–B). To determine the impact of cell cycle phase on these dynamics we tracked p21-MS2 foci in a cell line containing a CFP-hGeminin(1–100) reporter (Fig. 3A–C). We found that oscillations in p21 transcription were independent of the cell cycle phase at the time of irradiation (Fig. 3D–G). The relationship between p21 transcription and p21 protein levels was more complex. Cells in, or transitioning into, S phase showed minimal p21 protein due to its rapid degradation (Stewart-Ornstein and Lahav 2016) (Fig. 3E, F, H). Cells in G1 and G2 showed a continuous increase in p21 protein levels during the course of the experiment in a stepwise manner, with protein levels remaining constant when p53 was low, and increasing at peaks of p53 expression (Fig. 2A–B, Fig. 3D, G, H). This behavior could result if the p21 protein half-life is greater than the duration of a p53 pulse and the p21 mRNA half-life is much shorter, leading to accumulation of p21 protein levels over time (temporal integration). Plotting the p21 protein derivative for the cells that accumulated p21, revealed oscillating rates of p21 protein accumulation reflecting both protein production and degradation. The oscillations in p21 transcription and p21 protein derivative both displayed a period of 5.5 hours (Fig. 2C), suggesting that p53 plays a dominant role in regulating p21 RNA and protein dynamics. Overall, live imaging of our three-reporter cell-line revealed that p53 pulses are transmitted into pulsatile transcriptional activation and protein derivative of p21, and this tracking is stable over long time periods (24h).
Figure 2. Pulsatile p53 dynamics are translated into pulsatile transcription and protein production.
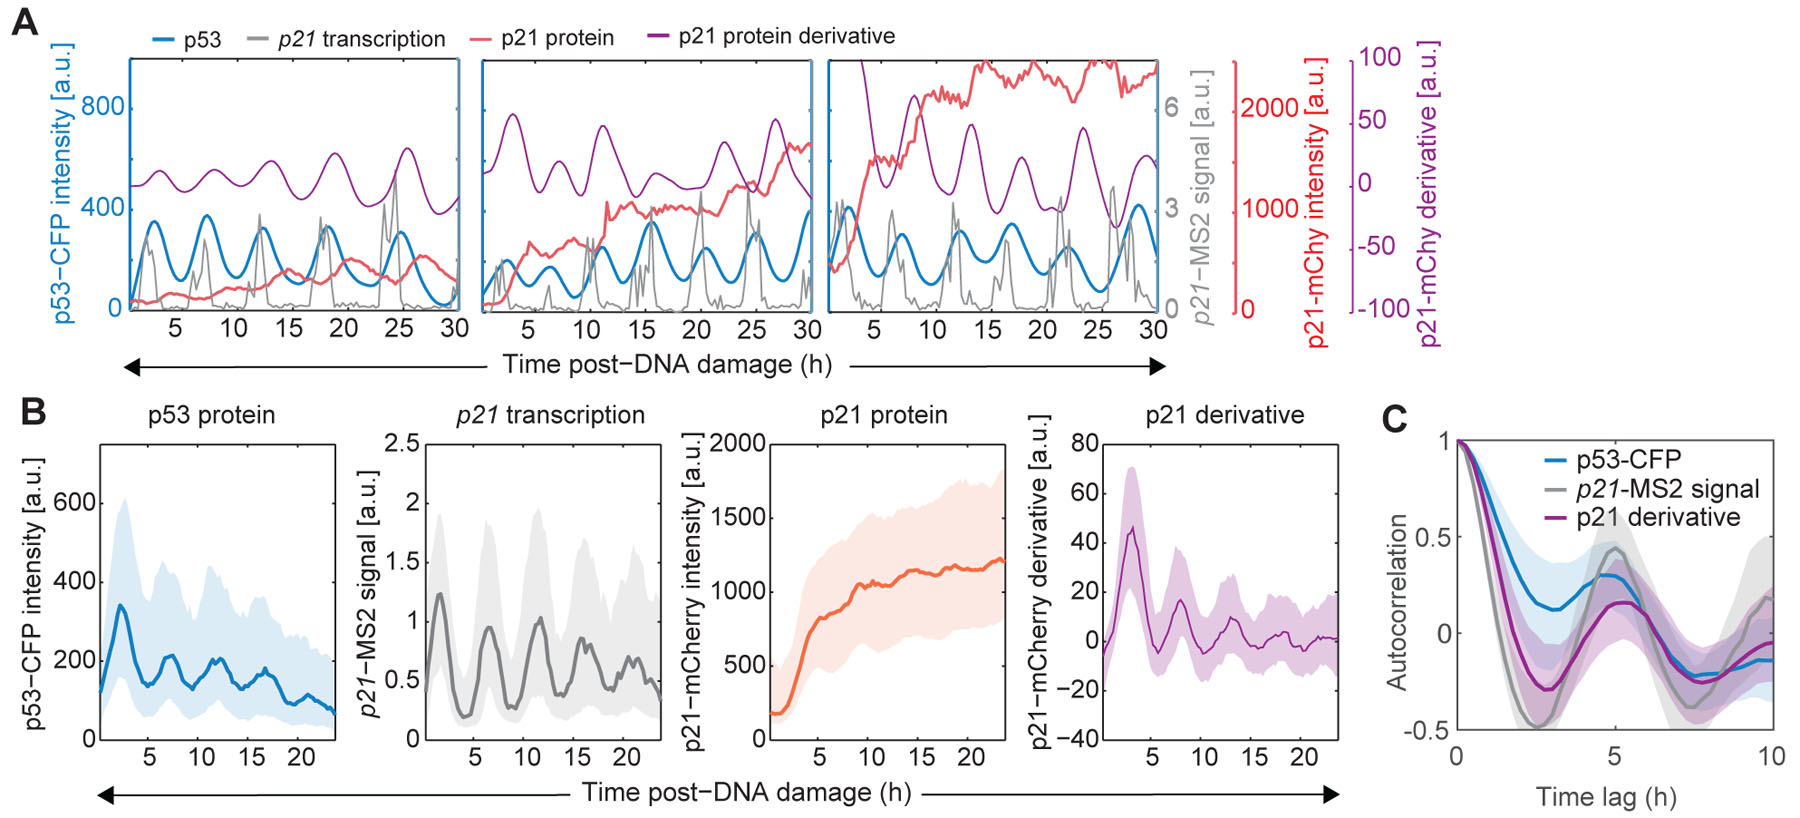
(A) Representative single cell trajectories of p53 (blue) and p21 transcription (gray), together with p21 protein (red) and p21 protein derivative trajectories (purple). (B) Aggregate statistics of p53, p21 transcription, p21 protein and p21 protein derivative dynamics in response to IR. Median (bold line) +/− interquartile range (shaded area) are calculated from > 250 single cell trajectories from a representative biological duplicate. (C) Autocorrelation functions for p53, p21 transcription and p21 protein derivative trajectories. A peak at 5.5h corresponds to period of pulses (representative analysis from a biological duplicate with >250 single cell trajectories). See also Figure S3.
Figure 3. p21 transcription at distinct phases of the cell cycle.
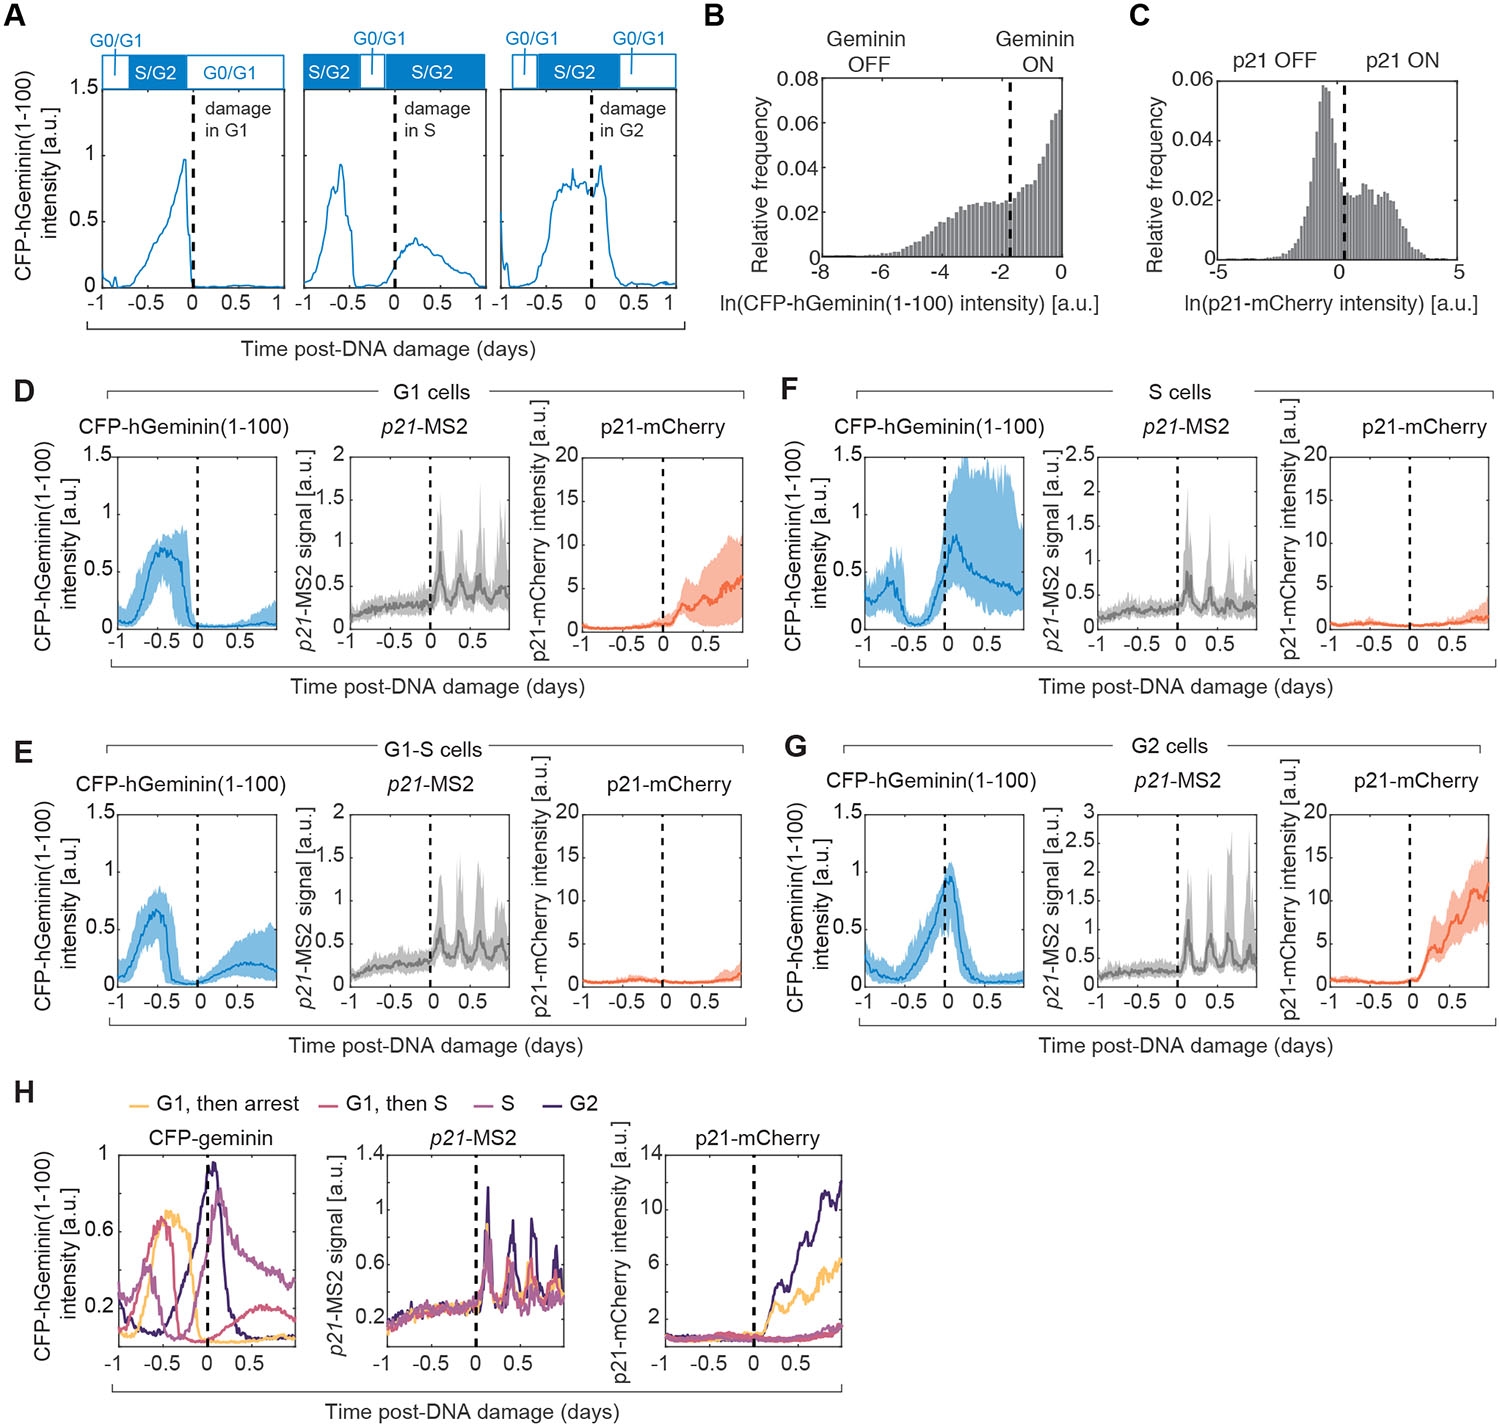
Cells were imaged for 1 day in the absence of damage, and were then treated with the radiomimetic drug NCS at 500ng/mL. Dashed lines represent time of DNA damage in every panel. (A) The CFP-hGeminin(1–100) fluorescent reporter allows determination of cell cycle stage at the time of damage in live cells. (B) Distribution of CFP-hGeminin(1–100) intensity across all cells and timepoints. (C) Distribution of p21-mCherry intensity across all cells and timepoints. (D-G) Cells were classified on the basis of CFP-hGeminin(1–100) status at the time of damage and 5 hours post-damage. We grouped cells in 4 categories: G1 cells that arrest (n = 51 cells), G1 cells that transition into S phase shortly after damage (n = 86 cells), S phase at the time of damage (n = 42 cells) and G2 phase at the time of damage (n = 49 cells). Median (bold lines) and interquartile range (shaded area) of single cells’ p21 transcription and protein trajectories classified by cell cycle phase at the time of damage. (D) G1 cells that arrest. (E) G1 cells that transition into S phase. (F) S phase cells. (G) G2 cells. (H) Median trajectories of CFP-hGeminin(1–100), p21-MS2 signal and p21-mCherry colored according to cell cycle stage at the time of damage. The data are the same as in (D-G), but presented on the same axes to facilitate comparisons.
We noted that individual p53 pulses and their corresponding pulses of p21 transcription and protein derivatives were offset by time delays that likely reflect production of the molecules and fluorophore maturation times (Fig. S3A–E). We therefore re-calculated the correlation between p53 levels and p21 transcription, and between p21 transcription and p21 protein levels after realigning single cell trajectories on the basis of the observed time delays (see Methods, Fig. S3F–K). This led to a notable increase in the correlation between p21 transcription and p21 protein derivative (Fig. S3G, I). The impact on the correlation between p53 levels and p21 transcription was more modest (Fig. S3J, K), suggesting that accounting for time delays may not be sufficient to quantitatively understand the relationship between p53 levels and downstream p21 transcription. These results reveal complex relationships between TF levels, transcription, and protein accumulation that may not be accurately captured by analyses of single time-points, but can be observed by tracking dynamical patterns over time.
p53 levels influence the likelihood of p21 transcriptional activation
We next sought to determine the input-output relationship relating p53 levels with p21 transcription. In principle, a variety of functions could govern this relationship. These include hyperbolic or sigmoidal functions, which are commonly used in biological modeling (Alon 2006), as well as other, non-monotonic relationships (Sepúlveda et al. 2016) (Fig. 4A). Moreover, increasing p53 levels could (i) change the probability of transitioning into the ‘ON’ state, and/or (ii) change the magnitude of instantaneous transcriptional output given that the system is in the ‘ON’ state. We leveraged the natural variation in p53 protein levels arising from its pulsatile dynamics to dissect the quantitative details governing the relationship between p53 levels and p21 transcription.
Figure 4. p53 levels influence the likelihood of p21 transcriptional activation.
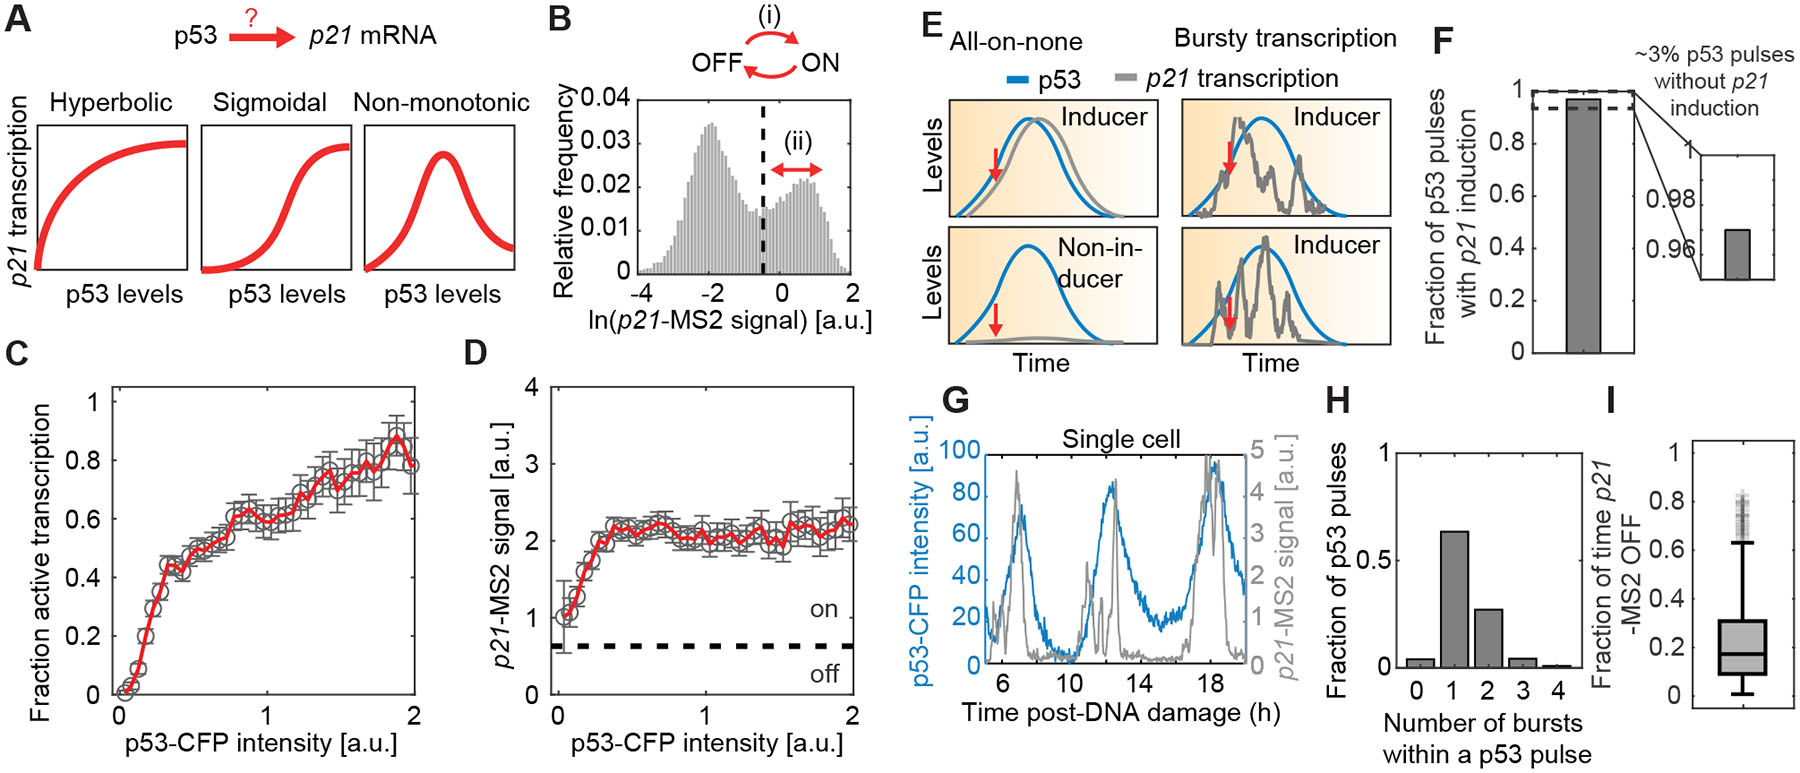
(A) Schematic of potential forms of the input-output relationship linking p53 levels and p21 transcription. (B) Histogram of p21-MS2 signal. p53 could control (i) the burst frequency (ON-OFF switch) or (ii) the burst size (intensity of foci given that transcription is on). (C) Fraction of cells with active p21-MS2 transcription as a function of instantaneous p53 levels. p53-CFP values were normalized to the mean p53 peak intensity across cells and timepoints. Measurements are derived from in silico aligned p53 and p21-MS2 pulses after IR. Error bars denote standard error of proportion using binomial statistics (representative analysis from biological duplicate, with >600 independent p53 pulses per replicate). (D) Average p21-MS2 signal, given that transcription is active, as a function of instantaneous p53 levels. Dashed line denotes threshold delineating ON/OFF transcription state. p53-CFP values were normalized to the mean p53 peak intensity across cells and timepoints. Error bars denote standard error of means (representative analysis from biological duplicate, with >600 independent p53 pulses per replicate). (E) Hypotheses to explain the lack of p21 transcription in the presence of high p53 levels. In the first scenario, some cells may fail to induce p21 at all during a single p53 pulse. In the second scenario, transcription may fluctuate between ON/OFF states within a p53 pulse. Measurements at a single timepoint (indicated by red arrows) are insufficient to distinguish between these two hypotheses. (F) Fraction of p53 pulses with p21 induction. (G) Representative single-cell trajectory of p53 and p21-MS2 signal showing multiple bursts of p21 transcription within a single p53 pulse. Cells received IR and were imaged every 2min. (H) Distribution of number of p21 transcriptional bursts (>10 min) per p53 pulse (analysis from representative biological replicate with 766 pulses). (I) Fraction of time p21 transcription is OFF due to bursty transcription within individual p53 pulses. Only pulses during which there is more than one transcriptional burst are considered (analysis from representative biological replicate with 368 pulses). See also Figure S3.
To compute the relationship between p53 levels and either the fraction of transcriptionally active loci or the intensity of p21-MS2 signal, we in silico aligned p21-MS2 signal to individual p53-CFP peaks as the reference, such that the two molecular species peaked at the same time on average (Fig. S3A–E). p21-MS2 signal displayed a bimodal distribution (Fig. 4B), which allowed us to categorize transcriptional activity into ON and OFF states. The probability of active p21 transcription increased with p53 levels following a hyperbolic trend (Fig. 4C), whereas the intensity of active p21-MS2 foci changed minimally with p53 (Fig. 4D). Both parameters approached saturation at high p53 levels. Our results suggest that individual cells reach nearly maximum instantaneous transcriptional output within the range of p53 levels that cells experience in response to IR (Fig. 4C and D). These results agree with reports in other systems suggesting that transcription rapidly saturates, and that TFs regulate the probability of transcriptional activation rather than the magnitude of RNA produced (Rodriguez et al. 2019). On a per-cell basis, therefore, instantaneous TF levels hold little information about the magnitude of transcription, but can be used to predict mRNA levels over time-scales of hours (Purvis et al. 2012; Hafner et al. 2017).
We noted that even at high p53 levels, transcriptional activation did not uniformly reach 100% (Fig. 4C). This phenomenon could arise if some cells fail to activate transcription during a p53 pulse (Fig. 4E, all-or-none model) or show bursty transcription, as has been observed in other systems (Lenstra et al. 2015; Larson et al. 2013; Rodriguez et al. 2019; Wilson et al. 2017; Suter et al. 2011; Neuert et al. 2013; Fritzsch et al. 2018; Senecal et al. 2014; Li et al. 2018) (Fig. 4E, transcriptional bursts model). Using data from cells with oscillating p53 levels imaged at higher temporal resolution, see Methods), we found that fewer than 3% of cells failed to exhibit p21-MS2 foci (Fig. 4F), arguing against a prominent role for the “all-or-none” model (Fig. 4E). Closer examination of p21 trajectories revealed that transcription fluctuated within single p53 pulses (Fig. 4G), often exhibiting 2 or 3 transcriptional bursts (Fig. 4H). The bursty kinetics of transcription resulted in transcription being off approximately 20% of the time during a p53 pulse (Fig. 4I). By tracking the dynamics of p53 levels and p21 transcription, we concluded that the observed lack of uniform transcriptional activation at fixed timepoints arises mainly from bursty transcriptional kinetics rather than from a sub-population of cells that is refractory to p53 activation.
p53 dynamics synchronize transcription between independent alleles of p21 in the same cell
The observed cell-to-cell heterogeneity in p21 transcription induction (Fig. 2A and Figs. S3 F–K) could arise from fluctuations in the global cellular environment or reflect intrinsic stochasticity at the level of individual p21 loci. Moreover, fluctuations in the cellular environment could arise at cytoplasmic, nuclear, and subnuclear levels. To dissect the contribution of these sources of variability, we monitored independent p21 loci in shared environments. We generated binucleated cells by cytochalasin D-mediated inhibition of cytokinesis (Fig. 5A and B), allowing us to compare the variability in p21 transcription in a shared cytoplasmic compartment. To investigate p21 transcription from distinct loci in a shared nuclear environment, we analyzed a rare subpopulation of cells with spontaneously-arising biallelic p21 endogenous tags (<3% in population) (Fig. 5C and D). Both binucleated and biallelic cells showed pulsatile p53 dynamics similar to their mononucleated, monoallelic counterparts (Fig. 5E), although binucleated cells displayed a slightly longer period of ~6.2h (compared to 5.5h for IR-only treated cells). p53 dynamics were highly correlated between the two nuclei of binucleated cells (Fig. S4A and B), underscoring the dominant role of cytoplasmic regulation in shaping p53 dynamics. A small fraction of binucleated cells (~15%) showing non-typical p53 dynamics and poorly-correlated p53 trajectories (Fig. S4A and C) was excluded from the analysis. Next, we determined the extent of influence that shared cytoplasmic and nuclear environments have on p21 transcriptional dynamics. p21 transcriptional trajectories were significantly more correlated between nuclei of binucleated cells and between alleles of biallelic cells compared to randomly-paired cells, even after aligning the randomly-paired cells’ trajectories to be in-phase with each other (Fig. 5E and F). Notably, in binucleated cells with well-correlated p53 trajectories, p21 transcription was also highly correlated (Spearman’s r>0.6). In contrast, binucleated cells with poorly-correlated p53 dynamics showed weaker correlations in p21 transcription (Spearman’s r<0.4) (Fig. S4B–C). These results suggest that covariation between transcription from independent alleles in a single cell can be largely explained by p53 dynamics.
Figure 5. p53 dynamics synchronize transcription in independent p21-MS2 alleles in the same cell.
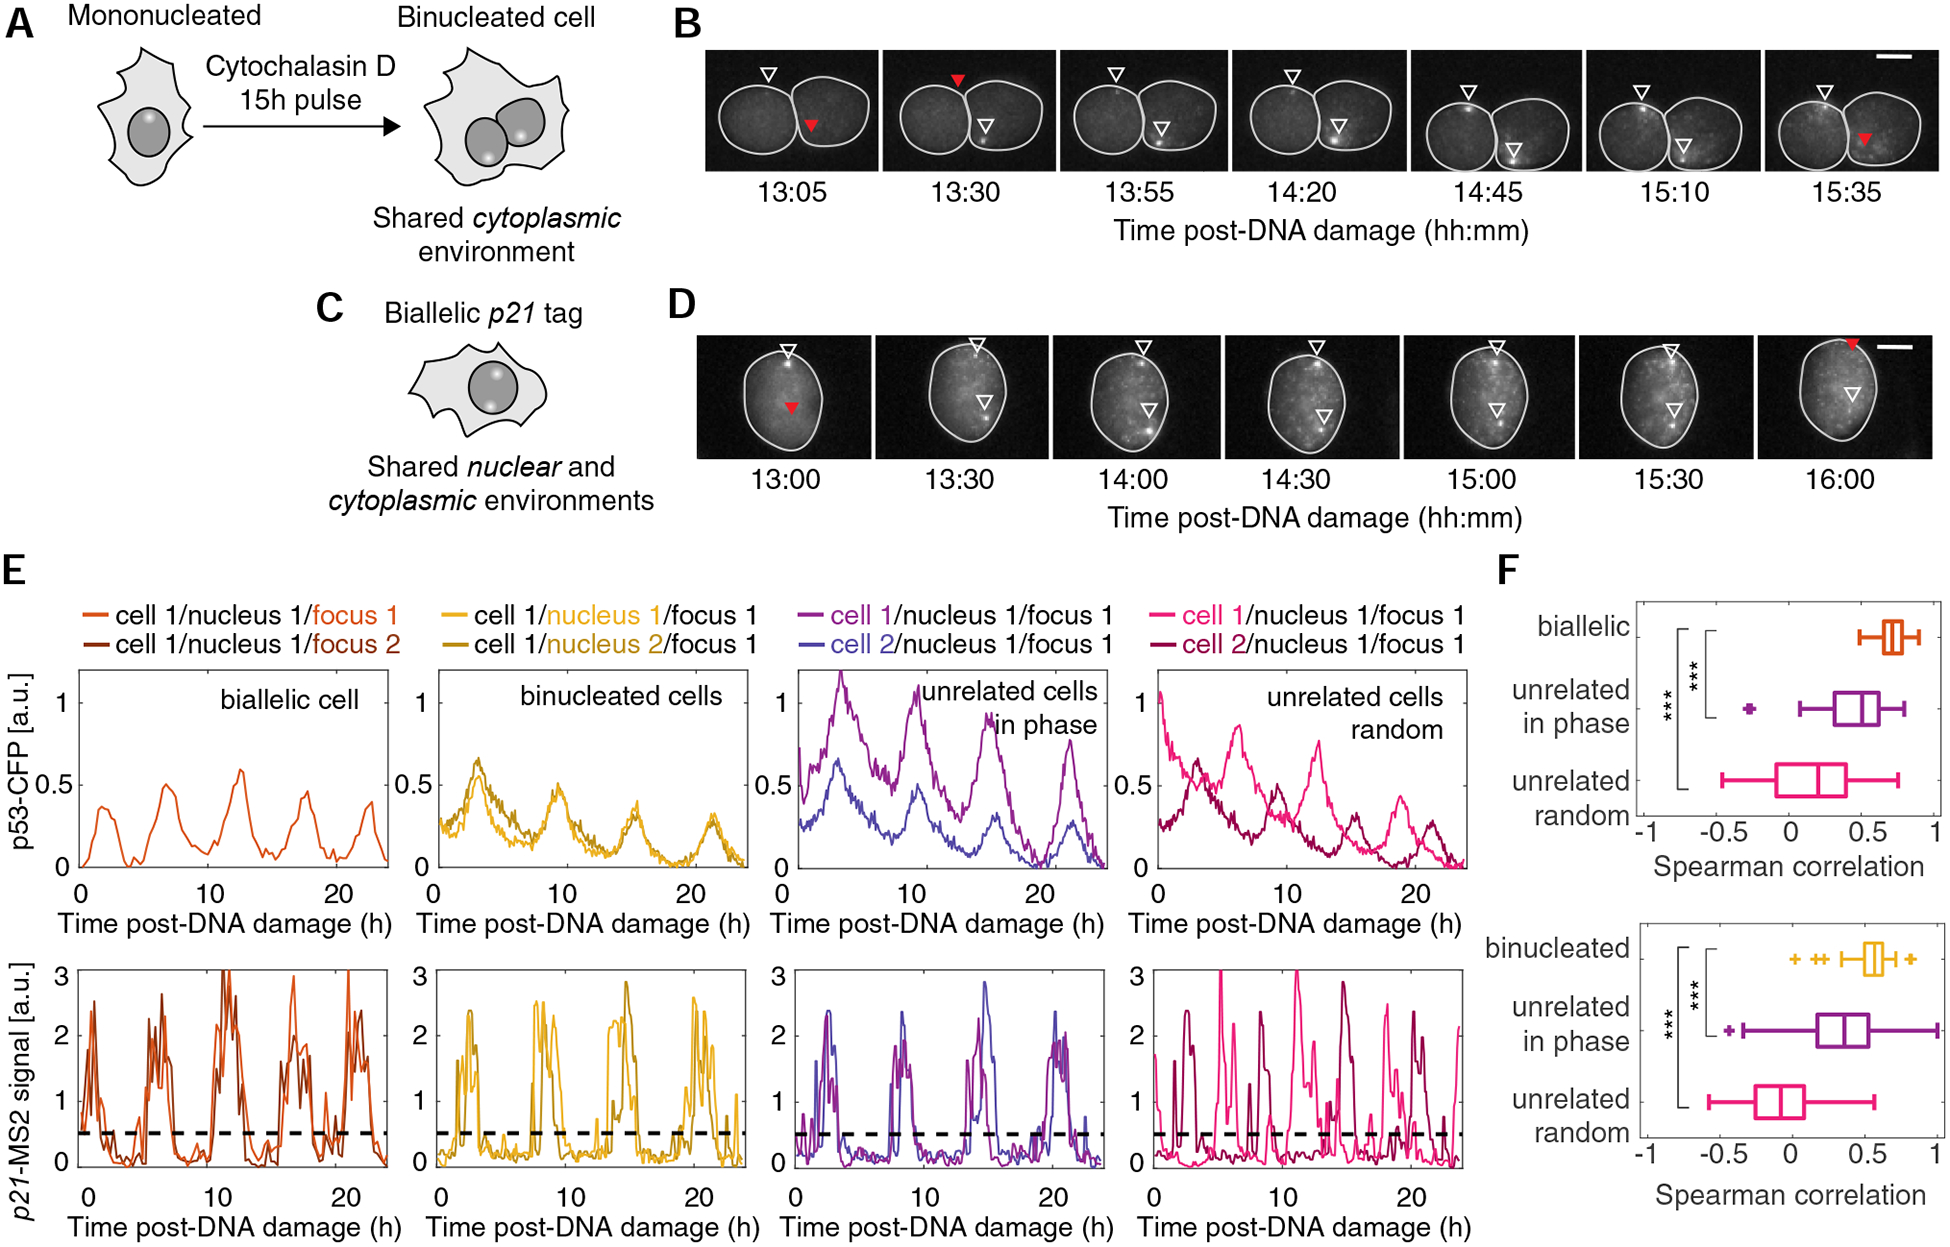
(A) A 15h treatment with cytochalasin D leads to binucleation. (B) Image series of p21-MS2 signal in a representative binucleated cell after DNA damage. Triangles denote p21-MS2 ‘ON’ (white) and ‘OFF’ (red) states. (C) Individual cells with two tagged p21 alleles tagged allow simultaneous quantification of transcriptional dynamics at p21 loci under shared nuclear and cytoplasmic environments. (D) Image series of p21-MS2 signal in a representative cell with two tagged p21 alleles. Triangles denote p21-MS2 ‘ON’ (white) and ‘OFF’ (red) states. (E) Representative single cell trajectories of p53 and p21-MS2 dynamics post-DNA damage in biallelic (IR), binucleated (NCS) or unrelated pairs of cells within each treatment. Each curve represents a single nucleus (for p53 quantification) or a single locus (for p21-MS2 quantification). (F) Boxplots of Spearman correlation of pairs of p21-MS2 or p21-mCherry derivative trajectories. Data from a representative biological replicate with 55 cells (biallelic) and 43 cells (binucleated) cells. *** p<0.001 Man-Whitney Rank Sum Test. See also Figure S4.
Sustained p53 dynamics modestly impact the magnitude of p21 transcription but strongly impact the levels of p21 protein.
Our results suggest that p53 levels regulate the probability, rather than the magnitude, of p21 transcriptional activation and result in rapid cycling of p21 between on and off states during a single p53 pulse (Fig. 4), cumulatively leading to stepwise accumulation of p21 protein over many p53 pulses (Fig. 2). Although p53 was induced at least 2-fold in these experiments, it remained possible that we had not sampled sufficiently high levels of p53 to accurately determine the input-output relationships with target gene transcription and protein levels. Therefore, we investigated whether these relationships held true at even higher levels of p53, which we induced in irradiated cells by treating them with nutlin-3a (MDM2i) to inhibit MDM2 (Vassilev et al. 2004), the E3 ubiquitin ligase responsible for degrading p53. We found that in response to IR and MDM2i, p53 levels were induced more than 10-fold (compared to cells lacking MDM2i) and did not oscillate (Fig. 6A). To ensure that the MS2 system accurately reports on high levels of transcription without becoming saturated, transcription levels were measured simultaneously by MS2 signal and FISH in the presence or absence of Mdm2 inhibitor. The results of these two orthogonal assays showed good correlation, suggesting that the MS2 reporter was not limited in its detection abilities (Fig. S5). MDM2 inhibition eliminated the oscillations in p21 transcription and led to only a modest (approximately 2-fold) increase in the magnitude of p21 transcriptional activation compared to peak levels in the absence of MDM2i (Fig. 6B). The relationships between p53 levels and the magnitude of p21 transcription, as well as transcription probability, were not affected by the high p53 levels in the presence of MDM2i (Fig. 6C, D). This suggests that the input-output relationship between p53 levels and p21 transcription that was determined in response to IR (Fig. 4) is maintained across a wide range of concentrations of artificially stabilized p53. Despite the slight difference in transcriptional magnitude between irradiated cells treated with or without MDM2i (Fig. 6D), p21 protein levels showed an elevation of 9-fold upon MDM2i treatment (Fig. 6E), resembling the elevation in the levels of the p53 protein. These results point to a key role for p53 and p21 transcriptional oscillations in preventing rapid accumulation of p21 protein levels, which holds important implications for guidance of cellular outcomes that are based on overall protein levels, in this case the choice between cell cycle arrest and cell death.
Figure 6. Sustained p53 dynamics have a modest effect on p21 transcription and a strong effect on p21 protein accumulation.
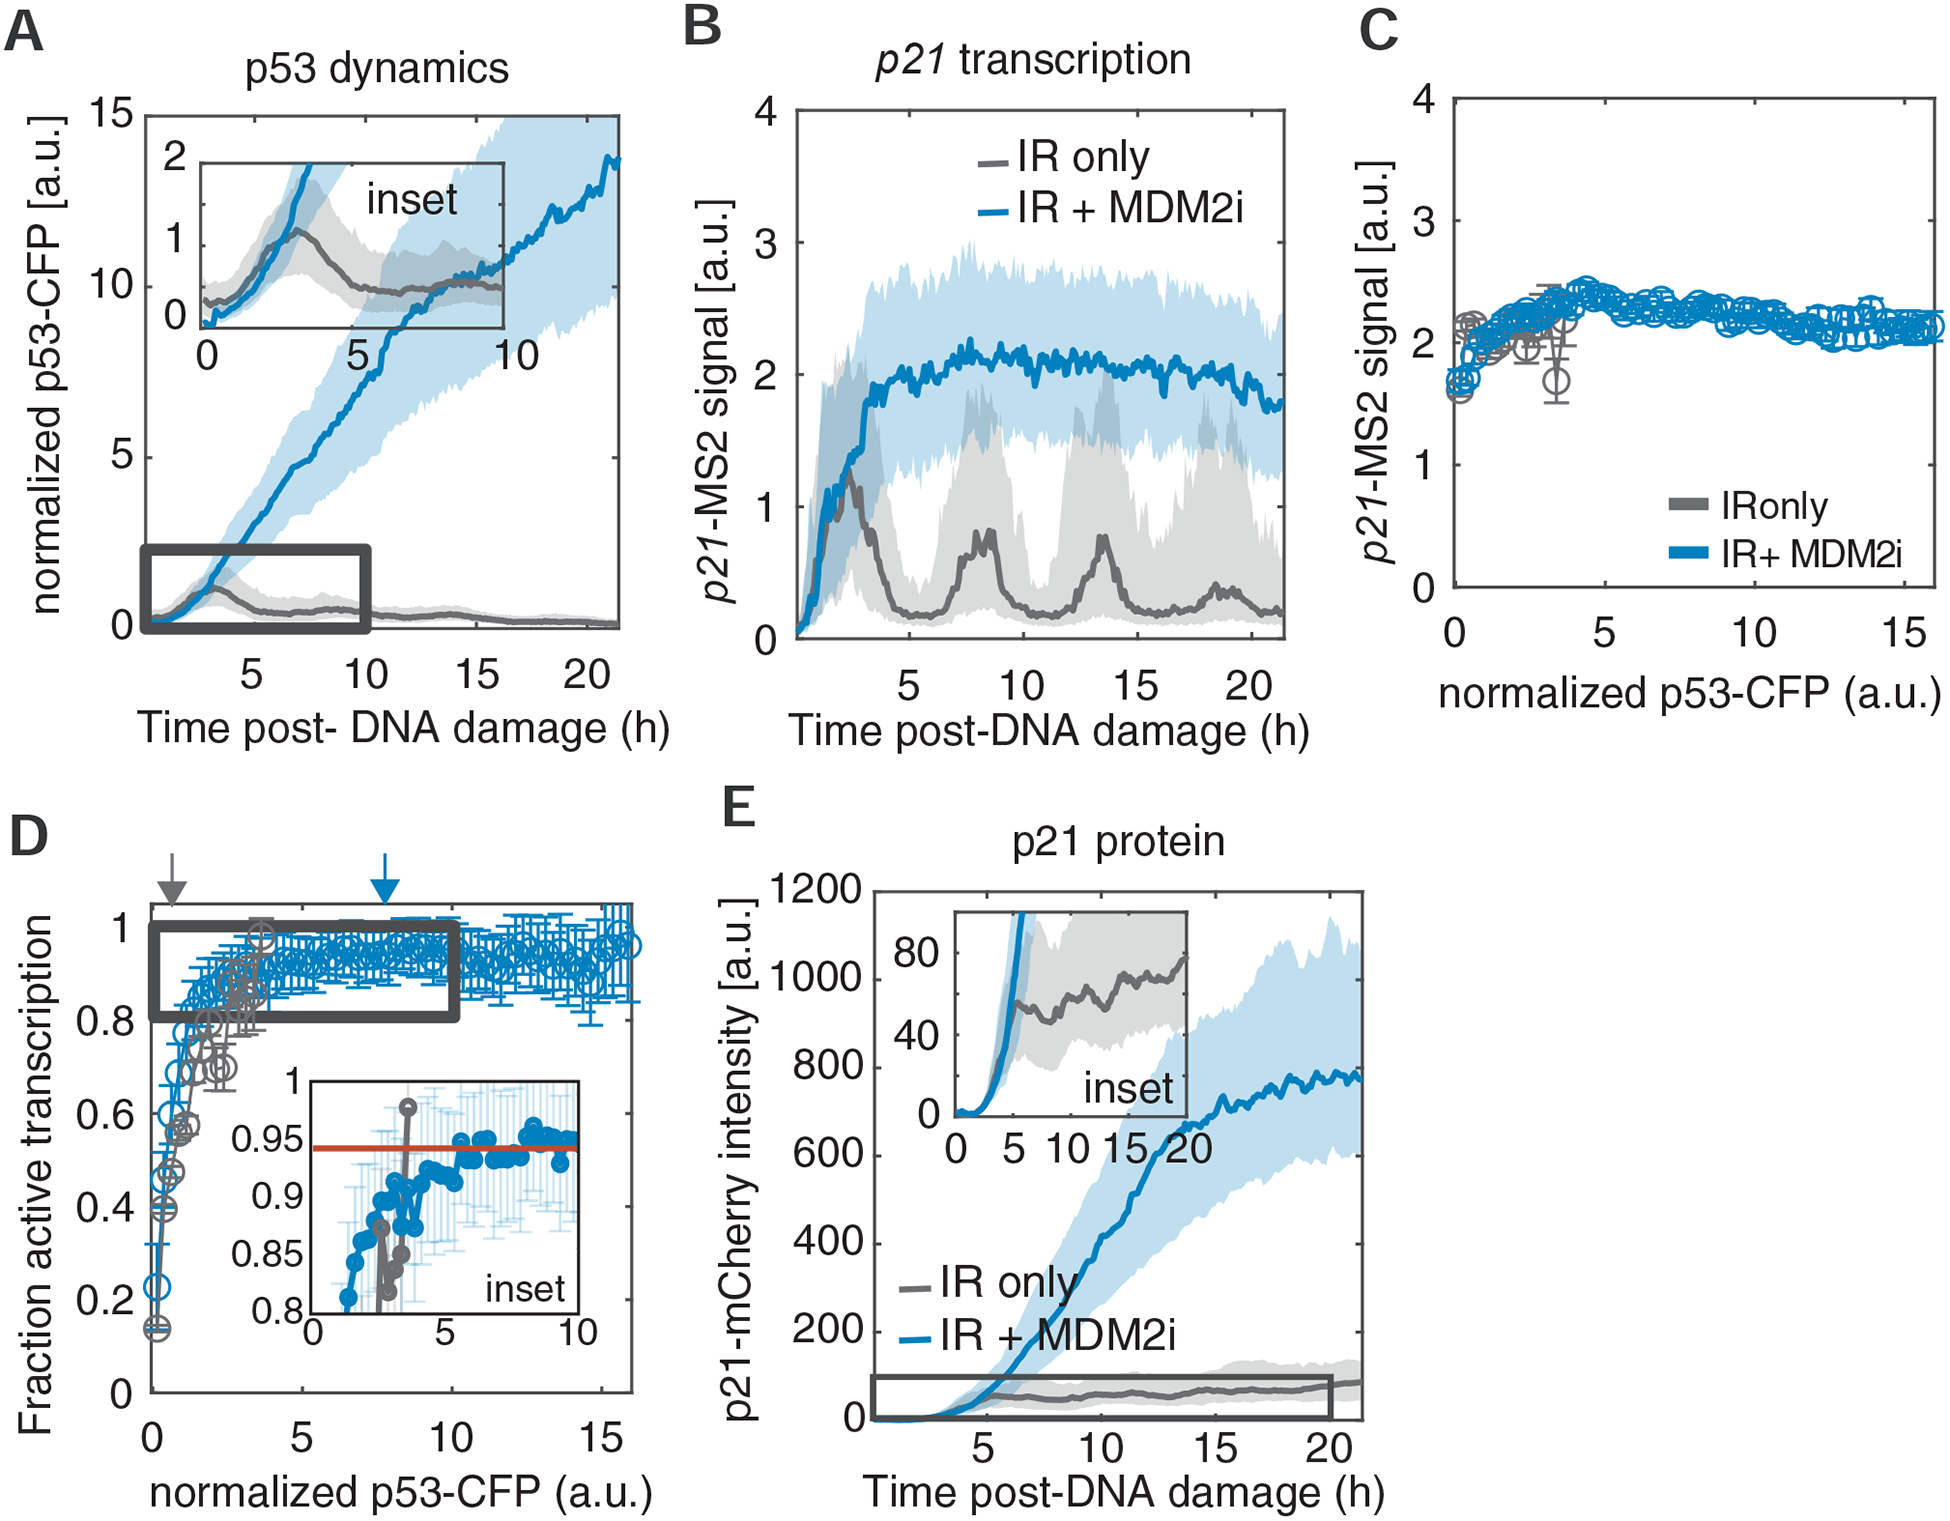
(A) Dynamics of p53 in response to IR in the presence (representative biological replicate with 271 cells) or absence (representative biological replicate with 201 cells) of MDM2i. p53-CFP values were normalized to the mean p53 peak intensity across cells and timepoints. Bold line and shaded areas represent median and interquartile range, respectively. The inset zooms into the early pulsatile response of p53 after IR alone. (B) Dynamics of p21-MS2 signal in response to IR in the presence (representative biological replicate with 271 cells) or absence (representative biological replicate with 201 cells) of MDM2 inhibitor (nutlin3-a). Bold line and shaded areas represent median and interquartile range, respectively. (C) Average p21-MS2 signal, given that transcription is active, as a function of instantaneous p53 levels in response to IR, in the presence (representative biological replicate with 271 cells) or absence (representative biological replicate with 201 cells) of MDM2i. p53-CFP values were normalized to the mean p53 peak intensity across cells and timepoints. Dashed line denotes threshold delineating ON/OFF transcription state. Error bars denote standard error of means. (D) Fraction of active p21-MS2 transcription as a function of instantaneous p53 levels in response to IR, in the presence (representative biological replicate with 271 cells) or absence (representative biological replicate with 201 cells) of MDM2i. p53-CFP values were normalized to the mean p53 peak intensity across cells and timepoints. Error bars denote standard error of proportion using binomial statistics. Red line in inset shows the fraction of active transcription at saturation. Gray and blue arrows denote the average p53-CFP levels after IR-only or IR+MDM2i treatments, respectively. (E) Dynamics of p21 protein levels in response to IR in the presence (representative biological replicate with 100 cells) or absence (representative biological replicate with 54 cells) of MDM2 inhibitor (nutlin3-a). The inset zooms into p21 induction after IR alone. See also Figure S5.
Discussion
In this study, we developed a system to study the cascade of events from transcription factor induction to target gene transcription and protein production using live cell imaging for long time scales and high temporal resolution. Using time-lapse imaging, we quantified p53, p21 transcription and p21 protein levels in individual cells, thus bypassing limitations of population and single time-point-based approaches (Fig. 7). We found that although p21 transcription was bursty, the probability of inducing transcription was dependent on p53 levels and that the level of transcription rapidly saturated. Due to this tight relationship between p53 and p21 transcription, we found a strong correlation between p53 and p21 transcription, as well as between p53 and p21 protein derivative, over time scales of a complete p53 pulse (5.5h).
Figure 7. Quantifying the central dogma in the p53 pathway in live single cells.
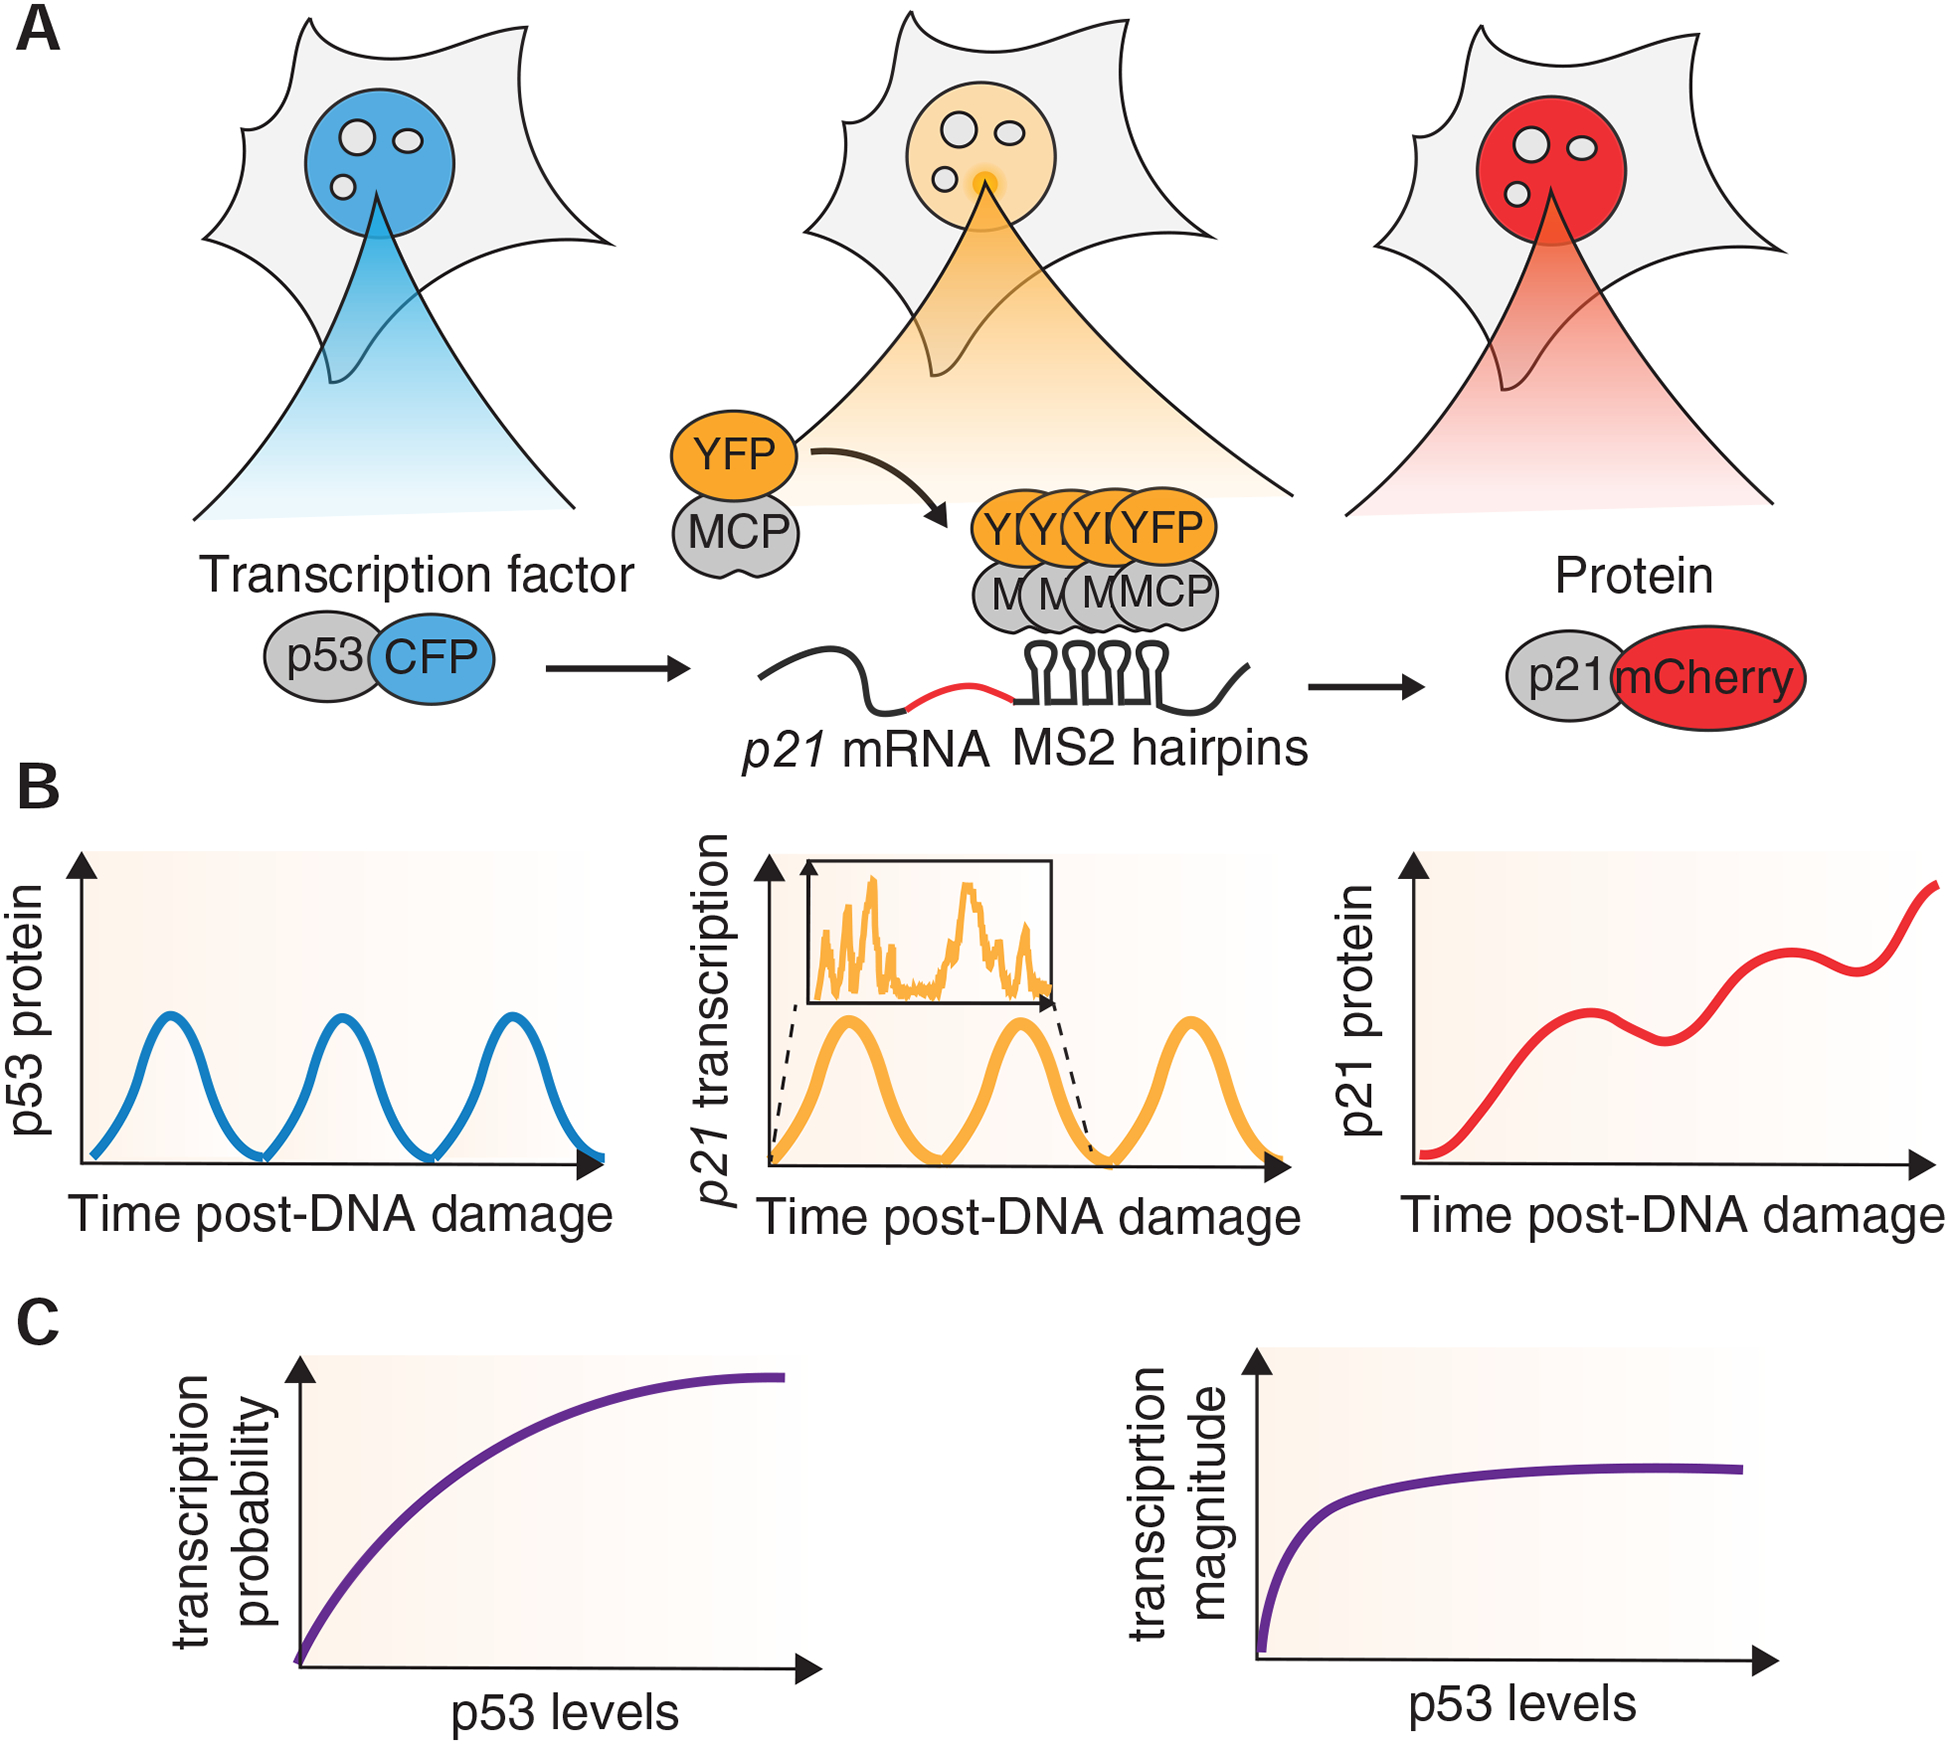
(A) A system to quantify the dynamics of p53 protein, p21 transcription and p21 protein in live single cells. (B) Pulsatile dynamics of p53 lead to pulses of p21 transcription and step-wise accumulation of p21 protein. Within each pulse, p21 transcription exhibits bursty dynamics. (C) Heterogeneity in p53 expression allows quantification of input-output relationships across a range of p53 expression levels. Transcription probability scales with p53 levels, whereas transcription magnitude saturates at low p53 levels.
Quantification of the input-output relationship between p53 levels and p21 transcription showed that p21 transcription behaved as an ON-OFF switch with higher p53 levels increasing the probability of p21 transcription being in an ON state. Although p53 levels influenced the probability of transcriptional activation, they had minor effects on the magnitude of transcriptional activity, as transcription rapidly reached saturation when in the ON state. This result aligns with other reports of saturation of transcriptional activation (Rodriguez et al. 2019; Lenstra et al. 2015). Variations in p53 levels beyond those needed to trigger transcriptional activation may be buffered by transcriptional saturation, which is a commonly observed phenomenon in gene regulation that can be achieved by multiple mechanisms (Scholes, DePace, and Sánchez 2017). In our previous study using population-based measurements of p53 DNA binding and gene expression, we predicted that all p53 target genes have transcription dynamics that track p53 protein dynamics (Hafner et al. 2017). Future studies extending our reporter system to other p53 targets will allow us to understand whether the same ON-OFF activation and saturation behavior are specific to p21 or can be generalized to all p53-responsive genes.
We detected substantial heterogeneity in p21 transcription between cells and even within individual alleles of a biallelic cell. This finding is reminiscent of the extrinsic and intrinsic noise described by Elowitz and colleagues, who found that distinct proteins under the independent control of identical promoters showed both correlated (extrinsic noise) and uncorrelated variation (intrinsic noise) (Elowitz et al. 2002). Previous analyses of transcription in individual mammalian cells identified global correlations when comparing multiple tagged alleles of the TFF1 gene in the same cell; however, the mechanistic underpinnings of these correlated fluctuations were not elucidated (Rodriguez et al. 2019). We found that independent p21 alleles in the same cell showed strongly correlated dynamics, suggesting that heterogeneity in p21 transcription is dominated by extrinsic noise. Our results suggest that much of the extrinsic noise can be explained by variations in p53 levels, as transcription from two alleles in a shared nucleus (i.e. exposed to equal p53 levels) was highly correlated. Together, these observations highlight the importance of quantifying transcription factors and target genes in the same cell in order to determine the extent to which variability in transcription arises at the level of fluctuations in the abundance of transcription factors themselves.
While the dynamics of p21 transcription tracked p53 pulses, upon induction of p21 protein, its levels were not pulsatile but accumulated throughout the experiment. In contrast, another well-established p53 target gene, MDM2, which also shows pulsatile transcription (Hafner et al. 2017; Porter et al. 2016; Purvis et al. 2012; Hanson et al. 2019), is known to have pulsatile protein dynamics following p53 pulses (Lahav et al. 2004). Similar distinctions in transcription and protein dynamics were noted for targets of the Erk pathway (Wilson et al. 2017), which stem from the additional layers of post-translational regulations reflecting the different roles that these genes play. In the p53 pathway, while Mdm2 functions as a negative regulator of p53, establishing a negative feedback loop that is the main driver of p53 protein pulses, p21 is a cell cycle regulator. One can speculate that the progressive accumulation of p21 protein levels with each pulse is a mechanism to integrate total p53 levels over time. Consistent with this idea, sustained p53 protein dynamics induced by irradiation combined with MDM2i treatment lead to much higher levels of p21 protein, which may play a role in pushing cells towards senescence versus cell cycle arrest, as has been reported for sustained versus pulsatile p53 dynamics, respectively (Purvis et al. 2012). Our results suggest that pulsatile TF dynamics combined with bursty transcription may be a strategy for preventing over-accumulation of target proteins in situations where they may prematurely lead to irreversible outcomes (senescence or apoptosis).
Dynamics of transcription factors and subsequent changes in target gene expression are important drivers of cell fate decisions (Purvis and Lahav 2013). While our work emphasizes the value of gaining detailed quantitative information about individual TFs and target genes in individual cells, current live-imaging methods are limited in the number of molecular species that can be simultaneously quantified. On the other hand, efforts to elucidate gene regulatory relationships from single cell transcriptomics provide genome-wide data but rely on static snapshots of cell populations. These approaches are limited in revealing quantitative input-output relationships due to the fact that inferences rely on transcription factor mRNA rather than protein abundance and do not account for correlations offset by time delays. Furthermore, single cell transcriptomic data do not track individual cells’ decision-making processes, but rely on building computational predictions based on aggregated data (Tusi et al. 2018), which is subject to the same caveats of “averaging out” heterogeneity as in bulk data. Recently, live cell imaging followed by single cell RNA sequencing has been used to understand how temporal dynamics of the TF affect the downstream transcription and cell fate (Lane et al. 2017). Such an integrative approach promises to expand our understanding of distinct dynamical relationships between TF levels and transcription operating over short-term (minutes) and long-term (hours) intervals, and is likely to augment our understanding of how the dynamics of TF levels, transcription, and protein output ultimately guide cell fate decisions.
Key Changes Prompted by Reviewer Comments
In response to the reviewers’ and editor’s suggestions, we have edited the text and figures and added 4 new figures (Fig. 3, 7, S2, S5). We have taken several measures to further validate our experimental system. First, we showed with new experiments and examples from the literature that p53 dynamics are not affected by the dose of irradiation, which strengthened our choice of p53 levels, rather than extent of DNA damage, as the “input” governing p21 expression. The effects of different doses of irradiation are now shown in Fig S2. Second, we validated that the MS2 system is reliable for detecting transcription by simultaneously measuring transcription in individual cells using both the MS2 system and the orthogonal smFISH technique (Fig. S5).
Our studies were conducted in asynchronous cells. We therefore have investigated the potential effects of cell cycle on p53 levels and p21 expression using a live reporter of cell-cycle phase. We showed that the dynamics of p53 and p21 transcription were similar across all cell cycle phases. In contrast, p21 protein accumulated in all phases except for S phase, in which we have previously shown rapid p21 degradation (Stewart-Ornstein and Lahav, 2016). These results are shown in Fig. 2. Because p21 protein is degraded in S phase, we omitted a subset of cells with very low p21 protein in Fig. 1C and recalculated the correlation, which remained low. To further solidify our finding that two p21-MS2 alleles in a shared nuclear and cytoplasmic environment exhibit higher correlations in transcriptional trajectories than alleles in separate cells, we calculated correlations between alleles in unrelated cells whose p53 trajectories were in-phase with each other. Correlations in biallelic cells were higher than those between phase-matched unrelated cells. These results are shown in Fig. 5F. Finally, we have included a discussion of how alternative techniques, such as single-cell sequencing, can complement live-cell imaging and contribute to our understanding of gene network regulation, and we summarized the unique insights provided by the live single-cell imaging approach employed in our study.
For context, the complete Transparent Peer Review Record is included within the Supplemental Information.
STAR Methods
Resource Availability
Lead Contact:
Further information and requests for resources and reagents should be directed to and will be fulfilled by the Lead Contact, Galit Lahav (Galit@hms.harvard.edu).
Materials Availability:
Cell lines and plasmids generated in this study are available from the Lead Contact upon request.
Data and Code Availability:
Quantification of single cell imaging data and code that was used to generate figures (in Matlab) are available at: https://data.mendeley.com/datasets/nwt5m8ktgt/draft?a=7eb1bbbe-5963–484e-9f4b-5bb1f0a2b057
Experimental model
MCF7 cells (derived from human, female breast adenocarcinoma) were grown in RPMI + 10% fetal bovine serum (FBS) supplemented with 100 U/mL penicillin, 100 mg/mL streptomycin, and 250 ng/mL fungizone (Gemini Bio-Products). Imaging was done in transparent RPMI + 5% FBS supplemented with 100 U/mL penicillin, 100 mg/mL streptomycin, and 250 ng/mL fungizone. The parental MCF7 line tested negatively for mycoplasma contamination.
Method details Cell treatment
DNA damage was induced by treatment with 10Gy x-ray (Figs. 1, 2, 4, 5 biallelic cells, 6) or addition of the radiomimetic drug NCS (Sigma) at 500 ng/ml (Figs. 3, 5 binucleated cells). Nutlin-3a was purchased from Cayman Chemical, dissolved in DMSO, and applied at a final concentration of 10 uM (Fig. 1G and Fig. 6). Binucleated cells were generated by treating cells with Cytochalasin D (Sigma) at 10uM for 15h, after which they were washed using transparent RPMI media. As a result of this treatment, ~40% of cells were binucleated.
Quantitative RT-PCR
RNA was collected using the TRIZOL reagent and purified using the Zymo RNA Clean-up kit. cDNA was generated using the high-capacity cDNA reverse transcription protocol (Applied Biosystems). Quantitative RT-PCR was then performed using 8.4 ng total cDNA, 100 nM primer, and SYBR Green reagent (Applied Biosystems). Normalization was done to the GAPDH gene.
qPCR primers used:
p21 Forward: GACTCTCAGGGTCGAAAACG
p21 wild type Reverse: AAGATGTAGAGCGGGCCTTT
p21 mCherry MS2 Reverse: CATGTTATCCTCCTCGCCCT
GAPDH Forward: ACATCGCTCAGACACCATG
GAPDH Reverse: TGTAGTTGAGGTCAATGAAGGG
Western blot
Cells were harvested by lysis in the presence of protease inhibitors, and run on 4%–12% Bis-Tris gradient gel (Invitrogen). Transfer was done onto Nitrocellulose membrane and the membrane was blocked with 5% nonfat dried milk prior to antibody addition. p21 (1:1 000, Calbiochem), p53 (1:8 000, DO1 Santa Cruz), Actin (1:10 000, Sigma) and RFP (1:5 000, MBL) antibodies were used. Secondary antibodies with IR-680, IR-800 dyes (1:10 000, Licor) were used for detection.
Plasmids and cloning
To construct the plasmid containing mCherry-P2A Neo-24xMS2 repeats flanked by p21 homology regions, we used sequential restriction enzyme cloning. The plasmid containing the 24xMS2 repeats was obtained from Addgene (31865). The p21 homology regions were: 632 bp for the upstream homology region 666 bp for the downstream homology region (without the STOP codon). mCherry was cloned in frame with the p21 upstream homology region. For CRISPR targeting, previously published plasmids and gRNA guiding sequence was used (Stewart-Ornstein and Lahav 2016).
Cell line construction
Lentivirus was produced by transfecting 293T cells using TransIT-293 reagent (Mirus) according to manufacturer’s instructions, with lentiviral packaging vectors and MCP-YFP (Addgene 31230) or p53-CFP plasmids. Viral supernatant was collected and filtered after 3 days of infection. To generate a stably expressing MCF7 MCP-YFP cell line, MCF7 cells were infected with the MCP-YFP virus in media containing HEPES and protamine sulfate. Single-cell clones were obtained by limiting dilution. A clonal MCP-YFP line was then transfected with both 1ug of the Cas9-p21gRNA plasmid and 1ug of plasmid containing mCherry-P2ANeo-MS2 flanked by p21 homology regions using TransIT-LT1 reagent (Mirus) according to the manufacturer’s instructions. Cells were allowed to recover in nonselective media for 1 day before selection with G418 (400ng/ml). Single clone selection was done using limiting dilution. Finally, a clonal MCP-YFP, p21-mCherry-MS2 cell line was infected with p53-CFP lentivirus. Selection was done with Puromycin (0.5 ug/ml) and single clones were obtained by limiting dilution.
To simultaneously track cell cycle progression and p21 transcription and protein dynamics, we used lentiviral delivery of the CFP-hGeminin(1–100) construct into the p21-mCherry-MS2/MCP-YFP clonal cell line (Karanam 2012; Sakaue-Sawano, 2008).
Microscopy
Two days prior to imaging, cells were plated in poly-D-lysine-coated glass-bottom plates (MatTek Corporation). For live imaging, cells were switched to transparent RPMI transparent medium supplemented with 5% FBS and imaged using a Nikon Eclipse Ti-E microscope equipped with a chamber for controlled temperature (37%) and CO2 (5%) environment. All live-cell imaging was performed with a 20x PA objective (Nikon) using YFP, mCherry and CFP filtersets (Chroma). For imaging the p21 transcriptional foci, 3 z-stacks spanning 4um (Figs. 2,3 and 5 biallelic cells) or 5 z-stacks spanning 6um (Figs. 4, 5 binucleated cells, and 6), were collected in the YFP channel. Images were taken every 15 minutes (Figs. 2, 3 and Fig. 5 biallelic cells), 5 min (Fig. 4C–D, Fig. 5 binucleated cells and Fig. 6) or 2 min (Fig. 4G–I).
For single molecule RNA FISH (smFISH), cells were fixed in 2% PFA and stained according to the smFISH protocol and with smFISH oligos (Biosearch Technologies) as described (Purvis et al. 2012). Imaging was done using a 60x oil objective or 20X objective (to match smFISH foci with live p21-MS2 signal) and z-stacks were collected for the YFP (p21 MS2 foci) and Cy5 (p21 smFISH probes) channels.
Quantification and statistical analysis Image processing
Image processing was done using a custom MATLAB code. Briefly, manual tracking was done on the YFP channel. Nuclei of cells were locally segmented within a 111×111 pixels sub-image around tracked centroids in the YFP channel. The average fluorescence signal within segmented nuclei was estimated for p53-CFP and p21-mCherry. For the p21-MS2 foci quantification, maximal projections from the YFP z-stacks were filtered using a Gaussian mask of 5 pixels. The p21-MS2 signal was defined as the average intensity of the 9 brightest pixels, divided by the median intensity within the nucleus (background signal). Individual foci were manually tracked to quantify p21-MS2 signal in binucleated and biallelic cells.
To process CFP-hGeminin(1–100) trajectories, we first normalized measurements by subtracting the lowest value and dividing by the maximum value of each single cell trajectory. We then used the used the distributions of CFP-hGeminin(1–100) across all cells and timepoints to define a threshold defining the CFP-hGeminin(1–100) ‘ON’ and ‘OFF’ states (Figure 3). We similarly used the distribution of p21-mCherry to define p21 ‘ON’ and ‘OFF’ states. We used the state of CFP-hGeminin(1–100) and p21-Cherry at the time of damage to classify cells in G0/G1 and S/G2 states. We then used the state of these two reporter systems 5h post-DNA damage to further distinguish between S (Geminin ON/p21 OFF) and G2 cells (Geminin ON/p21 ON), and to make a distinction between cells that arrest in G1, and cells that progress into S phase shortly after damage.
Quality control
Only cells which were tracked throughout the entire length of each experiment were considered for further analysis. Segmented cells that touched the borders of segmentation sub-image (see Image processing), which suggests merging of neighboring cells, were excluded from further analysis. Cells with little or no expression of p53-CFP, suggestive of loss or silencing of the fluorescent reporter, were also excluded from the analysis.
We used solidity, i.e. the fraction of the convex hull enclosing a segmented cell encompassed by the segmented object, as a way to identify nuclei with regular ellipsoid shapes. This was important to exclude the possibility that the low correlations that we identified when analyzing fixed timepoints were due to low quality segmentation (Main text Fig. 1B–D).
Inference of input-output relationships
p53-CFP intensity and p21-MS2 signal were pre-processed by subtracting the minimum value from each trajectory. p53-CFP trajectories were smoothed using a 2h sliding window. Individual p53 pulses were identified as local maxima with minimum peak prominence of 40 (a.u.) and minimum width half-prominence of 4h. Trajectories were in silico aligned around individual p53 pulses. Aligned p21-MS2 trajectories were shifted 45min so that the timing of the average p53 and p21-MS2 peaks coincided (Fig. S3). Input-output relationships were inferred using paired measurements of p53 and p21-MS2 from all cell and all timepoints. Our analysis assumes that p21-MS2 signal is a reporter of instantaneous p21 transcription. A similar procedure was used to infer the relationship between p21-MS2 signal and p21 protein derivatives, adjusting for the average time delay of these molecular species. To avoid the confounding effect of the active p21 protein degradation program present during S-phase (Stewart-Ornstein and Lahav 2016), only cells which induced p21 protein immediately after the first p53 pulse were included for p21 protein derivative analyses.
Supplementary Material
Movie S1: Tracking dynamics of p53 protein, p21 transcription and p21 protein in live single cells. Example of single cells with the triple reporter system imaged for ~43h after inducing DNA damage (10Gy x-ray). Time stamp indicates hours post DNA damage.
KEY RESOURCES TABLE
| REAGENT or RESOURCE | SOURCE | IDENTIFIER |
|---|---|---|
| Antibodies | ||
| Mouse monoclonal anti-p21WAF1 | EMD Millipore | Ab-1; cat#OP64 RRID:AB_213423 |
| Mouse monoclonal anti-p53 | Santa Cruz Biotechnology | sc-126 (DO1); RRID:AB_628082 |
| Rabbit polyclonal anti-RFP | MBL international | PM005; RRID:AB_591279 |
| Mouse monoclonal anti-β-Actin | Sigma | A5316; RRID:AB_476743 |
| IRDye 800CW Goat anti-Mouse IgG Secondary Antibody | Licor | 926–32210 |
| IRDye 800CW Goat anti-Rabbit IgG Secondary Antibody | Licor | 926–32211 |
| IRDye 680RD Goat anti-Mouse IgG Secondary Antibody | Licor | 926–68070 |
| IRDye 680RD Goat anti-Rabbit IgG Secondary Antibody | Licor | 926–68071 |
| Bacterial and Virus Strains | ||
| pCR4–24XMS2SL-stable | Addgene | 31865 |
| UbC NLS-HA-MCP-YFP (lentiviral) | Addgene | 31230 |
| pRRL-UbCp-p53-CFP (lentiviral) | This work | N/A |
| pDONR221-p21homology-mCherryp2aNeo-24xMS2-p21homology | This work | N/A |
| pRRL-CMV-CFP-hGeminin(1–100) (lentiviral) | Karanam, et al. 2012 | N/A |
| Chemicals, Peptides, and Recombinant Proteins | ||
| DAPI | Sigma | D9542 |
| Nutlin3-a | Cayman Chemical | N/A |
| Neocarzinostatin (NCS) | Sigma | N9162 |
| Cytochalasin D | Sigma | C8273 |
| Critical Commercial Assays | ||
| p21 smFISH probes | Biosearch Technologies (Purvis, et al 2012) | SMF-1065–5 Custom probes |
| Deposited Data | ||
| Single cell imaging data | This work | doi:10.17632/nwt5m8ktgt.1 |
| Experimental Models: Cell Lines | ||
| Human: MCF7 | Hafner, et al 2017 | N/A |
| Human: MCF7 + MCP-YFP + p53-CFP + p21-mCherry-P2A-Neo-24XMS2 (endogenous tag) | This work | N/A |
| Human: MCF7 + MCP-YFP + p21-mCherry-P2ANeo-24XMS2 + CFP-hGeminin(1–100) | This work | N/A |
| Oligonucleotides | ||
| p21 Forward: GACTCTCAGGGTCGAAAACG | This work | N/A |
| p21 wild type Reverse: AAGATGTAGAGCGGGCCTTT | This work | N/A |
| p21 mCherry MS2 Reverse: CATGTTATCCTCCTCGCCCT | This work | N/A |
| GAPDH Forward: ACATCGCTCAGACACCATG | This work | N/A |
| GAPDH Reverse: TGTAGTTGAGGTCAATGAAGGG | This work | N/A |
| Recombinant DNA | ||
| pCas9-T2A-p21gRNA GGCTTCCTGTGGGCGGATTA | Stewart-Ornstein and Lahav, 2016 | N/A |
| Software and Algorithms | ||
| Custom analysis scripts | This work | doi:10.17632/nwt5m8ktgt.1 |
| P53Cinema Single Cell Tracking Software | Reyes et al., 2018 | https://github.com/balvahal/p53CinemaManual |
Highlights.
p53 oscillations lead to oscillations in p21transcription and p21 protein derivative.
p53 levels affect the probability, rather than the magnitude, of p21 transcription.
Independent p21 alleles within a cell show highly correlated transcriptional dynamics.
Oscillations of p53 levels and p21 transcription dynamics dampen p21 protein levels.
Acknowledgements
We thank A. Jimenez, T. Mitchison, S. Gaudet, J. Paulsson, M.L. Bulyk and the members of the Lahav lab for useful feedback and discussion. This research was supported by NIH grants R01 GM083303 and GM116864 to G.L. A.H. was supported by the Boehringer Ingelheim Fonds PhD fellowship. J.R was supported by CONACyT/Fundacion Mexico en Harvard (404476), and Harvard Graduate Merit Fellowship. J.S-O was supported by NIH grant CA207727. M.T was supported by the American Cancer Society - New England Pay-if Group Postdoctoral Fellowship, PF-18-126-01-DMC.
Footnotes
Publisher's Disclaimer: This is a PDF file of an unedited manuscript that has been accepted for publication. As a service to our customers we are providing this early version of the manuscript. The manuscript will undergo copyediting, typesetting, and review of the resulting proof before it is published in its final form. Please note that during the production process errors may be discovered which could affect the content, and all legal disclaimers that apply to the journal pertain.
Declaration of Interests
The authors declare no competing interests.
References
- Alon U (2006). An introduction to systems biology: design principles of biological circuits (Chapman and Hall/CRC; ). [Google Scholar]
- Ben-Ari Y. ‘ara, Brody Y, Kinor N, Mor A, Tsukamoto T, Spector DL, Singer RH, and Shav-Tal Y (2010). The life of an mRNA in space and time. J. Cell Sci 123, 1761–1774. [DOI] [PMC free article] [PubMed] [Google Scholar]
- Bothma JP, Norstad MR, Alamos S, and Garcia HG (2018). LlamaTags: A Versatile Tool to Image Transcription Factor Dynamics in Live Embryos. Cell 173, 1810–1822.e16. [DOI] [PMC free article] [PubMed] [Google Scholar]
- Crick FH (1958). On protein synthesis. Symp. Soc. Exp. Biol 12, 138–163. [PubMed] [Google Scholar]
- Csárdi G, Franks A, Choi DS, Airoldi EM, and Drummond DA (2015). Accounting for experimental noise reveals that mRNA levels, amplified by post-transcriptional processes, largely determine steady-state protein levels in yeast. PLoS Genet. 11, e1005206. [DOI] [PMC free article] [PubMed] [Google Scholar]
- de Sousa Abreu R, Penalva LO, Marcotte EM, and Vogel C (2009). Global signatures of protein and mRNA expression levels. Mol. Biosyst 5, 1512–1526. [DOI] [PMC free article] [PubMed] [Google Scholar]
- Dufourt J, Trullo A, Hunter J, Fernandez C, Lazaro J, Dejean M, Morales L, Nait-Amer S, Schulz KN, Harrison MM, et al. (2018). Temporal control of gene expression by the pioneer factor Zelda through transient interactions in hubs. Nat. Commun 9, 5194. [DOI] [PMC free article] [PubMed] [Google Scholar]
- Elowitz MB, Levine AJ, Siggia ED, and Swain PS (2002). Stochastic gene expression in a single cell. Science 297, 1183–1186. [DOI] [PubMed] [Google Scholar]
- Espinosa JM, and Emerson BM (2001). Transcriptional regulation by p53 through intrinsic DNA/chromatin binding and site-directed cofactor recruitment. Mol. Cell 8, 57–69. [DOI] [PubMed] [Google Scholar]
- Ferraro T, Esposito E, Mancini L, Ng S, Lucas T, Coppey M, Dostatni N, Walczak AM, Levine M, and Lagha M (2016). Transcriptional Memory in the Drosophila Embryo. Curr. Biol 26, 212–218. [DOI] [PMC free article] [PubMed] [Google Scholar]
- Friedrich D, Friedel L, Herrmann A, Preibisch S, and Loewer A (2019). Stochastic transcription in the p53-mediated response to DNA damage is modulated by burst frequency. bioRxiv 679449; doi: 10.1101/679449 [DOI] [PMC free article] [PubMed] [Google Scholar]
- Fritzsch C, Baumgärtner S, Kuban M, Steinshorn D, Reid G, and Legewie S (2018). Estrogen-dependent control and cell-to-cell variability of transcriptional bursting. Mol. Syst. Biol 14, e7678. [DOI] [PMC free article] [PubMed] [Google Scholar]
- Geva-Zatorsky N, Rosenfeld N, Itzkovitz S, Milo R, Sigal A, Dekel E, Yarnitzky T, Liron Y, Polak P, Lahav G, et al. (2006). Oscillations and variability in the p53 system. Mol. Syst. Biol 2. [DOI] [PMC free article] [PubMed] [Google Scholar]
- Hafner A, Stewart-Ornstein J, Purvis JE, Forrester WC, Bulyk ML, and Lahav G (2017a). p53 pulses lead to distinct patterns of gene expression albeit similar DNA-binding dynamics. Nat. Struct. Mol. Biol 24, 840–847. [DOI] [PMC free article] [PubMed] [Google Scholar]
- Hanson RL, Porter JR, and Batchelor E (2019). Protein stability of p53 targets determines their temporal expression dynamics in response to p53 pulsing. J. Cell Biol [DOI] [PMC free article] [PubMed] [Google Scholar]
- Ishibashi T, Dangkulwanich M, Coello Y, Lionberger TA, Lubkowska L, Ponticelli AS, Kashlev M, and Bustamante C (2014). Transcription factors IIS and IIF enhance transcription efficiency by differentially modifying RNA polymerase pausing dynamics. Proc. Natl. Acad. Sci. U. S. A 111, 3419–3424. [DOI] [PMC free article] [PubMed] [Google Scholar]
- Jung Y-S, Qian Y, and Chen X (2010). Examination of the expanding pathways for the regulation of p21 expression and activity. Cell. Signal 22, 1003–1012. [DOI] [PMC free article] [PubMed] [Google Scholar]
- Karanam K, Kafri R, Loewer A, and Lahav G (2012). Quantitative live cell imaging reveals a gradual shift between DNA repair mechanisms and a maximal use of HR in mid S phase. Mol. Cell 47, 320–329. [DOI] [PMC free article] [PubMed] [Google Scholar]
- Lahav G, Rosenfeld N, Sigal A, Geva-Zatorsky N, Levine AJ, Elowitz MB, and Alon U (2004). Dynamics of the p53-Mdm2 feedback loop in individual cells. Nat. Genet 36, 147–150. [DOI] [PubMed] [Google Scholar]
- Lane K, Van Valen D, DeFelice MM, Macklin DN, Kudo T, Jaimovich A, Carr A, Meyer T, Pe’er D, Boutet SC, et al. (2017). Measuring Signaling and RNA-Seq in the Same Cell Links Gene Expression to Dynamic Patterns of NF-κB Activation. Cell Syst 4, 458–469.e5. [DOI] [PMC free article] [PubMed] [Google Scholar]
- Larson DR, Fritzsch C, Sun L, Meng X, Lawrence DS, and Singer RH (2013). Direct observation of frequency modulated transcription in single cells using light activation. Elife 2, e00750. [DOI] [PMC free article] [PubMed] [Google Scholar]
- Lenstra TL, Coulon A, Chow CC, and Larson DR (2015). Single-Molecule Imaging Reveals a Switch between Spurious and Functional ncRNA Transcription. Molecular Cell 60, 597–610. [DOI] [PMC free article] [PubMed] [Google Scholar]
- Li C, Cesbron F, Oehler M, Brunner M, and Höfer T (2018). Frequency Modulation of Transcriptional Bursting Enables Sensitive and Rapid Gene Regulation. Cell Syst 6, 409–423.e11. [DOI] [PubMed] [Google Scholar]
- Neuert G, Munsky B, Tan RZ, Teytelman L, Khammash M, and van Oudenaarden A (2013). Systematic identification of signal-activated stochastic gene regulation. Science 339, 584–587. [DOI] [PMC free article] [PubMed] [Google Scholar]
- Paek AL, Liu JC, Loewer A, Forrester WC, and Lahav G (2016). Cell-to-Cell Variation in p53 Dynamics Leads to Fractional Killing. Cell 165, 631–642. [DOI] [PMC free article] [PubMed] [Google Scholar]
- Park HY, Lim H, Yoon YJ, Follenzi A, Nwokafor C, Lopez-Jones M, Meng X, and Singer RH (2014). Visualization of dynamics of single endogenous mRNA labeled in live mouse. Science 343, 422–424. [DOI] [PMC free article] [PubMed] [Google Scholar]
- Peshkin L, Wühr M, Pearl E, Haas W, Freeman RM Jr, Gerhart JC, Klein AM, Horb M, Gygi SP, and Kirschner MW (2015). On the Relationship of Protein and mRNA Dynamics in Vertebrate Embryonic Development. Dev. Cell 35, 383–394. [DOI] [PMC free article] [PubMed] [Google Scholar]
- Porter JR, Fisher BE, and Batchelor E (2016). p53 Pulses Diversify Target Gene Expression Dynamics in an mRNA Half-Life-Dependent Manner and Delineate Co-regulated Target Gene Subnetworks. Cell Syst 2, 272–282. [DOI] [PMC free article] [PubMed] [Google Scholar]
- Purvis JE, Karhohs KW, Mock C, Batchelor E, Loewer A, and Lahav G (2012). p53 dynamics control cell fate. Science 336, 1440–1444. [DOI] [PMC free article] [PubMed] [Google Scholar]
- Purvis JE, and Lahav G (2013). Encoding and decoding cellular information through signaling dynamics. Cell 152, 945–956. [DOI] [PMC free article] [PubMed] [Google Scholar]
- Reyes J, Chen J-Y, Stewart-Ornstein J, Karhohs KW, Mock CS, and Lahav G (2018). Fluctuations in p53 Signaling Allow Escape from Cell-Cycle Arrest. Mol. Cell 71, 581–591.e5. [DOI] [PMC free article] [PubMed] [Google Scholar]
- Rodriguez J, Ren G, Day CR, Zhao K, Chow CC, and Larson DR (2019). Intrinsic Dynamics of a Human Gene Reveal the Basis of Expression Heterogeneity. Cell 176, 213–226.e18. [DOI] [PMC free article] [PubMed] [Google Scholar]
- Sakaue-Sawano A, Kurokawa H, Morimura T, Hanyu A, Hama H, Osawa H, Kashiwagi S, Fukami K, Miyata T, Miyoshi H, et al. (2008). Visualizing spatiotemporal dynamics of multicellular cell-cycle progression. Cell 132, 487–498. [DOI] [PubMed] [Google Scholar]
- Scholes C, DePace AH, and Sánchez Á (2017). Combinatorial Gene Regulation through Kinetic Control of the Transcription Cycle. Cell Syst 4, 97–108.e9. [DOI] [PMC free article] [PubMed] [Google Scholar]
- Senecal A, Munsky B, Proux F, Ly N, Braye FE, Zimmer C, Mueller F, and Darzacq X (2014). Transcription factors modulate c-Fos transcriptional bursts. Cell Rep. 8, 75–83. [DOI] [PMC free article] [PubMed] [Google Scholar]
- Sepúlveda LA, Xu H, Zhang J, Wang M, and Golding I (2016). Measurement of gene regulation in individual cells reveals rapid switching between promoter states. Science 351, 1218–1222. [DOI] [PMC free article] [PubMed] [Google Scholar]
- Stewart-Ornstein J, and Lahav G (2016). Dynamics of CDKN1A in Single Cells Defined by an Endogenous Fluorescent Tagging Toolkit. Cell Rep. 14, 1800–1811. [DOI] [PMC free article] [PubMed] [Google Scholar]
- Suter DM, Molina N, Gatfield D, Schneider K, Schibler U, and Naef F (2011). Mammalian genes are transcribed with widely different bursting kinetics. Science 332, 472–474. [DOI] [PubMed] [Google Scholar]
- Taniguchi Y, Choi PJ, Li G-W, Chen H, Babu M, Hearn J, Emili A, and Xie XS (2010). Quantifying E. coli proteome and transcriptome with single-molecule sensitivity in single cells. Science 329, 533–538. [DOI] [PMC free article] [PubMed] [Google Scholar]
- Tkačik G, Callan CG, and Bialek W (2008). Information flow and optimization in transcriptional regulation. Proc. Natl. Acad. Sci. U. S. A [DOI] [PMC free article] [PubMed] [Google Scholar]
- Tusi BK, Wolock SL, Weinreb C, Hwang Y, Hidalgo D, Zilionis R, Waisman A, Huh JR, Klein AM, and Socolovsky M (2018). Population snapshots predict early haematopoietic and erythroid hierarchies. Nature 555, 54–60. [DOI] [PMC free article] [PubMed] [Google Scholar]
- Tyree CM, George CP, Lira-DeVito LM, Wampler SL, Dahmus ME, Zawel L, and Kadonaga JT (1993). Identification of a minimal set of proteins that is sufficient for accurate initiation of transcription by RNA polymerase II. Genes Dev. 7, 1254–1265. [DOI] [PubMed] [Google Scholar]
- Vassilev LT, Vu BT, Graves B, Carvajal D, Podlaski F, Filipovic Z, Kong N, Kammlott U, Lukacs C, Klein C, et al. (2004). In vivo activation of the p53 pathway by small-molecule antagonists of MDM2. Science 303, 844–848. [DOI] [PubMed] [Google Scholar]
- Wang D, and Kudlow JE (1999). Purification and characterization of TEF1, a transcription factor that controls the human transforming growth factor-α promoter. Biochimica et Biophysica Acta (BBA) - Molecular Cell Research 1449, 50–62. [DOI] [PubMed] [Google Scholar]
- Wilson MZ, Ravindran PT, Lim WA, and Toettcher JE (2017). Tracing Information Flow from Erk to Target Gene Induction Reveals Mechanisms of Dynamic and Combinatorial Control. Mol. Cell 67, 757–769.e5. [DOI] [PMC free article] [PubMed] [Google Scholar]
- Yang L, Titlow J, Ennis D, Smith C, Mitchell J, Young FL, Waddell S, Ish-Horowicz D, and Davis I (2017). Single molecule fluorescence in situ hybridisation for quantitating posttranscriptional regulation in Drosophila brains. Methods 126, 166–176. [DOI] [PMC free article] [PubMed] [Google Scholar]
Associated Data
This section collects any data citations, data availability statements, or supplementary materials included in this article.
Supplementary Materials
Movie S1: Tracking dynamics of p53 protein, p21 transcription and p21 protein in live single cells. Example of single cells with the triple reporter system imaged for ~43h after inducing DNA damage (10Gy x-ray). Time stamp indicates hours post DNA damage.
Data Availability Statement
Quantification of single cell imaging data and code that was used to generate figures (in Matlab) are available at: https://data.mendeley.com/datasets/nwt5m8ktgt/draft?a=7eb1bbbe-5963–484e-9f4b-5bb1f0a2b057