

Abstract
Sex chromosome aneuploidies (SCAs) are the most commonly occurring aneuploidies in children with a collective prevalence rate of 1 in 500 live births. Prior research has documented SCAs are associated with an increased risk for early expressive language and gross motor delays, learning disorders, ADHD, autism spectrum disorder, anxiety, and executive function problems. Although SCAs have been historically under-diagnosed in young children, recent advances in noninvasive prenatal testing have resulted in an increasing nationwide cohort of infants with confirmed diagnoses. Consequently, early childhood support systems must prepare for an influx of children with known risks for associated developmental delays and potential school problems. This national survey aimed to update our understanding of current early childhood intervention services for young children with SCA in the United States and to describe parent perspectives and priorities. Descriptive statistics, chi-square tests, and logistic regression models controlling for parent education revealed a majority of respondents reported receiving public early childhood intervention services with speech therapy as the most common service. There were significant differences in early childhood intervention services by timing of diagnosis (prenatal vs. postnatal), number of sex chromosomes (trisomy vs. tetra/pentasomy), and geographic location. Parents described interventions as desirable and effective yet also difficult to obtain due to issues with the SCA phenotype, lack of provider knowledge, and challenges navigating the intervention systems. Results support the need for enhanced provider training in SCAs, policy change for early childhood intervention qualification criteria for SCA conditions, and collaboration between medical and early childhood settings.
Keywords: developmental delay, early childhood intervention, Klinefelter syndrome, sex chromosome aneuploidy, |X and Y variations| early childhood special education
Sex chromosome aneuploidies (SCAs) are the most commonly occurring aneuploidies in children caused by additional sex chromosomes (X or Y), resulting in karyotypes that are trisomic (47,XXY; 47,XYY; 47,XXX) tetrasomic (48,XXXX; 48,XXYY; 48,XXXY; 48,XYYY) and pentasomic (49,XXXXX; 49,XXXYY; 49,XXXXY; 49,XXYYY; 49,XYYYY), with a collective prevalence of ~1 in 500 live births (Berglund et al., 2019; Coffee et al., 2009; Hamerton, Canning, Ray, & Smith, 1975; Jacobs, 1979; Nielsen, 1990). SCA conditions are associated with a constellation of phenotypic attributes with overlapping variability between and within each genotype. In undiagnosed individuals, many of these phenotypic features are underappreciated during the early childhood years as they are either relatively common in the general population (mild motor and language delays) or the features do not present until later childhood or adolescence (tall stature, learning problems, testosterone deficiency) (Ross et al., 2012; Tartaglia, Ayari, Howell, D’Epagnier, & Zeitler, 2011; Wigby et al., 2016). SCA conditions often lack the more common indications for genetic testing during the early childhood years such as notable dysmorphic features, birth defects, or intellectual disability. Historically, SCA diagnoses for young children (under-age 5) in the U.S. have been mostly limited to those prenatally identified (Abramsky & Chapple, 1997), precluding unidentified children from receiving critical early childhood intervention services shown to mitigate risks for developmental delays in the general population (Shonkoff et al., 2009). Recent advances in noninvasive prenatal testing (NIPT) and subsequent obstetric professional societies issuing position statements for all women to be offered testing (Rose & Mercer, 2016), provide a growing opportunity to increase SCA prenatal ascertainment. Notwithstanding known variations in test accuracy and parent decision-making about termination (Ramdaney, Hoskovec, Harkenrider, Soto, & Murphy, 2018; Shaffer, Caughey, & Norton, 2006), NIPT serves to identify a larger nationwide cohort of infants, confirmed by diagnostic testing pre- or postnatally, with SCAs who are subsequently also at risk for associated developmental delays. Parents of children with a confirmed diagnosis are commonly encouraged to proactively monitor development and seek evaluations or supports given these known risks. Consequently, early childhood support systems must prepare for this influx of children diagnosed with SCAs and the associated need to address presenting or potential developmental delays.
1 |. EARLY CHILDHOOD INTERVENTION SERVICES
In the U.S., public disability services for young children are provided under the 2004 Individuals with Disabilities Education Act (IDEA), Parts C (birth to 3 years of age) and B (3 to 5 years of age) through the US Department of Education (IDEA, 2004). Table 1 provides a list of commonly used acronyms in early childhood interventions and special education. The child find mandate of IDEA requires states to provide multidisciplinary evaluations to allow for the identification and referral of children with disabilities to intervention services. Infant and toddler services (ages birth to 3 years), known as Early Intervention (EI), are typically coordinated by school districts or Departments of Health and Human Services, depending on the state. EI therapies are delivered through an Individualized Family Service Plan (IFSP) in the child’s “natural environment” such as the home or daycare setting. The emphasis of EI is on improving functional skills required to participate in the family routine, and engaging parents as active partners in the therapeutic process. Starting at age three, service delivery is managed by the local school district and delivered through an Individualized Education Program (IEP) in an early childhood special education (ECSE) setting such as preschool. Disability categories under IDEA for an IEP include developmental delay, autism, other health impairment, specific learning disability, intellectual disability, and emotional disturbance. Each category has a specific set of criteria required for an educational diagnosis. ECSE aims to prepare young children with the pre-academic, social-emotional, and behavioral skills required for kindergarten readiness.
TABLE 1.
Common terms in early childhood intervention services
| Abbreviation | Title | Definition |
|---|---|---|
| Category 1 or diagnosed conditions | Category 1 list of qualifying conditions | State determined lists of diagnosed conditions with high probability of resulting in a developmental delay that qualify infants and toddlers for early intervention services. |
| Child find | The child find mandate | Part of federal law (IDEA) requiring states to identify, locate, and evaluate all children with disabilities or suspected disabilities. |
| ECSE | Early childhood special education | Publicly funded support services for preschool children with disabilities ages 3–5 years. |
| EI | Early intervention | Publicly funded support services for infants and toddlers with disabilities ages birth to 36-months. |
| IDEA, 2004 | Individuals with disabilities education act of 2004 | U.S. special education law, first enacted in 1975 and reauthorized in 2004, to ensure that all students receive a free and appropriate public education regardless of disability status. |
| IEP | Individualized education program | Legally binding special education school support plan for children with disabilities ages 3–21 years. |
| IFSP | Individual family service plan | Legally binding early intervention support plan for children with disabilities under the age of three and their families. |
| Part B | IDEA, Part B | Section of the IDEA law mandating that states provide special education supports for all children with disabilities ages 3–21 years, specifically including preschool students. |
| Part C | IDEA, Part C | Section of the IDEA, first authorized in 1986, mandating states provide early intervention support services for infants and toddlers (under 36-months). |
2 |. EARLY CHILDHOOD INTERVENTION IN SCA
Developmental outcomes are highly variable in SCA, depending on the type (X or Y) and number (trisomy vs. tetrasomy/pentasomy) of extra chromosomes, and timing of diagnosis (prenatal versus postnatal diagnosis). Despite this variability, there is a clear pattern of increased risk across SCAs for early developmental delays. Expressive language and gross motor skills are domains of particular concern with 50–75% of young children with SCA demonstrating delayed communication and motor milestones in early prospective studies (Bender, Linden, & Robinson, 1993; Robinson, Bender, & Linden, 1990; Salbenblatt, Meyers, Bender, Linden, & Robinson, 1987, 1989). In older children with SCA, average IQ scores range from 5 to 15 points lower than the mean in the general population, and all SCA conditions are associated with increased risk for ADHD, social skill deficits, learning disabilities, and executive function deficits (Boada, Janusz, Hutaff-Lee, & Tartaglia, 2009; Tartaglia, Ayari, Hutaff-Lee, & Boada, 2012; van Rijn et al., 2014; van Rijn & Swaab, 2015; Wigby et al., 2016). School-aged children with SCA have been shown to have lower overall school performance than expected based on sibling controls, with 50–75% requiring some type of special education supports (Bender, Linden, & Harmon, 2001; Rovet, Netley, Keenan, Bailey, & Stewart, 1996). With this constellation of known risks, we can hypothesize that many children with SCA could benefit from intervention services at an early age.
Unfortunately, research on early childhood intervention services for children with SCAs is outdated and limited in scope, with little to no information on early therapies for young children with SCA in the U.S. Prospective studies from the 1960s to 1970s followed small cohorts of neonatally diagnosed children with SCA throughout the lifespan, however research outcomes prior to age 6 primarily focused on individual medical and early developmental features rather than rates of public intervention services. One Danish study (Nielsen & Sorensen, 1979) reported that 9 of the 16 young children with SCA in their study cohort received early speech therapy services, and 3 of the 6 participants who were enrolled in kindergarten had “school problems” as reported by classroom teachers. Specific problematic preschool classroom behaviors included social difficulties (shyness, isolation, immaturity, and aggression), overreliance on teachers, and early learning problems.
Early intervention services and special education laws in the U.S. have changed drastically since these studies were conducted with the introduction of Part C to IDEA in 1986, a movement toward more inclusive special education settings (Gargiulo & Bouck, 2020), and a new appreciation for the critical role of early experiences on brain development (Shonkoff et al., 2009). It is necessary to update our understanding of the way young children with SCAs are supported in the U.S. in order to provide guidance to families as they navigate intervention systems, as well as to inform providers and policy makers about the needs for this unique pediatric population. This study aimed to quantitatively assess the current state of early childhood intervention services in a sample of young children with SCA, as reported by parent survey, and to qualitatively describe parent priorities and perspectives on early childhood intervention services and systems.
3 |. METHODS
3.1 |. Study design and recruitment
This study was part of a larger, cross-sectional, electronic international survey using mixed methods to assess early therapies, school supports, and educational outcomes for children with SCA conditions. Participants were recruited through social media websites and email lists for the eXtraordinarY Kids Clinic of Children’s Hospital Colorado and the Association for X and Y Chromosome Variations (AXYS). Data were collected between May 15 and July 15, 2019. Inclusion criteria were parents or caregivers of children ages birth to 21-years with a postnatally confirmed diagnosis of SCA. All participants provided consent for research prior to completing the survey, results were kept anonymous, and the study was approved by the Colorado Multiple Institutional Review Board (#19–0555).
A total of 550 surveys were returned. The subset of data used in this analysis included only those participants living in the U.S. with children who had not yet entered Kindergarten (n = 105). Given the difference in early intervention programs in other countries, international respondents were excluded from analysis. Respondents with children over 5.5 years of age were not included in this specific analysis to allow for evaluation of data in the context of current EI practices and to limit the impact of inconsistent parent recall of services. Results from parents of school-age children and adolescents will be presented in a subsequent manuscript.
3.2 |. Instrument
Study data were collected and managed using REDCap electronic data capture tools hosted at The University of Colorado Anschutz Medical Campus (Harris et al., 2009). REDCap (Research Electronic Data Capture) is a secure, web-based application designed to support data capture for research studies. Questions were developed and revised by research team members with expertise in early therapies, special education law, EI/ECSE, and SCA conditions. A draft was piloted with two parents of children with SCA and parent feedback led to several revisions of the instrument to ensure content and face validity. The survey consisted primarily of closed-ended and multiple-choice questions to be used for quantitative analysis to describe the supports for this population with demographic questions based on standards set by the National Institutes of Health (NIH). Open-ended questions were also included to elicit emergent themes about parent perspectives on early childhood supports for young children with SCAs. Respondents were asked to report on their child’s current early intervention services; those with children ages 3–5 years were also asked to retrospectively report on their child’s experiences with early intervention services when they were under the age of three. Surveys took an estimated 5–20 min for parents to complete depending on the length of qualitative responses and the age of their child.
3.3 |. Analysis
Descriptive statistics (frequency, percentage, mean, SD, range) were calculated to describe the demographic characteristics of the sample and intervention service provision. Results were stratified by child ages and service delivery systems (infant/toddler for birth to 3-years and preschool for 3–5.5 years), timing of diagnosis (pre- vs. postnatal within the trisomy SCAs), type of SCA (trisomy vs tetra- or pentasomy conditions), and US region (U.S. Census Bureau, 2015) (Northeast, Midwest, South, West; see Table 2). Chi-square and Fisher’s exact tests were used to compare groups with significance set at p < .05. Because these analyses were intended to be descriptive and hypothesis-generating, no adjustments were made for multiple comparisons. Logistic regression models were used to control for the effects of parent education (advanced degree or no advanced degree), and all statistics reported in text are controlled for parent education unless otherwise stated. All statistical analyses were conducted in SPSS 26 and Prism Graphpad v8.1.2.
TABLE 2.
Participant demographics
| Total (N = 105) | Trisomy SCA (N = 90) | Tetrasomy/Pentasomy SCA (N = 15) | p-value | |
|---|---|---|---|---|
| Age (years.): M ± SD, range | ||||
| Child | 2.3 ± 1.61, 0–5.5 | 2.1 ± 0.16 | 3.7 (0.33) | .000 |
| Parent respondent | 37.4 ± 5.38, 21–49 | 38 ± 0.54 | 33.2 (1.3) | .001 |
| Age group | .092 | |||
| Infant and toddler | N = 52 (49.5%) | 48 (53.3%) | 4 (26.7%) | |
| Preschool | N = 53 (50.5%) | 42 (46.7%) | 11 (73.3%) | |
| SCA condition | ||||
| 47,XXX | 11 (10.5%) | 11 (12.2%) | – | .531 |
| 47,XXY | 72 (68.6%) | 72 (80%) | – | |
| 47,XYY | 7 (6.7%) | 7 (7.8%) | – | |
| 48,XXYY | 9 (8.6%) | – | 9 (60%) | .443 |
| 48,XXXY | 4 (3.8%) | – | 4 (26.7%) | |
| 49,XXXXY | 1 (1%) | – | 1 (6.7%) | |
| 49,XXXXX | 1 (1%) | – | 1 (6.7%) | |
| Child gender | .692 | |||
| Male | 93 (88.6%) | 79 (87.8%) | 14 (93.3%) | |
| Female | 12 (11.4%) | 11 (12.2%) | 1 (6.7%) | |
| Parent respondent | .443 | |||
| Mother | 94 (89.5%) | 79 (87.8%) | 15 (100%) | |
| Father | 10 (9.5%) | 10 (11.1%) | 0 (0%) | |
| Other | 1 (1%) | 1 (1.1%) | 0 (0%) | |
| Responding parent’s Education | .011 | |||
| ≤ Bachelor’s degree | 59 (56.2%) | 46 (51.1%) | 13 (86.7%) | |
| Advanced degree | 46 (43.8%) | 44 (48.9%) | 2 (13.4%) | |
| Second parent’s education | .227 | |||
| ≤ Bachelor’s degree | 76 (72.4%) | 63 (70%) | 13 (86.7%) | |
| Advanced degree | 29 (27.6%) | 27 (30%) | 2 (13.3%) | |
| Timing of SCA diagnosis | <.001 | |||
| Prenatal | 76 (72.4%) | 74 (82.2%) | 2 (13.3%) | |
| Postnatal | 29 (27.6%) | 16 (17.8%) | 13 (86.7%) | |
| Developmental diagnoses | ||||
| Speech language disorder | 29 (27.6%) | 19 (21.1%) | 10 (66.7%) | .001 |
| Autism spectrum disorder | 5 (4.8%) | 1 (1.1%) | 4 (26.7%) | .001 |
| Anxiety disorder | 6 (5.7%) | 5 (5.6%) | 1 (6.7%) | |
| ADHD | 3 (2.9%) | 2 (2.2%) | 1 (6.7%) | |
| Regiona | .140 | |||
| Northeast | 16 (15.2%) | 13 (14.4%) | 3 (20%) | |
| Midwest | 27 (25.7%) | 20 (22.2%) | 7 (46.7%) | |
| South | 33 (31.4%) | 31 (34.4%) | 2 (13.3%) | |
| West | 29 (27.6%) | 26 (28.9%) | 3 (20%) |
US regions as designated by the US Census Bureau. Northeast: CT, MA, ME, NH, NJ, NY, PA, RI, VT; Midwest: IA, IL, IN, KS, MI, MN, MO, NE, ND, OH, SD, WI; South: AL, AR, DC, DE, FL, GA, KY, LA, MD, MS, NC, OK, SC, TN, TX, VA, WV; West: AK, AZ, CA, CO, HI, ID, MT, NM, NV, OR, UT, WA WY.
Qualitative analytic procedures included a thematic analysis of parent responses to open-ended survey questions. Open-ended survey responses were uploaded into ATLAS.ti v8.3.1 software for data management and coding purposes. Two independent coders (TT and SD) with training and expertise in qualitative methods, SCA, and early childhood interventions utilized a bioecological systems theory as the conceptual framework for analysis. Bioecological systems theory acknowledges the transactional relationships between an individual and his or her surrounding support systems and how these interactions impact human development (Bronfenbrenner, 1994). Coding was both deductive (assigning a bioecological system level code to each unit of meaning, for example, individual, micro, meso, exo, macro) and inductive (open coding derived directly from data) (Creswell & Clark, 2017). Consensus coding was achieved through team discussion and an iterative reexamination of the data until we reached saturation of codes. Codes were collapsed and combined into broad categories, resulting in a thematic description of parent priorities in early childhood intervention services. We ensured credibility of themes through triangulation with quantitative survey results and discussion with a multidisciplinary team of SCA providers (genetic counselor, developmental pediatrician, pediatric endocrinologist, and psychologist). Member checking was conducted with two parents of older children (one school-age, one young adult) with SCA, both of whom are active in the SCA advocacy and support community, to check for transferability (Carlson, 2010). Both parents indicated results resonated with their own experiences and those they have heard in support groups and on discussion forums.
4 |. RESULTS
4.1 |. Sample
Demographics for the 105 survey participants and their children with SCA are presented in Table 2. The sample was evenly split between the infant and toddler (n = 52) and preschool (n = 53) groups, ages birth to 5.5 years of age (M ± SD, 2.34 ± 1.61) and was well-distributed across major U.S. regions (Northeast = 15%, Midwest = 28%, South = 31%, West = 28%) with respondents from 32 out of 50 states. A majority of survey respondents were mothers (89.5%); 72.4% reported their child had received a prenatal SCA diagnosis. Trisomy conditions (XXY, XYY, XXX; n = 90) were more common than tetrasomy or pentasomy conditions (XXYY, XXXY, XXXXY, XXXXX; n = 15) and there were several significant differences between the trisomy and tetra/pentasomy groups. Survey respondents in the trisomy group were older (38.04 ± 0.54 vs. 33.2 ± 1.3, p = .001) and more likely to have an advanced degree (e.g., higher than a bachelor’s degree) than parents in the tetra/pentasomy group (48.9% vs. 13.4%, p = .011). Children with trisomy conditions were younger (2.12 ± 0.16 vs. 3.67 ± 0.33, p < .001) and more likely to have had a prenatal diagnosis (82.2 vs. 13.3%, p < .001). Children with tetra/pentasomy conditions were more likely to carry clinical diagnoses of language disorder (21.1 vs. 66.7%, p = .001) and autism spectrum disorder (ASD; 1.1 vs. 26.7%, p = .001) compared to the trisomy group.
4.2 |. Early childhood intervention services in SCA
Survey results indicate the majority of respondents in this study reported their child received public and/or private early childhood intervention services prior to entering kindergarten (Figure 1). Public early childhood intervention services were common across the SCA karyotypes; over half of all respondents reported their child received EI and/or ECSE services at some point in early childhood. Specifically, 63.6% of girls with 47,XXX, 58.3% of boys with 47,XXY, 71.4% of boys with 47,XYY, and 86.7% of children with tetra/pentasomy SCA reported receiving public (EI/ECSE) intervention services. Private-pay therapies were also common, with 63.6% of girls with 47,XXX, 70.8% of boys with 47,XXY, 71.4% of boys with 47,XYY, and 80% of children with tetra/pentasomy SCA receiving some kind of private (insurance/cash pay) therapies in their early childhood years. As can be seen in Figure 2, many reported a combination of private and public therapies. The proportion of patients receiving private therapies did not differ based on parent education level (p = .390).
FIGURE 1.
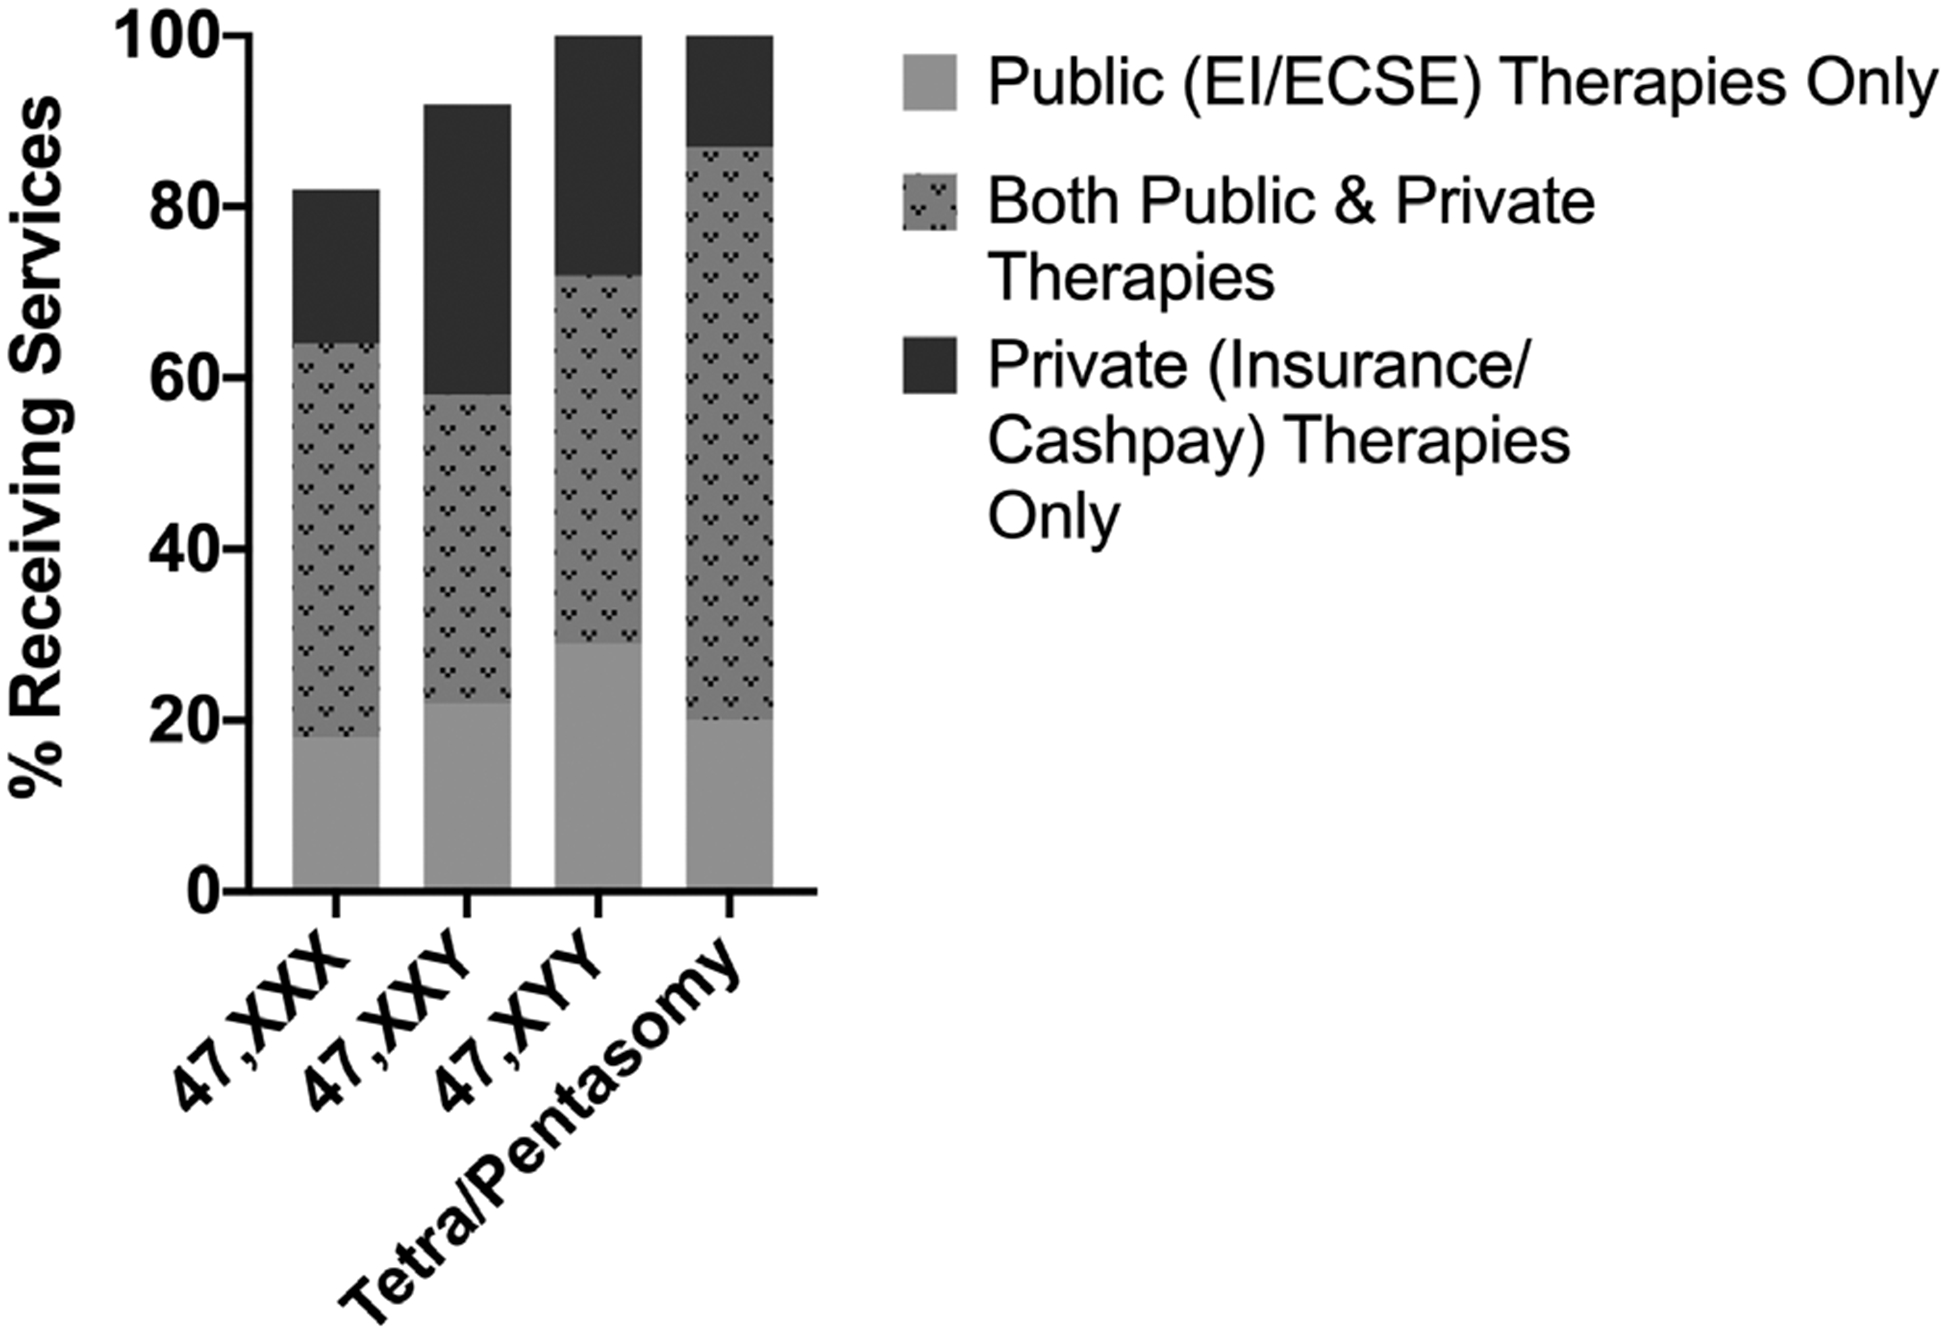
Early childhood intervention services by SCA condition. Percentage of children with SCA conditions receiving public early childhood intervention services (EI/ECSE), private early therapies (insurance/cashpay), and both public and private therapies. Total n = 105, 47,XXX = 11, 47,XXY = 72; 47,XYY = 7; tetra/pentasomy SCA = 15
FIGURE 2.
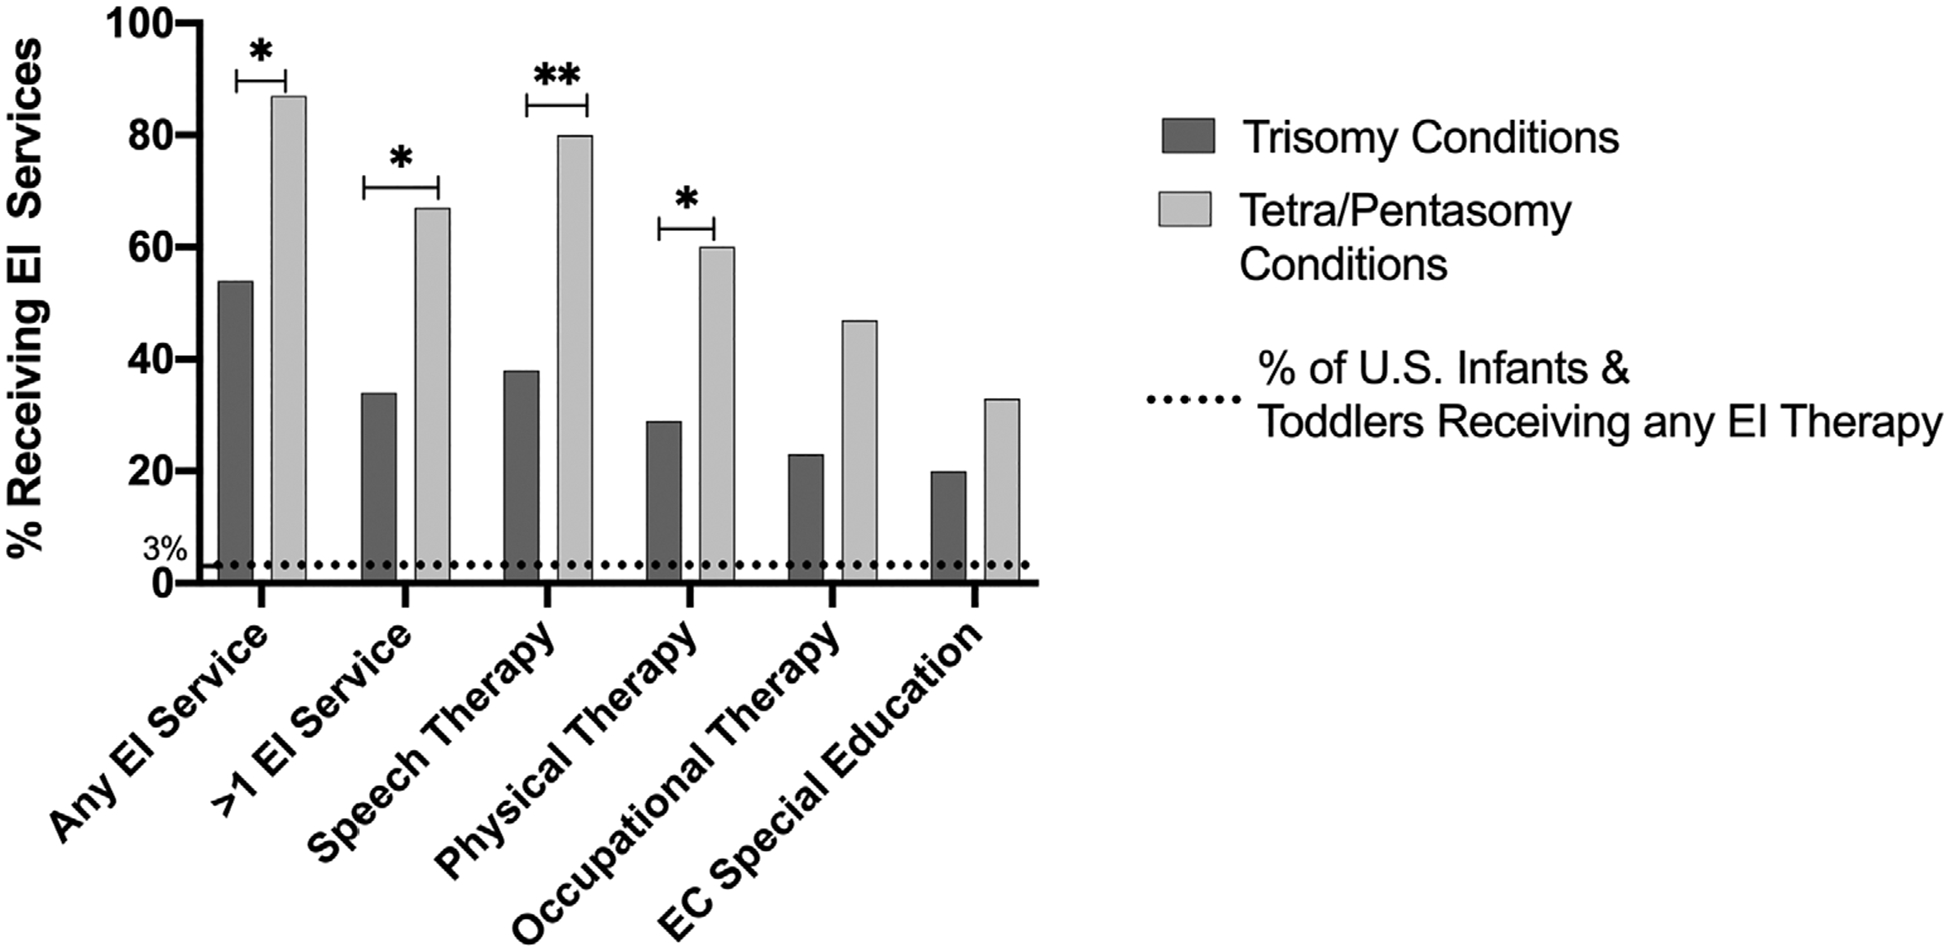
Early intervention (EI) services in trisomy versus tetra/pentasomy SCA. Percent of respondents with trisomy and tetra/pentasomy SCA who report receiving EI services through Part C of IDEA. Horizontal line indicates percent of U.S. children under age three who receive EI services, as reported by the Office of Special Education Programs (OSEP). *p < .05, **p < .01
4.2.1 |. Infant and toddler group
Over 60% of the current infant and toddler group (n = 52) reported their child received a multidisciplinary EI evaluation through their local Child Find agency and over half (59%) of the total survey respondents (n = 105) reported their infant/toddler received some type of EI services (Table 3). The most frequently reported EI service was EI speech therapy (43.8%), followed by EI physical therapy (33.3%), EI occupational therapy (26.7%), and EI early developmental stimulation provided by an infant and toddler early childhood special educator (21.9%). There were no significant differences in rates of reported EI services between parents with advanced degrees and those without advanced degrees (p = .692). A majority of the infants and toddlers currently receiving EI services (n = 23) received 1 hr or less of EI therapies per week in the home, with 70% reporting 30–60 min per week, 26% reporting less than 30 min per week, and only one respondent reporting over 60 min per week.
TABLE 3.
Early childhood intervention services
| Infant and toddler group | ||||
|---|---|---|---|---|
| Total (n = 52)a (n = 105)b (n = 23)c |
Trisomy (n = 48)a (n = 90)b (n = 21)c |
Tetra/pentasomy (n = 4)a (n = 15)b (n = 2)c |
p-value | |
| Received multidisciplinary EI evaluationa | 33 (63.5%) | 30 (62.5%) | 3 (75%) | .372 |
| Receiving or received any early intervention therapyb | 62 (59%) | 49 (54.4%) | 13 (86.7%) | .033 |
| >1 therapy | 41 (39%) | 31 (34.4%) | 10 (66.7%) | .025 |
| Speech therapy | 46 (43.8%) | 34 (37.8%) | 12 (80%) | .009 |
| Physical therapy | 35 (33.3%) | 26 (28.9%) | 9 (60%) | .047 |
| Occupational therapy | 28 (26.7%) | 21 (23.3%) | 7 (46.7%) | .082 |
| Early developmental stimulation/special education | 23 (21.9%) | 18 (20%) | 5 (33.3%) | .367 |
| Minutes per week of EI therapiesc | .621d | |||
| <30 | 6 (26.1%) | 6 (28.6%) | 0 (0%) | |
| 30–60 | 16 (69.6%) | 14 (66.7) | 2 (100%) | |
| >60 | 1 (4.3%) | 1 (4.8%) | 0 (0%) | |
| Any private therapya | 11 (21.2%) | 8 (16.7%) | 3 (75%) | .042 |
| >1 private therapy | 5 (9.6%) | 2 (4.2%) | 3 (75%) | .007 |
| Speech therapy | 6 (11.5%) | 3 (6.3%) | 3 (75%) | .007 |
| Occupational therapy | 5 (9.6%) | 2 (4.2%) | 3 (75%) | .013 |
| Physical therapy | 9 (17.3%) | 6 (12.5%) | 3 (75%) | .025 |
| Behavior therapy | 1 (1.9%) | 1 (2.1%) | 0 (0%) | na |
| None | 41 (78.8%) | 40 (83.3%) | 1 (25%) | .042 |
| Preschool group | ||||
| Total (n = 53) | Trisomy (n = 42) | Tetra/pentasomy (n = 11) | p-value | |
| Received ECSE evaluation | 40 (75.5%) | 29 (69%) | 11 (100%) | .047d |
| Receiving any ECSE services | 31 (58.5%) | 20 (47.5%) | 11 (100%) | .001d |
| >1 ECSE service | 24 (45.3%) | 15 (35.7%) | 9 (81.8%) | .027 |
| Speech therapy | 24 (45.3%) | 17 (40.5%) | 7 (63.6%) | .297 |
| Physical therapy | 14 (26.4%) | 6 (14.3%) | 8 (72.7%) | .001 |
| Occupational therapy | 12 (22.6%) | 5 (11.9%) | 7 (63.6%) | .002 |
| Preschool/academics | 20 (37.7%) | 11 (26.2%) | 9 (45%) | .006 |
| Social skills support | 10 (18.9%) | 5 (11.9%) | 5 (45.5%) | .046 |
| Minutes per week of ECSE servicese | .295d | |||
| <30 | 2 (6.5%) | 2 (10%) | 0 (0%) | |
| 30–60 | 13 (41.9%) | 9 (45%) | 4 (36.4%) | |
| 60–120 | 7 (22.6%) | 5 (25%) | 2 (18.2%) | |
| >120 | 9 (29%) | 4 (20%) | 5 (45.5%) | |
| Receive services in a preschool setting | 28 | 18 | 10 | .854 |
| Inclusive preschool class | 22 (78.6%) | 14 (77.8%) | 8 (80%) | |
| Self-contained preschool class | 6 (21.4%) | 4 (22.2%) | 2 (20%) | |
| Private preschool | 33 (62.3%) | 28 (66.7%) | 5 (45.5%) | .318 |
| Any private therapy | 23 (43.3%) | 15 (35.7%) | 8 (72.7%) | .030 |
| >1 private therapy | 14 (26.4%) | 6 (14.3%) | 8 (72.7%) | .001 |
| Speech therapy | 21 (39.6%) | 13 (31%) | 8 (72.7%) | .011 |
| Occupational therapy | 14 (26.4%) | 6 (14.3%) | 8 (72.7) | .001 |
| Physical therapy | 9 (17%) | 5 (11.9%) | 4 (36.4%) | .103 |
| Behavior therapy | 6 (11.3%) | 2 (4.8%) | 4 (36.4%) | .019 |
| None | 30 (56.6%) | 27 (64.3%) | 3 (27.3%) | .030 |
Data on multidisciplinary EI evaluations and private infant and toddler therapies are only available for those currently in infant and toddler group (n = 52).
Respondents with children in the Preschool group (n = 53) were asked to provide a retrospective account for some EI questions, and were added to the infant and toddler group (n = 52) for a total n = 105.
This question was only asked to participants with children currently in the infant and toddler age group who are receiving EI therapies (n = 23) in order to ensure more accurate data collection without the potential limitations of imprecise recollection of services delivery minutes from 2 years prior.
Unable to adjust for parent education due to sample size.
This question was only asked to participants with children currently receiving ECSE therapies (n = 31).
Parents of infants and toddlers with trisomy SCA were less likely to report receiving EI services than those with tetra/pentasomy conditions (trisomy = 54.4 vs. tetra/pentasomy = 86.7%, p = .033; Figure 2). Specifically, the tetra/pentasomy group was more likely than the trisomy group to report receiving EI speech therapy (p = .009), EI physical therapy (p = .047), and more than one EI therapy (p = .025), but not more likely to report receiving EI occupational therapy or early developmental stimulation/special education. Within the trisomy group only, there were no significant differences in reported EI service rates or service delivery minutes by timing of diagnosis (pre- vs. postnatal) or by karyotype (47,XXX vs. 47,XXY vs. 47,XYY).
Within the infant and toddler group who reported they were currently receiving services, 21% also reported receiving privately funded therapy outside of EI services (Table 3). Parents of children with trisomy SCA were significantly less likely to report receiving private therapies than those with tetra/pentasomy SCA (trisomy = 16.7% vs. tetra/pentasomy = 75%, p = .042), likely due to more significant developmental delays.
4.2.2 |. Preschool group
Within the preschool sample (n = 53), 75% reported their child received an ECSE multidisciplinary evaluation through their school system and over half (58.5%) reportedly received Part B ECSE services (Table 3). The most frequently reported ECSE service was speech therapy (45.3%), followed by preschool/academic support (37.7%), physical therapy (26.4%), occupational therapy (22.6%), and social skills/behavioral supports (18.9%). There were no significant differences in rates of reported ECSE by parent education. The majority of preschoolers received 2 hr or less of ECSE services per week with 42% reporting 30–60 min of ECSE each week and 23% reporting 60–120 min per week. Nearly 80% of preschoolers with SCA received ECSE in an inclusive setting alongside typically developing peers. There were no significant differences in the proportion of children in inclusive versus self-contained classrooms by age, SCA condition, U.S. region, parent education, timing of diagnosis, or additional developmental diagnoses. As seen in the infant and toddler group, there were significant differences for preschool children with trisomy versus tetra/pentasomy SCA. Parents of children with trisomies were less likely to report having a multidisciplinary evaluation (69 vs. 100%, p < .001) and receiving any ECSE services (47.5 vs. 100%, p = .001). Of note, parents of children in the trisomy group reported receiving significantly fewer therapies than those in the tetra/pentasomy group in all domains other than speech therapy, the ECSE category with the highest rates for all preschoolers.
Within the trisomy preschool group, (n = 42; Table 4, Figure 3), those with a prenatal diagnosis were less likely to report receiving ECSE services (36.4 vs. 88.9%, p = .033). Specifically, parents of postnatally diagnosed preschoolers were more likely to report receiving ECSE speech therapy (p = .011) and more than one ECSE therapy (p = .018). ECSE services were also analyzed by SCA condition within the trisomy conditions (Table 4). Boys with 47,XYY were eliminated from the analysis due to small sample size in the preschool group (n = 2). In an unadjusted chi-square analysis, parents of boys with 47,XXY were significantly more likely to report receiving more than one ECSE service than parents of girls with 47,XXX (p = .037). There were no other significant differences in reports of ECSE services between girls with 47,XXX and boys with 47,XXY.
Table 4.
Preschool trisomy conditions only
| Total (N = 42) | Prenatal N = 33 | Postnatal N = 9 | p-value | 47,XXX N = 8 | 47,XXY N = 32 | p-value | |
|---|---|---|---|---|---|---|---|
| Receiving any ECSE service | 20 (47.6%) | 12 (36.4%) | 8 (88.9%) | .033 | 2 (25%) | 16 (50%) | .229 |
| >1 ECSE service | 15 (35.7%) | 8 (24.2%) | 7 (77.8%) | .018 | 0 | 13 (40.6%) | .037a |
| Speech therapy | 17 (40.5%) | 9 (27.3%) | 8 (88.9%) | .011 | 1 (12.5%) | 13 (43.8%) | .137 |
| Physical therapy | 6 (14.3%) | 4 (12.1%) | 2 (22.2%) | .547 | 0 | 6 (18.8%) | .236a |
| Occupational therapy | 5 (11.9%) | 3 (9.1%) | 2 (22.2%) | .296 | 0 | 5 (15.6%) | .563a |
| Preschool/academics | 11 (26.2%) | 6 (18.2%) | 5 (55.6%) | .111 | 1 (12.5%) | 8 (25%) | .486 |
| Social skills support | 5 (11.9%) | 2 (6.1%) | 3 (33.3%) | .172 | 0 | 4 (12.5%) | .393a |
Unable to adjust for parent education due to sample size.
FIGURE 3.
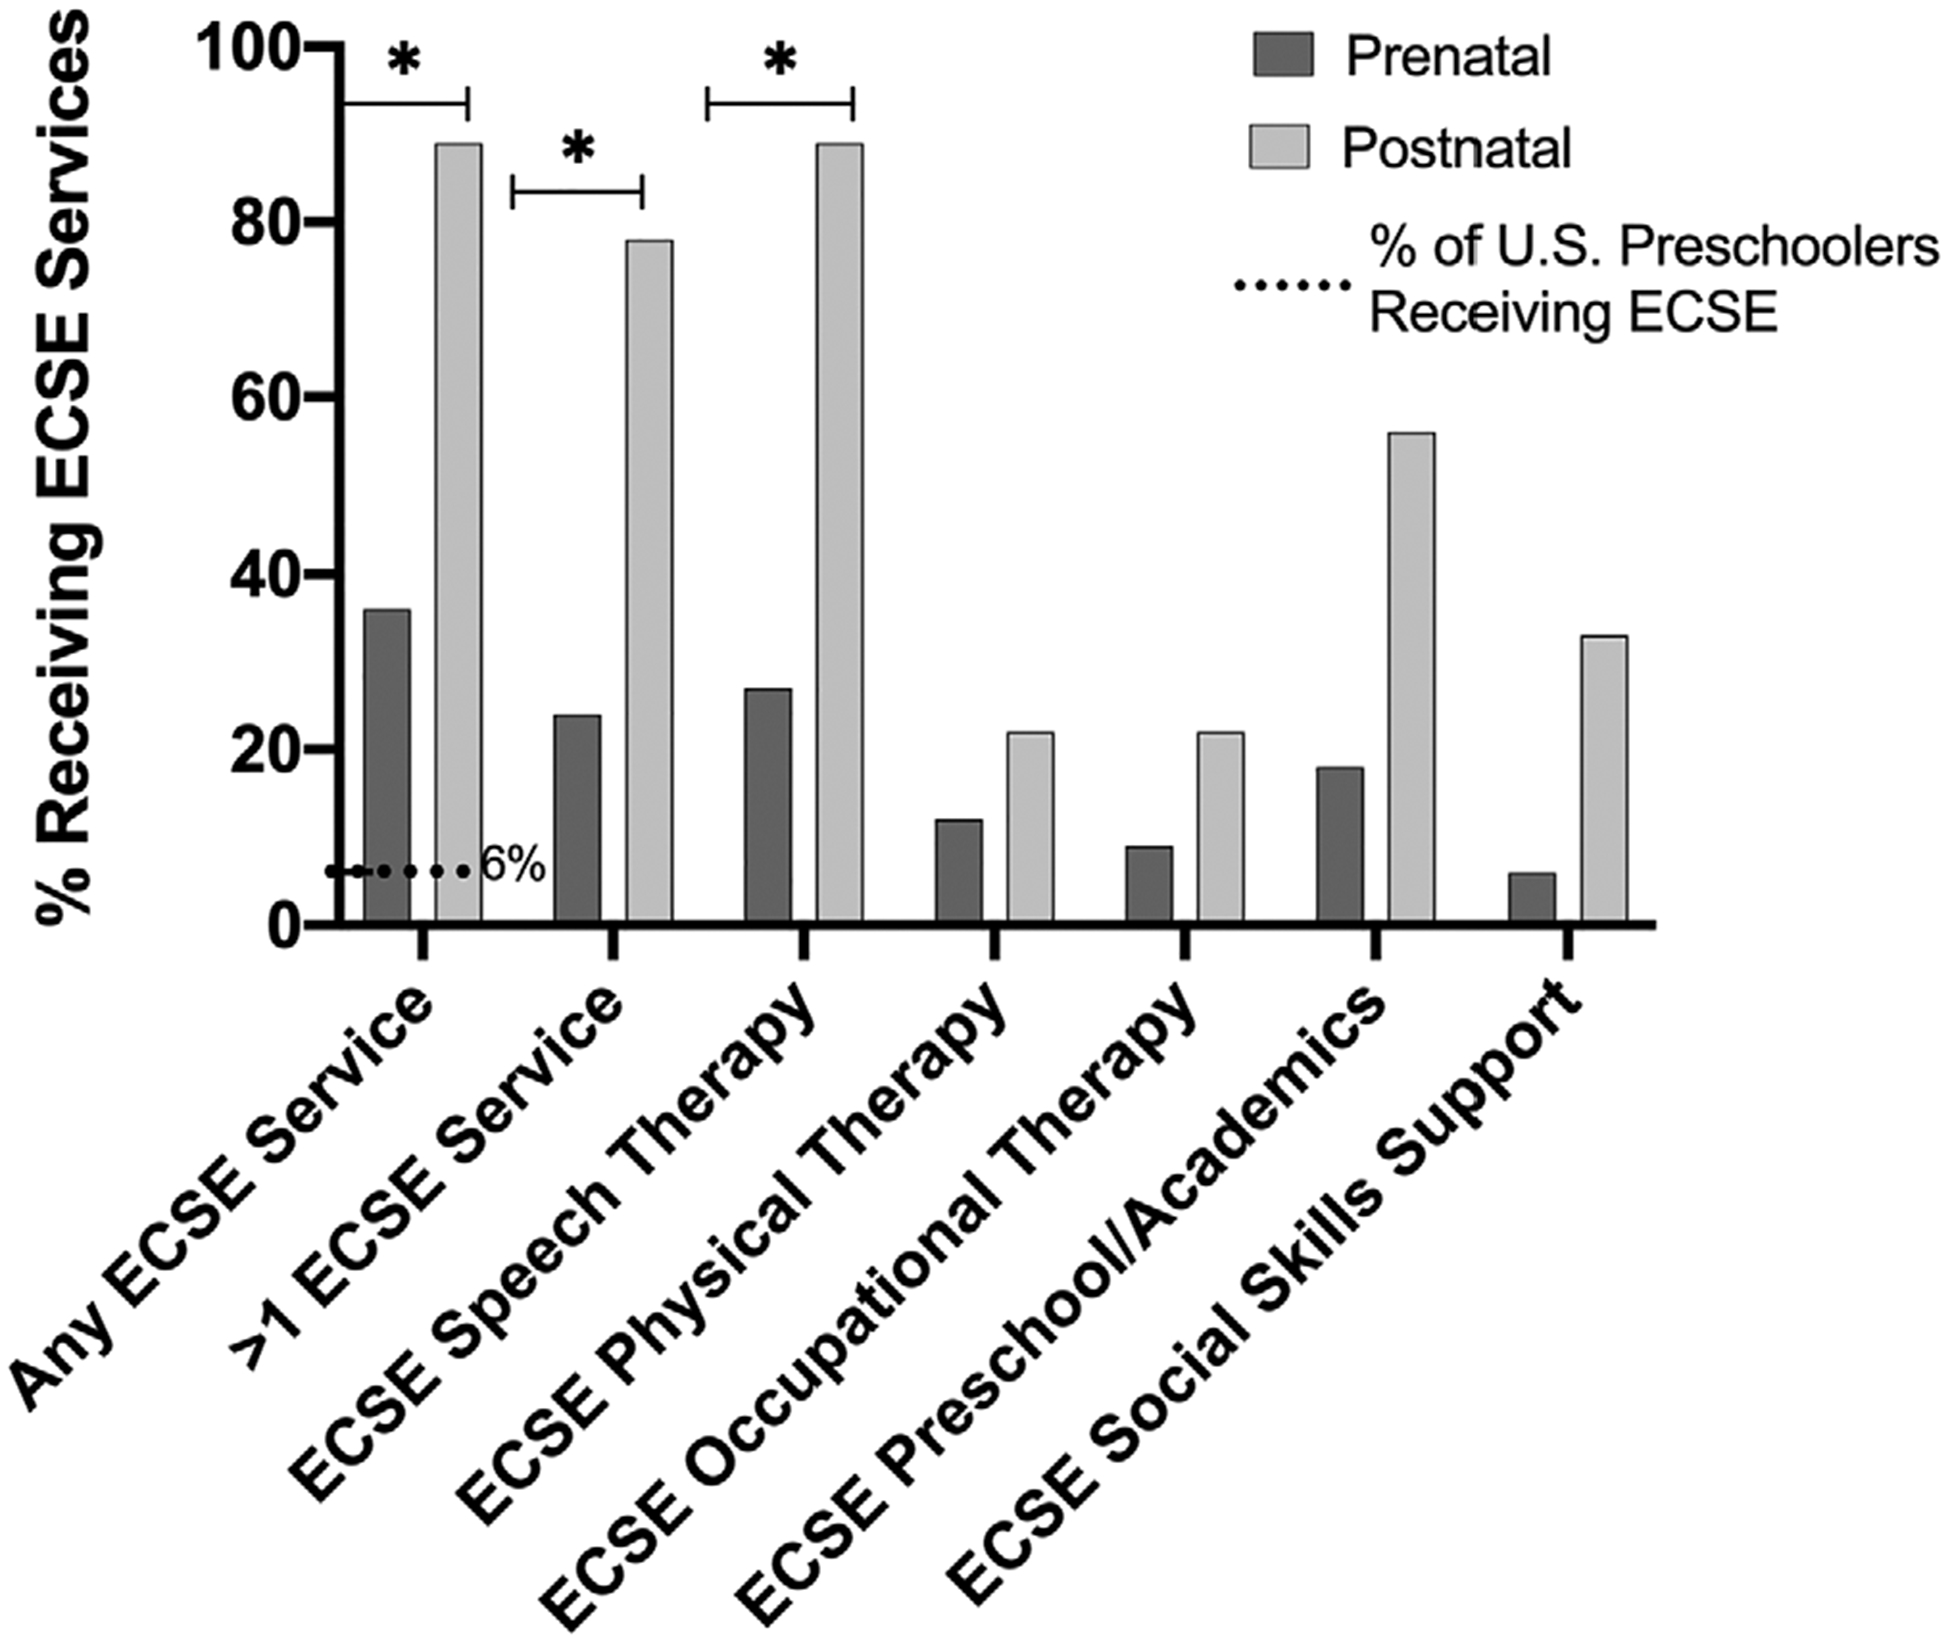
Early childhood special education (ECSE) preschool services in trisomy SCA. Comparing rates of preschool children receiving public ECSE services through Part B of IDEA based on the timing of their trisomy SCA diagnosis (prenatal vs. postnatal). Dotted horizontal line indicates percent of U.S. preschool children who receive any ECSE services, as reported by the Office of Special Education Programs (OSEP). *p < .05
In addition to public ECSE services, a majority of the preschool group also attended private preschool (62.3%), with no significant differences between trisomy and tetra/pentasomy conditions (Table 3). Forty-three percentage of the total preschool group reported some type of private therapy, and those with tetra/pentasomy SCA were significantly more likely to report receiving private therapies than those with trisomy SCA (72.7 vs. 35.7%, p = .030).
4.2.3 |. Provider knowledge of SCA
Parents reported mixed perceptions of EI/ECSE provider knowledge about SCA conditions and how SCA can impact developmental outcomes (Figure 4). Over half reported their child’s provider has little to no information (slightly informed or not informed at all) on SCA conditions and no parents described their child’s provider as “highly informed” about SCA conditions.
FIGURE 4.
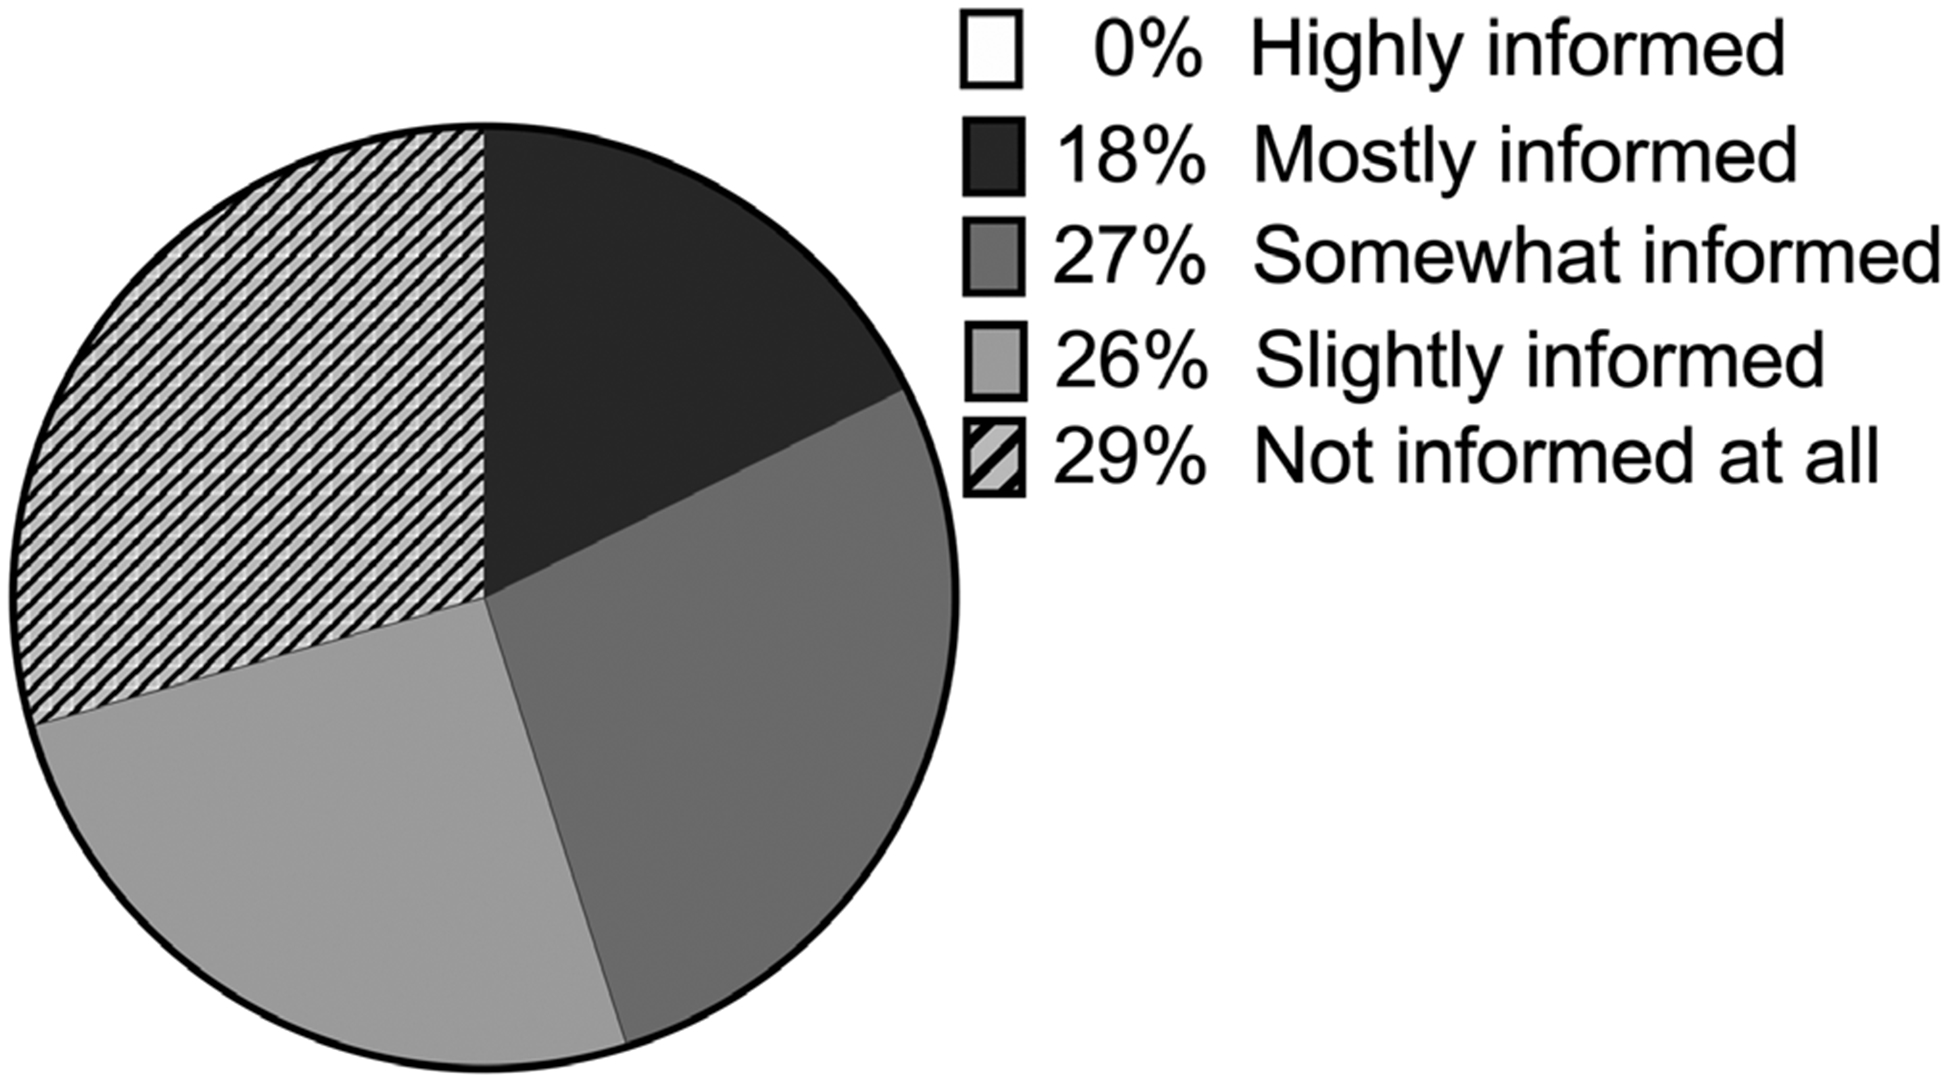
Provider knowledge. Parent report on Part B and C Early childhood intervention provider knowledge about SCA conditions and how they impact child development
4.2.4 |. Regional differences
Survey responses were analyzed to evaluate any significant differences in frequency of children receiving EI and ECSE services by U.S. region (Figure 5). Results indicate parents with preschool children in the Northeast were significantly more likely to report receiving ECSE than the other three U.S. regions (p = .007), and parents of preschool children in the U.S. West were significantly less likely to report receiving ECSE (p < .001). There were no regional differences in parent reports for EI therapies or in provider/therapist knowledge of SCA conditions.
FIGURE 5.
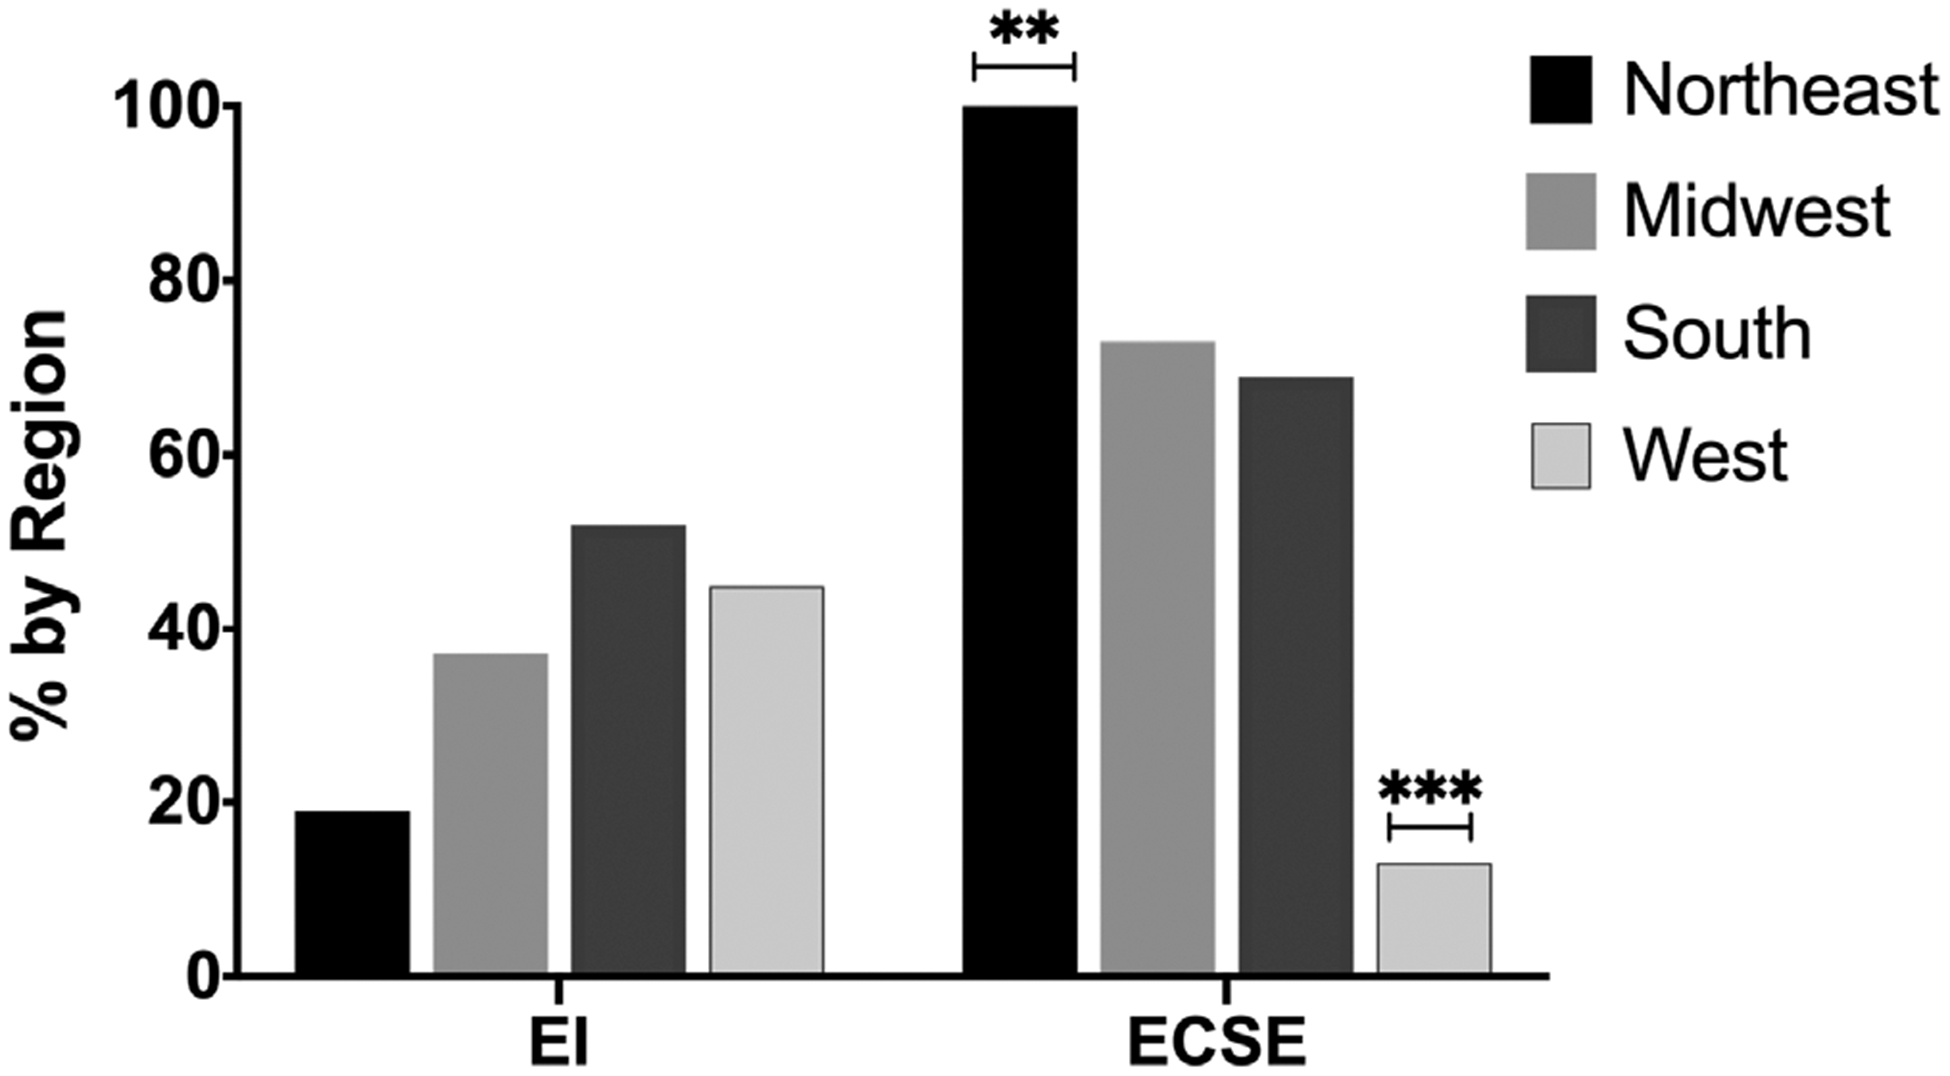
Regional differences in EI and ECSE service delivery. EI and ECSE services by U.S. regions as designated by the US Census Bureau. **p < .01, ***p < .001
4.3 |. Qualitative results
Roughly half (51%) of survey respondents provided open-ended, qualitative text responses (Infants/Toddlers = 20; Preschool = 34; Total = 54). Qualitative analysis revealed two major themes: Slipping through the cracks and a need for public awareness.
4.3.1 |. Slipping through the cracks
Parents reported borderline developmental assessment scores that miss the cutoff for service qualification and a profile of invisible disabilities associated with SCA that may be overlooked by unaware early childhood educators.
Missing the cutoff
Many parents described early childhood interventions as desirable and effective; as one parent stated: “The more therapy, the better.” However, parents reported that when their children scored in the borderline, or subclinical range on standardized developmental assessments they struggled to qualify for publicly funded EI and ECSE therapies (in states where SCA is not an automatically qualifying diagnosis). One parent wrote: “It is really disappointing to know that we have a medical diagnosis that shows she needs support however we essentially have to wait for her to fail in public schools before they will start helping with speech or occupational therapy.” Another reported: “My son was denied early intervention because the qualifications are based on amount of words. Since he had the ‘right’ number of words, even though they were unintelligible, he was denied.” Although the goal of early childhood intervention services is prevention, local systems may not qualify mildly delayed children for early therapies.
Invisible disabilities
Parents frequently described a profile of expressive language delays and a shy, passive temperament in their young children. This combination may present as an absence of problematic behaviors (interrupting, hyperactivity, or unsafe behaviors) and, thus may be overlooked by early educators in the classroom. These behaviors have implications and parents reported a constellation of challenges with peer socialization, self-advocacy, and early learning. As one parent stated: “He is shy, and his language delay makes it difficult [for him] to communicate with peers and teachers in a fast-paced preschool environment.”
4.3.2 |. A need for public awareness
Survey respondents frequently described themes of Uninformed Providers in addition to other Challenges in Navigating the Intervention Systems as they advocate for their children.
Uninformed providers
Many respondents reported they were surprised at the lack of training their physicians and early childhood therapists had in SCA. One parent of a child with 48,XXYY stated: “No one, I mean NO ONE, has ever heard of X & Y chromosome variations. Our PCP has never heard of it. Not a single doctor. Not a single therapist. How are people supposed to help when they are not informed? I’ve been educating our doctors and therapists. We need more awareness!” Another described fatigue from the problem: “It’s tiring to have to be the ones to teach all providers, therapists, social workers and doctors about what XXYY syndrome is when we first meet them.”
Challenges navigating the intervention systems
Numerous respondents reported a lack of awareness on how to best secure adequate early childhood intervention services. Those who had services often described them as positive experiences and highly effective for their children: “We did over a year of speech therapy and it made a huge difference. Very glad we were informed and pursued that aggressively.” However, some parents reported they did not understand the referral process: “I wish that we had gotten services in place earlier. I did not realize that you did not need a doctor’s referral for early intervention, or I would have called a lot sooner rather than the ‘wait and see’ approach that my pediatrician favored at the time.” Another described it as “a constant struggle to keep the supports and services we already have.” Differences in qualification criteria between Part B and Part C services, as well as differences by locality, create confusion for parents as they advocate for supports. As one parent described the situation: “We are left here floating in an ocean of not much help.”
5 |. DISCUSSION
This study was the first national survey in the U.S. to explore parent and caregiver reports of early childhood intervention services for young children with SCAs. Overall, an overwhelming majority of survey respondents reported their child received public and/or private early childhood intervention services prior to entering kindergarten. Over half (64% of infant/toddlers and 76% of preschoolers) reported they received a free multidisciplinary evaluation through their local Child Find agency and ~60% of our total sample reported they subsequently received therapies through EI or ECSE. Speech therapy was the most commonly reported intervention service for both age groups (~40%), and roughly one-quarter reported receiving occupational and/or physical therapy services. In addition, 40% of the preschool group reported receiving additional academic instruction and nearly 20% reported ECSE social skills support. Qualitative themes revealed that, although a majority of parents reported their child received early childhood interventions, many described challenges with accessing these services related to the SCA phenotype (borderline language delays and shy/passive temperament) and confusion regarding qualification criteria needed to access various intervention systems. Further, parents often cited that they were the ones to teach their child’s providers about SCAs.
Our sample reported significantly more public intervention services than the general U.S. population, as recent data from the Early Childhood Technical Assistance Center (ECTAC) show that only 3% of U.S. infants and toddlers receive therapies through EI and only 6% of preschoolers receive ECSE services (ECTAC, 2019). These data are encouraging as they support that a diagnosis of SCA fosters access to services. Despite challenges reported by parents, many children with SCA are able to access early intervention commensurate with their developmental delays, and these environmental factors have the potential to mitigate risk. The brain’s plasticity during early childhood enables high-quality early experiences such as sensitive parental interactions or early therapies to beneficially alter brain development (Bernier et al., 2019; Tottenham, 2014). Both EI and ECSE have demonstrated enhanced family well-being and parent efficacy (Bailey Jr. et al., 2005) and improved child outcomes across all developmental domains, including areas of known deficits for children with SCA such as early academics, problem solving, and social skills (Anderson et al., 2003; Gorey, 2001; Green, Terry, & Gallagher, 2014; Guralnick & Bruder, 2019). Prior studies have reported that up to 75% of children with SCA may require special education supports (Bender et al., 2001; Rovet et al., 1996), and early childhood interventions may also be a cost-effective measure that decreases the need for, or the intensity of, future and more expensive public support programs (Nores, 2020). Further, the majority of survey respondents (78.6%) reported their preschool children were educated alongside typically developing peers in inclusive classroom settings, which is slightly higher than the national rate (67%) (ECTAC, 2019). Research indicates that inclusive preschool classrooms have the best outcomes for children with IEPs (Guralnick & Bruder, 2016). While these findings need to be further explored specifically in the SCA population with attention to any differences needed for children with SCA, strong background literature in child development supports the role of EI and ESCE improving outcomes for at-risk children.
Interestingly, despite relatively high rates of reported EI and ECSE therapies in our survey sample, many parents nevertheless reported services were difficult to access due to confusing qualification criteria, their child’s subclinical delays, and a lack of understanding from early childhood providers. While the qualitative and quantitative data strands of this study may appear to contradict each other, in reality, qualitative inquiry serves to expand upon quantitative results by describing the process parents experience when seeking early childhood intervention services, the quality of their interactions with early childhood professionals, and their emergent priorities that may not be fully captured when simply reporting rates of EI and ECSE (Creswell & Poth, 2017). Our results are in line with prior qualitative SCA research documenting parent perceptions of uninformed providers and outdated information on the internet (Bourke, Snow, Herlihy, Amor, & Metcalfe, 2014; Close, Sadler, & Grey, 2015), suggesting the burden is currently on parents to translate complex medical information about SCAs into actionable interventions for the early education community.
Our results are consistent with prior research on neurodevelopmental profiles in SCA conditions. Within our sample, parent reported clinical diagnoses for speech language disorders (~28%) and ASD (~6%) were more than three times the estimated rates of diagnoses in the general U.S. population (speech disorders = ~6% (Law, Boyle, Harris, Harkness, & Nye, 2000), ASD = ~2%, Baio et al., 2018) which is consistent with prior SCA research (Bender et al., 1983; Tartaglia et al., 2017). High rates of reported speech therapy in both the infant/toddler and preschool age groups reflect well-documented risks for early language delays, while rates of reported occupational and physical therapy mirror recognized risks for early motor delays (Bender et al., 1993; Robinson et al., 1990; Salbenblatt et al., 1987, 1989). Reported rates of preschool supports for early academics and social skills indicate that later risks for learning disabilities and deficits in social cognition, previously identified in older populations (Boada et al., 2009; Tartaglia et al., 2012; van Rijn et al., 2014; van Rijn & Swaab, 2015; Wigby et al., 2016), may rise to a level of clinical significance as early as 3-years of age for some children with SCAs. Parents of children with tetra/pentasomy SCA reported higher rates of public and private therapies in both age groups, as expected based on documented phenotypes that typically include more significant degrees of delay (Tartaglia et al., 2011). Further, our finding that parents of children with postnatal diagnoses were more likely to report receiving ECSE service may be due to ascertainment bias in postnatally identified group related to developmental concerns (Robinson, Bender, & Linden, 1992), as compared with the prenatal preschool group with fewer areas of need and milder delays.
Differences based on timing of the diagnoses were not significant in our sample for EI services, which may be attributed to the Category 1 stipulation in Part C of IDEA, 2004, in which individual states have an option to automatically qualify infants and toddlers with diagnosed conditions that carry a high risk for developmental delays, such as genetic conditions or prematurity. Bypassing the requirement to demonstrate developmental delays (e.g., communication, cognition, motor, and/or adaptive skills), as is required to qualify for ECSE services, may have allowed more of the prenatally diagnosed infants and toddlers in our sample to access EI services. However, lists of qualifying conditions vary greatly by state and change frequently due to state budget and political decisions. A recent review (Barger et al., 2019) found that 47,XXY is specifically listed as an automatically qualifying condition for EI services in only 11 out of 50 states, but specific states and other SCA conditions were not listed in the report. Our results did not reveal regional difference in EI services, however as Category 1 lists differ state to state, our use of broad regions as defined by the U.S. Census may not have accurately captured geographic differences in the EI systems. Our results indicated differences in ECSE services by region, which may be attributed to variability in local assessment practices, service delivery models, or special education policies, which have all been previously shown to contribute to differences in how many children are served through Part B of IDEA, 2004 (Nowicki, 2019).
6 |. LIMITATIONS
Our study was limited by sample size (N = 105) and, unfortunately, it is not possible to know the actual number of diagnosed SCAs in the U.S. as there is not a centralized medical record system. With ~3.8 million births per year in the U.S. (Martin, Hamilton, Osterman, & Driscoll, 2019), and 1:500 born with SCAs (Berglund et al., 2019; Coffee et al., 2009; Hamerton et al., 1975; Jacobs, 1979; Nielsen, 1990), we can estimate up to 7,600 new SCA births per year. Only a fraction of these are currently diagnosed prenatally or in the first 5-years of life (Abramsky & Chapple, 1997). Assuming an early diagnosis rate of 15%, there would be ~1,140 known diagnoses per year, multiplied by 5-years for the age range of the current study sample, is an estimated total of 5,700 diagnosed cases of SCA in U.S. children ages birth to five. Although this computation is rife with assumptions, it reveals some of the limitations of our sample. Furthermore, given this was an internet survey with an open URL, we are unable to determine how many families had access to the survey link but refused to participate, therefore we do not have a denominator to report the overall response rate.
As with any survey, parents who saw the advertisement and elected to participate may be more aware or proactive about their child’s developmental risks. Additionally, 44% of our survey respondents reported having an advanced degree compared with 13% of total U.S. adults (U.S. Census Bureau, 2018). Highly educated parents who access clinical listservs and advocacy websites may not represent the entire SCA population, and our results may over or underestimate rates of early childhood interventions in this population. Additionally, we used parent education as a proxy for socioeconomic status (SES) and did not collect data on family income or health insurance status. Results may have differed with regard to rates of services (especially private insurance/cashpay therapies) had we used other measures of SES. Finally, we have reported the prevalence of parent reported early childhood intervention services, however we cannot comment on how many did not receive therapies but would have benefitted from services. In our sample, more parents reported receiving multidisciplinary Child Find evaluations (infant/toddlers = 64%, preschoolers = 76%) than reported receiving EI/ECSE services (both groups = ~60%). However, we are unable to determine whether some children received evaluations but did not receive services because they did not present with qualifying developmental delays, qualification criteria were narrower in their state, parents declined services, or services were unavailable. Furthermore, we were unable to check IFSPs and IEPs for accuracy of parent report or developmental assessment results.
6.1 |. Strengths
Despite these known limitations, this study offers several notable strengths, including the addition of a unique systems perspective to SCA research. We are adding to an established body of research on neurodevelopmental outcomes in SCA by examining how documented individual phenotypic traits in SCA are addressed through the various early childhood intervention service delivery systems. We recruited a relatively large, nationally representative sample of a narrow age window in a rare set of genetic conditions. Our sample was well distributed in terms of parent age, child age, SCA conditions, timing of diagnosis, and geographic region. We were able to ask detailed questions about specific intervention services from both public and private systems in order to quantify and compare across key variables. Adding a qualitative component to the survey allowed us to elicit emergent priorities directly from families in order to guide our recommendations and future research priorities.
6.2 |. Future directions
Our results signify a call to action for the SCA community due to the growing number of prenatally identified cases through NIPT. Historically, SCA diagnoses for young children (under-age 5) in the U.S. have been mostly limited to a small fraction of children who present with early developmental delays that prompt genetic testing, or those incidentally identified by prenatal diagnostic testing secondary to high risk pregnancies for autosomal aneuploidy (advanced maternal age, abnormal maternal biomarker screening, or ultrasound anomalies) (Abramsky & Chapple, 1997). The advent of NIPT in 2011 was followed by 2016 American obstetric professional societies issuing position statements that all pregnant women, including those at low risk, should routinely be offered this testing (Rose & Mercer, 2016). This presents a backdrop to increase SCA prenatal ascertainment. Evidence supports the increasing adoption of NIPT among low risk patients, as one NIPT lab observed a 13% increase in samples received from patients under 35 years old over a four-year period (Chen, White, Shabbeer, & Schmid, 2019); a low risk population that may otherwise have gone untested prior to NIPT. Furthermore, SCAs are no longer simply incidentally identified through prenatal diagnostic testing, as an Australian study from 2016 demonstrated that while the total number of prenatal diagnostic tests has significantly decreased with the advent of NIPT, nearly half of the women having diagnostic prenatal testing pursued testing due to a high risk SCA result on NIPT (Howard-Bath, Poulton, Halliday, & Hui, 2018). Additionally, an international survey study showed that although approximately one-half of respondents who continued pregnancies with a positive indication for SCA on NIPT deferred confirmatory prenatal testing, at least 30% received a confirmatory SCA diagnosis before 2-years of age (Samango-Sprouse et al., 2019). In the absence of newborn screening, the precise increase in prenatally ascertained cases remains deductive; however, published data coupled with our specialty clinical experience (Tartaglia et al., 2015), albeit with ascertainment bias, continues to support a growing percentage of SCAs being identified prenatally and confirmed either during pregnancy or within the first years of life in the U.S.
With this potential influx of young children with known SCA diagnoses entering the early childhood system, early childhood therapists, teachers, and policy-makers will need additional training in the unique developmental needs of young children with SCAs. Academic researchers and medical providers in the field of SCAs can contribute their expertise as guest speakers to training programs and by presenting at early childhood professional conferences and developing early education guidelines and toolkits for educators and therapists serving children with SCAs (American Academy of Pediatrics, 2009). Physicians in the U.S. should educate themselves on their state’s local EI qualification criteria so that they can help alleviate parent confusion about accessing early therapies, and if needed, they can advocate for their state’s EI system to add SCAs to their list of Category 1 conditions (Barger et al., 2019), automatically qualifying infants and toddlers with SCA for services. More research is needed on early childhood interventions for children with SCA in other countries as our data are highly dependent on local policies specific to the U.S. Finally, existing models for interdisciplinary collaboration between physicians, teachers, and parents that have been shown to effectively improve family/school partnerships and child outcomes for children with developmental disorders commonly associated with SCAs (e.g., ADHD and ASD) should be adapted to address the unique medical needs of young children with SCA and tested for efficacy (Power et al., 2012; Power, Blum, Guevara, Jones, & Leslie, 2013; Sheridan et al., 2009). Ample study opportunities remain to further explore the impact of preventative early childhood interventions for children with SCA.
ACKNOWLEDGMENTS
The authors wish to thank all the parents and caregivers who participated in the study, the Association for X and Y Chromosome Variations for their help with recruitment, and the eXtraordinarY Kids multidisciplinary clinic and research team for their support. We also want to acknowledge Susan Fasone and Erin Frith for their contributions to this manuscript.
Funding information
Eunice Kennedy Shriver National Institute of Child Health and Human Development, Grant/Award Numbers: K23HD092588, R01HD091251; National Center for Advancing Translational Sciences, Grant/Award Number: UL1 TR002535
Footnotes
CONFLICT OF INTEREST
The authors declare no potential conflict of interest.
DATA AVAILABILITY STATEMENT
The data that support the findings of this study are available from the corresponding author upon reasonable request.
REFERENCES
- Abramsky L, & Chapple J (1997). 47,XXY (Klinefelter syndrome) and 47,XYY: Estimated rates of and indication for postnatal diagnosis with implications for prenatal counselling. Prenatal Diagnosis, 17(4), 363–368. http://www.ncbi.nlm.nih.gov/pubmed/9160389 [DOI] [PubMed] [Google Scholar]
- American Academy of Pediatrics. (2009). AAP advocacy guide: Pointing you in the right direction to become an effective advocate. Elk Grove Village, IL: American Academy of Pediatrics. [Google Scholar]
- Anderson LM, Shinn C, Fullilove MT, Scrimshaw SC, Fielding JE, Normand J, & Carande-Kulis VG (2003). The effectiveness of early childhood development programs. A systematic review. American Journal of Preventive Medicine, 24(3 Suppl), 32–46. 10.1016/s0749-3797(02)00655-4 [DOI] [PubMed] [Google Scholar]
- Bailey DB Jr., Hebbeler K, Spiker D, Scarborough A, Mallik S, & Nelson L (2005). Thirty-six-month outcomes for families of children who have disabilities and participated in early intervention. Pediatrics, 116(6), 1346–1352. 10.1542/peds.2004-1239 [DOI] [PubMed] [Google Scholar]
- Baio J, Wiggins L, Christensen DL, Maenner MJ, Daniels J, Warren Z, … Dowling NF (2018). Prevalence of autism Spectrum disorder among children aged 8 years - autism and developmental disabilities monitoring network, 11 sites, United States, 2014. MMWR Surveillance Summaries, 67(6), 1–23. 10.15585/mmwr.ss6706a1 [DOI] [PMC free article] [PubMed] [Google Scholar]
- Barger B, Squires J, Greer M, Noyes-Grosser D, Eile JM, Rice C, … London S (2019). State variability in diagnosed conditions for IDEA part C eligibility. Infants & Young Children, 32(4), 231–244. [DOI] [PMC free article] [PubMed] [Google Scholar]
- Bender B, Fry E, Pennington B, Puck M, Salbenblatt J, & Robinson A (1983). Speech and language development in 41 children with sex chromosome anomalies. Pediatrics, 71(2), 262–267. http://www.ncbi.nlm.nih.gov/entrez/query.fcgi?cmd=Retrieve&db=PubMed&dopt=Citation&list_uids=6823432 [PubMed] [Google Scholar]
- Bender BG, Linden MG, & Harmon RJ (2001). Neuropsychological and functional cognitive skills of 35 unselected adults with sex chromosome abnormalities. American Journal of Medical Genetics, 102(4), 309–313. [DOI] [PubMed] [Google Scholar]
- Bender BG, Linden MG, & Robinson A (1993). Neuropsychological impairment in 42 adolescents with sex chromosome abnormalities. American Journal of Medical Genetics, 48(3), 169–173. [DOI] [PubMed] [Google Scholar]
- Berglund A, Viuff MH, Skakkebaek A, Chang S, Stochholm K, & Gravholt CH (2019). Changes in the cohort composition of turner syndrome and severe non-diagnosis of Klinefelter, 47,XXX and 47,XYY syndrome: A nationwide cohort study. Orphanet Journal of Rare Diseases, 14(1), 16 10.1186/s13023-018-0976-2 [DOI] [PMC free article] [PubMed] [Google Scholar]
- Bernier A, Dégeilh F, Leblanc É, Daneault V, Bailey HN, & Beauchamp MH (2019). Mother–infant interaction and child brain morphology: A multidimensional approach to maternal sensitivity. Infancy, 24(2), 120–138. [DOI] [PubMed] [Google Scholar]
- Boada R, Janusz J, Hutaff-Lee C, & Tartaglia N (2009). The cognitive phenotype in Klinefelter syndrome: A review of the literature including genetic and hormonal factors. Developmental Disabilities Research Reviews, 15(4), 284–294. 10.1002/ddrr.83 [DOI] [PMC free article] [PubMed] [Google Scholar]
- Bourke E, Snow P, Herlihy A, Amor D, & Metcalfe S (2014). A qualitative exploration of mothers’ and fathers’ experiences of having a child with Klinefelter syndrome and the process of reaching this diagnosis. European Journal of Human Genetics: EJHG, 22(1), 18–24. 10.1038/ejhg.2013.102 [DOI] [PMC free article] [PubMed] [Google Scholar]
- Bronfenbrenner U (1994). Ecological models of human development. Readings on the Development of Children, 2(1), 37–43. [Google Scholar]
- Carlson JA (2010). Avoiding traps in member checking. The Qualitative Report, 15(5), 1102–1113. [Google Scholar]
- U.S. Census Bureau. (2015). Regions and Divisions of the United States. https://www2.census.gov/geo/pdfs/maps-data/maps/reference/us_regdiv.pdf
- U.S. Census Bureau. (2018). Educational Attainment in the United States: 2018. https://www.census.gov/data/tables/2018/demo/education-attainment/cps-detailed-tables.html
- Chen KM, White K, Shabbeer J, & Schmid M (2019). Maternal age trends support uptake of non-invasive prenatal testing (NIPT) in the low-risk population. The Journal of Maternal-Fetal & Neonatal Medicine, 32(23), 4039–4042. 10.1080/14767058.2018.1481033 [DOI] [PubMed] [Google Scholar]
- Close S, Sadler L, & Grey M (2015, May). In the dark: Challenges of caring for sons with Klinefelter syndrome. J Pediatr Nurs, 31(1), 11–20. 10.1016/j.pedn.2015.05.002 [DOI] [PubMed] [Google Scholar]
- Coffee B, Keith K, Albizua I, Malone T, Mowrey J, Sherman SL, & Warren ST (2009). Incidence of fragile X syndrome by newborn screening for methylated FMR1 DNA. American Journal of Human Genetics, 85(4), 503–514. 10.1016/j.ajhg.2009.09.007 [DOI] [PMC free article] [PubMed] [Google Scholar]
- Creswell JW, & Clark VLP (2017). Designing and conducting mixed methods research, Thousand Oaks: CA: Sage publications. [Google Scholar]
- Creswell JW, & Poth CN (2017). Qualitative inquiry and research design: Choosing among five approaches, Thousand Oaks, CA: Sage publications. [Google Scholar]
- Early Childhood Technical Assistance Center & Center for IDEA Early Childhood Data Systems. (2019). IDEA Child Outcomes Highlights for FFY2017. https://ectacenter.org/eco/pages/childoutcomeshighlights.asp
- Gargiulo RM, & Bouck EC (2020). Special education in contemporary society: An introduction to exceptionality, Thousand Oaks, CA: SAGE Publications Incorporated. [Google Scholar]
- Gorey KM (2001). Early childhood education: A meta-analytic affirmation of the short-and long-term benefits of educational opportunity. School Psychology Quarterly, 16(1), 9. [Google Scholar]
- Green KB, Terry NP, & Gallagher PA (2014). Progress in language and literacy skills among children with disabilities in inclusive early reading first classrooms. Topics in Early Childhood Special Education, 33 (4), 249–259. [Google Scholar]
- Guralnick MJ, & Bruder MB (2016). Early childhood inclusion in the United States. Infants & Young Children, 29(3), 166–177. [Google Scholar]
- Guralnick MJ, & Bruder MB (2019). Early intervention In Handbook of intellectual disabilities (pp. 717–741). New York, NY: Springer. [Google Scholar]
- Hamerton JL, Canning N, Ray M, & Smith S (1975). A cytogenetic survey of 14,069 newborn infants. I. Incidence of chromosome abnormalities. Clin Genet, 8(4), 223–243. http://www.ncbi.nlm.nih.gov/entrez/query.fcgi?cmd=Retrieve&db=PubMed&dopt=Citation&list_uids=1183067 [DOI] [PubMed] [Google Scholar]
- Harris PA, Taylor R, Thielke R, Payne J, Gonzalez N, & Conde JG (2009). Research electronic data capture (REDCap)- -a metadata-driven methodology and workflow process for providing translational research informatics support. Journal of Biomedical Informatics, 42(2), 377–381. 10.1016/j.jbi.2008.08.010 [DOI] [PMC free article] [PubMed] [Google Scholar]
- Howard-Bath A, Poulton A, Halliday J, & Hui L (2018). Population-based trends in the prenatal diagnosis of sex chromosome aneuploidy before and after non-invasive prenatal testing. Prenatal Diagnosis, 38 (13), 1062–1068. 10.1002/pd.5363 [DOI] [PubMed] [Google Scholar]
- Individuals with Disabilities Education Act of 2004, Pub. L. No. 108–446, (2004).
- Jacobs P (1979). The incidence and etiology of sex chromosome abnormalities in man. Birth Defects Original Article Series, 15, 3–14. [PubMed] [Google Scholar]
- Law J, Boyle J, Harris F, Harkness A, & Nye C (2000). Prevalence and natural history of primary speech and language delay: Findings from a systematic review of the literature. International Journal of Language & Communication Disorders, 35(2), 165–188. 10.1080/136828200247133 [DOI] [PubMed] [Google Scholar]
- Martin JA, Hamilton BE, Osterman MJK, & Driscoll AK (2019). Births: Final data for 2018. National vital statistics reports. CDC, 68 (13), 1–47. [PubMed] [Google Scholar]
- Nielsen J (1990). Sex chromosome abnormalities found among 34,910 newborn children: Results from a 13-year incidence study in Arhus, Denmark. Birth Defects Original Article Series, 26(4), 209–223. [PubMed] [Google Scholar]
- Nielsen J, & Sorensen A (1979). Follow-up until age 4 to 8 of 25 unselected children with sex chromosome abnormalities, compared with sibs and controls. Birth Defects Original Article Series, 15(1), 15–73. [PubMed] [Google Scholar]
- Nores M (2020). The economics of early childhood interventions In The economics of education (pp. 229–238). Cambridge, MA: Elsevier. [Google Scholar]
- Nowicki JM (2019). Special education: Varied state criteria may contribute to differences in percentages of children served. Report to congressional requesters. GAO-19–348. US Government Accountability Office, 1–37. [Google Scholar]
- Power TJ, Blum NJ, Guevara JP, Jones HA, & Leslie LK (2013). Coordinating mental health care across primary care and schools: ADHD as a case example. Advances in School Mental Health Promotion, 6(1), 68–80. [DOI] [PMC free article] [PubMed] [Google Scholar]
- Power TJ, Mautone JA, Soffer SL, Clarke AT, Marshall SA, Sharman J, … Jawad AF (2012). A family-school intervention for children with ADHD: Results of a randomized clinical trial. Journal of Consulting and Clinical Psychology, 80(4), 611–623. 10.1037/a0028188 [DOI] [PMC free article] [PubMed] [Google Scholar]
- Ramdaney A, Hoskovec J, Harkenrider J, Soto E, & Murphy L (2018). Clinical experience with sex chromosome aneuploidies detected by noninvasive prenatal testing (NIPT): Accuracy and patient decision-making. Prenatal Diagnosis, 38(11), 841–848. 10.1002/pd.5339 [DOI] [PubMed] [Google Scholar]
- Robinson A, Bender BG, & Linden MG (1990). Summary of clinical findings in children and young adults with sex chromosome anomalies. Birth Defects Original Article Series, 26(4), 225–228. http://www.ncbi.nlm.nih.gov/entrez/query.fcgi?cmd=Retrieve&db=PubMed&dopt=Citation&list_uids=2090320 [PubMed] [Google Scholar]
- Robinson A, Bender BG, & Linden MG (1992). Prognosis of prenatally diagnosed children with sex chromosome aneuploidy. American Journal of Medical Genetics, 44(3), 365–368. http://www.ncbi.nlm.nih.gov/entrez/query.fcgi?cmd=Retrieve&db=PubMed&dopt=Citation&list_uids=1488987 [DOI] [PubMed] [Google Scholar]
- Rose N, & Mercer B (2016). Practice bulletin no. 163: Screening for fetal aneuploidy. Obstetrics and Gynecology, 127(5), e123–e137. 10.1097/aog.0000000000001406 [DOI] [PubMed] [Google Scholar]
- Ross JL, Roeltgen DP, Kushner H, Zinn AR, Reiss A, Bardsley MZ, … Tartaglia N (2012). Behavioral and social phenotypes in boys with 47,XYY syndrome or 47,XXY Klinefelter syndrome. Pediatrics, 129(4), 769–778. http://www.ncbi.nlm.nih.gov/entrez/query.fcgi?cmd=Retrieve&db=PubMed&dopt=Citation&list_uids=22412026 [DOI] [PMC free article] [PubMed] [Google Scholar]
- Rovet J, Netley C, Keenan M, Bailey J, & Stewart D (1996). The psychoeducational profile of boys with Klinefelter syndrome. Journal of Learning Disabilities, 29(2), 180–196. http://www.ncbi.nlm.nih.gov/pubmed/8820203 [DOI] [PubMed] [Google Scholar]
- Salbenblatt JA, Meyers DC, Bender BG, Linden MG, & Robinson A (1987). Gross and fine motor development in 47,XXY and 47,XYY males. Pediatrics, 80(2), 240–244. http://www.ncbi.nlm.nih.gov/pubmed/3615095 [PubMed] [Google Scholar]
- Salbenblatt JA, Meyers DC, Bender BG, Linden MG, & Robinson A (1989). Gross and fine motor development in 45,X and 47,XXX girls. Pediatrics, 84(4), 678–682. http://www.ncbi.nlm.nih.gov/entrez/query.fcgi?cmd=Retrieve&db=PubMed&dopt=Citation&list_uids=2780130 [PubMed] [Google Scholar]
- Samango-Sprouse CA, Porter GF, Lasutschinkow PC, Tran SL, Sadeghin T, & Gropman AL (2019). Impact of early diagnosis and noninvasive prenatal testing (NIPT): Knowledge, attitudes, and experiences of parents of children with sex chromosome aneuploidies (SCAs). Prenatal Diagnosis, 40, 470–480. 10.1002/pd.5580 [DOI] [PubMed] [Google Scholar]
- Shaffer BL, Caughey AB, & Norton ME (2006). Variation in the decision to terminate pregnancy in the setting of fetal aneuploidy. Prenatal Diagnosis, 26(8), 667–671. http://www.ncbi.nlm.nih.gov/entrez/query.fcgi?cmd=Retrieve&db=PubMed&dopt=Citation&list_uids=16724363 [DOI] [PubMed] [Google Scholar]
- Sheridan SM, Warnes ED, Woods KE, Blevins CA, Magee KL, & Ellis C (2009). An exploratory evaluation of conjoint behavioral consultation to promote collaboration among family, school, and pediatric systems: A role for pediatric school psychologists. Journal of Educational and Psychological Consultation, 19(2), 106–129. [Google Scholar]
- Shonkoff J, Levitt P, Boyce W, Fox N, Gunnar M, Mayes L, … Nall-Bales S (2009). In brief: The science of early childhood development. Center on the Developing Child at Harvard University. Retrieved from: http://developingchild.harvard.edu/index.php/resources/multimedia/videos/inbrief_series.
- Tartaglia N, Ayari N, Howell S, D’Epagnier C, & Zeitler P (2011). 48,XXYY, 48,XXXY and 49,XXXXY syndromes: Not just variants of Klinefelter syndrome. Acta Paediatrica, 100(6), 851–860. 10.1111/j.1651-2227.2011.02235.x [DOI] [PMC free article] [PubMed] [Google Scholar]
- Tartaglia N, Howell S, Wilson R, Janusz J, Boada R, Martin S, … Zeitler P (2015). The eXtraordinarY kids clinic: An interdisciplinary model of care for children and adolescents with sex chromosome aneuploidy. Journal of Multidisciplinary Healthcare, 8, 323–334. http://www.ncbi.nlm.nih.gov/entrez/query.fcgi?cmd=Retrieve&db=PubMed&dopt=Citation&list_uids=26229481 [DOI] [PMC free article] [PubMed] [Google Scholar]
- Tartaglia NR, Ayari N, Hutaff-Lee C, & Boada R (2012). Attention-deficit hyperactivity disorder symptoms in children and adolescents with sex chromosome aneuploidy: XXY, XXX, XYY, and XXYY. Journal of Developmental and Behavioral Pediatrics, 33(4), 309–318. http://www.ncbi.nlm.nih.gov/entrez/query.fcgi?cmd=Retrieve&db=PubMed&dopt=Citation&list_uids=22333574 [DOI] [PMC free article] [PubMed] [Google Scholar]
- Tartaglia NR, Wilson R, Miller JS, Rafalko J, Cordeiro L, Davis S, … Ross J (2017). Autism Spectrum disorder in males with sex chromosome aneuploidy: XXY/Klinefelter syndrome, XYY, and XXYY. Journal of Developmental and Behavioral Pediatrics, 38(3), 197–207. 10.1097/DBP.0000000000000429 [DOI] [PMC free article] [PubMed] [Google Scholar]
- Tottenham N (2014). The importance of early experiences for neuro-affective development. Current Topics in Behavioral Neurosciences, 16, 109–129. 10.1007/7854_2013_254 [DOI] [PMC free article] [PubMed] [Google Scholar]
- van Rijn S, Stockmann L, Borghgraef M, Bruining H, van Ravenswaaij-Arts C, Govaerts L, … Swaab H (2014). The social behavioral phenotype in boys and girls with an extra X chromosome (Klinefelter syndrome and trisomy X): A comparison with autism spectrum disorder. Journal of Autism and Developmental Disorders, 44(2), 310–320. 10.1007/s10803-013-1860-5 [DOI] [PubMed] [Google Scholar]
- van Rijn S, & Swaab H (2015). Executive dysfunction and the relation with behavioral problems in children with 47,XXY and 47,XXX. Genes, Brain, and Behavior, 14(2), 200–208. 10.1111/gbb.12203 [DOI] [PubMed] [Google Scholar]
- Wigby K, D’Epagnier C, Howell S, Reicks A, Wilson R, Cordeiro L, & Tartaglia N (2016). Expanding the phenotype of triple X syndrome: A comparison of prenatal versus postnatal diagnosis. American Journal of Medical Genetics. Part A, 170(11), 2870–2881. 10.1002/ajmg.a.37688 [DOI] [PMC free article] [PubMed] [Google Scholar]