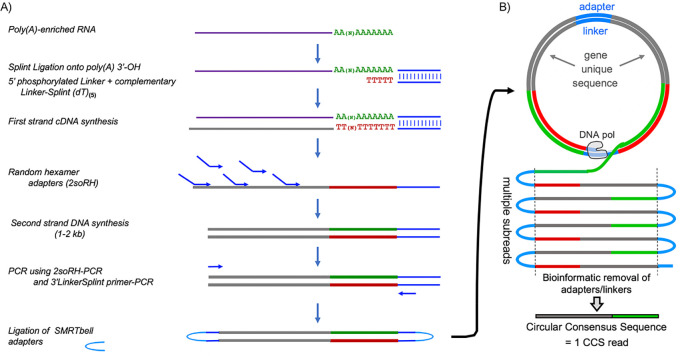
Figure 1. Flow diagram of SM-PAT-seq library preparation, sequencing and read output.
(A) Overview of library construction for SM-PAT-seq, depicting production of a circular DNA from a single mRNA molecule with a specific poly(A) length. (B) Schematic production of one circular consensus sequence (CCS) read (bottom) from the mRNA-derived DNA template as performed by the Pacific Biosciences Sequel system (see text); DNA pol = DNA polymerase.
Figure 1—figure supplement 1. Analysis of SM-PAT-seq performance.


