

Background:
More than 75% of major limb amputees experience chronic pain; however, data on severity and experience of pain are inconsistent. Without a benchmark using quantitative patient-reported outcomes, it is difficult to critically assess the efficacy of novel treatment strategies. Our primary objective is to report quantitative pain parameters for a large sample of amputees using the validated Patient-reported Outcomes Measurement System (PROMIS). Secondarily, we hypothesize that certain patient factors will be associated with worse pain.
Methods:
PROMIS and Numerical Rating Scales for residual limb pain (RLP) and phantom limb pain (PLP) were obtained from a cross-sectional survey of upper and lower extremity amputees recruited throughout North America via amputee clinics and websites. Demographics (gender, age, race, and education) and clinical information (cause, amputation level, and time since amputation) were collected. Regression modeling identified factors associated with worse pain scores (P < 0.05).
Results:
Seven hundred twenty-seven surveys were analyzed, in which 73.4% reported RLP and 70.4% reported PLP. Median residual PROMIS scores were 46.6 [interquartile range (IQR), 41–52] for RLP Intensity, 56.7 (IQR, 51–61) for RLP Behavior, and 55.9 (IQR, 41–63) for RLP Interference. Similar scores were calculated for PLP parameters: 46.8 (IQR, 41–54) for PLP Intensity, 56.2 (IQR, 50–61) for PLP Behavior, and 54.6 (IQR, 41–62) for PLP Interference. Female sex, lower education, trauma-related amputation, more proximal amputation, and closer to time of amputation increased odds of PLP. Female sex, lower education, and infection/ischemia-related amputation increased odds of RLP.
Conclusion:
This survey-based analysis provides quantitative benchmark data regarding RLP and PLP in amputees with more granularity than has previously been reported.
INTRODUCTION
Major limb amputation results in life-long emotional, psychological, and physical effects.1–4 Almost 2 million people living with limb loss—more than 75% of the amputee population—suffer from residual limb pain (RLP, pain localized to the remaining residual limb) or phantom limb pain (PLP, painful sensations referred to the amputated limb) in the United States alone (Fig. 1).1–4 Reported quality-of-life measures in amputees are lower than those of the general population as limb loss leads to alterations in body image and impaired physical function.5 Chronic pain is a major factor contributing to functional impairment and decreased quality of life.6
Limb amputation requires the division of peripheral nerves. End neuromas histologically represent disorganized axons without appropriate terminal receptors encased in scar.7,8 Sensory axons predominate and, perhaps, explain why neuromas are frequent pain generators when struck.9,10 Understandably, symptomatic end neuromas serve as the basis of RLP. The exact etiology of PLP is more complex, representing a combination of spontaneous and abnormal peripheral nerve signals coupled with cortical reorganization and gray matter changes.11–15
Numerous medical and surgical interventions have been proposed to treat these painful conditions; however, outcome assessment is frequently reliant on simple, binary outcomes of presence or absence of pain posttreatment.16,17 Alternatively, some studies rely on a Verbal Rating Scale (no/mild/moderate/severe) or Numerical Rating Scale (NRS, 0–10, with 10 being the worst) to ask about perceived pain levels.18 Responses to these scales lack sensitivity, their reliability may depend on how the question is framed, the response can vary for a given patient throughout the day, and these scales are not based on a validated model.19,20 Still other outcome models rely on narcotic use as a corollary for amputee pain, but narcotic use is co-dependent on a variety of other factors such as local prescribing patterns, pain elsewhere in the body, and developed substance dependence.21 Thus, with the variety of outcome reporting methods, it is difficult to directly compare the efficacy of treatments without established baseline data on pain in the amputee population.
The Patient-Reported Outcomes Measurement Information System (PROMIS) is a patient-reported outcome (PRO) survey tool that has been psychometrically validated to measure various aspects of patients’ physical, mental, and social well-being in a range of chronic health conditions.22–26 The benefit of using PROMIS to establish baseline pain parameters for the amputee population is several-fold: (1) it converts verbal patient responses into a numerical value, facilitating comparison between groups; (2) it allows for comparisons with the general population; (3) it has multiple pain domains, allowing for comparison between domains and a broader understanding of various pain implications for each patient.
The goal of this study is to provide foundational and reproducible data on chronic RLP and PLP in the general amputee population. Our primary endpoint is to report baseline pain parameters for a large, unselected sample of the amputee population using the validated PROMIS scale and the NRS as a legacy measure. Secondarily, we hypothesize that certain patient factors such as level of amputation and reason for amputation will impact the severity of reported pain in major limb amputees. Given the pathophysiology of how neuromas develop from aberrant axonal sprouting, perineural injury, and scarring, it would logically follow that factors affecting axon density (such as a more proximal amputation) and factors affecting local tissue scarring (such as a traumatic amputation) would subsequently impact the likelihood of neuroma development or the intensity of neuroma pain.27
It is only by understanding baseline pain levels after limb amputation that the efficacy of both medical and surgical interventions can be assessed. We infer that amputees seeking out interventions for pain have greater levels of pain compared with amputees out in the community who are not visiting therapists or medical practitioners. The use of an electronic survey allows us the opportunity to capture this broader representative cohort. Future treatment investigations can then compare their patient cohort with to a general amputee cohort before and after treatment. The goal is for amputee-related pain interventions to improve reported pain to levels lower than that of our general amputee cohort, thereby shifting the pain curve for all amputees.
METHODS
We conducted an Institutional Review Board-approved observational survey-based study. PRO measures were obtained from a large, unselected sample of amputees, termed the general amputee population. In-person, paper-based, and electronic recruitment methods were used in 2 ways. First, a list of over 200 prosthetists, pain clinics, amputee clinics, amputee support groups, and amputee activity clubs was compiled throughout North America. Relationships with clinicians and organizations were established to discuss the research study, pass out study brochures, and conduct surveys. Additional PRO data were obtained from amputees in-person at professional conferences and trade shows. Outreach extended to on-site survey stands at local prosthetic and orthotic clinics throughout the Chicago metropolitan area. Amputees were handed a unique identifying card for anonymous entry into the PRO questionnaire. These questionnaires were completed in the presence of a study coordinator. The second means of enrollment was through web-based advertising efforts, including www.amputee-coalition.org and www.amputeeresearch.com. Interested individuals answered the survey anonymously without the presence of a study coordinator. The first frame of the survey comprised a written consent form that acknowledged the use of de-identified survey data for educational purposes. Surveys answered through web advertising were otherwise identical to the questionnaire accessed via the unique identifying card. Data were collected from 2016 to 2018.
The amputee pain survey administered to all cohorts was based on 3 PROMIS tools: Pain Behavior—Short Form 7a, Pain Intensity Scale, and Pain Interference—Short Form 8a (Appendices 1 and 2). These instruments produce t scores, which range from 0 to 100 with a mean of 50 and SD of 10. The mean was calculated on a centering sample, which was a large sample of individuals who represented the 2000 US General Census. PROMIS builds upon traditional intensity-based outcomes measures such as the 11-point NRS to further quantify pain-related behavior (how a person reacts to pain) and the degree to which pain affects or interferes with daily functioning. Additionally, demographics (age, ethnicity, and employment) and clinical information (reason for amputation, level of amputation, and time since amputation) were collected.
NRS and PROMIS pain outcomes are reported as median and interquartile range (IQR = 25th to 75th percentiles). Associations between respondent characteristics and NRS worst pain in the past 24 hours were evaluated using cumulative logistic regression models. Associations between respondent characteristics and the 6 PROMIS pain scales were evaluated using median quantile regression; linear regression was not used because the outcomes were not normally distributed. Multiple imputation procedures were used to account for missing data. PROMIS outcomes were missing in <3% of respondents; patients’ characteristic data and NRS worst pain outcomes were missing for <10 respondents. Data were assumed missing at random, and multivariate imputation with the fully conditional specification method in SAS Proc MI (SAS Institute, Cary, N.C.) was used to generate 10 imputation datasets. The model for each outcome (cumulative logistic or median quantile model) was fit to each imputation dataset, and the results were combined using SAS Proc MIANALYZE to obtain an overall coefficient estimate, 95% confidence interval (CI), and P value for each respondent characteristic parameter. All statistical tests were evaluated at the α = 0.05 significance level; no adjustments were made for multiple comparisons. All analyses were performed using SAS software version 9.4.
RESULTS
There were a total of 1203 survey responses. A total of 476 responses were eliminated for incomplete surveys and/or duplicated survey input, leaving 727 surveys for final analysis. Demographic information is given in Table 1. The reason for the amputation was predominantly trauma related (42.4%), followed by infection (14.9%), cancer (8.3%), ischemia (6.7%), and diabetes (6.3%). Most patients had a lower extremity amputation (below the knee amputation, 52.0%; above the knee amputation, 38.2%). In total, 70.5% reported PLP and 73.4% documented RLP.
Table 1.
Patient Characteristics
| Variable | All Patients (n = 727)* |
|---|---|
| Age range, y | |
| 10–39 | 143 (19.7%) |
| 40–54 | 217 (29.8%) |
| 55–64 | 197 (27.1%) |
| 65+ | 170 (23.4%) |
| Gender | |
| Men | 482 (66.4%) |
| Women | 244 (33.6%) |
| Race | |
| White | 617 (85.0%) |
| Black | 52 (7.2%) |
| Other | 57 (7.9%) |
| Married | 420 (57.9%) |
| Unable to work | 138 (19.0%) |
| Education | |
| High school or less | 147 (20.3%) |
| Some college/trade/associate | 299 (41.2%) |
| Bachelors/Masters | 279 (38.5%) |
| Reason for amputation | |
| Cancer | 60 (8.3%) |
| Diabetes | 46 (6.3%) |
| Infection | 108 (14.9%) |
| Ischemia | 49 (6.7%) |
| US military trauma | 84 (11.6%) |
| Non-US military trauma | 224 (30.8%) |
| Other | 156 (21.5%) |
| Level of amputation | |
| Above elbow | 20 (2.8%) |
| Above/through knee | 278 (38.2%) |
| Below elbow | 24 (3.3%) |
| Below knee | 378 (52.0%) |
| Hemipelvectomy | 16 (2.2%) |
| Shoulder disarticulation | 11 (1.5%) |
| Timing of amputation | |
| <1 year | 105 (14.5%) |
| 1–4 years | 242 (33.3%) |
| 5–9 years | 156 (21.5%) |
| 10+ years | 223 (30.7%) |
*Due to missing data (2 or fewer for each variable), sums of counts may not total the full sample size of 727.
The median PROMIS scores were 46.8 (IQR, 41–54) for PLP Intensity, 56.2 (IQR, 50–61) for PLP Behavior, and 54.6 (IQR, 41–62) for PLP Interference (Table 2). Similar scores were calculated for Residual Limb Pain Parameters: 46.6 (IQR, 41–52) for RLP Intensity, 56.7 (IQR, 51–61) for RLP Behavior, and 55.9 (IQR, 41–63) for RLP Interference.
Table 2.
Pain Scores, All Patients (n = 727)
| Variable | Median (IQR) | No. Missing |
|---|---|---|
| NRS Phantom Worst | 4 (0–7) | 2 |
| NRS Residual Worst | 4 (0–7) | 4 |
| PROMIS Phantom Intensity | 46.8 (41–54) | 13 |
| PROMIS Phantom Behavior | 56.2 (50–61) | 17 |
| PROMIS Phantom Interference | 54.6 (41–62) | 19 |
| PROMIS Residual Intensity | 46.6 (41–52) | 19 |
| PROMIS Residual Behavior | 56.7 (51–61) | 11 |
| PROMIS Residual Interference | 55.9 (41–63) | 17 |
Median pain score on a 0–10 scale was 4 (IQR, 0–7) for both RLP and PLP. Only 26.9% and 25.4% of the general amputee population reported being free from PLP and RLP, respectively. For PLP, 21.7% reported mild pain (1–3 of 10); 22.5% reported moderate pain (4–6 of 10); 29.0% reported severe pain (8–10 of 10). For RLP, 22.8% reported mild pain, 23.0% reported moderate pain, and 28.8% reported severe pain. Figure 2 shows the distribution of RLP and PLP severity based on the NRS scale. Tables 3 and 4 summarize the odds of experiencing more severe PLP and RLP (using the NRS scale) based on patient factors. Females were more likely than males to experience PLP (OR, 1.63; 95% CI, 1.22–2.18; P = 0.001) and RLP (OR, 1.37; 95% CI, 1.03–1.83; P = 0.03). Those with a lower education level were at higher odds of experiencing PLP (high school or less: OR, 1.72; 95% CI, 1.19–2.51; P = 0.004) and RLP (high school or less: OR, 1.45; 95% CI, 1.00–2.11; P = 0.05). Individuals with oncologic-based amputations had lower odds of experiencing PLP (OR, 0.56; 95% CI, 0.33–0.98; P = 0.04) compared with individuals with nonmilitary trauma amputations. Alternatively, those with infection and ischemia-related amputations were at increased odds of PLP (OR, 1.99; 95% CI, 1.27–3.09; P = 0.002 and OR, 1.98; 95% CI, 1.09–3.59; P = 0.02, respectively). Level of amputation and time since amputation proved to be important with regards to PLP; more proximal upper and lower extremity amputees had higher odds of suffering from PLP when compared with below-the-knee amputees (above elbow: OR, 2.48; 95% CI, 1.11–5.55; P = 0.03; above knee: OR, 1.38; 95% CI, 1.03–1.84; P = 0.03). Additionally, the odds of experiencing PLP was higher within the first year compared with those 10 years or more since their amputation (OR, 1.86; 95% CI, 1.19–2.89; P = 0.01).
Fig. 2.
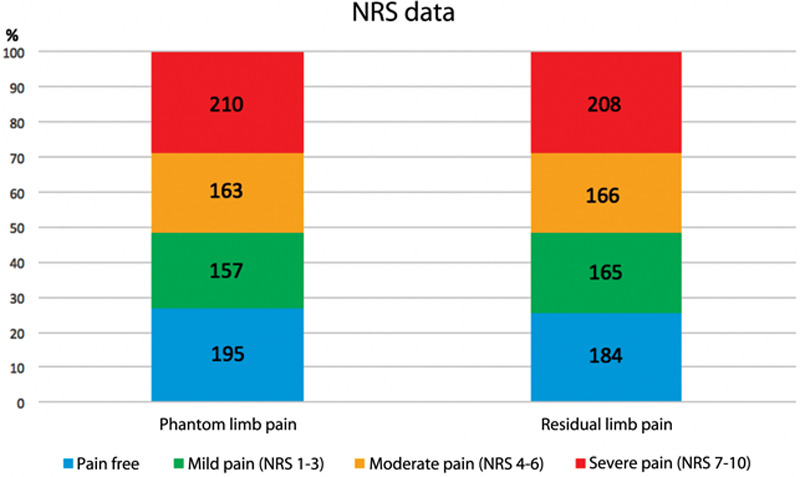
Graphical representation of the “worst phantom limb pain” and “worst residual limb pain” for each survey participant.
Table 3.
Model Results: NRS Worst Phantom Pain in Past 24 Hours
| Variable | Odds Ratio | 95% Confidence Interval | P |
|---|---|---|---|
| Age range (ref: 10–39), y | 0.046* | ||
| 40–54 | 1.70 | (1.12–2.59) | 0.01 |
| 55–64 | 1.37 | (0.88–2.12) | 0.16 |
| 65+ | 1.12 | (0.70–1.78) | 0.64 |
| Women | 1.63 | (1.22–2.18) | 0.001 |
| Race (ref: white) | 0.04* | ||
| Black | 0.56 | (0.33–0.95) | 0.03 |
| Other | 1.37 | (0.84–2.24) | 0.21 |
| Married | 0.98 | (0.74–1.30) | 0.87 |
| Unable to work | 1.45 | (1.01–2.07) | 0.045 |
| Education (ref: bachelors/masters/professional degree) | 0.01* | ||
| High school or less | 1.72 | (1.19–2.51) | 0.004 |
| Some college/trade/associate degree | 1.44 | (1.07–1.96) | 0.02 |
| Reason for amputation (ref: nonmilitary trauma) | 0.01* | ||
| Cancer | 0.56 | (0.33–0.98) | 0.04 |
| Diabetes | 0.88 | (0.48–1.62) | 0.68 |
| Infection | 1.38 | (0.89–2.15) | 0.15 |
| Ischemia | 1.74 | (0.96–3.13) | 0.07 |
| Military trauma | 1.12 | (0.69–1.81) | 0.66 |
| Other | 1.55 | (1.05–2.28) | 0.03 |
| Level of amputation (ref: below knee) | 0.047* | ||
| Above elbow | 2.48 | (1.11–5.55) | 0.03 |
| Above/through knee | 1.38 | (1.03–1.84) | 0.03 |
| Below elbow | 0.90 | (0.42–1.91) | 0.78 |
| Hemipelvectomy | 1.53 | (0.60–3.93) | 0.38 |
| Shoulder disarticulation | 2.66 | (0.92–7.71) | 0.07 |
| Timing of amputation (ref: ≥10 years ago) | 0.03* | ||
| <1 year ago | 1.86 | (1.19–2.89) | 0.01 |
| 1–4 years ago | 1.49 | (1.05–2.13) | 0.03 |
| 5–9 years ago | 1.49 | (1.00–2.21) | 0.05 |
Odds ratios and 95% confidence intervals from cumulative logistic regression modeling odds of having a higher pain.
*Omnibus P value for overall variable effect across all values.
Table 4.
Model Results: NRS Worst Residual Limb Pain in Past 24 Hours
| Variable | Odds Ratio | 95% Confidence Interval | P |
|---|---|---|---|
| Age range (ref: 10–39), y | 0.01* | ||
| 40–54 | 1.13 | (0.74–1.71) | 0.57 |
| 55–64 | 0.85 | (0.55–1.32) | 0.48 |
| 65+ | 0.56 | (0.35–0.90) | 0.02 |
| Women | 1.37 | (1.03–1.83) | 0.03 |
| Race (ref: white) | 0.01* | ||
| Black | 0.41 | (0.24–0.71) | 0.001 |
| Other | 1.07 | (0.66–1.75) | 0.79 |
| Married | 1.00 | (0.75–1.32) | 0.99 |
| Unable to work | 1.54 | (1.07–2.21) | 0.02 |
| Education (ref: bachelors/masters/professional degree) | 0.046* | ||
| High school or less | 1.45 | (1.00–2.11) | 0.05 |
| Some college/trade/associate degrees | 1.42 | (1.05–1.93) | 0.02 |
| Reason for amputation (ref: nonmilitary trauma) | 0.002* | ||
| Cancer | 0.75 | (0.44–1.30) | 0.31 |
| Diabetes | 0.94 | (0.52–1.73) | 0.85 |
| Infection | 1.99 | (1.27–3.09) | 0.002 |
| Ischemia | 1.98 | (1.09–3.59) | 0.02 |
| Military trauma | 1.29 | (0.80–2.09) | 0.30 |
| Other | 1.82 | (1.24–2.68) | 0.002 |
| Level of amputation (ref: below knee) | 0.02* | ||
| Above elbow | 0.98 | (0.44–2.20) | 0.96 |
| Above/through knee | 0.76 | (0.57–1.01) | 0.06 |
| Below elbow | 0.29 | (0.13–0.65) | 0.003 |
| Hemipelvectomy | 0.87 | (0.34–2.22) | 0.77 |
| Shoulder disarticulation | 1.87 | (0.65–5.39) | 0.25 |
| Timing of amputation (ref: ≥10 years ago) | 0.50* | ||
| <1 year ago | 0.95 | (0.61–1.49) | 0.83 |
| 1–4 years ago | 1.15 | (0.81–1.64) | 0.44 |
| 5–9 years ago | 1.27 | (0.86–1.89) | 0.23 |
Odds ratios and 95% confidence intervals from cumulative logistic regression modeling odds of having a higher pain.
*Omnibus P value for overall variable effect across all values.
Fig. 1.
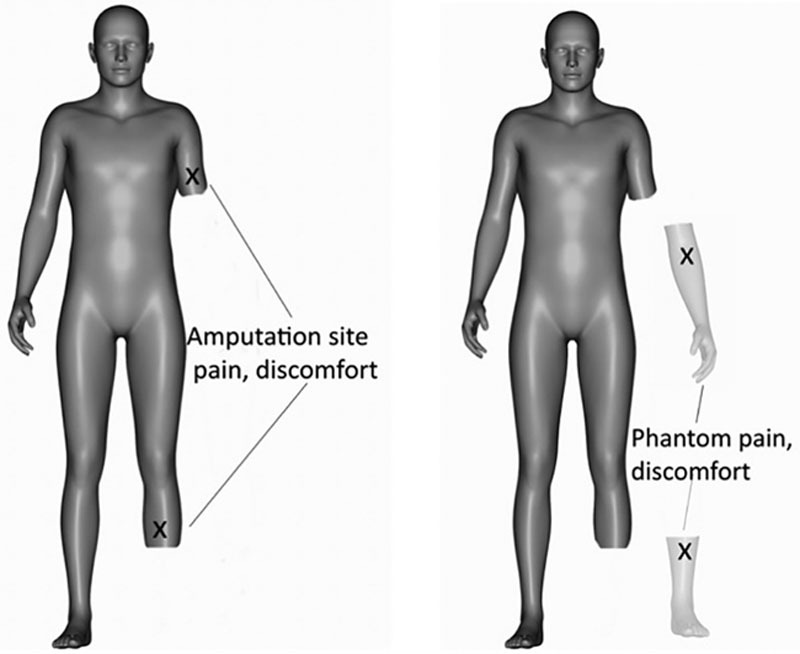
Avatar representation of residual limb and phantom limb pain in amputees.
DISCUSSION
Approximately three-fourths of individuals living with limb loss suffer from RLP or PLP (Fig. 1), which can lead to prosthesis intolerance, depression, and opioid use.1–4,28 This was corroborated through our survey results, summarized in Figure 2. The current literature on amputee-related pain offers a multitude of potential medical, behavioral, and surgical interventions. However, we lack detailed large-scale pain data in the amputee population using the appropriate PRO tools for proper evaluation of treatment efficacy.10,29–34 A study by Ephraim et al2 quantified phantom and RLP in over 900 amputee patients greater than a decade ago, yet the simplistic numerical scale used did not allow for evaluation of how pain impacted activity. Moreover, the study did not delve into potential differences in pain experienced based on amputation indication, amputation level, time since amputation, or certain patient demographic factors, nor did it use standard scoring to categorize pain as mild, moderate, and severe. Our study provides such benchmark data through the PROMIS while using the 11-point NRS as a legacy measure.
The PROMIS instruments of interest in this study were pain behavior, pain intensity, and pain interference. While this is the first application of PROMIS in the amputee population, a myriad of studies have used this PRO toolbox on other patient populations with various conditions, including chronic back pain and rheumatic disease.35,36 Using these validated PRO instruments gives us insight into how individuals react to pain and how pain affects patient-valued activities, in addition to the severity of discomfort. Our results show that the average scores for each parameter were similar for residual limb and PLP.
Interestingly, the median scores for both PLP intensity (46.8) and RLP intensity (46.6) were below the general population mean of 50, yet scores representing how people reacted to discomfort (PROMIS pain behavior) and the way pain impacted activity (PROMIS pain interference) were above the mean for both conditions. The reason for the lower average pain intensity score noted in this general amputee population in comparison to the average American is likely multifactorial in nature. One key factor is that the PROMIS pain intensity item was created through surveying patients with pain; all patients reporting no pain were excluded.37 Thus, our data are skewed to a lower value by roughly a quarter of participants reporting no pain.
The 70.5% of participants reporting PLP and 73.4% reporting RLP in our study are congruent with prior published data.1–4 Many of these individuals suffered simultaneously from RLP and PLP, as only 16.4% of patients endorsing RLP did not have congruent PLP. For those experiencing both RLP and PLP, the intensity at which they feel one form of pain tends to correspond linearly to the intensity at which they feel the other. For instance, those reporting severe PLP (NRS scores, 7–10) had higher average RLP scores (6.43) compared with those with moderate (NRS scores, 4–6) or mild (NRS scores, 1–3) PLP, whose residual limb scores averaged 4.58 and 2.82, respectively. As phantom limb is thought to be due to aberrant peripheral nerve signaling and cortical restructuring, there is some thought that residual limb, and specifically neuroma-related pain, could be a trigger for PLP.11–15 Our data bolster this theory with a potential interplay between RLP and PLP based on the presence and severity of pain.
Our results from subgroup analysis revealed differences in reported pain based on patient factors. Such findings will allow for improved patient education, including setting expectations, and may open the door for tailored treatments on certain subsets. Specifically, women were more likely to experience RLP or PLP and were at a higher intensity than men. As other studies have shown, women are more likely to report pain and may feel pain more intensely than men, thus contributing to the higher average scores.38 It is possible that women are more likely to develop symptomatic neuromas. Patients with proximal amputations experienced higher median PROMIS scores compared with those with distal amputations.39 This result implies that the number of divided axons relates to pain levels. When looking at time since amputation, individuals closer to the time of their amputation have significantly higher PROMIS and NRS average scores than those more than 10 years out. This is consistent with prior studies reporting decreasing PLP and RLP rates as patients progress from 6 months to 1 year out from amputation.5 It is difficult to ascertain whether this decrease in pain is attributable to quiescent nerve endings that were once excitable, cortical restructuring, mental perseverance, or various combinations.
Compared with the study by Ephraim et al,2 which only included dysvascular (ischemia), trauma, and cancer-related amputations, this study captured a broader range of indications for amputation, including infection and diabetes. Our findings show that oncologic amputations had the lowest median PROMIS pain scores compared with ischemia and infection, which had the highest. This is concordant with findings from Ephraim et al.2 Differences in pain based on reason for amputation may be related to the chronicity of the condition and how widely it impacts the affected nerves and surrounding tissues. Infection, ischemia, and trauma can create chronic and widespread damage to the involved nerves, leading to a larger zone of injury. Tissue damage from neuromas results in increased conduction of nociceptive impulses back to the central nervous system.39 A greater area of damage can in turn allow for more abnormal nociceptive signaling. The central nervous system responds with greater magnitude and duration of response to these abnormal stimuli, as well as a reduction in threshold. Subsequently, previously non-painful stimuli now activate neurons to transmit nociceptive information. Oncologic amputations may allow for a more focal area of injury as surgeons enter virgin tissues through sharp dissection.
We hope this baseline data on RLP and PLP using the PROMIS and NRS scores for the general amputee population can be used to improve analysis of amputee-related pain treatments. Specifically, future studies may now be able to determine how their degree of pain improvement relates to the general population; are these patients in worse, better, or the same amount of pain as the average amputee? In addition, knowledge of subsets of amputees who may be more prone to experience pain than others can propel practitioners toward more aggressive pain-prevention treatments for these predisposed groups.
Study Limitations
There are inherent weaknesses to this study. Although PROs are the gold standard for evaluation of pain, they rely on a patient’s ability to distinguish and self-report pain. That being said, PROMIS measures have been validated as useful tools across specialties.26,40–42 The NRS data in this study represent a 1-time evaluation of pain that can change over time. This is balanced with the PROMIS pain measures, which specifically assess pain over 24-hour and 7-day recall periods. Data for this sampled population differed depending on the means of patient recruitment. Subjects surveyed in the presence of a study coordinator had statistically lower pain than those who entered pain data via the unsupervised web advertisement. This is consistent with a recent publication that memory of chronic pain (thinking of the past at home) yields 16%–18% higher outcomes than the subjects’ pain at the moment (in front of the coordinator).43 To have a balanced sampling of amputee pain, half of the patients came from supervised and half from nonsupervised cohorts. In addition, because the goal of this study was to accrue data from a large, unselected group of amputees (deemed the general amputee population), there are inherent limitations secondary to methodology. We are unable to confirm amputee status, collect data on comorbidities, or ascertain narcotic use due to lack of access to medical records. Similarly, due to anonymity of the study, we are unable to track involved centers from which patients were recruited or to obtain a total sample size of the recruited individuals. Finally, our sampling technique was nonrepresentative, and our survey population is predominantly white and men. However, our population demographics mirror those of previous cross-sectional surveys of upper- and lower-limb amputees.2,44
CONCLUSIONS
Through this large-scale analysis using PROMIS scores, we provide benchmark data regarding residual limb and PLP intensity, behavior, and interference in amputees. These data delineate novel trends in pain based on patient demographic and amputation, which can be used to determine efficacy of behavioral, medical, and surgical modalities to treat amputee pain in the future.
ACKNOWLEDGMENTS
This work is supported by the Office of the Assistant Secretary of Defense for Health Affairs, through the Peer Reviewed Orthopaedic Research Program under Award No. W81XWH-13-2-0100. Opinions and recommendations are those of the author(s) and are not necessarily endorsed by the US Department of Defense. This work was also supported by the Frankel Foundation for the Study and Treatment of Amputees. The authors certify that the Northwestern Institutional Review Board approved the protocol for this investigation involving human participants and that the conduct of all investigation conformed to the protocol and the ethical and humane principles of research (IRB STU00101411).
Footnotes
Published online 15 July 2020.
Disclosure: The authors have no financial interest to declare in relation to the content of this article.
REFERENCES
- 1.Talbot LA, Brede E, Metter EJ. Psychological and physical health in military amputees during rehabilitation: secondary analysis of a randomized controlled trial. Mil Med. 2017;182:e1619–e1624. [DOI] [PubMed] [Google Scholar]
- 2.Ephraim PL, Wegener ST, MacKenzie EJ, et al. Phantom pain, residual limb pain, and back pain in amputees: results of a national survey. Arch Phys Med Rehabil. 2005;86:1910–1919. [DOI] [PubMed] [Google Scholar]
- 3.Ehde DM, Czerniecki JM, Smith DG, et al. Chronic phantom sensations, phantom pain, residual limb pain, and other regional pain after lower limb amputation. Arch Phys Med Rehabil. 2000;81:1039–1044. [DOI] [PubMed] [Google Scholar]
- 4.Smith DG, Ehde DM, Legro MW, et al. Phantom limb, residual limb, and back pain after lower extremity amputations. Clin Orthop Relat Res. 1999;361:29–38. [DOI] [PubMed] [Google Scholar]
- 5.Hsu E, Cohen SP. Postamputation pain: epidemiology, mechanisms, and treatment. J Pain Res. 2013;6:121–136. [DOI] [PMC free article] [PubMed] [Google Scholar]
- 6.Geraghty TJ, Jones LE. Painful neuromata following upper limb amputation. Prosthet Orthot Int. 1996;20:176–181. [DOI] [PubMed] [Google Scholar]
- 7.Lee SK, Wolfe SW. Peripheral nerve injury and repair. J Am Acad Orthop Surg. 2000;8:243–252. [DOI] [PubMed] [Google Scholar]
- 8.Fried K, Govrin-Lippmann R, Rosenthal F, et al. Ultrastructure of afferent axon endings in a neuroma. J Neurocytol. 1991;20:682–701. [DOI] [PubMed] [Google Scholar]
- 9.Dellon AL, Mackinnon SE, Pestronk A. Implantation of sensory nerve into muscle: preliminary clinical and experimental observations on neuroma formation. Ann Plast Surg. 1984;12:30–40. [DOI] [PubMed] [Google Scholar]
- 10.Ducic I, Mesbahi AN, Attinger CE, et al. The role of peripheral nerve surgery in the treatment of chronic pain associated with amputation stumps. Plast Reconstr Surg. 2008;121:908–914; discussion 15–17. [DOI] [PubMed] [Google Scholar]
- 11.Flor H, Elbert T, Knecht S, et al. Phantom-limb pain as a perceptual correlate of cortical reorganization following arm amputation. Nature. 1995;375:482–484. [DOI] [PubMed] [Google Scholar]
- 12.Flor H, Nikolajsen L, Staehelin Jensen T. Phantom limb pain: a case of maladaptive CNS plasticity? Nat Rev Neurosci. 2006;7:873–881. [DOI] [PubMed] [Google Scholar]
- 13.Montoya P, Ritter K, Huse E, et al. The cortical somatotopic map and phantom phenomena in subjects with congenital limb atrophy and traumatic amputees with phantom limb pain. Eur J Neurosci. 1998;10:1095–1102. [DOI] [PubMed] [Google Scholar]
- 14.Preissler S, Feiler J, Dietrich C, et al. Gray matter changes following limb amputation with high and low intensities of phantom limb pain. Cereb Cortex. 2013;23:1038–1048. [DOI] [PubMed] [Google Scholar]
- 15.Vaso A, Adahan HM, Gjika A, et al. Peripheral nervous system origin of phantom limb pain. Pain. 2014;155:1384–1391. [DOI] [PubMed] [Google Scholar]
- 16.Pet MA, Ko JH, Friedly JL, et al. Does targeted nerve implantation reduce neuroma pain in amputees? Clin Orthop Relat Res. 2014;472:2991–3001. [DOI] [PMC free article] [PubMed] [Google Scholar]
- 17.Noguchi S, Saito J, Nakai K, et al. Factors affecting phantom limb pain in patients undergoing amputation: retrospective study. J Anesth. 2019;33:216–220. [DOI] [PubMed] [Google Scholar]
- 18.Fieldsen D, Wood S. Dealing with phantom limb pain after amputation. Nurs Times. 2011;107:21–23. [PubMed] [Google Scholar]
- 19.Williamson A, Hoggart B. Pain: a review of three commonly used pain rating scales. J Clin Nurs. 2005;14:798–804. [DOI] [PubMed] [Google Scholar]
- 20.Jensen MP, Karoly P. Self-report scales and procedures for assessing pain in adults. Handbook of Pain Assessment. 2001New York: The Guilford Press; [Google Scholar]
- 21.Hehr JD, Bowen B, Alexander JH, et al. Targeted reinnervation in the amputee patient updates for multiple cohorts on pain outcomes and narcotic use trends. J Am Coll Surg. 2018;227:S212. [Google Scholar]
- 22.Cella D, Riley W, Stona A, et al. The Patient-Reported Outcomes Measurement Information System (PROMIS) developed and tested its first wave of adult self-reported health outcome item banks: 2005-2008. J Clin Epidemiol. 2010;63:1179–1194. [DOI] [PMC free article] [PubMed] [Google Scholar]
- 23.Merriwether E, Rakel B, Zimmerman M, et al. Validity and reliability of the patient-reported outcomes measurement information system (PROMIS) for pain interference and quality of life in women with fibromyalgia. J Pain. 2015;16:S4. [DOI] [PMC free article] [PubMed] [Google Scholar]
- 24.Flynn DM, Cook K, Kallen M, et al. Use of the pain assessment screening tool and outcomes registry in an army interdisciplinary pain management center, lessons learned and future implications of a 10-Month Beta Test. Military Med. 2017;182S1167–174. [DOI] [PubMed] [Google Scholar]
- 25.Farrell J, Huang B, Carle A, et al. Construct validity and responsiveness of PROMIS measures in juvenile idiopathic arthritis and chronic musculoskeletal pain. Ann Rheumatic Dis. 2013;72:737. [Google Scholar]
- 26.Revicki DA, Chen WH, Harnam N, et al. Development and psychometric analysis of the PROMIS pain behavior item bank. Pain. 2009;146:158–169. [DOI] [PMC free article] [PubMed] [Google Scholar]
- 27.Neumeister MW, Winters JN. Neuroma. Clin Plast Surg. 2020;47:279–283. [DOI] [PubMed] [Google Scholar]
- 28.Huse E, Larbig W, Flor H, et al. The effect of opioids on phantom limb pain and cortical reorganization. Pain. 2001;90:47–55. [DOI] [PubMed] [Google Scholar]
- 29.Alviar MJ, Hale T, Dungca M. Pharmacologic interventions for treating phantom limb pain. Cochrane Database Syst Rev. 2016;10:CD006380. [DOI] [PMC free article] [PubMed] [Google Scholar]
- 30.Bosanquet DC, Glasbey JC, Stimpson A, et al. Systematic review and meta-analysis of the efficacy of perineural local anaesthetic catheters after major lower limb amputation. Eur J Vasc Endovasc Surg. 2015;50:241–249. [DOI] [PubMed] [Google Scholar]
- 31.Dellon AL, Mackinnon SE, Pestronk A. Implantation of sensory nerve into muscle: preliminary clinical and experimental observations on neuroma formation. Ann Plast Surg. 1984;12:30–40. [DOI] [PubMed] [Google Scholar]
- 32.Flor H, Denke C, Schaefer M, et al. Effect of sensory discrimination training on cortical reorganisation and phantom limb pain. Lancet. 2001;357:1763–1764. [DOI] [PubMed] [Google Scholar]
- 33.Johnson MI, Mulvey MR, Bagnall AM. Transcutaneous electrical nerve stimulation (TENS) for phantom pain and stump pain following amputation in adults. Cochrane Database Syst Rev. 2015;8:CD007264. [DOI] [PMC free article] [PubMed] [Google Scholar]
- 34.Richardson C, Kulkarni J. A review of the management of phantom limb pain: challenges and solutions. J Pain Res. 2017;10:1861–1870. [DOI] [PMC free article] [PubMed] [Google Scholar]
- 35.Boody BS, Bhatt S, Mazmudar AS, et al. Validation of Patient-Reported Outcomes Measurement Information System (PROMIS) computerized adaptive tests in cervical spine surgery. J Neurosurg Spine. 2018;5:1–12. [DOI] [PMC free article] [PubMed] [Google Scholar]
- 36.Nagaraja V, Mara C, Khanna PP, et al. Establishing clinical severity for PROMIS® measures in adult patients with rheumatic diseases. Qual Life Res. 2018;27:755–764. [DOI] [PMC free article] [PubMed] [Google Scholar]
- 37.Chen WH, Revick DA, Amtmann D, et al. Development and analysis of PROMIS pain intensity scale. Qual Life Res. 2012;20suppl 118. [Google Scholar]
- 38.Wiesenfeld-Hallin Z. Sex differences in pain perception. Gend Med. 2005;2:137–145. [DOI] [PubMed] [Google Scholar]
- 39.Dahl JB, Mathiesen O, Møiniche S. ‘Protective premedication’: an option with gabapentin and related drugs? A review of gabapentin and pregabalin in the treatment of post-operative pain. Acta Anaesthesiol Scand. 2004;48:1130–1136. [DOI] [PubMed] [Google Scholar]
- 40.Chen WH, Revicki D, Amtmann D, et al. Development and analysis of PROMIS pain intensity scale. Qual Life Res. 2012;20:18. [Google Scholar]
- 41.Amtmann D, Cook KF, Jensen MP, et al. Development of a PROMIS item bank to measure pain interference. Pain. 2010;150:173–182. [DOI] [PMC free article] [PubMed] [Google Scholar]
- 42.Askew RL, Cook KF, Revicki DA, et al. Evidence from diverse clinical populations supported clinical validity of PROMIS pain interference and pain behavior. J Clin Epidemiol. 2016;73:103–111. [DOI] [PMC free article] [PubMed] [Google Scholar]
- 43.Berger SE, Vachon-Presseau É, Abdullah TB, et al. Hippocampal morphology mediates biased memories of chronic pain. Neuroimage. 2018;166:86–98. [DOI] [PMC free article] [PubMed] [Google Scholar]
- 44.Desmond DM, Maclachlan M. Prevalence and characteristics of phantom limb pain and residual limb pain in the long term after upper limb amputation. Int J Rehabil Res. 2010;33:279–282. [DOI] [PubMed] [Google Scholar]