Abstract
Background
The CACNA1C gene was defined as a risk gene for schizophrenia in a large genome-wide association study of European ancestry performed by the Psychiatric Genomics Consortium. Previous meta-analyses focused on the association between the CACNA1C gene rs1006737 and schizophrenia. The present study focused on whether there was an ancestral difference in the effect of the CACNA1C gene rs1006737 on schizophrenia. rs2007044 and rs4765905 were analyzed for their effect on the risk of schizophrenia.
Methods
Pooled, subgroup, sensitivity, and publication bias analysis were conducted.
Results
A total of 18 studies met the inclusion criteria, including fourteen rs1006737 studies (15,213 cases, 19,412 controls), three rs2007044 studies (6007 cases, 6518 controls), and two rs4765905 studies (2435 cases, 2639 controls). An allele model study also related rs2007044 and rs4765905 to schizophrenia. The overall meta-analysis for rs1006737, which included the allele contrast, dominant, recessive, codominance, and complete overdominance models, showed significant differences between rs1006737 and schizophrenia. However, the ancestral-based subgroup analysis for rs1006737 found that the genotypes GG and GG + GA were only protective factors for schizophrenia in Europeans. In contrast, the rs1006737 GA genotype only reduced the risk of schizophrenia in Asians.
Conclusions
Rs1006737, rs2007044, and rs4765905 of the CACNA1C gene were associated with susceptibility to schizophrenia. However, the influence model for rs1006737 on schizophrenia in Asians and Europeans demonstrated both similarities and differences between the two ancestors.
Keywords: Meta-analysis, CACNA1C, rs1006737, rs2007044, rs4765905, Schizophrenia
Background
Schizophrenia is a chronic, disabling brain disease characterized by delusions, hallucinations, and formal thought disorders in addition to a decline in socio-occupational functioning [1]. Studies with twins [2] and adoptive families [3] have shown that genetic factors are an important cause of schizophrenia. The L-type voltage-gated calcium channels play a unique role in behavioral extinction [4], inhibitory learning, and the maturation of adult cognitive function [5]. The two principal pore-forming subunits of these channels expressed in neurons are the α1C and α1D subtypes [6]. The α1C subtype is encoded by the CACNA1C gene, which is considered a risk factor for schizophrenia based on a large genome-wide association study (GWAS) of European ancestry performed by the Psychiatric Genomics Consortium (PGC) [7]. A growing body of research supports a key role for CACNA1C in schizophrenia in Europeans. Ivorra et al. [8] found that the rs1006737 polymorphism of the CACNA1C gene is strongly associated with schizophrenia and bipolar disorder in a Spanish sample. Wolf et al. [9] suggested that the CACNA1C genotype may explain inter-individual differences in the amygdala volume among patients with schizophrenia in the German sample. The amygdala is not only involved in associative learning but also regulates additional cognitive processes, such as memory and attention [10]. Fatima et al. [11] detected a significant difference in the genotype and allele frequencies for the rs4765905 polymorphism between patients and controls, confirming the hypothesis that the CACNA1C gene was associated with schizophrenia in the Pakistani sample. Rs1006737 and rs4765905 are located in intron 3 of CACNA1C gene. And previous study [12] have shown that disease-related SNPs in the CACNA1C gene (including rs1006737 and rs4765905) were proven to be expression quantitative trait loci (eQTLs), which are located in a region interacting with the promoter of CACNA1C, and may regulate the expression of CACNA1C in the brain.
Based on these findings, we were curious to see if the CACNA1C gene had the same effect on schizophrenia in Asians as it did in the Europeans. The meta-analysis of Zheng et al. [13] and Jiang et al. [14] showed that there was no heterogeneity between the CACNA1C rs1006737 polymorphism in East Asians and Europeans. He et al. [15] also showed that rs1006737 was associated with both schizophrenia and major depressive disorder in the Han Chinese sample. Additional rs1006737 meta-analysis showed an association between this CACNA1C polymorphism and schizophrenia in both the Europeans and Asians when the samples were stratified by ethnicity [16]. However, in a follow-up to the top European GWAS hits, The genotyping performed by Takahashi et al. [17] implicated loci in additional schizophrenia family samples from China and Japan and found no association between 12 polymorphisms (e.g., rs4765905 in the CACNA1C gene) and schizophrenia. Consistent with this finding, Hori et al. [18] found no significant difference in the genotype or allele frequency of the CACNA1C rs1006737 polymorphism between schizophrenia patients and controls in a Japanese sample.
In summary, there is no consensus on whether CACNA1C is associated with schizophrenia or if there are differences in susceptibility to schizophrenia between Asians and Europeans. Therefore, we performed an updated comprehensive meta-analysis on the relationship between CACNA1C gene polymorphisms and schizophrenia, which included case-control studies.
Methods
Literature search strategy
To identify eligible studies, we searched two electronic databases, PubMed and China’s National Knowledge Infrastructure [CNKI]. English studies were obtained by PubMed (2011-Present) database, and Chinese studies were obtained by CNKI (2013-Present) database. Only completed peer-review studies have the potential to be included in the present meta-analysis. The last search update was in November 2019. Rs1006737, rs2007044, rs4765905, CACNA1C, and schizophrenia were selected as search keywords.
The inclusion criteria for the present study were: a. including patients with schizophrenia; b. containing detailed genotypes and allele frequencies; c. including healthy control population; d. stating CACNA1C may be a potential gene of schizophrenia; e. the type of studies were case-control studies. The current exclusion criteria for meta-analysis were: a. no schizophrenic patients; b. no detailed genotype frequency data; c. no controls; d. abstracts, meta-analysis or reviews; e. not case-control studies; f. including repeated sample; g. containing 2014 PGC GWAS data [19].
Data extraction
Two independent authors conduct data extraction according to the inclusion and exclusion criteria. If there was inconsistency between the two authors, they will hold discussions until an agreement was reached. Table 1 summarizes the first author’s last name, publication year, region, ancestry, source of control, mean age of control group, gender index, number of case group and control group, and the number of genotypes in case and control group.
Table 1.
The main characteristics of the studies included in the meta-analysis
| Author | Year | Country | Ancestor | Source of control group | Mean age of control group | Gender index (case) | Gender index (control) | Case/Control |
|---|---|---|---|---|---|---|---|---|
| Rs1006737 | ||||||||
| Fatima [11] | 2017 | Pakistani | Caucasian | Population based | 44 | 0.33 | 0.71 | 508/300 |
| Lubeiro [20] | 2018 | Spain | Caucasian | Population based | 29.52 | 0.72 | 0.98 | 50/101 |
| Mallas [21] | 2016 | Mixed | Mixed | Population based | 35.79 | 0.26 | 0.85 | 63/124 |
| Porcelli [22] | 2015 | Korean | Asian | Hospital based | 45.36 | 0.73 | 1.22 | 176/326 |
| Ivorra [8] | 2014 | Spain | Caucasian | Mixed | 43.61 | 0.79 | 0.75 | 3063/2847 |
| He [15] | 2013 | China | Asian | Population based | 30.6 | 0.53 | 0.86 | 1235/1235 |
| Guan [23] | 2013 | China | Asian | Population based | 34.2 | 0.87 | 0.83 | 1430/1570 |
| Galaktionova [24] | 2013 | Russia | Caucasian | Population based | 36 | 2.24 | 0.90 | 188/192 |
| Zheng [13] | 2013 | China | Asian | Population based | 32.4 | 1.05 | 1.04 | 5893/6319 |
| Hori [18] | 2012 | Japan | Asian | Population based | 46 | 0.82 | 1.93 | 552/1132 |
| Zhang [25] | 2011 | China | Asian | Population based | 22.3 | 0.49 | 0.60 | 318/401 |
| Nyegaard [26] | 2010 | Denmark | Caucasian | Population based | – | – | – | 976/1489 |
| Bigos [27] | 2010 | Caucasian | Population based | 33.09 | 0.230 | 1.16 | 282/440 | |
| Green [28] | 2009 | UK | Caucasian | Population based | – | 0.47 | 1.04 | 479/2936 |
| Rs2007044 | ||||||||
| Bustillo [29] | 2017 | United States | Caucasian | Population based | 36 | 0.26 | 0.37 | 53/129 |
| Zhang [30] | 2018 | China | Asian | Hospital based | 27.14 | 0.15 | 0.28 | 53/129 |
| Rs4765905 | ||||||||
| Sudesh [31] | 2018 | India | Indian | Population based | 38.73 | 1.01 | 0.483 | 1005/1069 |
Notes: Gender index = female/male; Guan’s study included the main characteristics of both rs1006737 and rs4765905; Zheng’s study included the main characteristics of both rs1006737 and rs2007044
Sensitivity analysis and publication bias
Sensitivity analysis was used to evaluate whether the combined results were stable and reliable. Funnel plots (the x-axis was the logarithm of OR, and the y-axis was the standard error of the logarithm of the OR) were used to determine whether the included studies had publication bias. Egger’s test [32] was used to assess the level of publication bias. P-value greater than 0.05 indicates a publication bias.
Statistical analysis
We evaluated the Hardy-Weinberg equilibrium (HWE) in the control group of each study using Pearson’s chi-square test. The odds ratios (ORs) and 95% confidence intervals (CIs) were used to evaluate the correlation between polymorphisms rs1006737, rs4765905, rs2007044 and schizophrenia risk. The Cochran’s Q-test [33] and I2 statistics [34] were selected to check the heterogeneity among studies. Cochran’s Q-test is qualitative. If a P-value was greater than 0.1, it means a lack of heterogeneity, and the fixed effect model (Mantel-Haenszel) was selected. Conversely, a p-value was less than 0.1, indicating the existence of heterogeneity. The random effect model (M-H heterogeneity) was selected [35]. I2 is quantitative statistics, which refers to the ratio of the variation between studies to the total variation. It was divided into three groups according to heterogeneity level: low (less than 25%), moderate (25 to 75%), and high (greater than 75%). The “a” was marked as the risk allele. We use allelic: a vs. A, dominant: Aa + AA vs. AA, recessive: aa vs. AA, and codominant: aa vs. AA and Aa vs. AA, and complete overdominance: AA + aa vs. Aa models to calculate the pooled ORs. Besides, a subgroup analysis based on ancestry was conducted.
Meta-regression analysis was performed to assess the impact of different variables (mean age of control group and sex indexes) on the analysis. Statistical calculations were performed using Stata version 12.0 (StataCorp LP, College Station, TX, USA) software. P-value less than 0.05 indicates statistical difference (two tails).
Results
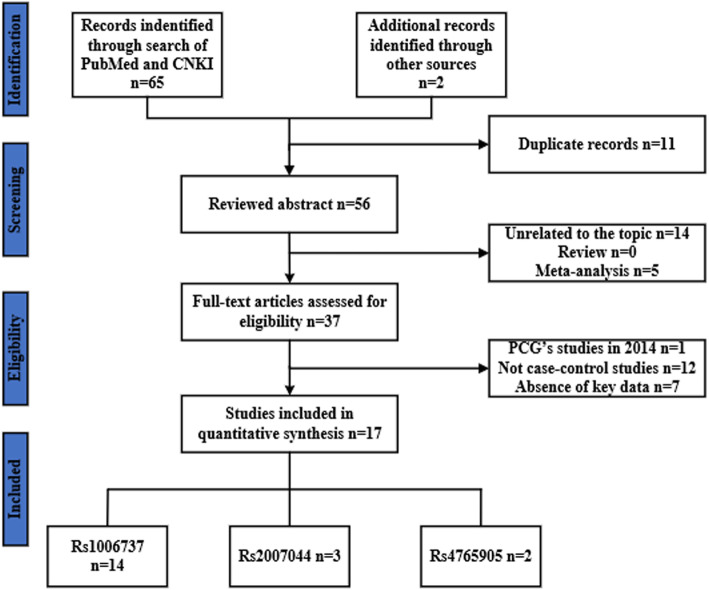
We investigated 67 related articles from PubMed and CNKI electronic databases. Studies that did not conform to the inclusion criteria were excluded, and 18 studies were available for meta-analysis (Fig.1). Specifically, these 18 studies included 14 rs1006737 studies (15,213 cases and 19,412 controls), three rs2007044 studies (6007 cases and 6518 controls), and two rs4765905 studies (2435 cases and 2639 controls). The allelic and genotype distributions of all included studies were summarized in Table 2.
Fig. 1.
Flow diagram for the search and selection of the included studies. A total of 67 relevant English and Chinese studies were retrieved from the PubMed and CNKI databases. Following removal of the studies that did not meet our inclusion criteria, a total of 19 studies were included in the meta-analysis, including 14 rs1006737 studies, three rs2007044 studies, and two rs4765905 studies
Table 2.
The distributions of the allele frequency and genotype in the included studies
| Author | Year | Genotype distribution | PHWE | Allele frequency | ||||||||
|---|---|---|---|---|---|---|---|---|---|---|---|---|
| ss | Cases, n | Controls, n | Cases (%) | Control (%) | ||||||||
| AA | Aa | aa | AA | Aa | aa | A | a | A | a | |||
| Rs1006737 | ||||||||||||
| Lubeiro | 2018 | 25 | 23 | 2 | 58 | 38 | 5 | 0.70 | 73 (73.0) | 27 (27.0) | 154 (76.2) | 48 (23.8) |
| Fatima | 2017 | 393 | 84 | 17 | 235 | 54 | 9 | 0.01 | 870 (88.1) | 118 (11.9) | 524 (88.0) | 72 (12.0) |
| Ivorra | 2014 | 1417 | 1271 | 293 | 1420 | 1124 | 240 | 0.41 | 4105 (68.9) | 1857 (31.1) | 3964 (71.2) | 1604 (28.8) |
| Galaktionova | 2013 | 78 | 85 | 23 | 80 | 90 | 22 | 0.66 | 241 (64.8) | 131 (35.2) | 250 (65.1) | 134 (34.9) |
| Nyegaard | 2010 | 402 | 444 | 130 | 656 | 675 | 158 | 0.42 | 1248 (63.9) | 704 (36.1) | 1987 (66.7) | 991 (33.3) |
| Bigos | 2010 | 120 | 115 | 47 | 191 | 205 | 44 | 0.31 | 355 (62.9) | 209 (37.1) | 587 (66.7) | 293 (33.3) |
| Green | 2009 | 205 | 208 | 66 | 1367 | 1233 | 336 | 0.02 | 618 (64.5) | 340 (35.5) | 3967 (67.6) | 1095 (32.4) |
| Mallas | 2016 | 23 | 30 | 10 | 56 | 51 | 17 | 0.33 | 76 (60.3) | 50 (39.7) | 163 (65.7) | 85 (34.3) |
| Porcelli | 2015 | 153 | 23 | 0 | 301 | 23 | 2 | 0.11 | 329 (93.5) | 23 (6.5) | 625 (95.9) | 27 (4.1) |
| He | 2013 | 996 | 220 | 14 | 1053 | 166 | 9 | 0.39 | 2212 (89.9) | 248 (10.1) | 2272 (92.5) | 184 (7.5) |
| Guan | 2013 | 1061 | 343 | 26 | 1223 | 327 | 20 | 0.72 | 2465 (86.2) | 395 (13.8) | 2773 (88.3) | 367 (11.7) |
| Zheng | 2013 | 5239 | 635 | 19 | 5706 | 597 | 16 | 0.93 | 11,113 (94.3) | 673 (5.7) | 12,009 (95.0) | 629 (5.0) |
| Hori | 2012 | 480 | 70 | 2 | 1002 | 127 | 3 | 0.63 | 1030 (93.3) | 74 (6.7) | 2131 (94.1) | 133 (5.9) |
| Zhang | 2011 | 280 | 37 | 1 | 357 | 42 | 2 | 0.53 | 597 (93.9) | 39 (6.1) | 756 (94.3) | 46 (5.7) |
| Rs2007044 | ||||||||||||
| Zhang | 2018 | 24 | 25 | 4 | 58 | 57 | 14 | 1.00 | 73 (68.9) | 33 (31.1) | 173 (67.1) | 85 (32.9) |
| Bustillo | 2017 | 26 | 23 | 9 | 35 | 21 | 11 | 0.02 | 75 (64.7) | 41 (35.3) | 91 (67.9) | 43 (32.1) |
| Zheng | 2014 | 2797 | 2540 | 559 | 3166 | 2597 | 559 | 0.42 | 8134 (77.5) | 3658 (22.5) | 8929 (70.7) | 3715 (29.3) |
| Rs4765905 | ||||||||||||
| Sudesh | 2018 | 579 | 307 | 51 | 668 | 286 | 38 | 0.29 | 1465 (78.2) | 409 (21.8) | 1622 (81.8) | 362 (18.2) |
| Guan | 2013 | 1307 | 360 | 33 | 1195 | 352 | 24 | 0.74 | 2434 (71.6) | 426 (28.4) | 2741 (87.2) | 399 (12.8) |
Notes:PHWE, P-value of the Hardy–Weinberg equilibrium; A, wild-type allele; a, mutant allele
CACNA1C Rs1006737 polymorphism
ORs were estimated in allelic (A vs. G), dominant (GA + AA vs. GG), recessive (AA vs. GG), codominance (AA vs. GG and GA vs. GG), and complete overdominance (GG + AA vs. GA) models (A was the risk allele). All models except for the codominance model (GA vs. GG) were performed using the fixed effects model (M-H) due to the low heterogeneity. In contrast, the codominance model (GA vs. GG) was performed using the random effects model (M-H) due to its high heterogeneity (I2 = 99%).
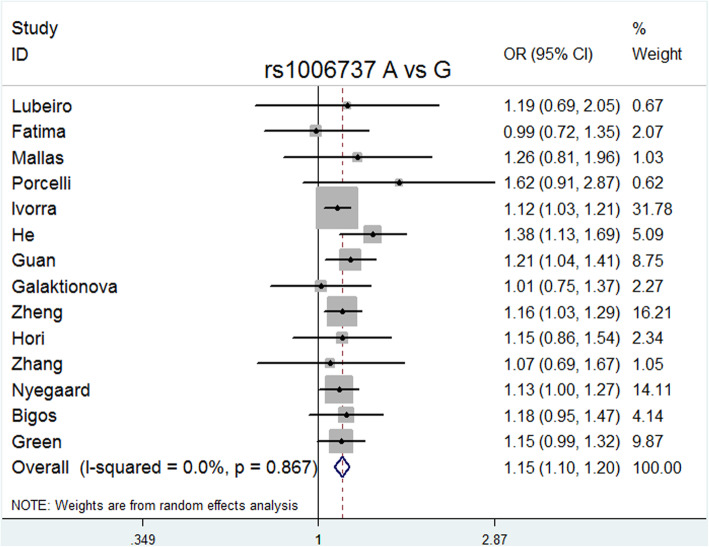
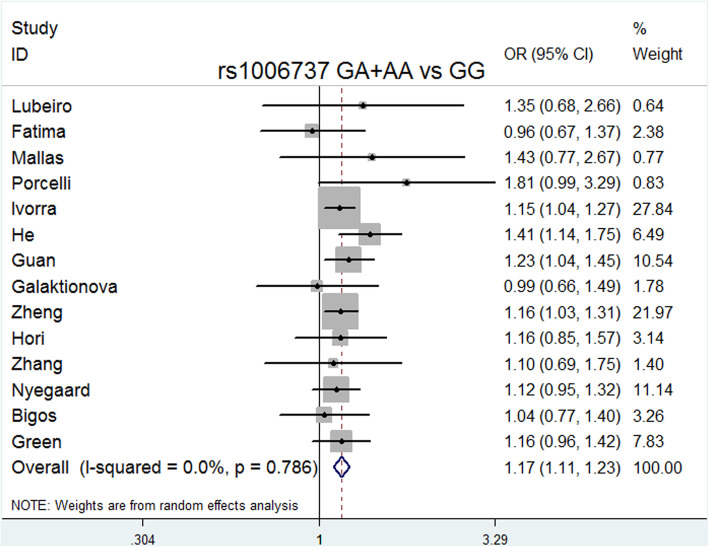
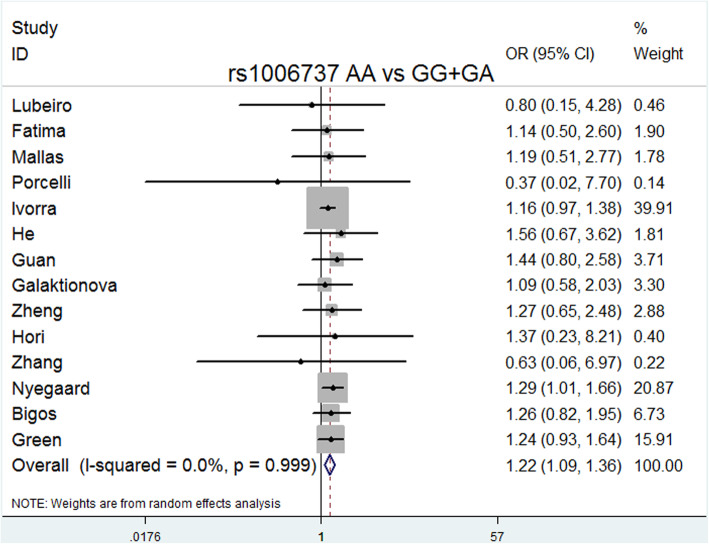
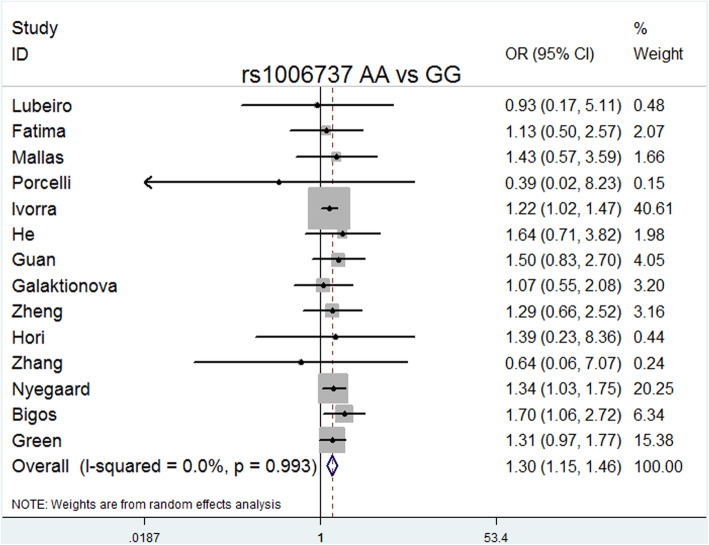
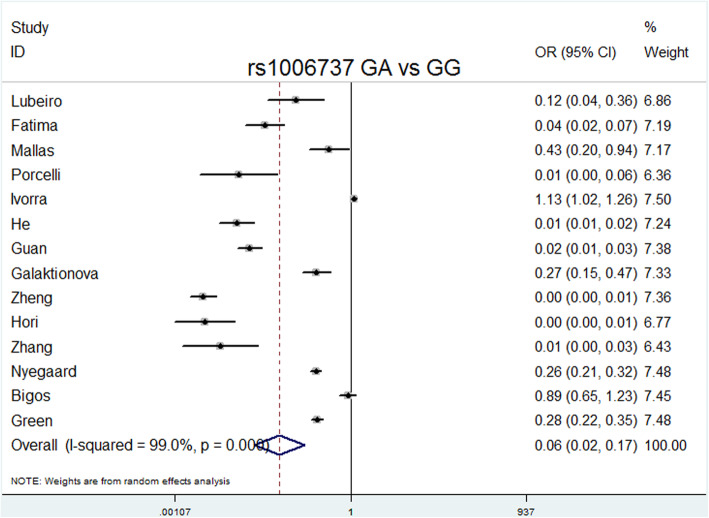
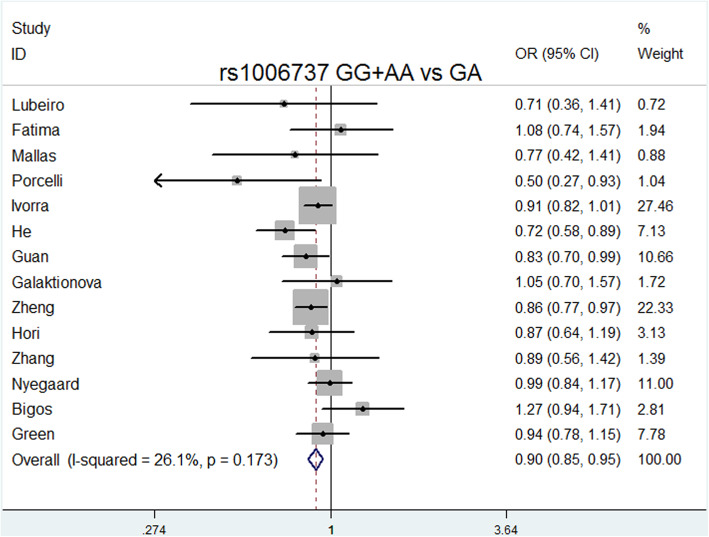
The overall meta-analysis (Table 3) showed that rs1006737 was significantly associated with schizophrenia risk in the following models: allele model (A vs. G: P = 0.000, OR = 1.151, 95% CI = 1.100–1.204, I2 = 0.0%, P heterogeneity = 0.867); dominant model (GA + AA vs. GG: P = 0.000, OR = 1.169, 95% CI = 1.107–1.234, I2 = 0.0%, P heterogeneity = 0.786); recessive model (AA vs. GG + GA: P = 0.001, OR = 1.215, 95% CI = 1.085–1.360, I2 = 0.0%, P heterogeneity = 0.999); codominance models (AA vs. GG: P = 0.000, OR = 1.296, 95% CI = 1.151–1.459, I2 = 0.0%, P heterogeneity = 0.993); codominance model (GA vs. GG: P = 0.000, OR = 0.064, 95% CI = 0.024–0.169, I2 = 99%, P heterogeneity = 0.000), and complete overdominance model (GG + AA vs. GA: P = 0.000, OR = 0.897, 95% CI = 0.849–0.948, I2 = 26.1%, P heterogeneity = 0.173).
Table 3.
The main results of the overall meta-analysis of CACNA1C polymorphisms
| Genetic model | OR | 95% CI | P-value | I2(%) | Ph | Combination method |
|---|---|---|---|---|---|---|
| Rs1006737 | ||||||
| Allele contrast | 1.151 | 1.100–1.204 | 0.000 | 0.0 | 0.867 | Fixed effects model |
| Dominant | 1.169 | 1.107–1.234 | 0.000 | 0.0 | 0.786 | Fixed effects model |
| Recessive | 1.215 | 1.085–1.360 | 0.001 | 0.0 | 0.999 | Fixed effects model |
| Codominance AA vs. GG | 1.296 | 1.151–1.459 | 0.000 | 0.0 | 0.993 | Fixed effects model |
| Codominance GA vs. GG | 0.064 | 0.024–0.169 | 0.000 | 99.0 | 0.000 | Random effects model |
| Complete overdominance | 0.897 | 0.849–0.948 | 0.000 | 26.1 | 0.173 | Fixed effects model |
| Rs2007044 | ||||||
| Allele contrast | 1.080 | 1.023–1.139 | 0.006 | 0.0 | 0.785 | Fixed effects model |
| Rs4765905 | ||||||
| Allele contrast | 1.225 | 1.100–1.364 | 0.000 | 0.0 | 0.719 | Fixed effects model |
Notes: I2 represents the variation in OR attributable to heterogeneity. Ph represents the P-value of the Q-test for heterogeneity
Abbreviations:CI confidence interval; OR odds ratio
Subsequently, subgroup analysis based on ancestor was performed for rs1006737. For the Caucasians, there were seven studies that included a total of 5546 patients with schizophrenia and 8305 controls. Rs1006737 was associated with schizophrenia using all but one genetic model (A vs. G, P = 0.000, OR = 1.121, 95% CI = 1.060–1.186; GA + AA vs. GG, P = 0.001, OR = 1.127, 95% CI = 1.047–1.213; AA vs. GG + GA, P = 0.003, OR = 1.203, 95% CI = 1.067–1.357; AA vs. GG, P = 0.000, OR = 1.284, 95% CI = 1.131–1.456; GA vs. GG, P = 0.001, OR = 0.279, 95% CI = 0.132–0.587). The complete overdominance model (GG + AA vs. GA) resulted in an OR = 0.959, 95% CI = 0.891–1.033, and P = 0.272.
The subgroup analysis also included six studies involving Asians with a total of 9604 patients with schizophrenia and 10,983 controls. Rs1006737 was associated with schizophrenia using the following models: allele contrast model (A vs. G: P = 0.000, OR = 1.206, 95% CI = 1.117–1.303); dominant model (GA + AA vs. GG: P = 0.000, OR = 1.219, 95% CI = 1.123–1.323); codominance model (GA vs. GG; OR = 0.008, 95% CI = 0.004–0.017, P = 0.000); complete overdominance model (GG + AA vs. GA: P = 0.000, OR = 0.827, 95% CI = 0.761–0.899). There was no association observed using the recessive (AA vs. GG + GA: P = 0.125, OR = 1.336, 95% CI = 0.922–1.936) or codominance model (AA vs. GG: P = 0.086, OR = 1.384, 95% CI = 0.955–2.006) models (Table 4). Neither the mean age of the control group (slope = 0.995, 95% CI = 0.985–1.005, P = 0.265) nor the sex indexes (case group, slope = 0.943, 95% CI = 0.797–1.115, P = 0.455; control group, slope = 1.059, 95% CI = 0.829–1.352, P = 0.616) had any significant impact on the results.
Table 4.
Subgroup analysis of the association between rs1006737 and the risk of schizophrenia
| Ancestor | Summary of pooled ORs | Heterogeneity test | |||
|---|---|---|---|---|---|
| OR | 95% CI | P-value | I2(%) | Ph | |
| Asian | |||||
| Allele contrast | 1.206 | 1.117–1.303 | 0.000 | 0.0 | 0.583 |
| Dominant | 1.219 | 1.123–1.323 | 0.000 | 0.0 | 0.484 |
| Recessive | 1.336 | 0.922–1.936 | 0.125 | 0.0 | 0.939 |
| Codominance AA vs. GG | 1.384 | 0.955–2.006 | 0.086 | 0.0 | 0.932 |
| Codominance GA vs. GG | 0.008 | 0.004–0.017 | 0.000 | 83.6 | 0.000 |
| Complete overdominance | 0.827 | 0.761–0.899 | 0.000 | 0.0 | 0.434 |
| Caucasian | |||||
| Allele contrast | 1.121 | 1.060–1.186 | 0.000 | 0.0 | 0.964 |
| Dominant | 1.127 | 1.047–1.213 | 0.001 | 0.0 | 0.919 |
| Recessive | 1.203 | 1.067–1.357 | 0.003 | 0.0 | 0.987 |
| Codominance AA vs. GG | 1.284 | 1.131–1.456 | 0.000 | 0.0 | 0.893 |
| Codominance GA vs. GG | 0.279 | 0.132–0.587 | 0.001 | 98.0 | 0.000 |
| Complete overdominance | 0.959 | 0.891–1.033 | 0.272 | 0.0 | 0.457 |
Notes: I2 represents the variation in OR attributable to heterogeneity. Ph represents the P-value of the Q-test for heterogeneity Abbreviations:CI confidence interval; OR odds ratio
Rs2007044 and rs4765905 polymorphisms of CACNA1C
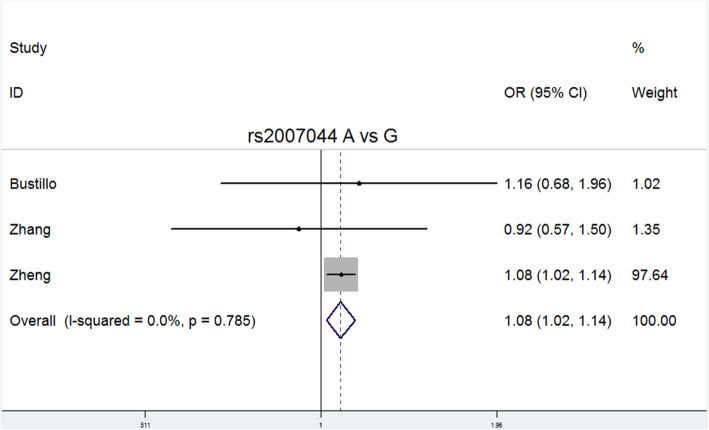
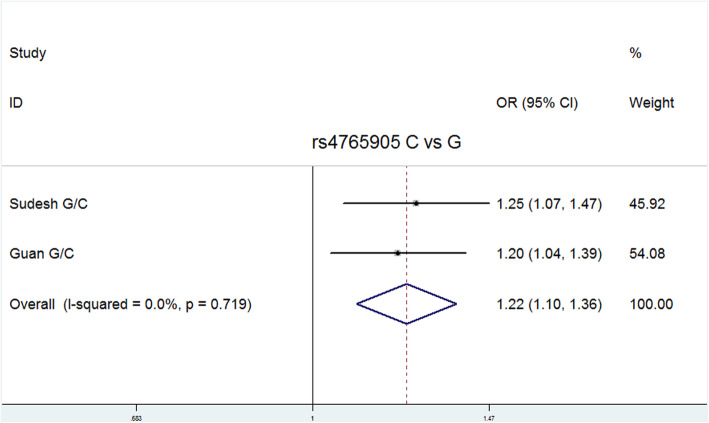
Allele G of rs2007044 and allele C of rs4765905 were defined as risk alleles. Because relatively few studies related to rs2007044 and rs4765905 were included in the meta-analysis, only the allele model for these two polymorphisms was analyzed. Significant differences between the patients and controls were observed for both rs2007044 (G vs. A: P = 0.006, OR = 1.080, 95% CI = 1.023–1.139) and rs4765905 (C vs. G: P = 0.000, OR = 1.225, 95% CI = 1.100–1.364). The main results are presented in Table 3.
Sensitivity analysis and publication bias
Delete each study item by item, and then calculate the significance of the new meta-analysis results consisting of the remaining studies [36]. We did not observe statistically significant differences, indicating that the current results are reliable and stable and have not been affected by any separate studies. (Table 5). The symmetry of the funnel plots can reflect the publication bias (Figs. 2, 3, 4, 5, 6, 7, 8 and 9). Egger’s test quantifies the publication bias analysis. Due to the lack of studies on rs4765905, the efficacy of the Egger’s test was limited, and the symmetry of the funnel plot could not be detected. We did not find publication bias in the rs2007044 (G vs. A; t = − 0.43, P = 0.743) or rs4765905 (A vs. G; t = 0.86, P = 0.407) allele model. For rs1006737, there were no publication biases in the dominant (GA + AA vs. GG: P = 0.613, t = 0.52), recessive (TT vs. GG + GT: P = 0.507, t = − 0.68), codominant (AA vs. GG: P = 0.713, t = − 0.38) and complete overdominance (GG + TT vs. GT: P = 0.762, t = − 0.31) models. However, there was a publication bias for the rs1006737 polymorphism with the codominance model (AA vs. GG; t = − 3.88, P = 0.002).
Table 5.
Results of the sensitivity analysis for the CACNA1C rs1006737 polymorphism
| Excluded | OR | 95% CI | P-value | Ph | |
|---|---|---|---|---|---|
| Study | Sample | ||||
| Lubeiro | Caucasian | 1.1506206 | 1.0998443–1.2037411 | 0.000 | 0.815 |
| Fatima | Caucasian | 1.1546086 | 1.1033095–1.2082929 | 0.000 | 0.878 |
| Mallas | Mixed | 1.1497633 | 1.0989355–1.202942 | 0.000 | 0.826 |
| Porcelli | Asian | 1.1485037 | 1.0978361–1.2015097 | 0.000 | 0.903 |
| Ivorra | Caucasian | 1.166579 | 1.1047648–1.2318518 | 0.000 | 0.866 |
| He | Asian | 1.1393697 | 1.0879437–1.1932266 | 0.000 | 0.981 |
| Guan | Asian | 1.1452636 | 1.0925845–1.2004827 | 0.000 | 0.847 |
| Galaktionova | Caucasian | 1.1542471 | 1.1029066–1.2079774 | 0.000 | 0.863 |
| Zheng | Asian | 1.1498204 | 1.094684–1.2077338 | 0.000 | 0.815 |
| Hori | Asian | 1.1508508 | 1.0996418–1.2044445 | 0.000 | 0.814 |
| Zhang | Asian | 1.1517017 | 1.1007836–1.204975 | 0.000 | 0.821 |
| Nyegaard | Caucasian | 1.154137 | 1.0994588–1.2115344 | 0.000 | 0.821 |
| Bigos | Caucasian | 1.1496404 | 1.0980188–1.2036888 | 0.000 | 0.818 |
| Green | Caucasian | 1.151419 | 1.0981367–1.2072866 | 0.000 | 0.814 |
Notes:Ph represents the P-value of the Q-test for heterogeneity
Abbreviations:CI confidence interval; OR odds ratio
Fig. 2.
Forest plot of the allele contrast model (A vs. G) for rs1006737. Significant differences between rs1006737 and the risk of schizophrenia were observed with the allele contrast model (T vs. G) (OR = 1.151, 95% CI = 1.100–1.204, P heterogeneity = 0.867, P = 0.000)
Fig. 3.
Forest plot of the dominant model (GA + AA vs. GG) for rs1006737. Significant differences between rs1006737 and the risk of schizophrenia were observed with the dominant model (GA + AA vs. GG) (OR = 1.169, 95% CI = 1.107–1.234, P heterogeneity = 0.786, P = 0.000)
Fig. 4.
Forest plot of the recessive model (AA vs. GG + GA) for rs1006737. Significant differences between rs1006737 and the risk of schizophrenia were observed with the recessive model (AA vs. GG + GA) (OR = 1.215, 95% CI = 1.085–1.360, P heterogeneity = 0.999, P = 0.001)
Fig. 5.
Forest plot of the complete codominance model (AA vs. GG) for rs1006737. Significant differences between rs1006737 and the risk of schizophrenia were observed with the codominance model (AA vs. GG) (OR = 1.296, 95% CI = 1.151–1.459, P heterogeneity = 0.993, P = 0.000)
Fig. 6.
Forest plot of the codominance model (GA vs. GG) for rs1006737. Significant differences between rs1006737 and the risk of schizophrenia were observed with the codominance model (GA vs. GG) (OR = 0.064, 95% CI = 0.024–0.169, P heterogeneity = 0.000, P = 0.000)
Fig. 7.
Forest plot of the complete overdominance model (GG + AA vs. GA) for rs1006737. Significant differences between rs1006737 and the risk of schizophrenia were observed with the complete overdominance model (GG + AA vs. GA) (OR = 0.897, 95% CI = 0.849–0.948, P heterogeneity = 0.173, P = 0.000)
Fig. 8.
Forest plot of the allele contrast model (A vs. G) for rs2007044. Significant differences between rs2007044 and the risk of schizophrenia were observed with the allele contrast model (A vs. G) (OR = 1.080, 95% CI = 1.023–1.139, P heterogeneity = 0.785, P = 0.006)
Fig. 9.
Forest plot of the allele contrast model (C vs. G) for rs4765905. Significant differences between rs4765905 and the risk of schizophrenia were observed with the allele contrast model (C vs. G) (OR = 1.225, 95% CI = 1.100–1.364, P heterogeneity = 0.719, P = 0.000)
Discussion
CACNA1C is associated with bipolar disorder [37], autism spectrum disorder [38], major depression [15], and other central nervous system (CNS) disorders [39]. However, the association between the CACNA1C gene and schizophrenia has not been determined. It is also unclear whether the CACNA1C gene has the same effect on schizophrenia in both Asians and Europeans. Therefore, we conducted a comprehensive meta-analysis on the association between the CACNA1C rs1006737, rs2007044, and rs4765905 polymorphisms and schizophrenia. In the overall analysis, rs1006737 was associated with the risk of schizophrenia in all five genetic models, and rs2007044 and rs4765905 were also related to schizophrenia in the allele model, implying that the CACNA1C gene may influence the risk of schizophrenia. This view is consistent with the results of previous meta-analyses [13, 14, 16, 35, 40, 41].
When we conducted a race-based subgroup analysis of rs1006737, we found that the effects of rs1006737 on schizophrenia in the Asians and Europeans had both similarities and differences. According to the results obtained with the allele (A vs. G) and dominant (GA + AA vs. GG) models, the effect of rs1006737 on the risk of schizophrenia in the Europeans and Asians was consistent (i.e., allele A and genotype GA + AA were protective factors against the development of schizophrenia). However, analysis by the recessive (AA vs. GG + GA) and codominant (AA vs. GG) models showed that the genotype GG + GA was only a risk factor for schizophrenia in the European sample. In contrast, according to the complete overdominance model (GG + AA vs. GA), the GA genotype of rs1006737 only reduced the risk of schizophrenia in the Asian sample. These data suggest that the effect of rs1006737 on schizophrenia is ancestrally diverse.
The current study has two limitations. Due to significant heterogeneity (I2 = 99.0%) and publication bias (Egger’s test P = 0.002), the codominant model (GA vs. GG) was not reliable and, therefore, was not a valid gene model for evaluating the rs1006737 polymorphism. In addition, there were few studies on the association between rs2007044 or rs4765905 and schizophrenia. Thus, additional high-quality studies are needed to support our analysis.
This meta-analysis study advanced our understanding of the relationship between CACNA1C polymorphisms and schizophrenia compared to previous literature. First, the current study included more comprehensive studies. A recent meta-analysis of the CACNA1C gene and schizophrenia [40] contained nine studies on the association between rs1006737 and schizophrenia. In comparison, the current study included 14 studies on the association between this polymorphism and schizophrenia, including eight articles [11, 13, 15, 18, 23, 25, 26, 28] shared with [40] along with six additional studies [8, 20–22, 24, 27]. Second, compared to most of the meta-analysis on CACNA1C and schizophrenia, the current study not only included studies on rs1006737 and schizophrenia but also studies on the association between two other CACNA1C polymorphisms (rs2007044 and rs4765905) and schizophrenia. Although the study of Xiao et al. [41] also included these three polymorphisms, it only included samples from Asian samples. Because the current study included samples from both Asians and Europeans, it used a richer source of samples for the analysis. Finally, the current study focused on comparing the impact of rs1006737 on schizophrenia in Asian and European samples. Based on this analysis, the influence model of rs1006737 on schizophrenia in Asian and European samples identified both similarities and differences between the two samples.
Conclusions
The CACNA1C rs1006737, rs2007044, and rs4765905 gene polymorphisms were associated with the susceptibility to schizophrenia. However, the influence model for rs1006737 on schizophrenia in Asians and Europeans demonstrated both similarities and differences between the two ancestors.
Acknowledgements
We would like to thank Professor Mei Ding for her guidance and review of the data analysis.
Abbreviations
- GWAS
Genome-wide association study
- SNP
Single nucleotide polymorphism
- PGC
Psychiatric Genomics Consortium
- OR
Odds ratio
- 95% CI
95% confidence interval
Authors’ contributions
YPL participated in the study design and drafted the manuscript. XW and XX performed the statistical analysis. BJW and JY contributed to the revision of the final manuscript. All authors have read and approved the manuscript.
Funding
The present research was not funded by any funding agency in the public, commercial, or not-for-profit sectors.
Availability of data and materials
All data generated or analyzed during this study are included in this published article.
Ethics approval and consent to participate
Not applicable.
Consent for publication
Not applicable.
Competing interests
The authors declare that they have no competing interests.
Footnotes
Publisher’s Note
Springer Nature remains neutral with regard to jurisdictional claims in published maps and institutional affiliations.
Contributor Information
Yong-ping Liu, Email: 572319208@qq.com.
Xue Wu, Email: 354782379@qq.com.
Xi Xia, Email: 765944359@qq.com.
Jun Yao, Email: yaojun198717@163.com.
Bao-jie Wang, Email: wangbj77@163.com.
References
- 1.Mowry BJ, Nancarrow DJ. Molecular genetics of schizophrenia. Clin Exp Pharmacol Physiol. 2001;28:66–69. doi: 10.1046/j.1440-1681.2001.03399.x. [DOI] [PubMed] [Google Scholar]
- 2.Kendler KS. Overview: a current perspective on twin studies of schizophrenia. Am J Psychiatry. 1983;140:1413–1425. doi: 10.1176/ajp.140.11.1413. [DOI] [PubMed] [Google Scholar]
- 3.Kety SS. Schizophrenic illness in the families of schizophrenic adoptees: findings from the Danish national sample. Schizophr Bull. 1988;14:217–222. doi: 10.1093/schbul/14.2.217. [DOI] [PubMed] [Google Scholar]
- 4.Soeiro-de-Souza MG, Bio DS, Dias VV, Vieta E, Machado-Vieira R, Moreno RA. The CACNA1C risk allele selectively impacts on executive function in bipolar type I disorder. Acta Psychiatr Scand. 2013;128:362–369. doi: 10.1111/acps.12073. [DOI] [PubMed] [Google Scholar]
- 5.Barad M. Later developments: molecular keys to age-related memory impairment. Alzheimer Dis Assoc Disord. 2003;17:168–176. doi: 10.1097/00002093-200307000-00009. [DOI] [PubMed] [Google Scholar]
- 6.Leitch B, Szostek A, Lin R, Shevtsova O. Subcellular distribution of L-type calcium channel subtypes in rat hippocampal neurons. Neuroscience. 2009;164:641–657. doi: 10.1016/j.neuroscience.2009.08.006. [DOI] [PubMed] [Google Scholar]
- 7.Cross-Disorder Group of the Psychiatric Genomics C Identification of risk loci with shared effects on five major psychiatric disorders: a genome-wide analysis. Lancet. 2013;381:1371–1379. doi: 10.1016/S0140-6736(12)62129-1. [DOI] [PMC free article] [PubMed] [Google Scholar]
- 8.Ivorra JL, Rivero O, Costas J, Iniesta R, Arrojo M, Ramos-Rios R, et al. Replication of previous genome-wide association studies of psychiatric diseases in a large schizophrenia case-control sample from Spain. Schizophr Res. 2014;159:107–113. doi: 10.1016/j.schres.2014.07.004. [DOI] [PubMed] [Google Scholar]
- 9.Wolf C, Mohr H, Schneider-Axmann T, Reif A, Wobrock T, Scherk H, et al. CACNA1C genotype explains interindividual differences in amygdala volume among patients with schizophrenia. Eur Arch Psychiatry Clin Neurosci. 2014;264:93–102. doi: 10.1007/s00406-013-0427-y. [DOI] [PubMed] [Google Scholar]
- 10.Gallagher M, Chiba AA. The amygdala and emotion. Curr Opin Neurobiol. 1996;6:221–227. doi: 10.1016/s0959-4388(96)80076-6. [DOI] [PubMed] [Google Scholar]
- 11.Fatima A, Farooq M, Abdullah U, Tariq M, Mustafa T, Iqbal M, et al. Genome-wide supported risk variants in MIR137, CACNA1C, CSMD1, DRD2, and GRM3 contribute to schizophrenia susceptibility in Pakistani population. Psychiatry Investig. 2017;14:687–692. doi: 10.4306/pi.2017.14.5.687. [DOI] [PMC free article] [PubMed] [Google Scholar]
- 12.Eckart N, Song Q, Yang R, Wang R, Zhu H, McCallion AS, et al. Functional characterization of schizophrenia-associated variation in CACNA1C. PLoS One. 2016;11:e0157086. doi: 10.1371/journal.pone.0157086. [DOI] [PMC free article] [PubMed] [Google Scholar]
- 13.Zheng F, Zhang Y, Xie W, Li W, Jin C, Mi W, et al. Further evidence for genetic association of CACNA1C and schizophrenia: new risk loci in a Han Chinese population and a meta-analysis. Schizophr Res. 2014;152:105–110. doi: 10.1016/j.schres.2013.12.003. [DOI] [PubMed] [Google Scholar]
- 14.Jiang H, Qiao F, Li Z, Zhang Y, Cheng Y, Xu X, et al. Evaluating the association between CACNA1C rs1006737 and schizophrenia risk: a meta-analysis. Asia Pac Psychiatry. 2015;7:260–267. doi: 10.1111/appy.12173. [DOI] [PubMed] [Google Scholar]
- 15.He K, An Z, Wang Q, Li T, Li Z, Chen J, et al. CACNA1C, schizophrenia and major depressive disorder in the Han Chinese population. Br J Psychiatry. 2014;204:36–39. doi: 10.1192/bjp.bp.113.126979. [DOI] [PubMed] [Google Scholar]
- 16.Nie F, Wang X, Zhao P, Yang H, Zhu W, Zhao Y, et al. Genetic analysis of SNPs in CACNA1C and ANK3 gene with schizophrenia: a comprehensive meta-analysis. Am J Med Genet B Neuropsychiatr Genet. 2015;168:637–648. doi: 10.1002/ajmg.b.32348. [DOI] [PubMed] [Google Scholar]
- 17.Takahashi S, Glatt SJ, Uchiyama M, Faraone SV, Tsuang MT. Meta-analysis of data from the psychiatric genomics consortium and additional samples supports association of CACNA1C with risk for schizophrenia. Schizophr Res. 2015;168:429–433. doi: 10.1016/j.schres.2015.07.033. [DOI] [PubMed] [Google Scholar]
- 18.Hori H, Yamamoto N, Fujii T, Teraishi T, Sasayama D, Matsuo J, et al. Effects of the CACNA1C risk allele on neurocognition in patients with schizophrenia and healthy individuals. Sci Rep. 2012;2:634. doi: 10.1038/srep00634. [DOI] [PMC free article] [PubMed] [Google Scholar]
- 19.Liu YP, Meng JH, Wu X, Xu FL, Xia X, Zhang XC, et al. Rs1625579 polymorphism in the MIR137 gene is associated with the risk of schizophrenia: updated meta-analysis. Neurosci Lett. 2019;713:134535. doi: 10.1016/j.neulet.2019.134535. [DOI] [PubMed] [Google Scholar]
- 20.Lubeiro A, Fatjo-Vilas M, Guardiola M, Almodovar C, Gomez-Pilar J, Cea-Canas B, et al. Analysis of KCNH2 and CACNA1C schizophrenia risk genes on EEG functional network modulation during an auditory odd-ball task. Eur Arch Psychiatry Clin Neurosci. 2020;270:433–442. doi: 10.1007/s00406-018-0977-0. [DOI] [PubMed] [Google Scholar]
- 21.Mallas E, Carletti F, Chaddock CA, Shergill S, Woolley J, Picchioni MM, et al. The impact of CACNA1C gene, and its epistasis with ZNF804A, on white matter microstructure in health, schizophrenia and bipolar disorder(1) Genes Brain Behav. 2017;16:479–488. doi: 10.1111/gbb.12355. [DOI] [PubMed] [Google Scholar]
- 22.Porcelli S, Lee SJ, Han C, Patkar AA, Serretti A, Pae CU. CACNA1C gene and schizophrenia: a case-control and pharmacogenetic study. Psychiatr Genet. 2015;25:163–167. doi: 10.1097/YPG.0000000000000092. [DOI] [PubMed] [Google Scholar]
- 23.Guan F, Zhang B, Yan T, Li L, Liu F, Li T, et al. MIR137 gene and target gene CACNA1C of miR-137 contribute to schizophrenia susceptibility in Han Chinese. Schizophr Res. 2014;152:97–104. doi: 10.1016/j.schres.2013.11.004. [DOI] [PubMed] [Google Scholar]
- 24.Galaktionova D, Gareeva AE, Khusnutdinova EK, Nasedkina TV. The association of polymorphisms in SLC18A1, TPH1 and RELN genes with risk of paranoid schizophrenia. Mol Biol (Mosk). 2014;48:629–639. [PubMed] [Google Scholar]
- 25.Zhang Q, Shen Q, Xu Z, Chen M, Cheng L, Zhai J, et al. The effects of CACNA1C gene polymorphism on spatial working memory in both healthy controls and patients with schizophrenia or bipolar disorder. Neuropsychopharmacology. 2012;37:677–684. doi: 10.1038/npp.2011.242. [DOI] [PMC free article] [PubMed] [Google Scholar]
- 26.Nyegaard M, Demontis D, Foldager L, Hedemand A, Flint TJ, Sorensen KM, et al. CACNA1C (rs1006737) is associated with schizophrenia. Mol Psychiatry. 2010;15:119–121. doi: 10.1038/mp.2009.69. [DOI] [PubMed] [Google Scholar]
- 27.Bigos KL, Mattay VS, Callicott JH, Straub RE, Vakkalanka R, Kolachana B, et al. Genetic variation in CACNA1C affects brain circuitries related to mental illness. Arch Gen Psychiatry. 2010;67:939–945. doi: 10.1001/archgenpsychiatry.2010.96. [DOI] [PMC free article] [PubMed] [Google Scholar]
- 28.Green EK, Grozeva D, Jones I, Jones L, Kirov G, Caesar S, et al. The bipolar disorder risk allele at CACNA1C also confers risk of recurrent major depression and of schizophrenia. Mol Psychiatry. 2010;15:1016–1022. doi: 10.1038/mp.2009.49. [DOI] [PMC free article] [PubMed] [Google Scholar]
- 29.Bustillo JR, Patel V, Jones T, Jung R, Payaknait N, Qualls C, et al. Risk-Conferring Glutamatergic Genes and Brain Glutamate Plus Glutamine in Schizophrenia. Front Psychiatry. 2017;8:79. doi: 10.3389/fpsyt.2017.00079. [DOI] [PMC free article] [PubMed] [Google Scholar]
- 30.Zhang Z, Wang Y, Zhang Q, Zhao W, Chen X, Zhai J, et al. The effects of CACNA1C gene polymorphism on prefrontal cortex in both schizophrenia patients and healthy controls. Schizophr Res. 2019;204:193–200. doi: 10.1016/j.schres.2018.09.007. [DOI] [PubMed] [Google Scholar]
- 31.Sudesh R, Thalamuthu A, John S, Thara R, Mowry B, Munirajan AK. Replication of GWAS identified miR-137 and its target gene polymorphisms in Schizophrenia of South Indian population and meta-analysis with Psychiatric Genomics Consortium. Schizophr Res. 2018;199:189–194. doi: 10.1016/j.schres.2018.03.028. [DOI] [PubMed] [Google Scholar]
- 32.Egger M, Davey Smith G, Schneider M, Minder C. Bias in meta-analysis detected by a simple, graphical test. BMJ. 1997;315:629–634. doi: 10.1136/bmj.315.7109.629. [DOI] [PMC free article] [PubMed] [Google Scholar]
- 33.Wu R, Li B. A multiplicative-epistatic model for analyzing interspecific differences in outcrossing species. Biometrics. 1999;55:355–365. doi: 10.1111/j.0006-341x.1999.00355.x. [DOI] [PubMed] [Google Scholar]
- 34.Higgins JP, Thompson SG, Deeks JJ, Altman DG. Measuring inconsistency in meta-analyses. BMJ. 2003;327:557–560. doi: 10.1136/bmj.327.7414.557. [DOI] [PMC free article] [PubMed] [Google Scholar]
- 35.Yang X, Wang G, Wang Y, Yue X. Association of metabotropic glutamate receptor 3 gene polymorphisms with schizophrenia risk: evidence from a meta-analysis. Neuropsychiatr Dis Treat. 2015;11:823–833. doi: 10.2147/NDT.S77966. [DOI] [PMC free article] [PubMed] [Google Scholar]
- 36.Li HF, Yan LP, Wang K, Li XT, Liu HX, Tan W. Association between ADAM33 polymorphisms and asthma risk: a systematic review and meta-analysis. Respir Res. 2019;20:38. doi: 10.1186/s12931-019-1006-1. [DOI] [PMC free article] [PubMed] [Google Scholar]
- 37.Khalid M, Driessen TM, Lee JS, Tejwani L, Rasool A, Saqlain M, et al. Association of CACNA1C with bipolar disorder among the Pakistani population. Gene. 2018;664:119–126. doi: 10.1016/j.gene.2018.04.061. [DOI] [PMC free article] [PubMed] [Google Scholar]
- 38.Li J, Zhao L, You Y, Lu T, Jia M, Yu H, et al. Schizophrenia related variants in CACNA1C also confer risk of autism. PLoS One. 2015;10:e0133247. doi: 10.1371/journal.pone.0133247. [DOI] [PMC free article] [PubMed] [Google Scholar]
- 39.Moon AL, Haan N, Wilkinson LS, Thomas KL, Hall J. CACNA1C: association with psychiatric disorders, behavior, and neurogenesis. Schizophr Bull. 2018;44:958–965. doi: 10.1093/schbul/sby096. [DOI] [PMC free article] [PubMed] [Google Scholar]
- 40.Zhu D, Yin J, Liang C, Luo X, Lv D, Dai Z, et al. CACNA1C (rs1006737) may be a susceptibility gene for schizophrenia: An updated meta-analysis. Brain Behav. 2019;9:e01292. doi: 10.1002/brb3.1292. [DOI] [PMC free article] [PubMed] [Google Scholar]
- 41.Xiao X, Luo XJ, Chang H, Liu Z, Li M. Evaluation of European schizophrenia GWAS loci in Asian populations via comprehensive meta-analyses. Mol Neurobiol. 2017;54:4071–4080. doi: 10.1007/s12035-016-9990-3. [DOI] [PubMed] [Google Scholar]
Associated Data
This section collects any data citations, data availability statements, or supplementary materials included in this article.
Data Availability Statement
All data generated or analyzed during this study are included in this published article.


