

Whether host-associated microbiomes are mostly shaped by species-specific or environmental factors is still unresolved. In particular, it is unknown to what extent microbial communities from two different host tissues from the same host respond to these factors. Our study is one of the first to focus on the microbiome of teleost fish to shed a light on this topic as we investigate how the phylogenetic structure of microbial communities from two distinct fish tissues are shaped by species- and habitat-specific factors. Our study showed that in contrast to the teleost gut microbiome, skin mucus communities are highly environment dependent. This result has various implications: (i) the skin mucus microbiome should be used, rather than the gut, to investigate bacterial biomarkers of ecosystem perturbance in the wild, and (ii) the gut microbiome is better suited for studies of the drivers of phylosymbiosis, or the coevolution of fish and their symbionts.
KEYWORDS: Amazon, fish, gut, habitat, host, microbiome, phylosymbiosis, skin, species, teleost
ABSTRACT
Teleost fish represent an invaluable repertoire of host species to study the factors shaping animal-associated microbiomes. Several studies have shown that the phylogenetic structure of the fish gut microbiome is driven by species-specific (e.g., host ancestry, genotype, or diet) and habitat-specific (e.g., hydrochemical parameters and bacterioplankton composition) factors. However, our understanding of other host-associated microbial niches, such as the skin mucus microbiome, remains limited. The goal of our study was to explore simultaneously the phylogenetic structure of the fish skin mucus and gut microbiome and compare the effect of species- and habitat-specific drivers on the structure of microbial communities in both tissues. We sampled 114 wild fish from 6 populations of 3 ecologically and phylogenetically contrasting Amazonian teleost species. Water samples were collected at each site, and 10 physicochemical parameters were characterized. The skin mucus, gut, and water microbial communities were characterized using a metabarcoding approach targeting the V3-V4 regions of the 16S rRNA. Our results showed a significant distinction between the phylogenetic profile and diversity of the microbiome from each microbial niche. Skin mucus and bacterioplankton communities were significantly closer in composition than gut and free-living communities. Species-specific factors mostly modulated gut bacterial communities, while the skin mucus microbiome was predominantly associated with environmental physicochemistry and bacterioplankton community structure. These results suggest that the variable skin mucus community is a relevant target for the development of microbial biomarkers of environmental status, while the more conserved gut microbiome is better suited to study long-term host-microbe interactions over evolutionary time scales.
IMPORTANCE Whether host-associated microbiomes are mostly shaped by species-specific or environmental factors is still unresolved. In particular, it is unknown to what extent microbial communities from two different host tissues from the same host respond to these factors. Our study is one of the first to focus on the microbiome of teleost fish to shed a light on this topic as we investigate how the phylogenetic structure of microbial communities from two distinct fish tissues are shaped by species- and habitat-specific factors. Our study showed that in contrast to the teleost gut microbiome, skin mucus communities are highly environment dependent. This result has various implications: (i) the skin mucus microbiome should be used, rather than the gut, to investigate bacterial biomarkers of ecosystem perturbance in the wild, and (ii) the gut microbiome is better suited for studies of the drivers of phylosymbiosis, or the coevolution of fish and their symbionts.
INTRODUCTION
Teleosts are represented by more than 28,000 species, which exhibit a variety of physiologies, natural histories, and ecologies (1). Thus, they provide an invaluable repertoire of host species to study the nature of vertebrate microbial communities (2) and the factors shaping animal-associated microbiomes (3). Teleosts’ guts, skin mucus, and gills support high concentrations of bacterial cells (4, 5) forming highly diverse and structured microbial communities (6). Like in humans, the gut microbial community of fish has drawn a lot of attention from the scientific community in the past decade; dozens of studies have characterized the gut microbiota of various fish species (5, 7). These studies identified endogenous and exogenous factors that affect the establishment of bacteria in teleost guts (2, 7, 8). Some endogenous factors are species and population specific (1); they include host ancestry (9), genotype (10), and diet (11). Others are individual specific and include parasitic load (12), immunological state (13), and life history (14). Exogenous factors are habitat specific and include environmental water physicochemical parameters (15, 16) and bacterioplankton composition (17).
In contrast to the gut microbiota, our understanding of the mucosal microbiome of fish skin remains limited (18). Like the gut microbiota, the skin mucus microbial community plays crucial roles for fish holobionts (5). Skin mucus bacteria constitute the first barrier of defense against infections by environmental opportunistic pathogens (19). The ecological niche provided by fish skin mucus is in constant contact with the external environment, rendering its associated microbiota susceptible to environmental physicochemical disturbances compared to the stable conditions of the buffered gut environment (16, 17, 20). This sensitivity of fish skin mucus microbiota suggests that, in the future, skin mucus bacteria could be used as microbial biomarkers or proxies of fish health, which would help manage wild fish populations and improve captive fish performance and growth by enabling the rapid diagnosis of fish gut diseases through skin mucus microbiota profiling (11, 21). Characterizing fish skin mucus microbial communities in a range of different hosts and environments is critical for (i) identifying novel functions of animal-associated microbes, (ii) understanding the connectivity between environmental microbial communities and those of the host, and (iii) identifying the endogenous and exogenous factors shaping these microbial consortia. Furthermore, most studies which investigated the fish skin mucus microbiome did not concurrently report the bacterial communities from other host-associated tissues, such as the gut (4, 22). Therefore, we cannot determine to what extent skin mucus communities are driven by the same species-specific or habitat-specific factors shaping gut communities. The main goal of our study was to address this gap by (i) exploring the phylogenetic structure of fish skin mucus and gut microbial communities and (ii) comparing the effect of species-specific and habitat-specific drivers on the structure of microbial communities in both tissues.
Here, we investigated the bacterial communities (gut and skin mucus) of three sympatric host species found in the Brazilian Amazon basin, the flag cichlid (Mesonauta festivus), the pacu (Mylossoma duriventre), and the black piranha (Serrasalmus rhombeus). These three species are phylogenetically divergent; pacus and black piranhas belong to the Serrasalmidae family, which diverged from the flag cichlid’s Cichlidae family 229.9 million years ago (23). These species also differ in their overall ecology (behavior, diet, and distribution). Flag cichlids are more sedentary and live on the surface of river margins underneath logs or floating macrophytes (24). In contrast, black piranhas and pacus live in the middle of the water column and can tolerate strong river currents (25). Black piranhas are opportunistic carnivores, while flag cichlids are benthivores and pacus are planktivores (24–28). Flag cichlids and black piranhas are found in a great variety of habitats and therefore have a larger overall distribution area than pacus (25). We used a metabarcoding approach targeting the 16S SSU V3-V4 region of the rRNA gene to analyze the gut and skin mucus bacterial communities of 33 wild flag cichlids, 47 pacus, 34 black piranhas, and six water samples, collected at six sampling sites. Our results show that the phylogenetic structures of fish gut, skin mucus, and bacterioplankton communities significantly diverge. Most importantly, they also support the hypothesis that fish skin mucus and gut microbiomes do not show the same response to species- and habitat-specific factors.
RESULTS
Host-associated versus free-living bacterial communities.
Our results show a clear distinction between the taxonomical structure of the bacterial communities from skin mucus, gut, and bacterioplankton (Fig. 1 and 2; see Fig. S3 and S4 in the supplemental material). Permutational analysis of variance (PERMANOVA) results based on weighted Unifrac distances show smaller significant differences between bacterioplankton and skin mucus communities (P < 0.001, F = 3.58, df = 115) than between bacterioplankton and gut communities (P < 0.001, F = 6.63, df = 113). The high similarity between skin mucus communities and bacterioplankton is also suggested in the principal-coordinate analysis (PCoA) plots in Fig. S3; the sample type factor explains only 22.2% of the variance between skin mucus and free-living communities, while it explains 40.0% of the variance between gut and free-living communities. Finally, the thetaYC dissimilarity index (TDI) (29) also showed that bacterioplankton structure was more similar to the skin mucus microbiota (TDI = 0.690 ± 0.004 standard error [SE]) than to the gut microbiota (TDI = 0.848 ± 0.003 SE). Faith’s phylogenetic diversity measures (Fig. 1) also showed significant differences in the α-diversity of the three sample types; overall α-diversity was significantly higher in skin mucus than in gut (P < 0.001, t = 4.19, df = 232) and bacterioplankton (P = 0.002, t = 5.77, df = 5) samples. Average diversity in the gut was also significantly higher than that of bacterioplankton samples (P < 0.05, t = 2.43, df = 6). Finally, the heatmaps in Fig. S4 show the clustering of 10 amplicon sequence variants (ASVs) from each of the two most important genera in bacterioplankton (CL500-29 marine group and hgcI clade), based on their mean relative abundance in fish skin mucus, gut, and bacterioplankton samples. They show that the ASVs from these abundant genera in bacterioplankton share coabundance with the same ASVs in the fish skin mucus microbiome but not with those in the gut microbiome.
FIG 1.

The phylogenetic structure of the skin mucus community is closer to bacterioplankton than to the gut community. Stacked bar plots display the relative abundance of the 12 most abundant classes in all sample types collected. Box plots of Faith’s phylogenetic alpha diversity index were added below the bar plots for each sample type. (a to d) These analyses were performed on the 4 sampling sites from which we have bacterioplankton samples with adequate sequencing depth (>5,000 sequences): Catalão (a), MPWS2_3 (b), BWS2 (c), and WWS2 (d). All specimens from each species were pooled for these analyses.
FIG 2.

The gut and skin mucus have unique community structures, as shown for the three species sampled. (a to c) Principal-component analyses show the clustering of gut versus skin communities for flag cichlids (a), black piranhas (b), and pacus (c). Results of PERMANOVA tests between groups are indicated on the top left corner of each PCA plot. (d to f) LEfSe analyses highlight the phyla and classes that are significantly more abundant in one of the two tissues considered for flag cichlids (d), black piranhas (e), and pacus (f). (g to i) Heatmaps produced with metagenomeSeq show that samples cluster according to the relative abundance of the 100 most abundant ASVs for flag cichlids (g), black piranhas (h), and pacus (i). (j to l) Bar plots produced with metagenomeSeq highlight the 10 discriminant ASVs with the highest LDA score for each tissue for flag cichlids (j), black piranhas (k), and pacus (l).
Skin mucus versus gut microbiome.
The two host-associated microbial habitats show certain similarities. For instance, they both contain a significantly higher abundance of Oxyphotobacteria (P < 0.001), Mollicutes (P < 0.001), and Clostridia (P < 0.001) than free-living communities (Fig. 1). However, results of PCAs, PERMANOVAs (Fig. 2a to c), and linear discriminant analysis effect size (LEfSe) analyses (Fig. 2d to f), metagenomeSeq abundance heatmaps (Fig. 2g to i), and differential abundance bar plots based on linear discriminant analysis (LDA) log scores (Fig. 2j to l) all show major differences in the phylogenetic structure of microbial communities from both tissues. PERMANOVA results (Fig. 2a to c) first confirm that the overall community structures were significantly different for both tissues for all three species sampled (all P values < 0.001; see Fig. 2 for F and df values). Then, to further investigate these differences, we performed LEfSe analyses (30) to identify the bacterial taxa (at all taxonomic levels possible) significantly associated with each tissue (Fig. 2d to f). The unpaired Wilcoxon rank sum test embedded in LEfSe identified several differentially abundant features in the skin mucus and gut of each species. Common features in all three host species in this study include a significantly higher abundance of Clostridia in gut samples and of Gammaproteobacteria and Acidobacteria in skin mucus samples. Three other taxonomic groups had a significantly higher abundance in the skin mucus of at least two species, the class Actinobacteria for flag cichlids and black piranhas and the phylum Proteobacteria and the class Alphaproteobacteria for flag cichlids and pacus. These results suggest the existence of distinct and potentially consistent phylogenetic signatures of microbial communities unique to both tissues investigated. At the ASV level, differences between communities from both tissues were assessed with the metagenomeSeq LDA approach and visualized with heatmaps and differential abundance bar plots (Fig. 2), an approach which is more sensitive to significant differences but less sensitive to potential confounding factors than the LEfSe approach (31). The heatmaps in Fig. 2g to i show that each host species’ microbial communities mostly cluster according to their tissue of origin. Clustering according to tissue of origin appeared more pronounced in flag cichlid and pacu samples than in black piranha samples. Differential abundance LDA score bar plots were made from the 20 ASVs with the highest differential abundances (Fig. 2j to l) between both tissues. Enhydrobacter spp. and CL500-29 marine group species were consistently found to be among the 10 most differentially abundant taxa for fish skin mucus for all three host species. Among these differentially abundant taxa, none were shared between all three host species for gut communities.
Species-specific factors.
The site-specific PERMANOVAs in Fig. 3 show a significant effect of the host phylogeny on the structure of microbial communities from both tissues (P < 0.02; see F and df values in Fig. 3) in all cases except for skin mucus communities of the site MPWS2_3. However, the factor “host species” (the axes of PCoAs in Fig. 3) consistently explained a higher percentage of the variance for gut samples (average of 60.9%) than for skin mucus samples (average of 39.8%) for fish assemblages of all six sampling sites. Also, F values of the Fig. 3 PERMANOVAs, which tested the effect of the “host-species” variable, were invariably lower for skin mucus communities than for gut communities. These results suggest that species-specific factors particularly drive gut communities rather than skin mucus communities.
FIG 3.

Host species has a more important impact on the structure of gut communities than of skin mucus communities. The assessment of host species impact was based on PERMANOVA F and P values, and the total percentage of variance is explained by the 2 first axes of PCA plots. The PCAs show the clustering of bacterial communities according to the host fish species at each sampling site. PERMANOVAs with 10,000 permutations tested the significance of the “host species” factor at each site. At least two species were found at every site, and all three species were found at the sites Catalão and MPWS2_3.
Interestingly, the thetaYC dissimilarity index (TDI) values (data not shown) suggest a potential signal of host phylogenetic history for gut microbiotas but not for skin mucus microbiotas. Significant interspecific variations in the phylogenetic structures of gut microbiotas (P < 0.001, F = 3.2141, df = 108) were related to the host phylogeny. The gut microbiota structures of the two Serrasalmidae species (pacus and black piranhas) were more similar to each other (TDI = 0.661 ± 0.004 SE) than to the gut microbiota structure of the Cichlidae species (flag cichlids)—between flag cichlids and black piranhas, TDI = 0.783 ± 0.004 SE; between flag cichlids and pacus, TDI = 0.786 ± 0.003 SE). This signal was not observed for skin mucus samples (between pacus and black piranhas, TDI = 0.692 ± 0.009 SE; between flag cichlids and black piranhas, TDI = 0.576 ± 0.003 SE; between flag cichlids and pacus, TDI = 0.66 ± 0.01 SE).
Habitat-specific factors.
The Spearman correlation network analysis in Fig. 4 highlights similarities between the phylogenetic structures of samples and enables visualization of global clustering patterns among all samples. These networks show an increased sampling site-dependent clustering for skin mucus samples compared to gut samples; there was a much higher ratio of intrasite edges (i.e., correlation between samples and nodes) among skin mucus communities (81% of edges) than among gut communities (36% of edges). The networks in Fig. 5 investigate more deeply two known environmental factors driving sampling site-dependent clustering on teleosts—the structure of surrounding bacterioplankton communities and the environmental hydrochemical parameters (Table 1). The skin mucus and bacterioplankton communities are particularly interconnected; at all instances in Fig. 5, the percentage of taxa from the bacterioplankton and the host fish microbiome that are involved in significant Spearman correlations is always higher for skin mucus than for gut communities (for all three host species). Skin mucus communities also show an increased sensitivity to hydrochemical parameters; all three host species have interactions between several hydrochemical parameters and skin mucus taxa, but gut taxa only correlated with hydrochemical parameters for one host species (pacu). The host species most sensitive to hydrochemical parameters (all 10 parameters studied) was the flag cichlid. Environmental potassium concentration was the only parameter consistently associated with taxa from the skin mucus of all three host species.
FIG 4.
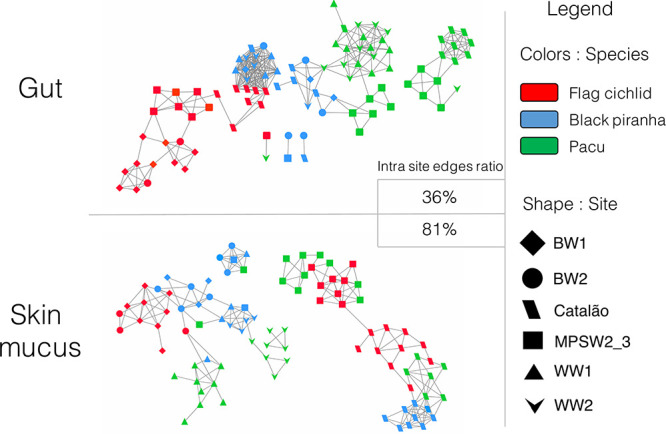
Overall, skin mucus communities are more associated with habitat-specific factors than gut communities. The figure shows the clustering of nodes (i.e., samples) according to the pattern of Spearman correlations when all samples (for communities of the same tissue) are compared to one another. Nodes sharing and edge (link) have a Spearman correlation of >0.5 with a P value of <0.05 (with Bonferroni correction). The color of the node indicates the host species, while the shape indicates the sampling site of the sample.
FIG 5.

Interaction networks show high connectivity between skin communities, environmental bacterioplankton, and hydrochemical parameters. Nodes sharing an edge (link) have a Spearman correlation of >0.5 with a P value of <0.05 (with Bonferroni correction). The color of the node indicates the type of sample: blue nodes represent bacterioplankton taxa, orange nodes are hydrochemical parameters, and gray nodes are host fish taxa. No significant correlations were detected between gut taxa and environmental hydrochemical parameters for black piranha and flag cichlid samples. The numbers under each network indicate the number and percentage of ASVs implicated in significant interactions in each community.
TABLE 1.
GPS coordinates and hydrochemical parameters of the six sampling sites of this study
| Site | GPS coordinates | Water parametersa |
|||||||||
|---|---|---|---|---|---|---|---|---|---|---|---|
| pH | O2 (%) | Temp (°C) | mg/liter of: |
||||||||
| Na | Cl | Ca | Mg | K | DOC | Hard. | |||||
| Catalão | 3°09'37.1"S, 59°54'52.8"W | 6.71 | 42.00 | 31.5 | 12.56 | 3.19 | 2.22 | 1.96 | 2.14 | 7.89 | 14 |
| BW1 | 2°41'56.1"S, 60°46'29.6"W | 4.7 | 89.32 | 31.2 | 0.64 | 0.03 | 0.01 | 0.072 | 1.19 | 7.26 | 0 |
| BW2 | 2°35'59.2"S, 60°49'31.3"W | 4.65 | 88.50 | 30.3 | 0.68 | 0.02 | 0.00 | 0.073 | 1.19 | 8.02 | 0 |
| WW1 | 3°16'35.7"S, 60°16'23.9"W | 6.9 | 81.00 | 32.7 | 6.02 | 7.49 | 0.75 | 0.665 | 2.06 | 3.50 | 5 |
| WW2 | 3°15'48.4"S, 60°13'14.3"W | 6.86 | 76.30 | 30.7 | 5.96 | 7.69 | 0.74 | 0.635 | 2.02 | 3.44 | 4 |
| MPWS2_3 | 3°15'14.3"S, 60°41'23.2"W | 6.15 | 79.10 | 32.5 | 9.66 | 24.10 | 1.04 | 1.035 | 1.96 | 3.46 | 7 |
DOC, dissolved organic carbon; Hard., carbonate hardness.
These observations regarding the correlation between host habitat characteristics and skin mucus microbiome structure are also in accordance with the stacked bar plots in Fig. 1, the PCoAs in Fig. S3, and the thetaYC dissimilarity analyses, which show a higher resemblance between skin mucus and bacterioplankton communities than between gut and free-living communities. Thus, overall, the results consistently suggest that habitat-specific factors are differentially associated with the phylogenetic structure of skin mucus communities rather than with gut communities.
DISCUSSION
The goal of our study was to explore the phylogenetic structure of fish skin mucus and gut microbial communities and measure the extent to which species- and habitat-specific factors shape the structure of microbial communities from both tissues. Our results showed a significant distinction between the phylogenetic profile and diversity of the bacterial communities in each microbial niche. Skin mucus and bacterioplankton communities were significantly closer in resemblance than gut and free-living communities. Tissue-specific responses showed that species-specific factors mostly modulate gut bacterial communities, while the skin mucus microbiome is predominantly associated with environmental physicochemistry and bacterioplankton community structure.
Distinct phylogenetic structures in each microbial niche.
Microbial assemblages differ along fine-scale environmental gradients present in their host organism, with distinct communities associated with different parts of the host’s body (6, 16, 17). Likewise, we observed that the three microbial habitats documented in this investigation (skin mucus, gut, and environmental water) showed significantly different microbial community taxonomic structures for all three species. We also showed a higher alpha diversity of skin mucus samples than gut and bacterioplankton samples (Fig. 1) (except for the skin mucus of black piranhas at site MPWS2_3). Overall, the disparity between host-associated and free-living microbiotas suggests that fish gut and skin mucus microbiota compositions are not simple reflections of the microbial assemblages in their habitat but likely result from selective pressures which differ according to each tissue (1, 32–34). For instance, in fish guts, microbial symbionts with the best fitness are usually specialists which thrive in a stable (buffered) environment and play key roles in the hosts’ nutrition by facilitating degradation and assimilation of specific compounds found in the hosts’ diet (reviewed in reference 35). While community composition varies among fish species, the most abundant phyla typically found in the gut of freshwater fish are Proteobacteria, Actinobacteria, Bacteroidetes, Firmicutes, and Fusobacteria (15, 20, 36–40). In our study, Clostridia from the Firmicutes were an important discriminant feature of the gut microbiome for all three host species. Most Clostridia are obligate anaerobes that ferment plant polysaccharides (41). Interestingly, their presence in the guts of black piranha may suggest the ingestion of plant material in this species that was once thought to be strictly piscivorous. Studies generally show that gut community composition and diversity are trophic-level dependent (9, 42); piscine gut microbiome diversity tends to decrease from herbivores to omnivores, with the lowest diversity in found in carnivores (40). However, our results did not show such a decrease in alpha diversity in relation to fish diet (Fig. 1). This result could be associated with the fact that fish were sampled in the dry season, a period of fasting for several Amazonian fish species (43, 44). Thus, diet may not be a major driver of gut microbiome structure during this period.
In contrast to gut symbionts, skin mucus bacteria are mostly generalists, which tolerate a variable environment and play roles in the defense against opportunistic pathogens (19) via colonization resistance mechanisms (45). Typically, skin mucus communities are dominated by Proteobacteria and other less abundant phyla such as Bacteroidetes, Actinobacteria, Firmicutes, and Verrucomicrobia (15, 20, 46, 47). In our study, Proteobacteria was the most abundant phyla in all skin mucus communities and was mostly composed of Gammaproteobacteria (Fig. 2d to f). Two taxa that were among the 10 most significant discriminant features of the skin mucus tissue were generalists found on all three host species, Enhydrobacter spp. and Cl500-29 marine group species (Fig. 2j to l). Enhydrobacter aerosaccus, the only species of the Enhydrobacter genus, is commonly found on fish. This species is part of the butterflyfish gill core microbiome (48), the rainbow trout swim-bladder (49) and gut (50) microbiome, and the gut microbiome of the swamp eel (51). Our study showed that for three Amazonian fish species, Enhydrobacter spp. were associated not with the gut but, rather, with the skin mucus tissue. Cl500-29 marine group species have been mostly reported in bacterioplankton samples from a variety of freshwater and saltwater habitats (52–54), and thus they can tolerate a great range of hydrochemical parameters. This genus has also been shown to be a generalist in terms of utilization of different carbon compounds (54). Currently, very little is known of the functional repertoire of Enhydrobacter aerosaccus and Cl500-29 marine group species. However, the ubiquity of these taxa in all skin mucus communities of the three host species from our study suggests that their recruitment on skin mucus is positively selected among the large pool of environmental taxa. Thus, they potentially play essential roles in the skin mucus microbiome, which merits further investigation.
Species-specific factors and the gut microbiome.
Numerous studies have documented an effect of the host fish species on gut microbial communities (7, 9). Our results show that phylogenetic structures of gut microbiotas were especially correlated with host fish ancestry (skin mucus microbiota often showed a significant, but weaker, signal [Fig. 3]). The gut microbiota structure of the two Serrasalmidae hosts (S. rhombeus and M. duriventre) were more similar to each other than to the taxonomic structure of the Cichlidae (M. festivus) gut microbiota, even given strikingly different diets (i.e., planktivorous versus piscivorous). Similarly, some mammals with atypical diets for their clade, such as the strictly herbivorous panda bear (55) and myrmecophagous mammals (56), harbor gut microbial communities that are more similar to those of their close relatives than to those of other mammals with analogous diets. This phylogenetic inertia highlights the role of the host genotype (phylogeny) in constraining the range of variation of the gut microbiota in response to different diets (57). This phenomenon, where closely related species tend to host more similar microbiomes than evolutionarily distant species, is termed “phylosymbiosis” (58–60). Phylosymbiosis can be driven by various factors, including phenotypic divergence between host species that are phylogenetically distinct (61), the host’s diet (8, 9, 11, 42, 62, 63), the coevolution of specific bacteria with their host (cophylogeny) (64), or by vertical transmission of bacterial lineages across host generations (17).
Interestingly, a recent study by Riiser et al. (65) conducted on cod (Gadus morhua) and pout (Trisopterus esmarkii) populations in the North Atlantic shows results that contrast with the species-specific and phylosymbiosis patterns observed for the gut microbiome in our study. First, they show that different host ecotypes have more influence than the host species factor in shaping the gut microbiome. Second, they show a high degree of similarity in the microbiome of cod and pout lineages that diverged over 20 million years ago. These results show that the fraction of microbiome variance that is explained by environmental versus species-specific factors can vary significantly according to the host species and the type of environment exploited by these species. For instance, the availability of diverse nutrient sources and the environmental heterogeneity characteristic of tropical freshwater streams in the Amazon (25) are factors that may contribute to enhance the specialization of ecological niches and thus strengthen the species- and habitat-specific responses observed in our study.
Habitat-specific factors and the skin mucus microbiome.
Ecologically mediated selection is a key driver of speciation (66–68), and it has been shown that the host fish genotype is correlated with the phylogenetic structure of the host microbiome (2, 7, 8, 10). Thus, the effect of habitat-specific factors on the structure of the bacterial communities in this study could be related to the following factors: (i) divergent selection pressures between sampling locations, leading to adaptive divergence (69), (ii) possible low gene flow level between sampling locations (70), which could lead to genetic drift of the host (71), which then modifies the microbiota of the fish host under selection, or (iii) habitat-specific diet (especially for detritivorous fish feeding on sediments, such as flag cichlids [11]).
However, we documented distinct responses to habitat-specific factors; skin mucus microbial communities were more affected by the “sampling site” factor than gut communities (Fig. 4 and 5). These differences may be associated with the stability of abiotic conditions on each tissue. The fish gut is a highly stable environment compared to the skin mucus, which is constantly exposed to environmental water with variable physicochemical parameters. The intestinal pH remains circumneutral in spite of being continuously exposed to acidic pH from gastric secretions (72), thus highlighting the high efficiency of pH buffering from alkaline secretions in the lower gastrointestinal tract. Therefore, the stability of abiotic factors in the host gut promotes specialization of the microbiota (73, 74). In contrast, the high variability in terms of physicochemical parameters in environmental water, to which the skin mucus is exposed, favors a more dynamic skin mucus community (16). Sylvain et al. (16) exposed the tambaqui fish (Colossoma macropomum) to extreme environmental conditions (pH 4.0) and found that gut microbiotas showed a stronger resistance and resilience capacity than skin mucus microbial communities. A review from Nemergut et al. (70) suggests that the resilience of microbial communities to disturbances (biotic or abiotic) is related to the duration and severity of the disturbance, community diversity, abiotic factors in the environment, and disturbance history (74–76). Neutral processes (i.e., drift and dispersal) are expected to increase shortly after disturbance events (e.g., when a fish moves from a river tributary to another with different physicochemical parameters), while there is an increase in the effects of selection in stable environments (77) such as fish guts. This association between disturbance and neutral and selective processes might explain the distinct responses to habitat-specific factors that we observed for skin mucus and gut samples.
Overall, our results have different implications. First, the skin mucus microbiome should be used, rather than the gut, to investigate bacterial biomarkers of ecosystem perturbance in the wild. Our study showed that in contrast to the teleost gut microbiome, skin mucus communities are highly environment dependent. Thus, skin mucus samples will lead to a more sensitive and exact evaluation of the type of environment (e.g., perturbed or pristine, saltwater or freshwater) from which a fish sample originates. Second, due to its stability, its conserved structure, and its association to fish diets, the gut microbiome is better suited for studies of the drivers of phylosymbiosis, or on the coevolution of fish and their symbionts over evolutionary scales.
Conclusion. Our study is one of the very first to explore the phylogenetic structure of microbiotas from wild fish of the Amazon basin. Our analysis of microbial communities at multiple scales showed a clear distinction between the phylogenetic structure of the microbiome in different host tissues. It also highlighted a close resemblance and dense interaction network between skin mucus and bacterioplankton communities. We showed that skin mucus communities, in contrast to gut communities, were highly correlated with environmental hydrochemical parameters and thus mostly relied on habitat-dependent factors, making them poor candidates for phylosymbiosis analyses but sensitive targets to develop a database of environmental biomarkers. We suggest that future investigations use a shotgun metagenomic or metatranscriptomic approach to assess if species- and habitat-specific factors also affect the functional repertoire of fish microbiomes.
MATERIALS AND METHODS
Ethics approval.
This project and protocol were approved by the Ethics Committee for the Use of Animals of Instituto Nacional de Pesquisas da Amazônia (INPA) (number 026/2015 as of 18 December 2015). All methods were carried out in accordance with the approved guidelines.
Fish sampling.
The fish sampling was done between 5 November 2015 and 25 November 2015 at the following six sites in freshwater streams of the upper Brazilian Amazon, close to Manaus, Amazonas, Brazil: (i) Catalão Lake, (ii) two sites in the Solimões River near Jacurutu Island, (iii) the Manacapuru River, and (iv) two sites in Anavilhanas National Park. A map of sampling sites is in the supplemental material (Fig. S1). A total of 10 flag cichlids (FC) and 4 black piranhas (BP) were collected at site BWS1; 3 FC and 7 BP were collected at site BWS2; 10 FC, 2 BP, and 18 pacus (PAC) were collected at site MPWS2_3; 6 BP and 10 PAC were collected at site WWS1; 5 BP and 10 PAC were collected at site WWS2; 10 FC, 10 BP, and 10 PAC were collected at site Catalão (total = 115 fish). Most other studies of fish microbiota only used 3 to 5 fish per site or species (reviewed in reference 7). Fishing was done with fixed gillnets. If specimens of the targeted species were in contact with other fish in the net, e.g., if two fish were in adjacent net mesh, these specimens were discarded to avoid cross-contamination of the skin mucus bacterial communities. Skin mucus bacterial composition can be affected by net-fishing, due to a modification of mucus secretion and composition (78, 79). Thus, we carefully checked the nets every 15 min to minimize the time captive fish spent in the net and to reduce sources of contamination from the net itself. After capture, the skin mucus of all fish was immediately sampled by gently rubbing a sterile cotton swab on ∼50% of the total surface on the right side of each fish. Whole fish and the skin mucus samples were then stored on ice with liquid nitrogen until arrival at the Laboratório de Ecofisiologia e Evolução Molecular of INPA, where all samples were kept frozen at −80°C until dissection. There were about 4 h between fish collection/flash freezing and dissection at the laboratory, and all fish were processed the same way.
Two liters of water were also sampled at each site in sterile Nalgene bottles to characterize the bacterioplankton community. Water samples were taken from 30 cm below the surface. The species collected in this study are found at these depths (25). The water samples were collected shortly before leaving the sampling sites to minimize the time between collection and filtration. They were immediately stored in a large cooler full of ice and liquid nitrogen until arrival at the laboratory. There were about 4 h between collection and filtration. Water samples were filtered on 0.2-μm membranes (Nuclepore) using a Masterflex Easy-Load II peristaltic pump from Cole-Parmer postfiltration, and the membranes were stored dry at −80°C.
All fish were measured, weighed, and dissected. Student’s t tests showed no significant difference (P > 0.05) between the average length and weight of all three species between different sampling sites. All fish were dissected with sterile instruments, under a flame, to isolate a section comprising the midgut (right after pyloric ceca) and hindgut. The complete midgut and hindgut were pooled in one sample for DNA extractions for each fish. Fish were sampled during the dry season, which corresponds to a period of fasting for Amazonian fish (43, 44). Thus, the isolated gut sections of all host species were small and empty of intestinal content, and therefore, gut samples mostly represented mucosal flora rather than flora associated with digesta. Gut samples were kept at −80°C along with skin mucus and water samples until DNA extraction.
Hydrochemical parameters.
The water parameters for each sampling site are listed in Table 1. Temperature, pH, and dissolved oxygen percentage were measured at each sampling site. Then, 2 liters of water were sampled from 30 cm below the surface and brought back to the laboratory on ice for further analysis. These water samples were collected at the same time and depth as the water samples used to characterize bacterioplankton. Carbonate hardness was calculated from the Ca2+ and Mg2+ concentrations, and alkalinity was assessed using the APHA standard methods for examination of water and wastewater method 2320. The ionic composition (Na+, Mg2+, Ca2+, and K+) of each sample was analyzed using flame atomic absorption spectroscopy (Perkin-Elmer model 3100). The concentration of Cl– was measured using the colorimetric method as described by Clarke (80). Samples for dissolved organic carbon analysis were first filtered on 0.45-μm Sartorius filters and then were analyzed using a total carbon analyzer (Apollo 9000 combustion TOC analyzer; Teledyne Tekmar). The TOC machine was calibrated according to the manufacturer’s instructions using primary standard-grade potassium hydrogen phthalate (KHP).
Preparation of 16S amplicon libraries.
DNA extraction of skin mucus samples, whole guts, and 0.2-μm membranes from water samples was performed using a DNeasy blood and tissue kit from Qiagen according to the manufacturer’s instructions. Extracted DNA from guts, skin mucus, and water was stored at −80°C until amplification. The fragment V3-V4 (≈500 bp) of the 16S rRNA was amplified by PCR using the forward primer 347F of sequence 5′-GGAGGCAGCAGTRRGGAAT-3′ and the reverse primer 803R of sequence 5′-CTACCRGGGTATCTAATCC-3′ (81). All PCRs were performed according to the manufacturer’s instructions for Q5 high-fidelity DNA polymerase from New England BioLabs, Inc. The PCR program comprised (i) 30 sec at 98°C, (ii) 10 sec at 98°C, (iii) 30 sec at 64°C, (iv) 20 sec at 72°C, and (v) 2 min at 72°C, with a total of 35 amplification cycles. To reduce PCR bias and to increase precision in the assessment of microbial community composition and diversity, PCRs were done in triplicate. Amplified DNA was purified according to the manufacturer’s instructions with AMPure beads (Beckman Coulter Genomics) to eliminate primers, dimers, proteins, and phenols. All three PCR products for each sample were kept separate for post-PCR DNA purification but were pooled before sequencing. Post-PCR DNA concentration and quality were assessed on a Nanodrop instrument and by electrophoresis on (1.5%) agarose gels. After purification, multiplex sequencing was performed using the MiSeq platform from Illumina by the Plateforme d’Analyses Génomiques at the Institut de Biologie Intégrative et des Systèmes (IBIS) of Université Laval. A total of 232 samples were sequenced—33 FC gut, 33 BP gut, 47 PAC gut, 33 FC skin mucus, 34 BP skin mucus, 46 PAC skin mucus, and 6 water samples.
Processing of 16S sequences.
The analysis of amplicon sequences was done at the Institut de Biologie Intégrative et des Systèmes (IBIS) at Université Laval. After sequencing, 4,247,979 sequences were obtained (mean of 18,310 sequences per sample). The demultiplexed fastq sequence files were processed through QIIME 2 (82), and the DADA2 tool (83) was used for amplicon sequence variant (ASV) picking. Quality control of reads was processed through the filterAndTrim function using the following parameters: 270 for the read truncation length, 2 as the phred score threshold for total read removal, and a maximum expected error of 2 for forward reads and 4 for reverse reads. The filtered reads were then fed to the error rate learning, dereplication, and ASV inference steps using the functions learnErrors, derepFastq, and DADA, which are all from the DADA2 pipeline (83). Chimeric sequences were removed using the removeBimeraDenovo function (83) with the “consensus” method parameter. Taxonomic classification was done through the assignTaxonomy function (83) using the SILVA version 132 reference database. A rarefaction analysis of observed “species” counts and Shannon diversity (according to sampling depth) for each sample type (Fig. S2) showed that four samples had conspicuously lower sampling depth than the others as follows: WWS1 = 199 reads, BWS1 = 381 reads, 10.F = 474 reads, and 32.F = 9 reads. These four samples (<5,000 reads) were discarded, bringing the total number of samples to 228 and the lowest sampling depth to 5,223 reads. The average Good’s coverage index for all samples was 0.9917 ± 0.0005 (SE).
Statistical analysis of sequence variants.
To compare the taxonomical structures of the bacterial communities from the three microbial niches considered (Fig. 1), we used stacked bar plots built on phyloseq (84) from the relative abundance of the 12 most abundant classes (all ASVs were used for the analysis). We used the R package btools to calculate Faith’s phylogenetic diversity metric (85) for each sample type (Fig. 1). Then, we used principal-component analyses (PCAs) based on weighed Unifrac distances (74) using the R package phyloseq (84) to visualize sample clustering between the different tissues (Fig. 2a to c; Fig. S3) and the different host species (Fig. 3). Then, the significance of these clusterings were assessed with P values from permutational analyses of variances (PERMANOVAs), computed with 10,000 permutations using the R package VEGAN (86, 87) and a distance matrix of weighed Unifrac indexes between samples (Fig. 1a, Fig. 2a to c, and Fig. 3). Finally, to further investigate the dissimilarity between the taxonomic structures of bacterial communities from different tissues/host species, we also used thetaYC β-diversity measures or the thetaYC dissimilarity index (TDI) (29). We chose to use the thetaYC index, as it is a function of species proportions from both the shared and nonshared species. In addition, in the thetaYC index, the shared species proportions in each community are compared one-to-one (instead of a sum of the abundances of all shared species in the Bray-Curtis index, which gives no indication of which species are shared or if the abundances of the shared species are similar or not). As a result, the thetaYC index places more weight on those shared species, which have similar species proportions in both communities.
We used linear discriminant analysis effect size (LEfSe) tests (30) to identify the taxonomic groups whose abundances varied significantly between different tissues (Fig. 2d to f). This test uses the nonparametric factorial Kruskal-Wallis rank sum test to detect discriminant features (taxonomic groups) with significant differential abundance between tissues. The biological significance of these features is subsequently investigated by completing pairwise tests between the abundance of the selected features using an unpaired Wilcoxon rank sum test. Finally, LEfSe uses the linear discriminant analysis (LDA) score to quantify the effect size of each differentially abundant feature. The threshold for the LDA parameter was 2.0 (the default value).
We also produced heatmaps based on the relative abundance of the 100 most abundant ASVs to investigate how samples from different tissues cluster on a phylogenetic tree (Fig. 2g to i). Then, we used the package metagenomeSeq (31) as another method (in addition to LEfSe) to identify discriminant features at the ASV level. metagenomeSeq’s LDA approach is more sensitive to significant differences but less sensitive to potential confounding factors than the LEfSe approach (31). The 10 discriminant ASVs with the highest LDA score for each tissue were highlighted in the bar plots in Fig. 2j to l.
To assess the effect of habitat-specific factors on the clustering of samples between both host-associated tissues, we computed Spearman correlations between all samples for each tissue based on coabundance patterns of the ASVs in the samples. Correlations kept for downstream analysis had a significant Spearman correlation value of <0.05 after Bonferroni correction. Two correlation networks (skin mucus and gut communities) were constructed using Cytoscape version 3.2.1 (88) to plot significant interactions (Fig. 4). The nodes of the networks each represent one sample, and the edges (i.e., connections between nodes) are attributed to significant Spearman correlations between nodes.
Then, to further investigate the correlations between bacterioplankton, hydrochemical parameters, and host-associated communities, we computed Spearman correlations based on coabundance patterns of the ASVs in the samples. Correlations kept for downstream analysis had a significant Spearman correlation value of <0.05 after Bonferroni correction. Correlation networks were constructed using Cytoscape version 3.2.1 (88) to plot significant interactions (Fig. 5). The nodes of the networks represent taxa or hydrochemical parameters, and the edges (i.e., connections between nodes) are attributed to significant Spearman correlations between nodes.
Data availability.
The sequence files are available from the Sequence Read Archive under BioProject number PRJNA574456. The scripts used for the statistical analysis of sequence variants (DADA2 pipeline), the output ASV table, taxonomy data, mapping (metadata) file, and R markdowns used during this project are freely available from the Open Science Network platform (https://osf.io/h7skx/).
Supplementary Material
ACKNOWLEDGMENTS
We gratefully acknowledge help from all members of the Derome and Val laboratory. Thank you to Maria de Nazare, Paula da Silva, Fernanda Dragan, Rogerio Pereira, and Raquel Abecassis (INPA) for organizing the sampling expeditions. Thank you to Thiago L. A. Nascimento and Derek Campos (INPA) for continuous help during the sampling expeditions. Thank you to the three fishermen that helped us in the field: Fabiano Mota, Francisco Fonseca, and Frank Queirzo Coelho. Thank you to Jansen Zuanon, Derek Campos, Dinho Heinrichs, and Natalia Wagner (INPA) for help with fish identification. Thank you to ICMBIO/Instituto Chico Mendes de Conservação da Biodiversidade for in situ support for fish collection and for issuing the permit to transport biological samples (permit number 29837/11). Thank you to Pierre-Luc Mercier and Camille Desrosiers from Université Laval for support with sample processing in the laboratory. Thank you to Brian Boyle, Luciana Fé, Érica Souza, and Daniel Fagundes (INPA) for molecular analysis and bioinformatics support.
This research was part of the ADAPTA project at INPA and was supported by Ressources Aquatiques Québec, the Fonds de Recherche du Québec—Nature et Technologies (FRQNT) grant to F.-É.S., INCT ADAPTA (CNPq/FAPEAM) and INPA/MCTI grants to A.L.V., and the Natural Sciences and Engineering Research Council of Canada (NSERC) discovery grant (number 6333) to N.D.
Finally, we thank two anonymous reviewers for their constructive comments on a previous version of the manuscript.
F.-É.S., N.D., and A.L.V. designed the experiment. F.-É.S., A.H., N.D., and A.L.V. organized the sampling expeditions. F.-É.S., A.H., and N.D. sampled fish during the field expeditions. F.-É.S., A.H., É.A.-G., C.L., and N.D. processed samples in the laboratory (fish dissections, DNA extractions, and PCRs). F.-É.S., S.B., É.A.-G., and C.L. performed the 16S sequence analysis. F.-É.S. and N.D. wrote the manuscript. All authors reviewed the manuscript.
We declare that we have no competing interests.
Footnotes
Supplemental material is available online only.
REFERENCES
- 1.Wong SD, Rawls JF. 2012. Intestinal microbiota composition in fishes is influenced by host ecology and environment. Mol Ecol 21:3100–3102. doi: 10.1111/j.1365-294X.2012.05646.x. [DOI] [PMC free article] [PubMed] [Google Scholar]
- 2.Nayak SK. 2010. Role of gastrointestinal microbiota in fish. Aquaculture Res 41:1553–1573. doi: 10.1111/j.1365-2109.2010.02546.x. [DOI] [Google Scholar]
- 3.Lescak EA, Milligan-Myhre KC. 2017. Teleosts as model organisms to understand host-microbe interactions. J Bacteriol 199:e00868-16. doi: 10.1128/JB.00868-16. [DOI] [PMC free article] [PubMed] [Google Scholar]
- 4.Smriga S, Sandin SA, Azam F. 2010. Abundance, diversity, and activity of microbial assemblages associated with coral reef fish guts and feces. FEMS Microbiol Ecol 73:31–42. doi: 10.1111/j.1574-6941.2010.00879.x. [DOI] [PubMed] [Google Scholar]
- 5.Llewellyn MS, Boutin S, Hoseinifar SH, Derome N. 2014. Teleost microbiotas: the state of the art in their characterization, manipulation and importance in aquaculture and fisheries. Front Microbiol 5:17. doi: 10.3389/fmicb.2014.00207. [DOI] [PMC free article] [PubMed] [Google Scholar]
- 6.van Kessel MA, Dutilh BE, Neveling K, Kwint MP, Veltman JA, Flik G, Jetten MS, Klaren PH, Op den Camp HJ. 2011. Pyrosequencing of 16S rRNA gene amplicons to study the microbiota in the gastrointestinal tract of carp (Cyprinus carpio L.) AMB Express 1:41. doi: 10.1186/2191-0855-1-41. [DOI] [PMC free article] [PubMed] [Google Scholar]
- 7.Ghanbari M, Kneifel W, Domig KJ. 2015. A new view of the fish gut microbiota: advances from next-generation sequencing. Aquaculture 448:464–475. doi: 10.1016/j.aquaculture.2015.06.033. [DOI] [Google Scholar]
- 8.Sullam KE, Essinger SD, Lozupone CA, O’Connor MP, Rosen GL, Knight R, Kilham SS, Russell JA. 2012. Environmental and ecological factors that shape the gut bacterial communities of fish: a meta-analysis. Mol Ecol 21:3363–3378. doi: 10.1111/j.1365-294X.2012.05552.x. [DOI] [PMC free article] [PubMed] [Google Scholar]
- 9.Miyake S, Ngugi DK, Stingl U. 2015. Diet strongly influences the gut microbiota of surgeonfishes. Mol Ecol 24:656–672. doi: 10.1111/mec.13050. [DOI] [PubMed] [Google Scholar]
- 10.Boutin S, Sauvage C, Bernatchez L, Audet C, Derome N. 2014. Inter individual variations of the fish skin microbiota: host genetics basis of mutualism? PLoS One 9:e102649. doi: 10.1371/journal.pone.0102649. [DOI] [PMC free article] [PubMed] [Google Scholar]
- 11.Wu S, Wang G, Angert ER, Wang W, Li W, Zou H. 2012. Composition, diversity, and origin of the bacterial community in grass carp intestine. PLoS One 7:e30440. doi: 10.1371/journal.pone.0030440. [DOI] [PMC free article] [PubMed] [Google Scholar]
- 12.Llewellyn MS, Leadbeater S, Garcia C, Sylvain FE, Custodio M, Ang KP, Powell F, Carvalho GR, Creer S, Elliot J, Derome N. 2017. Parasitism perturbs the mucosal microbiome of Atlantic salmon. Sci Rep 7:43465. doi: 10.1038/srep43465. [DOI] [PMC free article] [PubMed] [Google Scholar]
- 13.Pérez T, Balcázar JL, Ruiz-Zarzuela I, Halaihel N, Vendrell D, de Blas I, Múzquiz JL. 2010. Host-microbiota interactions within the fish intestinal ecosystem. Mucosal Immunol 3:355–360. doi: 10.1038/mi.2010.12. [DOI] [PubMed] [Google Scholar]
- 14.Stephens WZ, Burns AR, Stagaman K, Wong S, Rawls JF, Guillemin K, Bohannan BJ. 2016. The composition of the zebrafish intestinal microbial community varies across development. ISME J 10:644–654. doi: 10.1038/ismej.2015.140. [DOI] [PMC free article] [PubMed] [Google Scholar]
- 15.Llewellyn MS, McGinnity P, Dionne M, Letourneau J, Thonier F, Carvalho GR, Creer S, Derome N. 2016. The biogeography of the Atlantic salmon (Salmo salar) gut microbiota. ISME J 10:1280–1284. doi: 10.1038/ismej.2015.189. [DOI] [PMC free article] [PubMed] [Google Scholar]
- 16.Sylvain FÉ, Cheaib B, Llewellyn M, Gabriel Correia T, Barros Fagundes D, Luis Val A, Derome N. 2016. pH drop impacts differentially skin and gut microbiota of the Amazonian fish tambaqui (Colossoma macropomum. ). Sci Rep 6:10. doi: 10.1038/srep32032. [DOI] [PMC free article] [PubMed] [Google Scholar]
- 17.Sylvain FE, Derome N. 2017. Vertically and horizontally transmitted microbial symbionts shape the gut microbiota ontogenesis of a skin-mucus feeding discus fish progeny. Sci Rep 7:14. doi: 10.1038/s41598-017-05662-w. [DOI] [PMC free article] [PubMed] [Google Scholar]
- 18.Chiarello M, Auguet J-C, Bettarel Y, Bouvier C, Claverie T, Graham NAJ, Rieuvilleneuve F, Sucré E, Bouvier T, Villéger S. 2018. Skin microbiome of coral reef fish is highly variable and driven by host phylogeny and diet. Microbiome 6:147. doi: 10.1186/s40168-018-0530-4. [DOI] [PMC free article] [PubMed] [Google Scholar]
- 19.Boutin S, Bernatchez L, Audet C, Derome N. 2013. Network analysis highlights complex interactions between pathogen, host and commensal microbiota. PLoS One 8:e84772. doi: 10.1371/journal.pone.0084772. [DOI] [PMC free article] [PubMed] [Google Scholar]
- 20.Sylvain FE, Holland A, Audet-Gilbert É, Luis Val A, Derome N. 2019. Amazon fish bacterial communities show structural convergence along widespread hydrochemical gradients. Mol Ecol 28:3612–3626. doi: 10.1111/mec.15184. [DOI] [PubMed] [Google Scholar]
- 21.Legrand TPRA, Catalano SR, Wos-Oxley ML, Stephens F, Landos M, Bansemer MS, Stone DAJ, Qin JG, Oxley APA. 2018. The inner workings of the outer surface: skin and gill microbiota as indicators of changing gut health in yellowtail kingfish. Front Microbiol 8. doi: 10.3389/fmicb.2017.02664. [DOI] [PMC free article] [PubMed] [Google Scholar]
- 22.Pratte ZA, Besson M, Hollman RD, Stewart FJ. 2018. The gills of reef fish support a distinct microbiome influenced by species-specific factors. Appl Environ Microbiol 84:e00063-18. doi: 10.1128/AEM.00063-18. [DOI] [PMC free article] [PubMed] [Google Scholar]
- 23.Hedges SB, Marin J, Suleski M, Paymer M, Kumar S. 2015. Tree of life reveals clock-like speciation and diversification. Mol Biol Evol 32:835–845. doi: 10.1093/molbev/msv037. [DOI] [PMC free article] [PubMed] [Google Scholar]
- 24.Pires THS, Campos DF, Ropke CP, Sodre J, Amadio S, Zuanon J. 2015. Ecology and life-history of Mesonauta festivus: biological traits of a broad ranged and abundant neotropical cichlid. Environ Biol Fish 98:789–799. doi: 10.1007/s10641-014-0314-z. [DOI] [Google Scholar]
- 25.Van der Sleen A, Albert JS. 2017. Field guide to the fishes of the Amazon, Orinoco and Guianas. Princeton University Press, Princeton, NJ. [Google Scholar]
- 26.Ropke CP, Ferreira E, Zuanon J. 2014. Seasonal changes in the use of feeding resources by fish in stands of aquatic macrophytes in an Amazonian floodplain. Environ Biol Fish 97:401–414. doi: 10.1007/s10641-013-0160-4. [DOI] [Google Scholar]
- 27.Goulding M, Carvalho ML, Ferreira EG. 1988. Rio Negro, rich life in poor water. SPB Academic Publishing, The Hague, The Netherlands. [Google Scholar]
- 28.Oliveira C, Avelino GS, Abe KT, Mariguela TC, Benine RC, Ortí G, Vari RP, Corrêa e Castro RM. 2011. Phylogenetic relationships within the speciose family Characidae (Teleostei: Ostariophysi: Characiformes) based on multilocus analysis and extensive ingroup sampling. BMC Evol Biol 11:275. doi: 10.1186/1471-2148-11-275. [DOI] [PMC free article] [PubMed] [Google Scholar]
- 29.Yue JC, Clayton MK. 2005. A similarity measure based on species proportions. Commun Stat Theory Methods 34:2123–2131. doi: 10.1080/STA-200066418. [DOI] [Google Scholar]
- 30.Segata N, Izard J, Waldron L, Gevers D, Miropolsky L, Garrett WS, Huttenhower C. 2011. Metagenomic biomarker discovery and explanation. Genome Biol 12:R60. doi: 10.1186/gb-2011-12-6-r60. [DOI] [PMC free article] [PubMed] [Google Scholar]
- 31.Paulson JN, Stine OC, Bravo HC, Pop M. 2013. Differential abundance analysis for microbial marker-gene surveys. Nat Methods 10:1200–1202. doi: 10.1038/nmeth.2658. [DOI] [PMC free article] [PubMed] [Google Scholar]
- 32.Leser TD, Molbak L. 2009. Better living through microbial action: the benefits of the mammalian gastrointestinal microbiota on the host. Environ Microbiol 11:2194–2206. doi: 10.1111/j.1462-2920.2009.01941.x. [DOI] [PubMed] [Google Scholar]
- 33.Bevins CL, Salzman NH. 2011. The potter’s wheel: the host’s role in sculpting its microbiota. Cell Mol Life Sci 68:3675–3685. doi: 10.1007/s00018-011-0830-3. [DOI] [PMC free article] [PubMed] [Google Scholar]
- 34.Bolnick DI, Snowberg LK, Hirsch PE, Lauber CL, Org E, Parks B, Lusis AJ, Knight R, Caporaso JG, Svanbäck R. 2014. Individual diet has sex-dependent effects on vertebrate gut microbiota. Nat Commun 5:4500. doi: 10.1038/ncomms5500. [DOI] [PMC free article] [PubMed] [Google Scholar]
- 35.Ray AK, Ghosh K, Ringo E. 2012. Enzyme-producing bacteria isolated from fish gut: a review. Aquac Nutr 18:465–492. doi: 10.1111/j.1365-2095.2012.00943.x. [DOI] [Google Scholar]
- 36.Desai AR, Links MG, Collins SA, Mansfield GS, Drew MD, Van Kessel AG, Hill JE. 2012. Effects of plant-based diets on the distal gut microbiome of rainbow trout (Oncorhynchus mykiss). Aquaculture 350-353:134–142. doi: 10.1016/j.aquaculture.2012.04.005. [DOI] [Google Scholar]
- 37.Nielsen S, Wilkes Walburn J, Verges A, Thomas T, Egan S. 2017. Microbiome patterns across the gastrointestinal tract of the rabbitfish Siganus fuscescens. PeerJ 5:e3317. doi: 10.7717/peerj.3317. [DOI] [PMC free article] [PubMed] [Google Scholar]
- 38.Burgos FA, Ray CL, Arias CR. 2018. Bacterial diversity and community structure of the intestinal microbiome of channel catfish (Ictalurus punctatus) during ontogenesis. Syst Appl Microbiol 41:494–505. doi: 10.1016/j.syapm.2018.04.006. [DOI] [PubMed] [Google Scholar]
- 39.de Bruijn I, Liu Y, Wiegertjes GF, Raaijmakers JM. 2018. Exploring fish microbial communities to mitigate emerging diseases in aquaculture. FEMS Microbiol Ecol 94:10.1093/femsec/fix161. doi: 10.1093/femsec/fix161. [DOI] [PubMed] [Google Scholar]
- 40.Wang AR, Ran C, Ringo E, Zhou ZG. 2018. Progress in fish gastrointestinal microbiota research. Rev Aquacult 10:626–640. doi: 10.1111/raq.12191. [DOI] [Google Scholar]
- 41.Boutard M, Cerisy T, Nogue PY, Alberti A, Weissenbach J, Salanoubat M, Tolonen AC. 2014. Functional diversity of carbohydrate-active enzymes enabling a bacterium to ferment plant biomass. PLoS Genet 10:e1004773. doi: 10.1371/journal.pgen.1004773. [DOI] [PMC free article] [PubMed] [Google Scholar]
- 42.Givens CE, Ransom B, Bano N, Hollibaugh JT. 2015. Comparison of the gut microbiomes of 12 bony fish and 3 shark species. Mar Ecol Prog Ser 518:209–223. doi: 10.3354/meps11034. [DOI] [Google Scholar]
- 43.Lowe-McConnell RH. 1975. Fish communities in tropical freshwaters. Their distribution, ecology and evolution. Longman, London, UK. [Google Scholar]
- 44.Lowe-McConnell RH. 1987. Ecological studies in tropical fish communities. Cambridge University Press, Cambridge, UK. [Google Scholar]
- 45.Vanderwaaij D, Vanderwaaij BD. 1990. The colonization resistance of the digestive-tract in different animal species and in man: a comparative-study. Epidemiol Infect 105:237–243. doi: 10.1017/s0950268800047841. [DOI] [PMC free article] [PubMed] [Google Scholar]
- 46.Merrifield DL, Rodiles A. 2015. The fish microbiome and its interactions with mucosal tissues, 273–295. In Beck BH, Peatman E (ed), Mucosal health in aquaculture. Elsevier, Oxford, UK. [Google Scholar]
- 47.Mohammed HH, Arias CR. 2015. Potassium permanganate elicits a shift of the external fish microbiome and increases host susceptibility to columnaris disease. Vet Res 46:82. doi: 10.1186/s13567-015-0215-y. [DOI] [PMC free article] [PubMed] [Google Scholar]
- 48.Reverter M, Sasal P, Tapissier-Bontemps N, Lecchini D, Suzuki M. 2017. Characterisation of the gill mucosal bacterial communities of four butterflyfish species: a reservoir of bacterial diversity in coral reef ecosystems. FEMS Microbiol Ecol 93:10.1093/femsec/fix051. doi: 10.1093/femsec/fix051. [DOI] [PubMed] [Google Scholar]
- 49.Villasante A, Ramírez C, Rodríguez H, Catalán N, Díaz O, Rojas R, Opazo R, Romero J. 2019. In-depth analysis of swim bladder-associated microbiota in rainbow trout (Oncorhynchus mykiss). Sci Rep 9:8974. doi: 10.1038/s41598-019-45451-1. [DOI] [PMC free article] [PubMed] [Google Scholar]
- 50.Betiku OC, Yeoman CJ, Gaylord TG, Americus B, Olivo S, Duff GC, Sealey WM. 2018. Water system is a controlling variable modulating bacterial diversity of gastrointestinal tract and performance in rainbow trout. PLoS One 13:e0195967. doi: 10.1371/journal.pone.0195967. [DOI] [PMC free article] [PubMed] [Google Scholar]
- 51.Chen X, Fang S, Wei L, Zhong Q. 2019. Systematic evaluation of the gut microbiome of swamp eel (Monopterus albus) by 16S rRNA gene sequencing. PeerJ 7:e8176. doi: 10.7717/peerj.8176. [DOI] [PMC free article] [PubMed] [Google Scholar]
- 52.Yu S, He R, Song A, Huang Y, Jin Z, Liang Y, Li Q, Wang X, Müller WEG, Cao J. 2019. Spatial and temporal dynamics of bacterioplankton community composition in a subtropical dammed karst river of southwestern China. MicrobiologyOpen 8:e849. doi: 10.1002/mbo3.849. [DOI] [PMC free article] [PubMed] [Google Scholar]
- 53.Yang C, Wang Q, Simon PN, Liu J, Liu L, Dai X, Zhang X, Kuang J, Igarashi Y, Pan X, Luo F. 2017. Distinct network interactions in particle-associated and free-living bacterial communities during a Microcystis aeruginosa bloom in a plateau lake. Front Microbiol 8:1202. doi: 10.3389/fmicb.2017.01202. [DOI] [PMC free article] [PubMed] [Google Scholar]
- 54.Gomez-Consarnau L, Lindh MV, Gasol JM, Pinhassi J. 2012. Structuring of bacterioplankton communities by specific dissolved organic carbon compounds. Environ Microbiol 14:2361–2378. doi: 10.1111/j.1462-2920.2012.02804.x. [DOI] [PubMed] [Google Scholar]
- 55.Zhu LF, Wu Q, Dai JY, Zhang SN, Wei FW. 2011. Evidence of cellulose metabolism by the giant panda gut microbiota. Proc Natl Acad Sci U S A 108:17714–17719. doi: 10.1073/pnas.1017956108. [DOI] [PMC free article] [PubMed] [Google Scholar]
- 56.Delsuc F, Metcalf JL, Parfrey LW, Song SJ, González A, Knight R. 2014. Convergence of gut microbiotas in myrmecophagous mammals. Mol Ecol 23:1301–1317. doi: 10.1111/mec.12501. [DOI] [PubMed] [Google Scholar]
- 57.Soverini M, Quercia S, Biancani B, Furlati S, Turroni S, Biagi E, Consolandi C, Peano C, Severgnini M, Rampelli S, Brigidi P, Candela M. 2016. The bottlenose dolphin (Tursiops truncatus) faecal microbiota. FEMS Microbiol Ecol 92:fiw055. doi: 10.1093/femsec/fiw055. [DOI] [PubMed] [Google Scholar]
- 58.Ochman H, Worobey M, Kuo CH, Ndjango JB, Peeters M, Hahn BH, Hugenholtz P. 2010. Evolutionary relationships of wild hominids recapitulated by gut microbial communities. PLoS Biol 8:e1000546. doi: 10.1371/journal.pbio.1000546. [DOI] [PMC free article] [PubMed] [Google Scholar]
- 59.Phillips CD, Phelan G, Dowd SE, McDonough MM, Ferguson AW, Delton Hanson J, Siles L, Ordóñez-Garza N, San Francisco M, Baker RJ. 2012. Microbiome analysis among bats describes influences of host phylogeny, life history, physiology and geography. Mol Ecol 21:2617–2627. doi: 10.1111/j.1365-294X.2012.05568.x. [DOI] [PubMed] [Google Scholar]
- 60.Groussin M, Mazel F, Sanders JG, Smillie CS, Lavergne S, Thuiller W, Alm EJ. 2017. Unraveling the processes shaping mammalian gut microbiomes over evolutionary time. Nat Commun 8:14319. doi: 10.1038/ncomms14319. [DOI] [PMC free article] [PubMed] [Google Scholar]
- 61.Brooks AW, Kohl KD, Brucker RM, van Opstal EJ, Bordenstein SR. 2016. Phylosymbiosis: relationships and functional effects of microbial communities across host evolutionary history. PLoS Biol 14:e2000225. doi: 10.1371/journal.pbio.2000225. [DOI] [PMC free article] [PubMed] [Google Scholar]
- 62.Franchini P, Fruciano C, Frickey T, Jones JC, Meyer A. 2014. The gut microbial community of midas cichlid fish in repeatedly evolved limnetic-benthic species pairs. PLoS One 9:e95027. doi: 10.1371/journal.pone.0095027. [DOI] [PMC free article] [PubMed] [Google Scholar]
- 63.Liu H, Guo X, Gooneratne R, Lai R, Zeng C, Zhan F, Wang W. 2016. The gut microbiota and degradation enzyme activity of wild freshwater fishes influenced by their trophic levels. Sci Rep 6:24340. doi: 10.1038/srep24340. [DOI] [PMC free article] [PubMed] [Google Scholar]
- 64.Miyake S, Ngugi DK, Stingl U. 2016. Phylogenetic diversity, distribution, and cophylogeny of giant bacteria (Epulopiscium) with their surgeonfish hosts in the Red Sea. Front Microbiol 7. doi: 10.3389/fmicb.2016.00285. [DOI] [PMC free article] [PubMed] [Google Scholar]
- 65.Riiser ES, Haverkamp THA, Varadharajan S, Borgan Ø, Jakobsen KS, Jentoft S, Star B. 2020. Metagenomic shotgun analyses reveal complex patterns of intra- and interspecific variation in the intestinal microbiomes of codfishes. Appl Environ Microbiol 86:e02788-19. doi: 10.1128/AEM.02788-19. [DOI] [PMC free article] [PubMed] [Google Scholar]
- 66.Schluter D. 2001. Ecology and the origin of species. Trends Ecol Evol 16:372–380. doi: 10.1016/s0169-5347(01)02198-x. [DOI] [PubMed] [Google Scholar]
- 67.Schluter D, Nagel LM. 1995. Parallel speciation by natural selection. Am Nat 146:292–301. doi: 10.1086/285799. [DOI] [Google Scholar]
- 68.Shafer ABA, Wolf J. 2013. Widespread evidence for incipient ecological speciation: a meta-analysis of isolation-by-ecology. Ecol Lett 16:940–950. doi: 10.1111/ele.12120. [DOI] [PubMed] [Google Scholar]
- 69.Saint-Laurent R, Legault M, Bernatchez L. 2003. Divergent selection maintains adaptive differentiation despite high gene flow between sympatric rainbow smelt ecotypes (Osmerus mordax Mitchill). Mol Ecol 12:315–330. doi: 10.1046/j.1365-294x.2003.01735.x. [DOI] [PubMed] [Google Scholar]
- 70.Nemergut DR, Schmidt SK, Fukami T, O’Neill SP, Bilinski TM, Stanish LF, Knelman JE, Darcy JL, Lynch RC, Wickey P, Ferrenberg S. 2013. Patterns and processes of microbial community assembly. Microbiol Mol Biol Rev 77:342–356. doi: 10.1128/MMBR.00051-12. [DOI] [PMC free article] [PubMed] [Google Scholar]
- 71.Nosil P, Funk DJ, Ortiz-Barrientos D. 2009. Divergent selection and heterogeneous genomic divergence. Mol Ecol 18:375–402. doi: 10.1111/j.1365-294X.2008.03946.x. [DOI] [PubMed] [Google Scholar]
- 72.Payne AI. 1978. Gut pH and digestive strategies in estuarine grey mullet (Mugilidae) and tilapia (Cichlidae). J Fish Biol 13:627–629. doi: 10.1111/j.1095-8649.1978.tb03476.x. [DOI] [Google Scholar]
- 73.Levine JM, D’Antonio CM. 1999. Elton revisited: a review of evidence linking diversity and invasibility. Oikos 87:15–26. doi: 10.2307/3546992. [DOI] [Google Scholar]
- 74.Lozupone CA, Stombaugh JI, Gordon JI, Jansson JK, Knight R. 2012. Diversity, stability and resilience of the human gut microbiota. Nature 489:220–230. doi: 10.1038/nature11550. [DOI] [PMC free article] [PubMed] [Google Scholar]
- 75.Allison SD, Martiny JBH. 2008. Resistance, resilience, and redundancy in microbial communities. Proc Natl Acad Sci U S A 105:11512–11519. doi: 10.1073/pnas.0801925105. [DOI] [PMC free article] [PubMed] [Google Scholar]
- 76.Griffiths BS, Philippot L. 2013. Insights into the resistance and resilience of the soil microbial community. FEMS Microbiol Rev 37:112–129. doi: 10.1111/j.1574-6976.2012.00343.x. [DOI] [PubMed] [Google Scholar]
- 77.Ferrenberg S, O’Neill SP, Knelman JE, Todd B, Duggan S, Bradley D, Robinson T, Schmidt SK, Townsend AR, Williams MW, Cleveland CC, Melbourne BA, Jiang L, Nemergut DR. 2013. Changes in assembly processes in soil bacterial communities following a wildfire disturbance. ISME J 7:1102–1111. doi: 10.1038/ismej.2013.11. [DOI] [PMC free article] [PubMed] [Google Scholar]
- 78.Smith AC, Ramos F. 1976. Occult haemoglobin in fish skin mucus as an indicator of early stress. J Fish Biol 9:537–541. doi: 10.1111/j.1095-8649.1976.tb04703.x. [DOI] [Google Scholar]
- 79.Shephard KL. 1994. Functions for fish mucus. Rev Fish Biol Fisheries 4:401–429. doi: 10.1007/BF00042888. [DOI] [Google Scholar]
- 80.Clarke FE. 1950. Determination of chloride in water: improved colorimetric and titrimetric methods. Anal Chem 22:553–555. doi: 10.1021/ac60040a011. [DOI] [Google Scholar]
- 81.Nossa CW, Oberdorf WE, Yang L, Aas JA, Paster BJ, Desantis TZ, Brodie EL, Malamud D, Poles MA, Pei Z. 2010. Design of 16S rRNA gene primers for 454 pyrosequencing of the human foregut microbiota. World J Gastroenterol 16:4135–4144. doi: 10.3748/wjg.v16.i33.4135. [DOI] [PMC free article] [PubMed] [Google Scholar]
- 82.Bolyen E, Rideout JR, Dillon MR, Bokulich NA, Abnet CC, Al-Ghalith GA, Alexander H, Alm EJ, Arumugam M, Asnicar F, Bai Y, Bisanz JE, Bittinger K, Brejnrod A, Brislawn CJ, Brown CT, Callahan BJ, Caraballo-Rodríguez AM, Chase J, Cope EK, Da Silva R, Diener C, Dorrestein PC, Douglas GM, Durall DM, Duvallet C, Edwardson CF, Ernst M, Estaki M, Fouquier J, Gauglitz JM, Gibbons SM, Gibson DL, Gonzalez A, Gorlick K, Guo J, Hillmann B, Holmes S, Holste H, Huttenhower C, Huttley GA, Janssen S, Jarmusch AK, Jiang L, Kaehler BD, Kang KB, Keefe CR, Keim P, Kelley ST, Knights D, et al. 2019. QIIME 2: reproducible, interactive, scalable, and extensible microbiome data science. Nat Biotechnol 37:852–857. doi: 10.1038/s41587-019-0209-9. [DOI] [PMC free article] [PubMed] [Google Scholar]
- 83.Callahan BJ, McMurdie PJ, Rosen MJ, Han AW, Johnson AJ, Holmes SP. 2016. DADA2: high-resolution sample inference from Illumina amplicon data. Nat Methods 13:581–583. doi: 10.1038/nmeth.3869. [DOI] [PMC free article] [PubMed] [Google Scholar]
- 84.McMurdie PJ, Holmes S. 2015. Shiny-phyloseq: Web application for interactive microbiome analysis with provenance tracking. Bioinformatics 31:282–283. doi: 10.1093/bioinformatics/btu616. [DOI] [PMC free article] [PubMed] [Google Scholar]
- 85.Faith DP. 1992. Conservation evaluation and phylogenetic diversity. Biol Conserv 61:1–10. doi: 10.1016/0006-3207(92)91201-3. [DOI] [Google Scholar]
- 86.Dixon P. 2003. VEGAN, a package of R functions for community ecology. J Veg Sci 14:927–930. doi: 10.1111/j.1654-1103.2003.tb02228. [DOI] [Google Scholar]
- 87.Oksanen JF, Blanchet G, Friendly M, Kindt R, Legendre P, McGlinn D, Minchin PR, O’Hara RB, Simpson GL, Solymos P, Henry M, Stevens H, Szoecs E, Wagner H. 2019. vegan: community ecology package. R package version 2.5-4. https://CRAN.R-project.org/package=vegan.
- 88.Shannon P, Markiel A, Ozier O, Baliga NS, Wang JT, Ramage D, Amin N, Schwikowski B, Ideker T. 2003. Cytoscape: a software environment for integrated models of biomolecular interaction networks. Genome Res 13:2498–2504. doi: 10.1101/gr.1239303. [DOI] [PMC free article] [PubMed] [Google Scholar]
Associated Data
This section collects any data citations, data availability statements, or supplementary materials included in this article.
Supplementary Materials
Data Availability Statement
The sequence files are available from the Sequence Read Archive under BioProject number PRJNA574456. The scripts used for the statistical analysis of sequence variants (DADA2 pipeline), the output ASV table, taxonomy data, mapping (metadata) file, and R markdowns used during this project are freely available from the Open Science Network platform (https://osf.io/h7skx/).