

Abstract
The integration of acoustics and microfluidics (termed acoustofluidics) presents a frontier in the engineering of functional micro-/nanomaterials. Acoustofluidic techniques enable active and precise spatiotemporal control of matter, providing great potential for the design of advanced nanosystems with tunable material properties. In this work, we introduce an acoustofluidic approach for engineering multifunctional three-dimensional nanostructure arrays and demonstrate their potential in enrichment and biosensing applications. In particular, our acoustofluidic device integrates an acoustic transducer with a sharp-edge-based acoustofluidic reactor that enables uniform patterning of zinc oxide (ZnO) nanoarrays with customizable lengths, densities, diameters, and other properties. The resulting ZnO nanoarray-coated glass capillaries can rapidly and efficiently capture and enrich biomolecules with sizes ranging from a few nanometers to several hundred nanometers. In order to enable the detection of these biomolecules, silver (Ag) nanoparticles are deposited onto the ZnO nanoarrays, and the integrated ZnO–Ag capillary device functions as a label-free plasmonic biosensing system for surface-enhanced Raman spectroscopy (SERS) based detection of exosomes, DNA oligonucleotides, and E. coli bacteria. The optical sensing enhancement of ZnO–Ag capillary is further validated through finite-difference time-domain (FDTD) simulations. These findings not only provide insights into the engineering of functional micro/nanomaterials using acoustofluidics but also shed light onto the development of portable microanalytical devices for point-of-care applications.
Keywords: acoustics, acoustofluidics, ZnO nanoarray, microfluidics, SERS sensing
Graphical Abstract
Materials with three-dimensional (3D) architectures, such as scaffolds and micro-/nanolattices, are of great interest due to their tunable material properties and extraordinary performance in a variety of applications, including sensing,1 tissue engineering,2 energy storage,3 and optoelectronics.4 To date, many different techniques, such as electrodeposition and photolithography, have been used in the fabrication of micro-/nanoengineered materials,5–8 enabling the generation of complex, hierarchical structures that can be tailored for use in various applications. However, most available fabrication techniques for generating integrated 3D materials suffer from lengthy synthesis times, high fabrication costs, and/or tedious processing procedures including template/substrate preparation, material deposition, and template/substrate removal; furthermore, these fabrication processes become considerably more complex when trying to incorporate micro-/nanostructures into practical devices.5–8 As such, to fully exploit the benefits of 3D micro/nanomaterials and expand their potential in emerging application such as point-of-care diagnosis, it is vital to develop efficient, rapid, low-cost, and straightforward techniques for engineering these functional structures.
Over the past several decades, many microfluidic approaches for materials synthesis have been developed. Each of these techniques shares inherent advantages that arise from operating at length scales ranging from tens to hundreds of micrometers, including lower costs, less reagent consumption, and improved spatiotemporal control over the concentration of molecules.9 The emergence of microfluidics has enabled researchers to engineer micro-/nanostructures with more well-defined features and highly tunable material properties,10–16 which has led to significant advances in fields such as biosensing, particle separation, drug delivery, catalysis, and point-of-care diagnosis.13,17–21 While various types of microfluidic and analytical systems have been demonstrated, glass capillaries represent one of the simplest approaches for both materials development and biochemical microanalysis.22,23 Because capillary action can be leveraged to drive fluid through glass capillary devices, they eliminate the need for external pumps and power supplies, which are required in most other microfluidic approaches. Considering their additional favorable features such as high optical transmittance, simple preparation, and low cost, glass capillaries offer an attractive approach for the integration of 3D materials with analytical and bioanalytical platforms. For example, by patterning aligned 3D materials with large surface areas on the inner walls of capillary microchannels, researchers can immobilize a large variety of biomolecules for sensing and diagnostic applications. Although 3D material-integrated capillaries have emerged as a promising microanalytical platform,24–29 the controllable assembly of 3D micro/nanostructures inside of confined capillary microchannels, especially with well-defined patterns, remains an outstanding challenge.30 Acoustofluidic techniques, which integrate acoustics with microfluidics, are capable of manipulating fluids and particles in a contactless, biocompatible, and highly precise manner,31–36 providing a potential approach to vastly improving the controllable fabrication of functional 3D micro/nanostructures.
Herein, we introduce an acoustofluidic approach for constructing controllable nanostructure arrays inside a glass capillary microchannel to produce a multifunctional microanalytical platform for bioanalysis. An acoustofluidic mixer was designed to actively mix reagents as a result of the acoustic streaming induced by acoustically oscillating sharp-edge structures. This mixer can be used to pattern well-defined 3D zinc oxide (ZnO) nanoarrays on the inner walls of a glass capillary microchannel in a robust, facile, and straightforward manner. Furthermore, the density, diameter, length, and other parameters of the ZnO nanoarray inside the glass capillary can be readily adjusted by tuning various operating parameters (e.g., seeding phase, reactant concentration, and growth time). The ability of the resulting ZnO nanoarray-coated capillary to enrich various types of bioparticles, including exosomes, proteins, and DNA molecules was examined and its residence time-dependent performance was investigated. Additionally, finite-difference time-domain (FDTD) simulation was implemented to validate the optical sensing enhancement of ZnO nanoarray inside glass capillary. Finally, after grafting with Ag nanoparticles onto the ZnO nanoarray, label-free surface-enhanced Raman spectroscopy (SERS) sensing analysis of exosomes, DNAs, and E. coli bacteria was demonstrated. These results reveal that our acoustofluidics-enabled technique not only represents a robust approach for controllable engineering of functional micro/nanostructures but can also be readily applied in practical bioanalytical applications.
RESULTS AND DISCUSSION
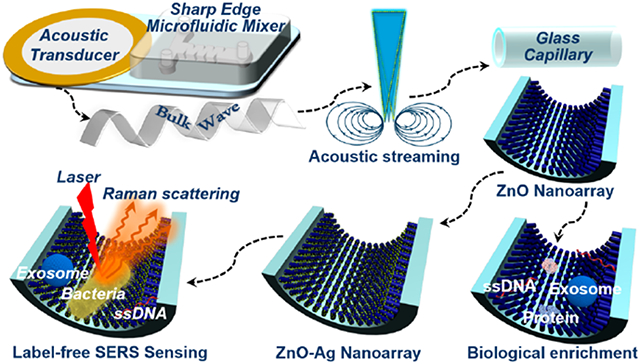
When engineering ZnO nanomaterials, which possess attractive optoelectronic properties, it is critical, yet extremely difficult, to precisely control the nucleation and growth behavior during synthesis.37–40 To achieve controllable engineering of 3D nanoarray inside confined capillaries, we introduce an integrated acoustofluidic device containing an acoustic transducer and a sharp-edge based acoustofluidic micromixer (Figure 1). Electrically actuating the acoustic transducer causes the sharp-edge structures to oscillate and generate acoustic streaming, which vigorously agitates reactants in the channel and facilitates rapid mass diffusion to thoroughly mix the solutions.41–43 Given the active and complete mixing achievable with the acoustofluidic device, we hypothesized that well-defined 3D ZnO nanoarray and even more hierarchical nanostructures could be readily patterned on the inner walls of capillary microchannels (Figure 1).
Figure 1.
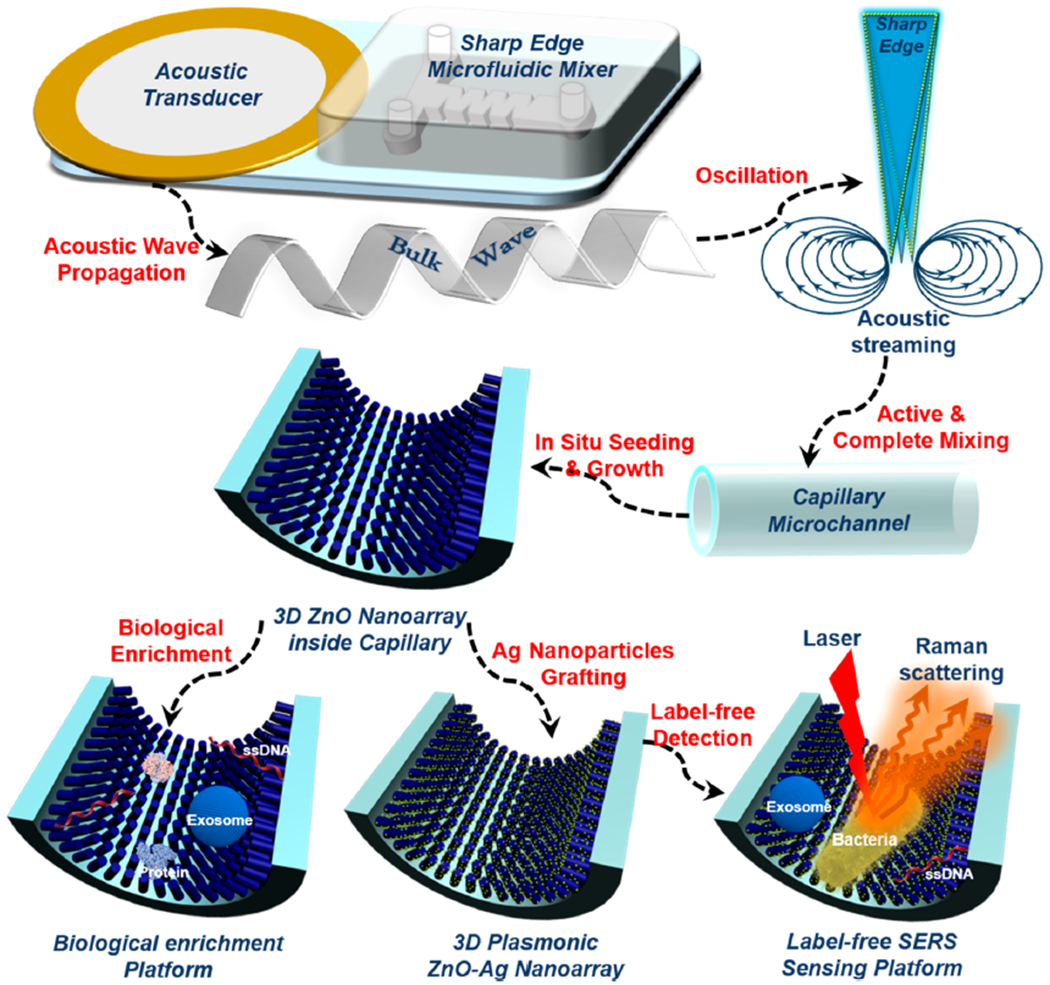
Schematic diagram showing the working mechanism of the acoustofluidic setup for the construction of a 3D nanoarray inside of a confined capillary microchannel as multifunctional biological enrichment and sensing platforms (objects are not drawn to scale).
The integrated acoustofluidic system for engineering 3D ZnO nanoarray is composed of three main components: an acoustic transducer that generates bulk waves which propagate through the mixing zone; an acoustofluidic mixer with sharp-edge structures that creates acoustic streaming to facilitate active and intense mixing of reagents; and a capillary microchannel that acts as the reaction zone for producing functional nanostructures. The sharp-edge acoustofluidic mixer with two inlets and one outlet was fabricated using standard photolithography and deep ion etching techniques (Figure 2A). Briefly, polydimethylsiloxane (PDMS) precursor was poured over a master silicon mold. After curing the polymer, the PDMS replica was peeled-off and then treated by oxygen plasma, and subsequently bonded to a glass coverslip substrate to form the microchannel (Figure 2A). Four pairs of sharp-edge structures were formed as PDMS protrusions from the sidewall of the channel. The length, depth, and width of the PDMS microchannel are 1 cm, 50 μm, and 600 μm, respectively. Each sharp-edge structure was designed to have a height of 300 μm and a tip angle of 15° (see Supporting Information for details). The gap distance between two adjacent sharp-edge structures is 300 μm (Figure 2B).
Figure 2.
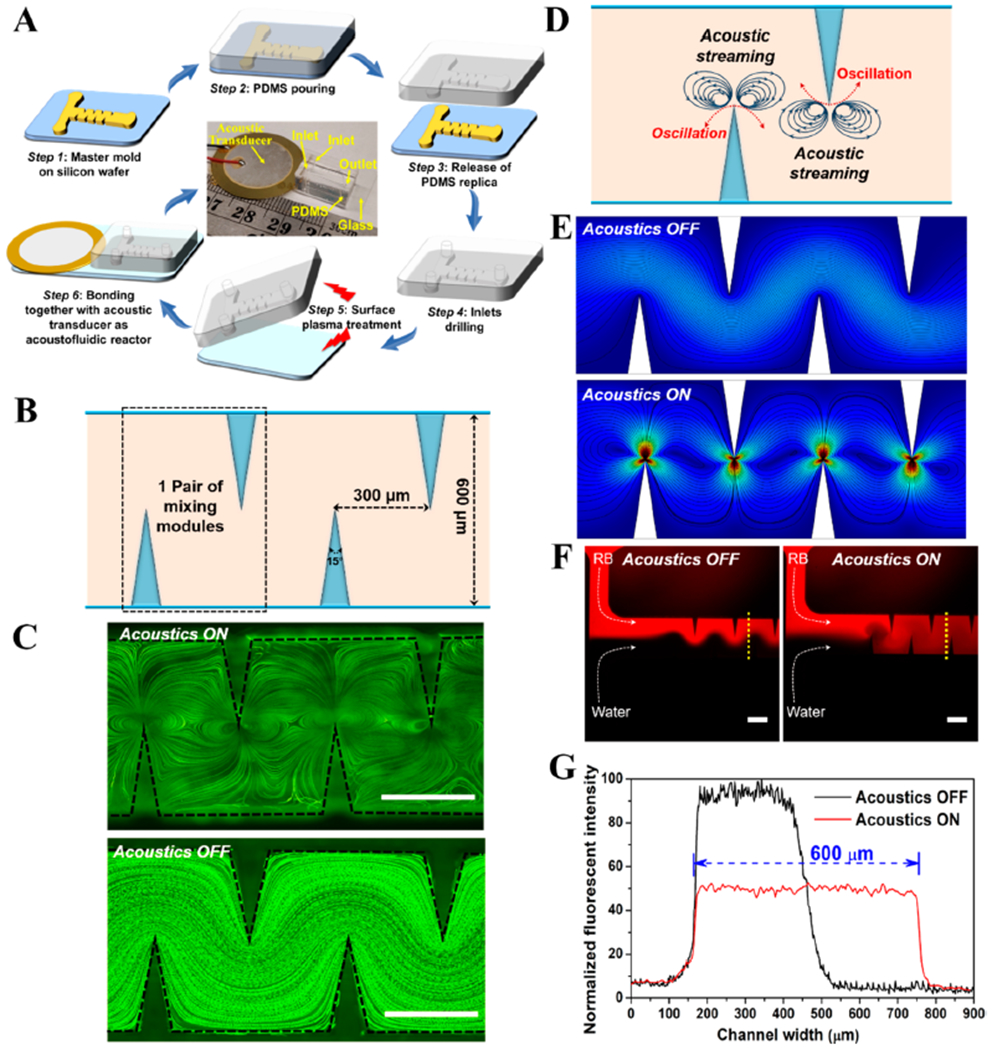
Development of acoustofluidic platform for the construction of three-dimensional ZnO nanoarray. (A) Schematic workflow showing the fabrication of acoustofluidic device with sharp-edge structures. The central image is a photograph of the resultant acoustofluidic device with a ruler for scale. Objects are not drawn to scale. (B) Schematic diagram showing the design parameters of acoustofluidic device. (C) Stacked fluorescent images showing the flow patterns when the acoustic transducer is On (up) or Off (down) status. Scale bar = 300 μm. (D) Proposed acoustic streaming pattern toward enhanced mixing inside microchannel. (E) COMSOL simulation of acoustic streaming patterns when the acoustic transducer is inactivated (up) or activated (down). (F) Fluorescent profiles showing the mixing of rhodamine B (RB) and water when the acoustic transducer is Off (left) or On status (right). Scale bar = 300 μm. (G) Normalized fluorescent profiles across the width of microchannel from the yellow dash lines in (F). Acoustofluidic tests shown in (C) and (F) are obtained with an applied voltage, frequency, and flow rate of 10 V, 4.3 kHz, and 5 μL/min, respectively.
To characterize the fluid flow patterns of the acoustofluidic mixing device, a solution containing 1 μm fluorescent polystyrene beads was pumped into the acoustofluidic mixer module. As shown in Figure 2C, in the presence of acoustic activation (with the acoustic transducer ON), oscillating sharp-edge structures can induce a pair of strong counter-rotating vortices (also known as acoustic streaming) around the tip of each sharp-edge structure (Figure 2D). Whereas, in the absence of acoustic activation (with the acoustic transducer OFF), no obvious perturbation of the bulk flow was observed inside the PDMS microchannel. These results reveal that acoustic streaming could greatly enhance mass diffusion of reactant fluids by breaking the interface of the laminar flows. COMSOL simulation further confirms that there is no acoustic streaming phenomenon when the acoustic transducer is inactive; once the transducer is activated, the acoustic streaming patterns emerge around the tips of sharp-edge structures (Figure 2E). Since each sharp-edge structure induces acoustic streaming when acoustically oscillated, it could serve as a robust vortex mixer, thus significantly facilitating active, rapid, and homogeneous mixing of reagents. To demonstrate this phenomenon, the mixing performance of acoustofluidic devices was analyzed by injecting a solution containing Rhodamine B into one inlet and water into the other. As shown in Figure 2F, a clear side-by-side laminar flow pattern with no obvious mixing was formed when the acoustic transducer was OFF (i.e., without acoustic streaming). However, when the acoustic transducer was switched ON (i.e., with acoustic streaming), the two reactant fluids were rapidly mixed together into a homogeneous phase after flowing through the first pair of sharp-edge structures; the mixing time in the presence of acoustic streaming is only a few hundred milliseconds (see the Supporting Information for details on mixing time calculations). To further verify the mixing performance of this acoustically driven sharp-edge based acoustofluidic system, the cross-sectional fluorescence distribution profiles (locations of the dashed lines in Figure 2F) were examined. As shown in Figure 2G, an obvious difference in fluorescence intensities between the two fluids was observed in the absence of acoustic streaming, whereas a uniform fluorescence distribution across the channel width was observed in the presence of acoustic streaming even after flowing through just two pairs of sharp-edge structures. These results validate the feasibility and effectiveness of using the integrated acoustofluidic platform toward active, rapid, and complete mixing of reagents, providing great opportunity for controllable synthesis of functional 3D micro/nanostructures and even more hierarchical materials.
To construct 3D ZnO nanoarrays with controllable structures inside a capillary microchannel, we adopted a two-step seeding and growth approach based on the integrated acoustofluidic platform. As shown in Figure 3A, a straightforward setup was utilized to carry out the in situ engineering processes. Specifically, the acoustic transducer was driven with an applied voltage and frequency of 10 V and 4.3 kHz (see the Supporting Information for details), respectively, during the operation of the acoustofluidic mixer. To activate the inner surface of the glass capillary, it was first treated with fresh potassium permanganate (KMnO4).44 In order to seed the ZnO onto the inner wall of the capillary, the two inlet fluids of the acoustofluidic mixer, one containing zinc acetate (Zn(OAc)2, 5 mM in ethanol) and the other sodium hydroxide (NaOH, 10 mM in ethanol), were delivered at the same flow rate of 5 μL/min. Solutions were mixed by the sharp-edge structures and then passed into glass capillary. After being placed at 75 °C for 2 h, one seeding phase was finished; this process can be repeated to conduct an additional seeding phase. The growth stage of ZnO was carried out in a similar manner to the seeding stage, but the reagents were replaced with zinc nitrate (Zn(NO3)2, 10–50 mM in water) and hexamethylenetetramine (HMTA, 10 mM in water) and delivered in a continuous flow at 90 °C.
Figure 3.
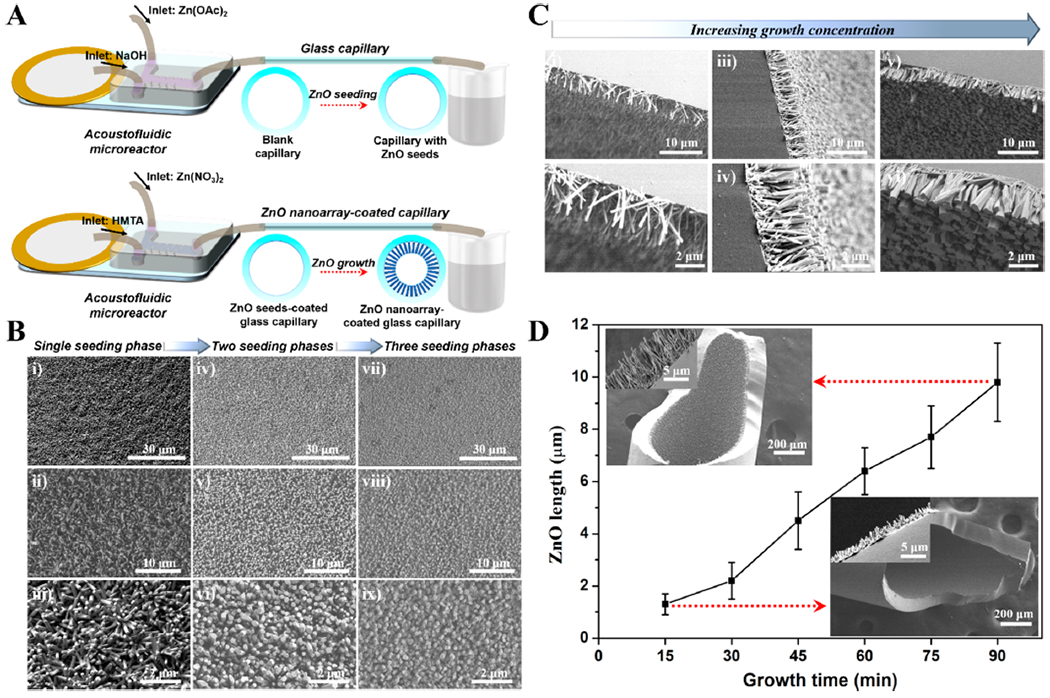
Acoustofluidics-enabled controllable construction of ZnO nanoarray in confined capillary microchannel. (A) Schematic representation of acoustofluidic setup platform. (B) SEM images showing the effect of seeding phases (i–iii: single seeding phase; iv–vi: two seeding phases; and vii–ix: three seeding phases) on the density property of ZnO nanoarray. (C) SEM images showing the effect of growth concentration (i–ii, iii–iv, and v–vi are products with 10, 25, and 50 mM zinc nitrate during the growth phase, respectively) on the diameter property of ZnO nanorods. (D) Effect of growth time on the length property of ZnO nanorods. The insets are two groups of typical SEM images with 15 and 90 min growth time.
Various seeding and growth conditions were examined to demonstrate the tunability in the structural properties of ZnO. As shown in Figure 3B–D, different seeding and growth conditions can significantly affect the formation of the 3D ZnO nanoarray that is patterned inside the capillary microchannel. When we fixed the growth conditions at 10 mM Zn(NO3)2 and a 45 min growth time, we observed that a higher number of seeding phases increased the density of the resulting 3D ZnO nanoarray products (from the top view of SEM images in Figure 3B). With a single seeding phase, many ZnO nanorods were formed in a disordered arrangement with a large interstitial spacing (Figure 3Bi–iii); alternatively, two (Figure 3Biv–vi) and three (Figure 3Bvii–ix) seeding phases can significantly increase the number of ZnO nanorods and yielded a more vertical alignment with minimal interstitial spacing. The densities of ZnO nanorods from single seeding phase, two seeding phases, and three seeding phases were estimated to be 8.1, 14.6, and 19.5 per square micrometer, respectively (Figure S1). We also noted that, in the absence of acoustic activation (Acoustics OFF), the resultant ZnO products were patterned in an uncontrollable manner inside glass capillary due to incomplete mixing (Figure S2).
With regard to varying the parameters of the growth stage, we found that when using a single seeding phase and 45 min growth time, the diameter of the ZnO nanorod array was positively correlated with the concentration of Zn(NO3)2. As shown from the side-view SEM images in Figure 3C, when continuously increasing the concentration of Zn(NO3)2 from 10 mM (Figure 3Ci–ii) through 25 mM (Figure 3Ciii–iv) and up to 50 mM (Figure 3Cv–vi), the diameter of the ZnO nanorods gradually increased from 163 to 274 to 508 nm, respectively (Figure S3). Additionally, with lower concentration of the zinc precursor during the growth stage, unoriented nanorods with obvious interstitial space were observed (Figure 3Ci–ii), whereas higher concentrations not only yielded larger nanorod diameters but also helped to align and vertically position the nanorods inside glass capillary (Figure 3Ciii–vi). The length of the nanorod array as a function of growth time was examined when using a single seeding phase and 10 mM Zn(NO3)2 concentration during the growth stage. As shown in Figure 3D, the length of the ZnO nanorods can be well-tuned from nearly 1 to 10 μm with a growth time ranging from 15 to 90 min. The longer the growth time, the more obvious the nanostructure array became, even at low magnification under SEM (Figure 3D, insets). Meanwhile, the visible color of the glass capillary gradually changed from clear transparent to white translucent as a greater number of larger nanorods were coated on the inner surface of the glass capillary and blocked light transmission.
We further observed that the flow rate plays a significant role in the uniformity of the resultant 3D ZnO nanoarrays. During the seeding and growth stages, lower flow rates led to more obvious uneven gradient distribution of nanorod structures from the entrance to the exit of the capillary microchannel, whereas higher flow rates generated more uniform ZnO nanostructures (but at the expense of greater reagent consumption). In addition to round hollow capillaries, we also employed our integrated acoustofluidic platform to successfully construct 3D ZnO nanorod array inside a square hollow capillary (Figure S4), demonstrating the platform’s versatility. Altogether, these results highlight the potential of acoustofluidics for the efficient development of 3D functional micro/nanomaterials with controllable structures.
By virtue of its intrinsically enclosed microchannel, 3D nanoarray network, dense interstitial space, and large contact surface, the ZnO nanoarray-coated capillary can function as an excellent biological enrichment platform. Here, we define the enrichment efficiency as the proportion of a target separated from the test samples. Considering the high isoelectric point of ZnO (~9.5), there is a net positive charge under common physiological conditions,45 which means that our ZnO nanoarray-coated capillary can act as an ideal reservoir for attachment of a variety of bioactive molecules through electrostatic interactions. In addition, zinc ions could actively coordinate with histidine, methionine, tyrosine, and carboxyl/carboxylate groups,46 which further facilitates the retention efficiency of biomolecules, such as exosomes, proteins, and nucleic acids (Figure 4A). To demonstrate this principle, we first achieved effective enrichment of exosomes, which are cell-derived nanovesicles (30–150 nm in diameter) and carry lipids, proteins, and nucleic acids to act as important biomarkers for theranostic purposes.33,47 Developing rapid, sensitive, and effective tools for exosome analysis has attracted significant attention in recent years but still presents a great challenge.48 To facilitate the exosome-enrichment process, we adopted a continuous nonequilibrium solid-phase microextraction strategy.49 In brief, a minute volume of sample solution was injected into the ZnO nanoarray-coated capillary to form a liquid plug; the movement of liquid plug inside capillary, which was controlled by the injection and withdraw modes of an automated syringe pump (neMESYS, Cetoni, Germany), was used to enhance the interactions between the ZnO nanoarray and the molecular targets (Figure S5). The residence time that the sample fluids spent within the capillary can be well-tuned by the precise operations of the pump. To evaluate the structural effect of the 3D ZnO on the biological enrichment efficiency, we constructed ZnO nanoarray-coated capillary devices with different ZnO nanorod lengths that are regulated by changes in growth time durations (15 min, ZnO-15; 45 min, ZnO-45; 90 min, ZnO-90, as shown in Figure 3D). The results show that, at a residence time of 60 s, the longer the length of ZnO nanorods, the higher the enrichment performance of the ZnO nanoarray-coated capillary toward exosomes (Figure S6). This can be attributed to the increased steric hindrance and enhanced electrostatic attraction/coordination interactions from the larger contact surface area of ZnO-90.50 On the basis of this observation, the effect of residence time on the exosome enrichment efficiency was investigated at 15, 30, 45, 60, 90, 120, and 180 s. After a given residence time, the liquid plugs of human urine exosome samples which had been passed through the ZnO nanoarray-coated capillary were pumped out for nanoparticle tracking analysis (NTA) measurements. As shown in Figure 4B, the enrichment efficiency of ZnO nanoarray-coated capillary toward exosomes is positively correlated to the residence time. Approximately 83% of exosomes were successfully retained inside capillary within only 60 s, while over 95% of exosomes from the original sample can be trapped after 90 s of treatment, suggesting the rapid and efficient enrichment performance of our 3D ZnO nanostructures. The trapped samples can be either directly used for in situ analysis or released under mild conditions (via an elution buffer of phosphate-buffered saline50 and phosphoric acid51) for further usage.
Figure 4.
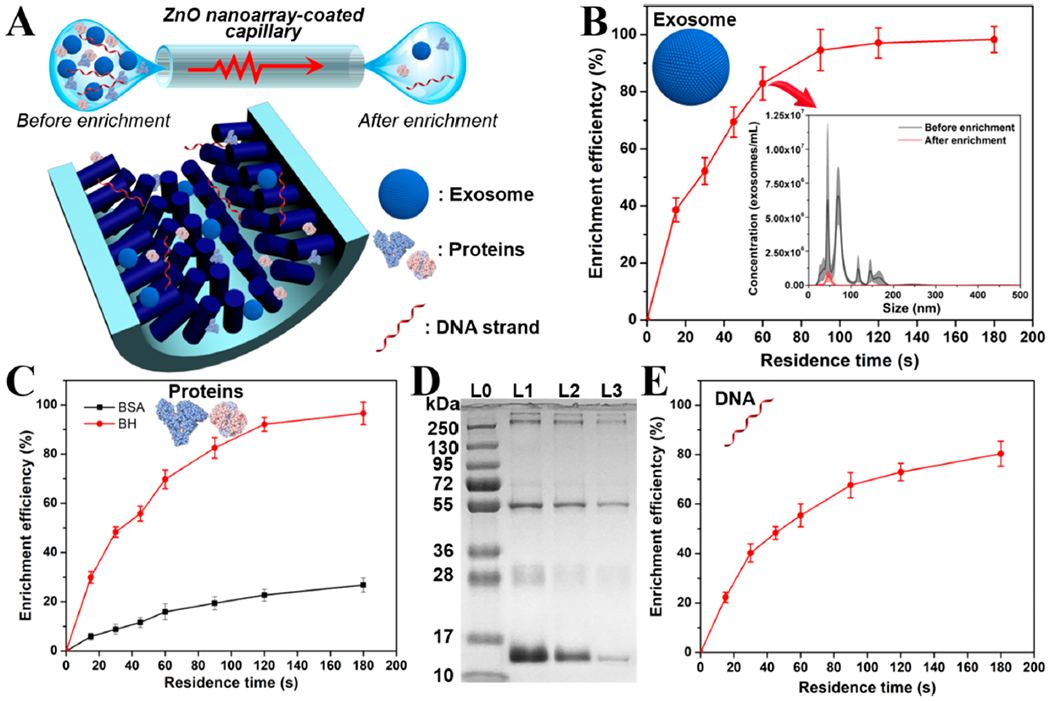
Acoustofluidics-enabled 3D ZnO nanorod array inside capillary for biomolecules enrichment. (A) Schematic diagram showing the enrichment of biomolecules including exosomes, proteins, and nucleic acids (objects are not drawn to scale). (B) Enrichment of human urine exosomes using ZnO nanoarray-coated capillary with different residence times. The inset shows the concentration profiles of exosome sample solutions before and after enrichment treatment by ZnO nanoarray-coated capillary. Results were obtained in five independent tests. (C) Enrichment of BSA and BH proteins (250 μ/mL) in 0.1 M KCl using ZnO nanoarray-coated capillary with different residence time. Results were obtained in triplicate. (D) SDS–PAGE analysis of human whole blood before and after enrichment with the ZnO nanoarray-coated capillary. L0 is the lane of standard marker proteins; L1 is the lane of human whole blood diluted 800 times before enrichment treatment; L2 and L3 are lanes of blood samples after enrichment treatment with a residence time of 30 and 120 s, respectively. (E) Enrichment of ssDNA oligonucleotide (10 μM) using ZnO nanoarray-coated capillary with different residence time. Results were obtained in triplicate.
Using bovine serum albumin (BSA, IEP = ~4.7) and bovine hemoglobin (BH, IEP = ~6.9), we investigated the potential of ZnO nanoarray-coated capillaries to enrich proteins. The bicinchoninic method was used to determine the concentrations of proteins before and after enrichment. Due to the electrostatic attraction and coordination affinity capabilities of the 3D ZnO nanoarray network, both BSA and BH proteins in water can be efficiently enriched inside capillaries (Figure S7). However, changing the protein medium into a high ionic strength KCl solution (0.1 M) significantly reduced the amount of BSA adsorbed onto the inner surface of microchannel (from 89.3% to 15.9% with a residence time of 60 s) due to the elimination of electrostatic interactions. On the other hand, no obvious change was observed for BH (from 77.4% to 69.7% with a residence time of 60 s) since it is a typical histidine-rich protein and enables robust zinc-histidine coordination affinity.28 Such selective adsorption behavior of ZnO nanoarray-coated capillary toward proteins in a KCl medium was further confirmed when adjusting the residence time from 15 to 180 s. As shown in Figure 4C, the enrichment efficiency of both BSA and BH increased when increasing the residence time inside capillary. However, ZnO nanoarray-coated glass capillary exhibited an obvious higher retention capacity of BH than that of BSA over time. To further evaluate the selectivity and practicality of ZnO nanoarray-coated capillary for protein enrichment, human whole blood was selected as a mock clinical sample for enrichment in high ionic strength medium. Sodium dodecyl sulfate polyacrylamide gel electrophoresis (SDS–PAGE) results showed that, before the enrichment treatment, several major bands including human serum albumin (~66 kDa)52 and human hemoglobin (~16 kDa)53 were present in a high abundance in the sample (Figure 4D, lane L1). After the enrichment treatment, all bands are diminishing to different extents due to the retention of proteins within the ZnO nanoarray-coated capillary. With a residence time of 30 s, hemoglobin proteins were obviously depleted (Figure 4D, lane L2), and a majority of proteins were retained inside the capillary after 120 s treatment (Figure 4D, lane L3). Whereas, the band of human serum albumin proteins was not significantly changed, which is in agreement with the results from Figure 4C. This finding reveals that 3D ZnO nanoarrays inside a confined capillary microchannel possess rapid, efficient, and selective enrichment capabilities, providing great potential in low abundance protein analysis for point-of-care theranostics.
To examine the enrichment performance of ZnO nanoarray-coated glass capillary toward nucleic acids, we attempted to enrich a single-stranded DNA (ssDNA) oligonucleotide with a random sequence of 16 bases (GGGAGTCAAGAACGAA) using a method similar to that described above. The concentrations of DNA samples before and after treatment were measured using a NanoDrop microvolume spectrophotometer. As shown in Figure 4E, the enrichment profile of ssDNA by ZnO nanoarray-coated capillary as a function of residence time showed a trend similar to those of exosomes and proteins. Rapid DNA adsorption (40.2%) was observed with a residence time of 30 s, and over 80% of the oligonucleotides can be successfully enriched after 180 s of treatment due to the synergic actions of steric hindrance, electrostatic attraction, and coordination affinity between the ZnO nanoarray-coated capillary and the ssDNA molecules. To further increase the enrichment efficiency of biomolecules, prolonging the residence time and/or extending the length of capillary microchannel could be employed. In addition, the reusability of ZnO nanoarray-coated capillary was demonstrated by using a simple thermal treatment after enriching the DNA samples,54 no significant difference was observed among all eight tests (Figure S8). These findings not only demonstrate the robust biological enrichment performance of 3D ZnO nanostructures toward bioactive targets with a broad size range, but also reveal their excellent efficiency, selectivity, and reusability.
To further explore the biosensing applicability of functional 3D ZnO nanostructures inside of a confined capillary, Ag nanoparticles were deposited onto ZnO nanorods to enable SERS enhancement. The development of such ZnO–Ag glass capillaries was realized by a direct reduction of AgNO3 with NaBH4 using a similar acoustofluidic setting as described above (Figure 5A). ZnO nanoarray-coated capillary devices that were prepared with a single seeding phase, 10 mM Zn(NO3)2 concentration, and 30 min growth time were employed as a growth substrate of silver. Two inlet flows with one containing AgNO3 (2.5 mM in water) and the other NaBH4 (7.5 mM in water) were pumped into the sharp-edge acoustofluidic device with an applied voltage, frequency, and flow rate of 10 V, 4.3 kHz, and 5 μL/min, respectively; the outlet of the acoustofluidic mixer was connected to the ZnO nanoarray-coated capillary. After continuously operating for 30 min at room temperature, the capillary device was rinsed with water thoroughly to ensure complete removal of nitrate ions and unbound silver particles. After the Ag nanoparticle modification, the translucent white color of the ZnO nanoarray-coated capillary devices changed to black, owing to the effect of the silver coating. The structures of silver-bearing ZnO (ZnO–Ag) were examined by SEM and TEM. SEM images showed that the well-defined nanorod morphology was still maintained after Ag deposition, and the ZnO–Ag exhibited a typical coarse surface (Figure 5Bi–ii). High-magnification SEM images confirmed that abundant small-sized Ag nanoparticles were attached on the surface of the ZnO nanorods (Figure 5Biii). After scratching the ZnO–Ag samples from the inner wall of the capillary, TEM characterization was further performed. The obvious contrast between ZnO and Ag clearly indicates the presence of Ag, and the lattice fringe spacing of 0.235 nm agrees well with the interplanar distances of Ag(111) planes (Figure 5Biv).55 Element mapping analysis demonstrated the presence of Zn, O, and Ag elements and also the relatively uniform distribution of silver on ZnO nanoarray (Figure 5C). Energy-dispersive X-ray spectroscopy (EDS) results showed that ~7.6 wt % silver content can be grafted onto the ZnO nanorods, and the Ag nanoparticles within the ZnO–Ag capillary system were mainly in the size range of 10–40 nm (Figure 5D). However, in the absence of acoustics, no obvious silver nanostructures were found on the surface of the ZnO nanorods (Figure S9). In addition, increasing the concentration of the silver precursor (Figure S10) or prolonging the reaction time (Figure S11) led to undesirable net-like and/or fiber-like silver products.
Figure 5.
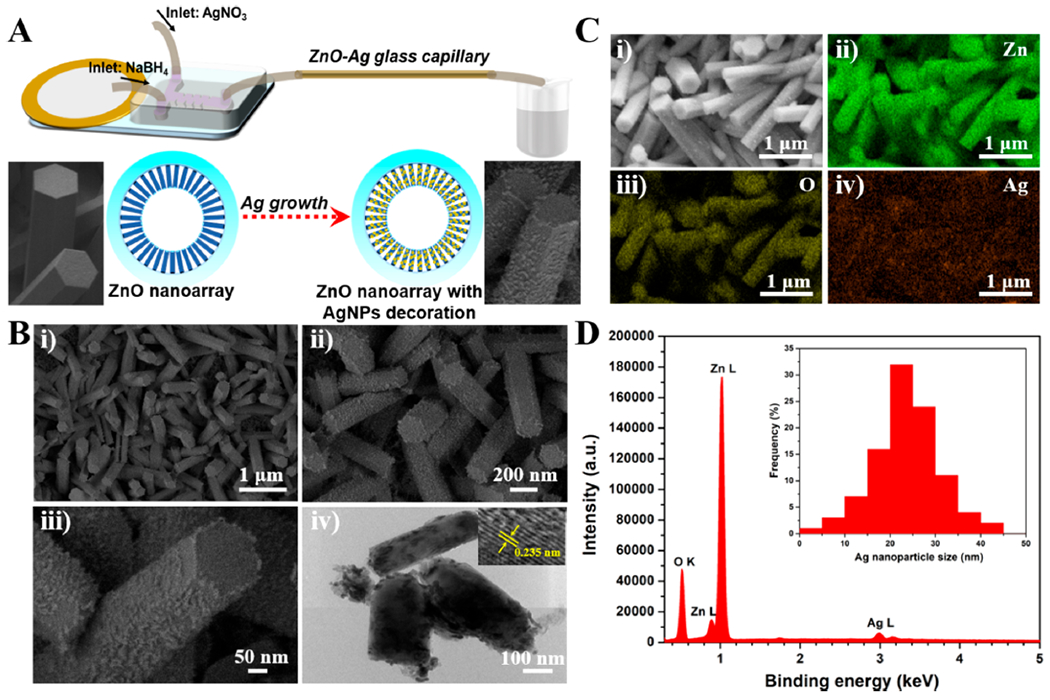
Construction of 3D ZnO plasmonic nanoarray in confined capillary microchannel. (A) Schematic diagram showing the construction of ZnO–Ag nanoarray. (B) SEM (i–iii) and TEM (iv) images of the resultant ZnO–Ag nanoarray materials. ZnO nanoarray-coated capillary device was prepared with 30 min growth time. TEM sample was scratched from the inner wall of glass capillary. The inset in Figure 5B-iv indicates the lattice pattern of Ag nanoparticle. (C) SEM image (i) and the corresponding element mapping images of Zn (ii), O (iii), and Ag (iv). (D) Energy-dispersive X-ray spectroscopy (EDS) of the resultant ZnO–Ag. The inset is the statistical Ag nanoparticle size distribution.
To validate the structural design of the ZnO–Ag glass capillary for biosensing applications, finite-difference time-domain (FDTD) simulations were employed to simulate the electromagnetic field distribution.56 To simplify the simulation procedure, Ag nanospheres with a diameter of 25 nm are attached on the surface of ZnO cylinders with a diameter of 160 nm and a length of 2200 nm (as identified from Figure 5B). The electromagnetic field distribution was analyzed over three identical ZnO nanorods and ZnO–Ag nanorods with different distances and patterns (Figure 6). As shown in Figure 6B, there is limited electromagnetic field enhancement corresponding to vertically aligned pristine ZnO nanorods. When Ag nanoparticles are attached onto the ZnO surface, a strong electromagnetic field starts to emerge around the ZnO–Ag structures (Figure 6C). In addition, if ZnO–Ag nanorods approach each other with a shorter gap distance, a magnified electromagnetic field is observed (Figure 6D). Moreover, according to our experimental observations, the ZnO–Ag nanoarray inside the capillaries are not in perfect vertical alignment but show cluster-like structures that lean toward each other. When the ZnO–Ag nanorods are placed in a tilted pattern, a dramatically enhanced electromagnetic field can be seen from the adjacent regions (Figure 6E). These results highlight the importance of structural design when applying plasmonic nanostructures in biosensing applications. ZnO–Ag nanorods with narrow gaps could provide attractive “hot-spots” in the field intensity, which would likely facilitate strong signal enhancement in surface-enhanced Raman spectroscopy (SERS) detection.57,58 In particular, the 3D ZnO–Ag with disordered tilting patterns inside a confined capillary (as shown in Figure 3C) could generate numerous SERS “hot-spots” located among adjacent Ag nanoparticles on both the same and neighboring ZnO nanorods (Figure S12). Therefore, owing to controllable 3D nanostructures, large contact surface area, and high silver content loading, the ZnO–Ag glass capillary system is expected to achieve superior SERS sensing performance, making our acoustofluidic technique promising for use in fields of biomedicine and bioanalysis.
Figure 6.
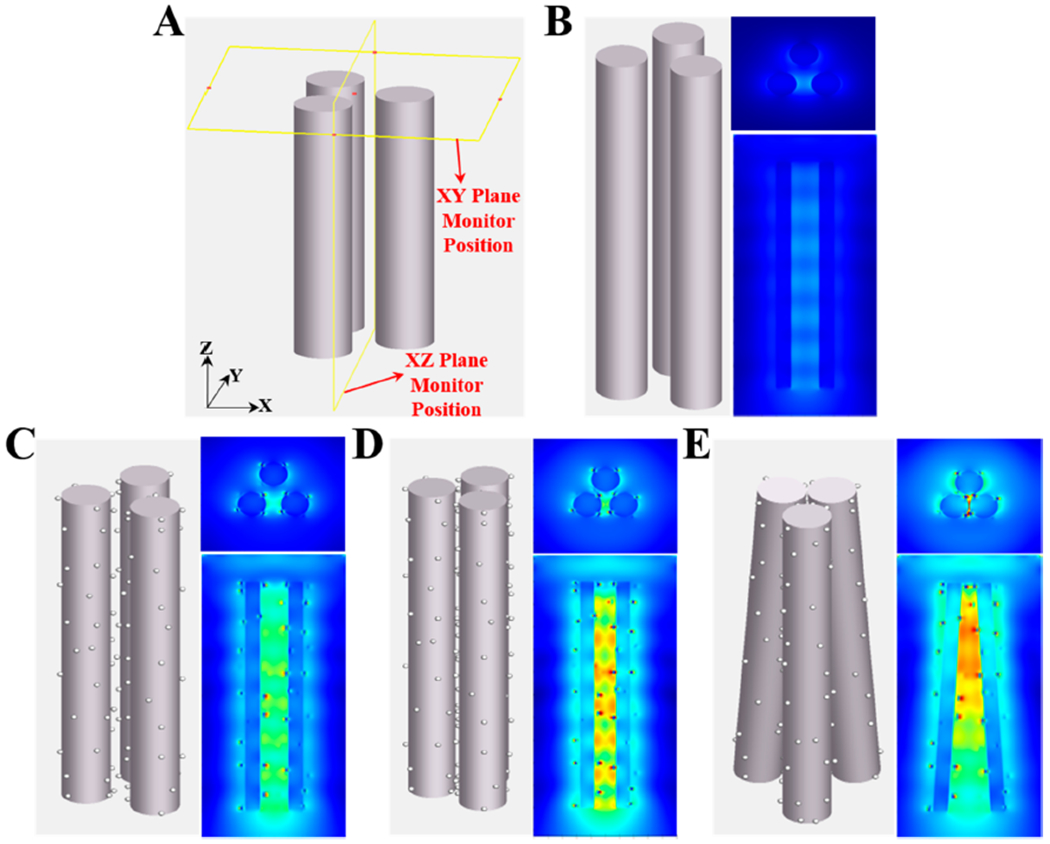
Electromagnetic field enhancement simulation of ZnO and ZnO–Ag nanorod structures using finite-difference time-domain (FDTD) method. (A) Schematic diagram showing the monitor positions in the simulation tests. The monitors are kept at the same positions in all cases for comparison. (B) Pristine ZnO nanorods showing limited electromagnetic field enhancement. (C) ZnO–Ag nanorods showing strong electromagnetic field enhancement. (D) ZnO–Ag nanorods which are closer together and show further magnified electromagnetic field enhancement. (E) Tilted ZnO–Ag nanorods showing dramatically enhanced electromagnetic field. (B) and (C) have a distance of 100 nm between nanorods, (D) has a distance of 50 nm between nanorods, while (E) rotates the axes of the rods for making their ends clustered together.
To examine the label-free SERS sensing performance of our ZnO–Ag capillary platform, different types of bioactive targets including human urine exosomes, DNA oligonucleotides, and E. coli bacteria were evaluated (Figure 7A). SERS measurement of exosomes was performed by using a Raman spectrophotometer after samples interacted with the ZnO–Ag capillary. As shown in Figure 7B, without the 3D ZnO–Ag plasmonic nanostructures, no observable SERS peaks were found from the exosome samples. However, many sharp peaks ranging from 600 to 1600 cm−1 were clearly observed from the ZnO–Ag capillary platform even at a quantity of ~104 exosomes. The detection limit can achieve as low as 100 exosomes, showing superior performance of such 3D ZnO–Ag structure over conventional sensing platforms (Table S1). This can be attributed to dramatically enhanced Raman scattering in the proximity of Ag nanoparticles enabled by the localized surface plasmon resonance. The major peaks appearing in the Raman spectra are located at 553 cm−1 (weak, protein), 645 cm−1 (weak, tyrosine), 750 cm−1 (medium, nucleic acid), 889 cm−1 (medium, tryptophan), ~ 1100 cm−1 (weak, nucleic acid, lipid), 1216 cm−1 (strong, tryptophan, phenylalanine), 1242 cm−1 (strong, lipid), 1286 cm−1 (strong, protein, lipid), ~ 1340 cm−1 (strong, phospholipid), 1402 cm−1 (weak, nucleic acid), 1460 cm−1 (medium, lipid), and 1566 cm−1 (weak, protein).59–62 As the peak assignment shows, these apparent peaks are mostly typical for lipids, amino acids, proteins, and nucleic acids, which are the main components of exosomes.
Figure 7.
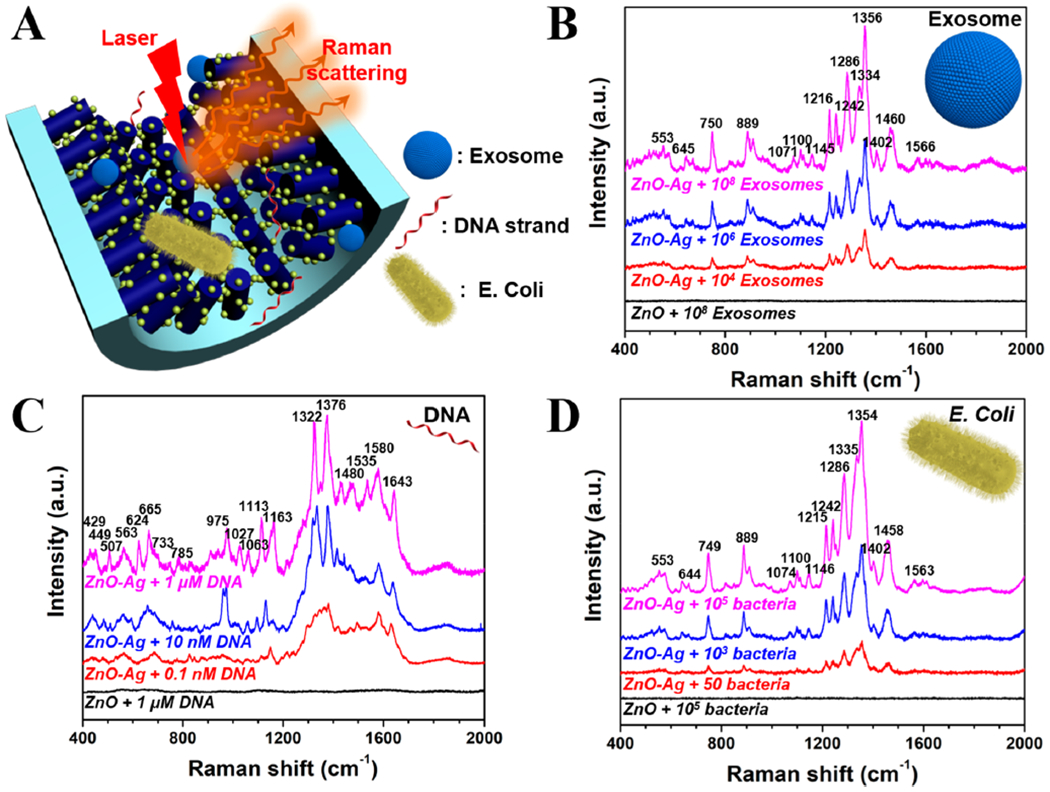
SERS sensing detection of exosomes, DNAs, and bacteria by ZnO–Ag glass capillary. (A) Schematic diagram showing the SERS sensing platform of ZnO–Ag capillary toward exosomes, nucleic acids, and bacteria (objects are not drawn to scale). (B) SERS spectra of human urine exosomes with numbers ranging from ~104 to ~108. The integration time is 15 s. (C) SERS spectra of ssDNA oligonucleotide with concentrations ranging from 0.1 nM to 1 μM. The integration time is 30 s. (D) SERS spectra of E. coli bacteria with numbers ranging from ~50 to ~105. The integration time is 5 s.
The SERS sensing performance of ZnO–Ag glass capillary toward nucleic acids was explored using ssDNA oligonucleotides with a random sequence of 16 bases (GGGAGTCAAGAACGAA). As shown in the spectra of Figure 7C, at a concentration range of 0.1 nM to 1 μM, three broad spectral regions of interest can be identified: 400–800, 800–1200, and 1200–2000 cm−1. According to the previous literature,63–65 the first spectral region includes the ring stretching bands of pyrimidine and purine residues, such as 429 cm−1 (weak, C + T), 449 cm−1 (weak, C), 507 cm−1 (weak, G), 563 cm−1 (weak, C), 624 cm−1 (weak, A), 665 cm−1 (weak, G), 733 cm−1 (weak, A), and 785 cm−1 (weak, C + T); the second spectral region mainly contains bands resulting from the deoxyribose-linked phosphodiester network, such as the symmetric stretching peaks of the phosphodioxy moiety (vPO2−) at around 1100 cm−1; the last region shows a complex pattern of many overlapping features created by mostly in-plane ring vibrations of the nucleobases, such as 1322 cm−1 (strong, G), 1376 cm−1 (strong, T), 1480 cm−1 (weak, A), 1535 cm−1 (medium, G), and 1580 cm−1 (medium, G + A), while the superimposition of carboxyl stretching was also observed at 1643 cm−1. In addition, the detection limit was determined to be 2.5 pM based on the signal-to-noise ratio (S/N = 3) as above, suggesting the great potential of such 3D ZnO–Ag nanostructures for label-free detection of biological molecules (Table S1).
Escherichia coli (E. coli) bacteria, a common cause of food poisoning cases that can also lead to some serious infections, were employed as a proof-of-concept target for bacteria sensing. As shown in Figure 7D, SERS peak positions of bacteria are in agreement with those previously reported and similar to exosomes because of their same chemical compositions, such as lipids, nucleic acids, and proteins.66–70 SERS peaks of E. coli with a number of as low as ~50 can be relatively readily recorded using our ZnO–Ag capillary platform and even single bacterial cell can be identified at a time (Table S1), indicating its great potential as sensitive point-of-care devices for pathogen detection. Altogether, these results suggest the superior performance of ZnO–Ag capillary toward label-free sensing and sensitive detection of bioactive targets with a broad size range from a few nanometers to over microns. Our acoustofluidic technique enables rapid, low-cost, and simple engineering of 3D functional plasmonic nanostructures, and it holds great promise for improving analysis techniques and advancing medical diagnosis.
CONCLUSIONS
In summary, we developed an acoustofluidic approach to engineer multifunctional 3D ZnO nanoarrays inside confined capillary microchannels. These devices can be utilized to enrich biological targets and perform label-free SERS sensing with high sensitivity. An acoustofluidic device that integrates an acoustic transducer with a sharp-edge acoustofluidic mixer was utilized to generate active fluid mixing for ensuring the uniform patterning of the nanostructures. The structural properties of well-defined 3D ZnO nanorod array including density, diameter, and length can be tuned during the seeding and growth stages to meet the design needs of specific applications. Due to significantly increased steric hindrance inside intrinsically enclosed capillary microchannels and enhanced electrostatic attraction/coordination interactions from large contact surface area, rapid and efficient enrichment of exosomes, proteins, and DNA oligonucleotides was achieved in a residence time-dependent manner. The selective retention capability of the ZnO nanoarray-coated capillary toward proteins was confirmed using SDS–PAGE analysis of human blood, and the reusability of the ZnO nanoarray-coated capillary was also demonstrated. In addition, acoustofluidic devices were employed to uniformly deposit Ag nanoparticles onto the 3D ZnO nanoarray. FDTD simulations were further used to validate the electromagnetic field distribution for optimizing the structural design of functional ZnO–Ag plasmonic patterns. The resultant ZnO–Ag glass capillary device exhibited highly sensitive SERS sensing performance toward exosomes, DNA oligonucleotides, and bacteria. These results not only provide insights into the engineering of functional materials with tunable properties but also demonstrate the utility of these advanced nanosystems in real-world bioanalytical applications.
MATERIALS AND METHODS
Materials and Reagents.
Zinc nitrate (Zn(NO3)2) hexahydrate, hexamethylenetetramine (HMTA), potassium permanganate (KMnO4), zinc acetate (Zn(OAc)2) dihydrate, sodium hydroxide (NaOH), sodium borohydride (NaBH4), 1H,1H,2H,2H-perfluorooctyl trichlorosilane (PFOCTS), silver nitrate (AgNO3), rhodamine B (RB), potassium chloride (KCl), bovine serum albumin (BSA), bovine hemoglobin (BH), LB broth, Coomassie brilliant blue R, 1-butanol, 200-proof ethanol, and acetic acid were purchased from Sigma-Aldrich. Round and square borosilicate hollow glass tubes with an inner diameter of ~500 μm were obtained from VitroCom. Polydimethylsiloxane (PDMS, Sylgard 184 kit) was purchased from Dow Corning. Acoustic transducer was obtained from PUI Audio (AB2720B-LW100-R). Biotin-TEG conjugated single-stranded DNA oligonucleotide with a random sequence of 16 bases, GGGAGTCAAGAACGAA, was provided by Bio-Synthesis. Human urine standard exosome product was purchased from BioVision. Human whole blood from a healthy donor was bought from ZenBio. FastCast acrylamide kit (12%), Tris/glycine/SDS buffer, and tricine sample buffer were obtained from Bio-Rad Laboratories. Fluorescent polystyrene beads with an average size of 1 μm were purchased from Bangs Laboratory. E. coli bacteria were obtained from American Tissue Culture Collection (ATCC; ATCC 8739). Water used was from a Milli-Q water ultrapure water purification system. All chemicals were used as received without any further purification.
Fabrication of Acoustofluidic Device.
The acoustofluidic device is composed of an acoustic transducer, a glass coverslip, and a single layer PDMS channel with four pairs of sharp-edge structures. Briefly, after designing the pattern with AutoCAD software, a film mask was obtained from CAD/Art Services to fabricate the master silicon mold using standard photolithography and deep ion etching. Followed by antisticking coating treatment with PFOCTS, a PDMS replica was then produced by pouring PDMS precursor (10:1 w/w ratio of base to curing agent) onto the silicone mold and degassed under vacuum for 30 min. After baking at 65 °C for 1 h, the PDMS cast was completely cured and carefully peeled off from the mold. Two inlets and one outlet of PDMS channel were punched using a 0.75 mm puncher and then bonded with the cover glass after oxygen plasma surface treatment. An acoustic transducer was finally bonded next to the PDMS using epoxy to make the acoustofluidic device used in this study.
Device Setup and Operation.
The acoustic transducer was driven by sinewave signals supplied from a function generator (AFG3011C, Tektronix, USA) with an applied voltage and frequency of 10 V and 4.3 kHz, respectively. The reagents were delivered to the inlets of PDMS microchannel by 1 mL syringes (BD Bioscience, NJ), which were independently operated by an external automated syringe pump (neMESYS, Cetoni, Germany). The mixing videos were recorded on the stage of an inverted microscope (Eclipse Ti-U, Nikon, Japan) and then processed with ImageJ software (NIH, Bethesda, MD) for making the stacked images.
Acoustofluidic Construction of ZnO Nanoarray-Coated Capillary.
A ZnO nanoarray inside glass capillary was engineered through a two-step seeding and growth acoustofluidic approach. The inner surface of the glass capillary was first activated using freshly prepared potassium permanganate (KMnO4, 5 mM, containing 50 μL 1-butanol per 20 mL solution) at 65 °C for 30 min, followed by extensively rinsing with water in an ultrasonic bath. The synthesis of ZnO seeds was realized simply with one inlet containing Zn(OAc)2 (5 mM in ethanol) and the other NaOH (10 mM in ethanol) with the same flow rate of 5 μL/min at room temperature. During the pumping operation, the acoustic transducer was driven with an applied voltage and frequency of 10 V and 4.3 kHz, respectively. In the case of 10 cm capillary in length, nearly 2 min operating time is enough to fully fill the capillary. After placed at 75 °C for 2 h, one seeding phase was finished and one might repeat the process for another. The seeded capillary was then transferred to the growth stage of ZnO nanoarray, where two previous solutions were replaced with aqueous solutions of Zn(NO3)2 (10–50 mM) and HMTA (10 mM) at a reaction temperature of 90 °C and all other operation parameters were the same as described above. When the reaction was complete at a given time, 3D ZnO-patterned capillary was cleaned with water and dried at 50 °C for future use.
Synthesis of ZnO–Ag Glass Capillary.
Ag nanoparticle-decorated ZnO nanoarray was realized by a direct reduction of AgNO3 with NaBH4 in an acoustofluidic setting based on ZnO nanoarray-coated capillary device with 30 min growth time. In brief, two inlet flows, one containing AgNO3 (2.5 mM in water) and the other NaBH4 (7.5 mM in water), were pumped into the sharp-edge device with an applied voltage, frequency, and flow rate of 10 V, 4.3 kHz, and 5 μL/min, respectively. After being continuously reacted for 30 min at room temperature, the capillary device was rinsed with water thoroughly to ensure complete removal of nitrate ions and unbound silver particles. The resultant black-colored capillary was dried at 50 °C for future use.
Material Characterization.
The structures of constructed 3D materials inside capillary microchannel were examined by scanning electron microscopy (SEM) on a Thermo Scientific Apreo SEM (glass capillaries were broken into 0.5–1 cm pieces before characterization). Transmission electron microscopy (TEM) was performed on FEI Tecnai G2 Twin TEM operating at an accelerating voltage of 180 kV. TEM sample was scratched from the inner wall of glass capillary for microstructure investigation. An EDS equipped on SEM was used to identify and quantify local composition distribution of the samples.
Enrichment of Exosomes Using ZnO Nanoarray-Coated Capillary.
Quantification of human urine exosomes before and after sample enrichment was realized using Nanosight LM10 nanoparticle tracking analysis (NTA, Malvern Panalytica) system. Round-shaped borosilicate hollow glass tubes with an inner diameter and length of ~500 μm and 10 cm, respectively, were chosen for construction of 3D ZnO nanoarray. Specifically, human urine exosomes were first diluted to a concentration at around 108 exosomes per milliliter before the enrichment tests. A 5 μL exosome sample was then injected into the capillary by a pipet to form a liquid plug. Pushing and pulling operations by an external automated syringe pump (neMESYS, Cetoni, Germany) at a flow rate of 80 μL/min was used to move the exosome liquid plug inside the capillary for sample enrichment. After a given residence time, the liquid plug was pumped out for enrichment efficiency measurement. The effect of 3D ZnO structures on the exosome enrichment efficiency was examined using different growth time of 15 min (ZnO-15), 45 min (ZnO-45), and 90 min (ZnO-90). The effect of residence time on the exosome enrichment efficiency was investigated at 15, 30, 45, 60, 90, 120, and 180 s since ZnO-90. NTA data were obtained as means and standard errors of means of five independent measurements.
Enrichment of Proteins Using ZnO Nanoarray-Coated Capillary.
Enrichment tests of proteins (BSA and BH) were carried out using a similar approach as mentioned above. In brief, 5 μL of protein sample (250 μg/mL) was injected into ZnO-90 to form a liquid plug. The movement of the protein liquid plug inside the capillary microchannel can be well controlled by the injection and withdraw modes of the automated syringe pump, which was used to adjust the residence time. Concentrations of proteins before and after sample enrichment were determined by the bicinchoninic (BCA) method using a BCA Protein Assay kit (Thermo Scientific) and a UV–vis spectrophotometer (Shimadzu UV-3600). The effect of the ionic strength of protein solution on the protein enrichment efficiency was examined using 0.1 M KCl. All tests were evaluated three times, and results were reported as means and standard deviations.
The selectivity of a 3D ZnO-modified glass capillary toward proteins was examined using human whole blood diluted 800 times. The residence time of blood sample in 0.1 M KCl was chosen as 30 and 120 s by pushing and pulling operations of the blood slug inside a ZnO nanoarray-coated capillary. Sodium dodecyl sulfate polyacrylamide gel electrophoresis (SDS–PAGE) and Coomassie brilliant blue staining were employed to analyze the samples before and after enrichment treatment. All samples were heated in tricine sample buffer at 95 °C for 10 min before the SDS–PAGE analysis.
Enrichment of Nucleic Acids Using ZnO Nanoarray-Coated Capillary.
Enrichment tests of single-stranded DNA (ssDNA) oligonucleotide with a random sequence of 16 bases (GGGAGTCAAGAACGAA) were performed in a similar way as above. Briefly, 5 μL of ssDNA sample (10 μM) was injected into ZnO-90 and then interacted at different residence times for enrichment. The concentrations of DNA samples before and after treatment were measured by NanoDrop microvolume spectrophotometer (Thermo Scientific). Tests were repeated three times to assess their reliability. In addition, after the initial enrichment test, ZnO nanoarray-coated capillary device was rinsed with water and then subjected to thermal treatment (350 °C, 45 min) for reusability investigation.
FDTD Simulation of Electromagnetic Field Enhancement.
The finite-difference time-domain (FDTD) method (Lumerical Inc., BC, Canada) was employed to simulate the electromagnetic field enhancement of 3D ZnO and Ag-decorated ZnO nanoarray. The 3D ZnO–Ag nanostructures were simplified as ZnO cylinders modified by spherical Ag nanoparticles. As revealed by SEM investigations, ZnO cylinders with a length of 2,200 nm and a diameter of 160 nm were used to imitate the ZnO nanorods. Ag nanoparticles with a diameter of 25 nm were randomly distributed on the ZnO rods for FDTD simulation. Three identical ZnO nanorods and Ag-decorated ZnO nanorods were separated by a certain distance to investigate the effect of intercylinder distance on the electromagnetic field distribution. A plane wave was used in the simulation model to illuminate the whole structure immersed in a water solution for reflecting the practical sensing conditions.
SERS Sensing Detection via ZnO–Ag Glass Capillary.
Human urine exosomes, ssDNA oligonucleotides, and E. coli bacteria were used to evaluate the SERS sensing performance of ZnO–Ag capillary. The analytes with desired concentrations (1 μL) were injected into the starting, middle, and ending positions of capillaries containing 3D ZnO–Ag nanostructures, respectively. Samples were kept in a liquid state and a static flow condition during SERS detection. The concentrations of exosomes, DNA oligonucleotide, and E. coli bacteria were determined by Nanosight NTA analysis, NanoDrop microvolume spectrophotometer, and hemocytometer, respectively. A Horiba Jobin Yvon LabRAM Aramis Raman spectrophotometer (HORIBA, Ltd., Tokyo, Japan) equipped with an Olympus BX41 microscope was used to collect Raman scattering spectra under an objective lens of 50×. A helium–neon (He–Ne) laser was used for excitation at 633 nm. The accumulation time was varied from 5 to 30 s to account for the differences in intensity levels of the analytes. SERS measurements were repeated three times at the starting, middle, and ending positions of capillaries and then averaged to obtain the spectra of analytes at different concentrations.
Supplementary Material
ACKNOWLEDGMENTS
The authors acknowledge support from the National Institutes of Health (Grant Nos. R01GM135486, UG3TR002978, and R43AG063643) and National Science Foundation (Grant No. ECCS-1807601). P.L. and Z.P. acknowledge financial support from the China Scholarship Council (CSC).
Footnotes
Supporting Information
The Supporting Information is available free of charge at https://pubs.acs.org/doi/10.1021/acsnano.0c02145.
Mixing time calculation; acoustofluidic operation parameters and setup optimization process; comparison of nanorod densities from different seeding phases (Figure S1); control tests in the absence of acoustic activation (Figure S2); comparison of particle diameters from different precursor concentrations of zinc nitrate (Figure S3); nanoarray fabrication in square hollow capillary (Figure S4); details of biological enrichment operations (Figure S5); comparison of the exosome enrichment efficiency of different ZnO nanoarray-coated capillary devices (Figure S6); comparison of enrichment efficiency of BSA and HB proteins with ZnO nanoarray-coated capillary (Figure S7); reusability test (Figure S8); control tests of ZnO–Ag (Figures S9–S11); illustration of FDTD electromagnetic field distribution (Figure S12); comparison of methods for biological target detection (Table S1) (PDF)
The authors declare the following competing financial interest(s): T.J.H. has co-founded a start-up company, Ascent Bio-Nano Technologies Inc., to commercialize technologies involving acoustofluidics and acoustic tweezers.
Contributor Information
Nanjing Hao, Department of Mechanical Engineering and Materials Science, Duke University, Durham, North Carolina 27708, United States.
Pengzhan Liu, Department of Mechanical Engineering and Materials Science, Duke University, Durham, North Carolina 27708, United States.
Hunter Bachman, Department of Mechanical Engineering and Materials Science, Duke University, Durham, North Carolina 27708, United States.
Zhichao Pei, Department of Mechanical Engineering and Materials Science, Duke University, Durham, North Carolina 27708, United States.
Peiran Zhang, Department of Mechanical Engineering and Materials Science, Duke University, Durham, North Carolina 27708, United States.
Joseph Rufo, Department of Mechanical Engineering and Materials Science, Duke University, Durham, North Carolina 27708, United States.
Zeyu Wang, Department of Mechanical Engineering and Materials Science, Duke University, Durham, North Carolina 27708, United States.
Shuaiguo Zhao, Department of Mechanical Engineering and Materials Science, Duke University, Durham, North Carolina 27708, United States.
Tony Jun Huang, Department of Mechanical Engineering and Materials Science, Duke University, Durham, North Carolina 27708, United States.
REFERENCES
- (1).Avci C; Imaz I; Carné-Sánchez A; Pariente JA; Tasios N; Pérez-Carvajal J; Alonso MI; Blanco A; Dijkstra M; López C; Maspoch D Self-Assembly of Polyhedral Metal—Organic Framework Particles into Three-Dimensional Ordered Superstructures. Nat. Chem 2018, 10, 78–84. [DOI] [PubMed] [Google Scholar]
- (2).Yu H; Chen X; Cai J; Ye D; Wu Y; Fan L; Liu P Novel Porous Three-Dimensional Nanofibrous Scaffolds for Accelerating Wound Healing. Chem. Eng. J 2019, 369, 253–262. [Google Scholar]
- (3).Cao X; Yin Z; Zhang H Three-Dimensional Graphene Materials: Preparation, Structures and Application in Supercapacitors. Energy Environ. Sci 2014, 7, 1850–1865. [Google Scholar]
- (4).Saleh MS; Hu C; Panat R Three-Dimensional Micro-architected Materials and Devices Using Nanoparticle Assembly by Pointwise Spatial Printing. Sci. Adv 2017, 3, No. e1601986. [DOI] [PMC free article] [PubMed] [Google Scholar]
- (5).Tavakkoli KG,A; Gotrik KW; Hannon AF; Alexander-Katz A; Ross CA; Berggren KK Templating Three-Dimensional Self-Assembled Structures in Bilayer Block Copolymer Films. Science 2012, 336, 1294–1298. [DOI] [PubMed] [Google Scholar]
- (6).Yang S; Megens M; Aizenberg J; Wiltzius P; Chaikin PM; Russel WB Creating Periodic Three-Dimensional Structures by Multibeam Interference of Visible Laser. Chem. Mater 2002, 14, 2831–2833. [Google Scholar]
- (7).Joseph J; Nair SV; Menon D Integrating Substrateless Electrospinning with Textile Technology for Creating Biodegradable Three-Dimensional Structures. Nano Lett. 2015, 15, 5420–5426. [DOI] [PubMed] [Google Scholar]
- (8).Geng X; Wu W; Li N; Sun W; Armstrong J; Al-Hilo A; Brozak M; Cui J; Chen T Three-Dimensional Structures of MoS2 Nanosheets with Ultrahigh Hydrogen Evolution Reaction in Water Reduction. Adv. Funct. Mater 2014, 24, 6123–6129. [Google Scholar]
- (9).Whitesides GM The Origins and the Future of Microfluidics. Nature 2006, 442, 368–373. [DOI] [PubMed] [Google Scholar]
- (10).Song Y; Hormes J; Kumar CS S. R. Microfluidic Synthesis of Nanomaterials. Small 2008, 4, 698–711. [DOI] [PubMed] [Google Scholar]
- (11).Dendukuri D; Doyle PS The Synthesis and Assembly of Polymeric Microparticles Using Microfluidics. Adv. Mater 2009, 21, 4071–4086. [Google Scholar]
- (12).Park J. Il; Saffari A; Kumar S; Günther A; Kumacheva E Microfluidic Synthesis of Polymer and Inorganic Particulate Materials. Annu. Rev. Mater. Res 2010, 40, 415–443. [Google Scholar]
- (13).Hao N; Nie Y; Zhang JXJ Microfluidic Synthesis of Functional Inorganic Micro-/Nanoparticles and Applications in Biomedical Engineering. Int. Mater. Rev 2018, 63, 461–487. [Google Scholar]
- (14).Lu M; Ozcelik A; Grigsby CL; Zhao Y; Guo F; Leong KW; Huang TJ Microfluidic Hydrodynamic Focusing for Synthesis of Nanomaterials. Nano Today 2016, H, 778–792. [DOI] [PMC free article] [PubMed] [Google Scholar]
- (15).Zhou X; Zhou X; Zheng B A Pneumatic Valve Controlled Microdevice for Bioanalysis. Biomicrofluidics 2013, 7, 054116. [DOI] [PMC free article] [PubMed] [Google Scholar]
- (16).Huang P; Zhao S; Bachman H; Nama N; Li Z; Chen C; Yang S; Wu M; Zhang SP; Huang TJ Acoustofluidic Synthesis of Particulate Nanomaterials. Adv. Sci 2019, 6, 1900913. [DOI] [PMC free article] [PubMed] [Google Scholar]
- (17).Marre S; Jensen KF Synthesis of Micro and Nanostructures in Microfluidic Systems. Chem. Soc. Rev 2010, 39, 1183–1202. [DOI] [PubMed] [Google Scholar]
- (18).Valencia PM; Farokhzad OC; Karnik R; Langer R Microfluidic Technologies for Accelerating the Clinical Translation of Nanoparticles. Nat. Nanotechnol 2012, 7, 623–629. [DOI] [PMC free article] [PubMed] [Google Scholar]
- (19).Elvira KS; Casadevall i Solvas X; Wootton RCR; de Mello AJ The Past, Present and Potential for Microfluidic Reactor Technology in Chemical Synthesis. Nat. Chem 2013, 5, 905–915. [DOI] [PubMed] [Google Scholar]
- (20).Hao N; Zhang JXJ Magnetic Nanotechnology for Circulating Tumor Biomarkers Screening: Rational Design, Microfluidics Integration and Applications. Biomicrofluidics 2019, 13, 051501. [Google Scholar]
- (21).Hao N; Nie Y; Zhang JXJ Microfluidics for Silica Biomaterials Synthesis: Opportunities and Challenges. Biomater. Sci 2019, 7, 2218–2240. [DOI] [PMC free article] [PubMed] [Google Scholar]
- (22).Pumera M Nanomaterials Meet Microfluidics. Chem. Commun 2011, 47, 5671–5680. [DOI] [PubMed] [Google Scholar]
- (23).Ren K; Zhou J; Wu H Materials for Microfluidic Chip Fabrication. Acc. Chem. Res 2013, 46, 2396–2406. [DOI] [PubMed] [Google Scholar]
- (24).Weigl BH; Wolfbeis OS Capillary Optical Sensors. Anal. Chem 1994, 66, 3323–3327. [Google Scholar]
- (25).Balakirev MY; Porte S; Vernaz-Gris M; Berger M; Arié J-P; Fouqué B; Chatelain F Photochemical Patterning of Biological Molecules inside a Glass Capillary. Anal. Chem 2005, 77, 5474–5479. [DOI] [PubMed] [Google Scholar]
- (26).Zhao D; He Z; Wang G; Wang H; Zhang Q; Li Y A Novel Efficient ZnO/Zn(OH)F Nanofiber Arrays-Based Versatile Microfluidic System for the Applications of Photocatalysis and Histidine-Rich Protein Separation. Sens. Actuators, B 2016, 229, 281–287. [Google Scholar]
- (27).Mastichiadis C; Niotis AE; Petrou PS; Kakabakos SE; Misiakos K Capillary-Based Immunoassays, Immunosensors and DNA Sensors – Steps towards Integration and Multi-Analysis. TrAC, Trends Anal. Chem 2008, 27, 771–784. [Google Scholar]
- (28).Zhao D; Wang G; He Z; Wang H; Zhang Q; Li Y Controllable Construction of Micro/Nanostructured NiO Arrays in Confined Microchannels via Microfluidic Chemical Fabrication for Highly Efficient and Specific Absorption of Abundant Proteins. J. Mater. Chem. B 2015, 3, 4272–4281. [DOI] [PubMed] [Google Scholar]
- (29).Liu Y; Chen S; Liu Q; Liu Z; Wei P Simple Method for Self-Referenced and Lable-Free Biosensing by Using a Capillary Sensing Element. Opt. Express 2017, 25, 11750. [DOI] [PubMed] [Google Scholar]
- (30).Hao N; Zhang M; Zhang JXJ Microfluidics for ZnO Micro-/Nanomaterials Development: Rational Design, Controllable Synthesis, and On-Chip Bioapplications. Biomater. Sci 2020, 8, 1783–1801. [DOI] [PMC free article] [PubMed] [Google Scholar]
- (31).Tian Z; Yang S; Huang P; Wang Z; Zhang P; Gu Y; Bachman H; Chen C; Wu M; Xie Y; Huang TJ Wavenumber-Spiral Acoustic Tweezers for Dynamic and Reconfigurable Manipulation of Particles and Cells. Sci. Adv 2019, 5, No. eaau6062. [DOI] [PMC free article] [PubMed] [Google Scholar]
- (32).Chen Y; Li S; Gu Y; Li P; Ding X; Wang L; McCoy J; Levine S; Huang TJ Continuous Enrichment of Low-Abundance Cell Samples Using Standing Surface Acoustic Waves (SSAW). Lab Chip 2014, 14, 924–930. [DOI] [PMC free article] [PubMed] [Google Scholar]
- (33).Wu M; Ozcelik A; Rufo J; Wang Z; Fang R; Huang TJ Acoustofluidic Separation of Cells and Particles. Microsys. Nanoeng 2019, 5, 32. [DOI] [PMC free article] [PubMed] [Google Scholar]
- (34).Ahmed D; Chan C; Lin S; Muddana H; Nama N; Benkovicc S; Huang TJ Tunable, Pulsatile Chemical Gradient Generation via Acoustically Driven Oscillating Bubbles. Lab Chip 2013, 13, 328–331. [DOI] [PMC free article] [PubMed] [Google Scholar]
- (35).Collins DJ; Neild A; Ai Y Highly Focused High-Frequency Travelling Surface Acoustic Waves (SAW) for Rapid Single-Particle Sorting. Lab Chip 2016, 16, 471–479. [DOI] [PubMed] [Google Scholar]
- (36).Yeo LY; Friend J R Surface Acoustic Wave Microfluidics. Annu. Rev. Fluid Mech 2014, 46, 379–406. [Google Scholar]
- (37).Wang Y; Zhang X; Wang A; Li X; Wang G; Zhao L Synthesis of ZnO Nanoparticles from Microemulsions in a Flow Type Microreactor. Chem. Eng. J 2014, 235, 191–197. [Google Scholar]
- (38).Hao N; Xu Z; Nie Y; Jin C; Closson AB; Zhang M; Zhang JXJ Microfluidics-Enabled Rational Design of ZnO Micro-/Nanoparticles with Enhanced Photocatalysis, Cytotoxicity, and Piezoelectric Properties. Chem. Eng. J 2019, 378, 122222. [DOI] [PMC free article] [PubMed] [Google Scholar]
- (39).Wu Z; Zhao D; Hou C; Liu L; Chen J; Huang H; Zhang Q; Duan Y; Li Y; Wang H Enhanced Immunofluorescence Detection of a Protein Marker Using a PAA Modified ZnO Nanorod Array-Based Microfluidic Device. Nanoscale 2018, 10, 17663–17670. [DOI] [PubMed] [Google Scholar]
- (40).Ko SH; Lee D; Kang HW; Nam KH; Yeo JY; Hong SJ; Grigoropoulos CP; Sung HJ Nanoforest of Hydrothermally Grown Hierarchical ZnO Nanowires for a High Efficiency Dye-Sensitized Solar Cell. Nano Lett. 2011, 11, 666–671. [DOI] [PubMed] [Google Scholar]
- (41).Wang Z; Huang P-H; Chen C; Bachman H; Zhao S; Yang S; Huang TJ Cell Lysis via Acoustically Oscillating Sharp Edges. Lab Chip 2019, 19, 4021–4032. [DOI] [PMC free article] [PubMed] [Google Scholar]
- (42).Nama N; Huang P-H; Huang TJ; Costanzo F Investigation of Micromixing by Acoustically Oscillated Sharp-Edges. Biomicrofluidics 2016, 10, 024124. [DOI] [PMC free article] [PubMed] [Google Scholar]
- (43).Huang P-H; Chan CY; Li P; Wang Y; Nama N; Bachman H; Huang TJ A Sharp-Edge-Based Acoustofluidic Chemical Signal Generator. Lab Chip 2018, 18, 1411–1421. [DOI] [PMC free article] [PubMed] [Google Scholar]
- (44).Kokotov M; Hodes G Reliable Chemical Bath Deposition of ZnO Films with Controllable Morphology from Ethanolamine-Based Solutions Using KMnO4 Substrate Activation. J. Mater. Chem 2009, 19, 3847–3854. [Google Scholar]
- (45).Mei GS; Menon PS; Hegde G ZnO for Performance Enhancement of Surface Plasmon Resonance Biosensor: A Review. Mater. Res. Express 2020, 7, 012003. [Google Scholar]
- (46).Krȩżel A; Maret W The Biological Inorganic Chemistry of Zinc Ions. Arch. Biochem. Biophys 2016, 611, 3–19. [DOI] [PMC free article] [PubMed] [Google Scholar]
- (47).Hao N; Zhang JXJ Microfluidic Screening of Circulating Tumor Biomarkers toward Liquid Biopsy. Sep. Purif. Rev 2018, 47, 19–48. [Google Scholar]
- (48).Cheng N; Du D; Wang X; Liu D; Xu W; Luo Y; Lin Y Recent Advances in Biosensors for Detecting Cancer-Derived Exosomes. Trends Biotechnol 2019, 37, 1236–1254. [DOI] [PubMed] [Google Scholar]
- (49).Zhang W; Chiang S; Li Z; Chen Q; Xia Y; Ouyang Z A Polymer Coating Transfer Enrichment Method for Direct Mass Spectrometry Analysis of Lipids in Biofluid Samples. Angew. Chem. Int. Ed 2019, 58, 6064–6069. [DOI] [PMC free article] [PubMed] [Google Scholar]
- (50).Wang Z; Wu H; Fine D; Schmulen J; Hu Y; Godin B; Zhang JXJ; Liu X Ciliated Micropillars for the Microfluidic-Based Isolation of Nanoscale Lipid Vesicles. Lab Chip 2013, 13, 2879–2882. [DOI] [PMC free article] [PubMed] [Google Scholar]
- (51).Li S; Gao Y; Chen X; Qin L; Cheng B; Wang S; Wang S; Zhao G; Liu K; Zhang N Highly Efficient Isolation and Release of Circulating Tumor Cells Based on Size-Dependent Filtration and Degradable ZnO Nanorods Substrate in a Wedge-Shaped Microfluidic Chip. Biomed. Microdevices 2017, 19, 93. [DOI] [PubMed] [Google Scholar]
- (52).Kratz F; Elsadek B Clinical Impact of Serum Proteins on Drug Delivery. J. Controlled Release 2012, 161, 429–445. [DOI] [PubMed] [Google Scholar]
- (53).Elmer J; Harris DR; Sun G; Palmer AF Purification of Hemoglobin by Tangential Flow Filtration with Diafiltration. Biotechnol. Prog 2009, 25, 1402–1410. [DOI] [PMC free article] [PubMed] [Google Scholar]
- (54).Karni M; Zidon D; Polak P; Zalevsky Z; Shefi O Thermal Degradation of DNA. DNA Cell Biol. 2013, 32, 298–301. [DOI] [PubMed] [Google Scholar]
- (55).Hao N; Nie Y; Xu Z; Zhang J Ultrafast Microfluidic Synthesis of Hierarchical Triangular Silver Core-Silica Shell Nanoplatelet toward Enhanced Cellular Internalization. J. Colloid Interface Sci 2019, 542, 370–378. [DOI] [PMC free article] [PubMed] [Google Scholar]
- (56).Zeng Z; Liu Y; Wei J Recent Advances in Surface-Enhanced Raman Spectroscopy (SERS): Finite-Difference Time-Domain (FDTD) Method for SERS and Sensing Applications. TrAC, Trends Anal. Chem 2016, 75, 162–173. [Google Scholar]
- (57).Lin R; Hu L; Wang J; Zhang W; Ruan S; Zeng Y-J Raman Scattering Enhancement of a Single ZnO Nanorod Decorated with Ag Nanoparticles: Synergies of Defects and Plasmons. Opt. Lett 2018, 43, 2244–2247. [DOI] [PubMed] [Google Scholar]
- (58).Xie Y; Yang S; Mao Z; Li P; Zhao C; Cohick Z; Huang P-H; Huang TJ In Situ Fabrication of 3D Ag@ZnO Nanostructures for Microfluidic Surface-Enhanced Raman Scattering Systems. ACS Nano 2014, 8, 12175–12184. [DOI] [PMC free article] [PubMed] [Google Scholar]
- (59).Lee C; Carney RP; Hazari S; Smith ZJ; Knudson A; Robertson CS; Lam KS; Wachsmann-Hogiu S 3D Plasmonic Nanobowl Platform for the Study of Exosomes in Solution. Nanoscale 2015, 7, 9290–9297. [DOI] [PMC free article] [PubMed] [Google Scholar]
- (60).Shin H; Jeong H; Park J; Hong S; Choi Y Correlation between Cancerous Exosomes and Protein Markers Based on Surface-Enhanced Raman Spectroscopy (SERS) and Principal Component Analysis (PCA). ACS Sens. 2018, 3, 2637–2643. [DOI] [PubMed] [Google Scholar]
- (61).Avella-Oliver M; Puchades R; Wachsmann-Hogiu S; Maquieira A Label-Free SERS Analysis of Proteins and Exosomes with Large-Scale Substrates from Recordable Compact Disks. Sens. Actuators, B 2017, 252, 657–662. [Google Scholar]
- (62).Yan Z; Dutta S; Liu Z; Yu X; Mesgarzadeh N; Ji F; Bitan G; Xie Y-H A Label-Free Platform for Identification of Exosomes from Different Sources. ACS Sens. 2019, 4, 488–497. [DOI] [PubMed] [Google Scholar]
- (63).Otto C; van den Tweel TJJ; de Mul FFM; Greve J Surface-Enhanced Raman Spectroscopy of DNA Bases. J. Raman Spectrosc 1986, 17, 289–298. [Google Scholar]
- (64).Morla-Folch J; Alvarez-Puebla RA; Guerrini L Direct Quantification of DNA Base Composition by Surface-Enhanced Raman Scattering Spectroscopy. J. Phys. Chem. Lett 2016, 7, 3037–3041. [DOI] [PubMed] [Google Scholar]
- (65).Coluccio ML; Gentile F; Das G; Perozziello G; Malara N; Alrasheed S; Candeloro P; Fabrizio E. Di. From Nucleotides to DNA Analysis by a SERS Substrate of a Self Similar Chain of Silver Nanospheres. J. Opt 2015, 17, 114021. [Google Scholar]
- (66).Schwarz M; Kloß S; Stöckel S; Pollok S; Holländer A; Cialla-May D; Weber K; Popp J Pioneering Particle-Based Strategy for Isolating Viable Bacteria from Multipart Soil Samples Compatible with Raman Spectroscopy. Anal. Bioanal Chem 2017, 409, 3779–3788. [DOI] [PubMed] [Google Scholar]
- (67).Jarvis RM; Goodacre R Characterisation and Identification of Bacteria Using SERS. Chem. Soc. Rev 2008, 37, 931. [DOI] [PubMed] [Google Scholar]
- (68).Sengupta A; Mujacic M; Davis EJ Detection of Bacteria by Surface-Enhanced Raman Spectroscopy. Anal. Bioanal. Chem 2006, 386, 1379–1386. [DOI] [PubMed] [Google Scholar]
- (69).Demirel MC; Kao P; Malvadkar N; Wang H; Gong X; Poss M; Allara DL Bio-Organism Sensing via Surface Enhanced Raman Spectroscopy on Controlled Metal/Polymer Nanostructured Substrates. Biointerphases 2009, 4, 35–41. [DOI] [PubMed] [Google Scholar]
- (70).Premasiri WR; Moir DT; Klempner MS; Krieger N; Jones G; Ziegler LD Characterization of the Surface Enhanced Raman Scattering (SERS) of Bacteria. J. Phys. Chem. B 2005, 109, 312–320. [DOI] [PubMed] [Google Scholar]
Associated Data
This section collects any data citations, data availability statements, or supplementary materials included in this article.