

Abstract
Background
Red blood cell (RBC) transfusions are associated with risks including immunological reactions and volume overload. Current guidelines suggest a restrictive transfusion strategy in most patients with sepsis but based on previous randomized controlled trials and observational studies, there are still uncertainties about the safety in giving low-grade RBC transfusions to patients with sepsis.
Methods
Critically ill patients with severe sepsis or septic shock admitted to a university hospital intensive care unit between 2007 and 2018 that received less or equal to 2 units of RBCs during the first 5 days of admission were propensity score matched to controls. Outcomes were 90- and 180-day mortality, highest acute kidney injury network (AKIN) score the first 10 days, days alive and free of organ support the first 28 days after admission to the intensive care unit and highest sequential organ failure assessment score (SOFA-max).
Results
Of 9490 admissions, 1347 were diagnosed with severe sepsis or septic shock. Propensity-score matching resulted in two well-matched groups with 237 patients in each. The annual inclusion rate in both groups was similar. The median hemoglobin level before RBC transfusion was 95 g/L (interquartile range 88–104) and the majority of the patients were transfused in first 2 days of admission. Low-grade RBC transfusion was associated with increased 90- and 180-day mortality with an absolute risk increase for death 9.3% (95% confidence interval: 0.6–18%, P = 0.032) and 11% (95% confidence interval: 1.7–19%, P = 0.018), respectively. Low-grade RBC transfusion also correlated with increased kidney, circulatory and respiratory failure and higher SOFA-max score.
Conclusions
Low-grade RBC transfusion during the first 5 days of admission was associated with increased mortality and morbidity in a liberal transfusion setting. The results support the current practice of a restrictive transfusion strategy in septic critically ill patients.
Keywords: Red blood cell transfusion, Blood transfusion, Severe sepsis, Septic shock, Circulatory failure, Respiratory failure, Renal failure, Critical care
Background
Critically ill patients with sepsis are frequently anemic. The underlying pathophysiology is multifactorial and includes production of inflammatory cytokines that increase hepcidin which reduces iron availability [1], dilution due to fluid therapy, and blood loss [2]. Red blood cell (RBC) transfusions to correct anemia can be life-saving but are also associated with a number of potential adverse effects which makes risk–benefit assessment challenging [3–5]. The adverse effects include infections, hemolytic reactions, transfusion-related acute lung injury (TRALI), pulmonary edema due to volume overload (transfusion-associated cardiac overload, TACO) and effects on the immune system with transfusion-related immunomodulation (TRIM) [6].
The clinical impact of the adverse effects on morbidity and mortality of transfusion of RBCs in sepsis has been investigated in randomized controlled trials (RCT) [7–9]. In the subgroup analyses of septic patients in the TRICC trail [7] and in the TRISS trail [8], a liberal RBC transfusion strategy (hemoglobin level > 90–100 g/L) did not confer a benefit as compared to a restrictive strategy (hemoglobin level > 70 g/L). However, in the TRICOP trial, performed in a cohort of septic oncology patients, a liberal transfusion strategy was associated with a lower 90-day mortality [9]. Furthermore, observational studies have also demonstrated positive effects of RBC transfusions. [10, 11].
Thus, these data are inconclusive and areas of uncertainty remain. In the RCTs, the time between admission and inclusion was 6 h or longer, which means that the effect of any RBC transfusion given early in the course of sepsis was not studied. Moreover, patients in the restrictive group received on average one unit of blood, meaning that the potential adverse effects of a low dose of RBC transfusion could not be assessed. Furthermore, a higher proportion of patients in the restrictive group discontinued the study which could have biased the results.
In an attempt to address some of these uncertainties, we propensity score-matched patients with severe sepsis or septic shock who received low-grade RBC transfusions any of the first 5 days after intensive care unit (ICU) admission to those who did not receive RBC transfusions and evaluated the effect on mortality and organ failure.
Methods
Data collection and study population
This study was approved by Swedish Ethical Review Authority in Lund, Sweden (registration numbers 2014/916 and 2018/866). All participants were offered an opt-out via advertisement in the local newspaper and the board waived the requirement for written informed consent. The manuscript was prepared according to the STROBE guidelines for observational studies [12].
All patients ≥ the age of 18 admitted to the 9-bed general ICU at Skåne University Hospital, Lund, Sweden between 2007 and 2018 with severe sepsis or septic shock according to the Sepsis-2 definition were eligible for inclusion [13]. For patients with multiple admissions with the diagnosis of severe sepsis or septic shock, only the first admission was included in the study. Day 0 started at admission and ended at 06:00. As described above, a condition with massive bleeding can affect outcome and patients who received high-grade RBC transfusion (> 670 ml [= more than 2 units]) during the first 5 days were, therefore, excluded. RBC transfusions were given at the discretion of the treating physician but in local guidelines, it was recommended to keep hemoglobin level above 100 g/L in critically ill patients with severe sepsis or septic shock.
Mortality data were extracted from the Swedish intensive care quality register PASIVA (Otimo Data AB, Kalmar, Sweden). Physiological and laboratory data and pre-existing conditions (age, gender, chronic obstructive pulmonary disease (COPD), renal failure, diabetes), outcome variables (except mortality) and fluid administration data were collected from raw data, i.e., from the electronic master chart system of the hospital (Melior, Cerner, N. Kansas City, MO, USA), or from the patient data management system at the ICU (Intellispace critical care and anaesthesia (ICCA), Philips, Amsterdam, the Netherlands).
Outcome variables
Mortality was assessed at 90 and 180 days after ICU admission. Organ support was assessed by calculating days alive and free (DAF) of organ support for the first 28 days after admission to the ICU [14]. For patients who died in the ICU, we counted the days without the specified organ support before death. Organ support measures were vasopressors for circulatory failure, mechanical invasive ventilation for respiratory failure and renal replacement therapy (RRT) for kidney failure. To further assess organ failure, the maximum sequential organ failure assessment (SOFA) score during the first 28 days after admission was analyzed. Kidney failure was also evaluated according to the acute kidney injury network (AKIN) scoring system [15]. The maximal AKIN score the first 10 days after ICU admission was used for analysis.
Statistics
Patients receiving low-grade RBC transfusion during the first 5 days of ICU admission were propensity score matched with non-transfused patients to adjust for differences in baseline variables associated with outcome. The propensity score was calculated with linear logistic regression using a one-to-many macro for SAS [Parsons 2004] with the covariates specified in Table 1. Physiological and laboratory variables used in the propensity score matching were collected within 90 min of admission to the ICU. Note that the hemoglobin value at admission was not included in the matching in the primary analysis. In a secondary sensitivity analysis, the median hemoglobin value day 0 was included in the matching. A greedy matching procedure in both the primary and secondary analyses matched treated to controls at a ratio of 1:1. In a first step, a match was sought with a propensity score that was identical to 8 decimal places to the treated patient. If no match was found, a match would be sought at 7 decimal places and so on. If no match was found at one decimal place, the patient receiving RBC transfusion was excluded from the study. A control could only be used once. A standardized difference of < 10% has previously been suggested to indicate negligible differences in the mean or prevalence of covariates between groups [16, 17].
Table 1.
Patient demographics before and after propensity matching
| Unmatched groups | Standardized difference | P value | Propensity-matched groups | Standardized difference | P value | |||
|---|---|---|---|---|---|---|---|---|
| Control N = 405 | RBCaN = 459 | Control N = 237 | RBC N = 237 | |||||
| Pre-existing conditions | ||||||||
| Age, mean (SDb) | 64 (16) | 65 (15) | 0.047 | 0.490 | 65 (15) | 65 (15) | 0.010 | 0.914 |
| Male gender, no (%) | 233 (57) | 234 (51) | 0.131 | 0.054 | 130 (55) | 138 (58) | 0.068 | 0.460 |
| Blood malignancyc, no (%) | 16 (4.4) | 42 (9.2) | 0.187 | 0.007 | 12 (5.1) | 14 (5.9) | 0.037 | 0.687 |
| COPDd, no (%) | 42 (10) (0.305) | 52 (11) | 0.030 | 0.652 | 29 (12) | 28 (12) | 0.013 | 0.888 |
| Cirrhosis, no (%) | 17 (4.2) | 12 (2.6) | 0.087 | 0.198 | 11 (4.6) | 8 (3.4) | 0.065 | 0.483 |
| Immunosuppressione, no (%) | 30 (7.4) | 54 (12) | 0.148 | 0.031 | 18 (7.6) | 19 (8.0) | 0.016 | 0.864 |
| Malignancyf, no (%) | 43 (11) | 73 (16) | 0.156 | 0.023 | 31 (13) | 33 (14) | 0.025 | 0.789 |
| Nosocomial infectiong, no (%) | 33 (8.1) | 44 (9.6) | 0.051 | 0.460 | 21 (8.9) | 24 (10) | 0.043 | 0.639 |
| Airway infection, no (%) | 112 (28) | 116 (25) | 0.054 | 0.428 | 63 (27) | 63 (27 | 0 | 1.000 |
| Surgeryh, no (%) | 64 (16) | 99 (22) | 0.148 | 0.031 | 40 (17) | 48 (20) | 0.087 | 0.346 |
| GIi-bleeding, no (%) | 0 (0) | 6 (1.3) | 0.163 | 0.021 | 0 (0) | 0 (0) | 0.000 | 1.000 |
| DICj, no (%) | 25 (6.2) | 33 (7.2) | 0.041 | 0.552 | 19 (8.0) | 14 (5.9) | 0.083 | 0.368 |
| I.C.k volume effect, no (%) | 2 (0.5) | 4 (0.9) | 0.046 | 0.505 | 2 (0.8) | 2 (0.8) | 0 | 1.000 |
| Physiological and laboratory variables at admissionl, mean (SD) | ||||||||
| Heart rate, mean (SD) | 107 (23) | 109 (24) | 0.085 | 0.216 | 106 (23) | 106 (25) | 0.013 | 0.889 |
| SBPm, (mmHg) | 108 (30) | 107 (29) | 0.052 | 0.450 | 107 (30) | 108 (31) | 0.044 | 0.634 |
| Lactate (mmol/L) | 3.4 (3.2) | 3.5 (2.7) | 0.027 | 0.691 | 3.4 (3.2) | 3.4 (2.7) | 0 | 0.996 |
| Norepinephrine (µg/min) | 7.0 (12) | 11.6 (20) | 0.285 | < 0.001 | 9.0 (13) | 7.7 (11) | 0.108 | 0.241 |
| Temperature (°Celcius) | 37.4 (1.5) | 37.4 (1.4) | 0.035 | 0.617 | 37.3 (1.5) | 37.3 (1.4) | 0.007 | 0.940 |
| PaO2/FiO2 (kPa) | 23 (15) | 22 (16) | 0.040 | 0.588 | 23 (15) | 22 (15) | 0.040 | 0.665 |
| Leucocytes (× 109/L) | 16 (18) | 14 (19) | 0.093 | 0.197 | 16 (20) | 15 (20) | 0.038 | 0.683 |
| Platelets (× 109/L) | 188 (130) | 182 (135) | 0.044 | 0.517 | 187 (129) | 185 (120) | 0.018 | 0.845 |
| pH | 7.13 (1.5) | 7.31 (0.50) | 0.261 | <0.001 | 7.34 (0.12) | 7.34 (0.11) | 0.042 | 0.647 |
| Bilirubin (µmol/L) | 24 (35) | 25 (46) | 0.010 | 0.891 | 24 (33) | 26 (50) | 0.053 | 0.561 |
| Creatinine (µmol/L) | 172 (126) | 180 (141) | 0.063 | 0.360 | 181(130) | 175 (133) | 0.042 | 0.645 |
| PT/INRn | 1.58 (0.85) | 1.62 (0.82) | 0.040 | 0.550 | 1.58 (0.70) | 1.59 (0.78) | 0.005 | 0.956 |
| APTTo (sec) | 42 (19) | 45 (17) | 0.178 | 0.009 | 43 (18) | 42 (14) | 0.050 | 0.586 |
aLow-grade red blood cell transfusion defined as < 670 ml any of the first 5 days
bStandard deviation
cLymphoma, acute leukaemia or myeloma
dChronic obstructive pulmonary disease
eChronic steroid treatment correlative to ≥ 0.3 mg/kg prednisolone/day, radiation, or chemo therapy
fCancer spread beyond the regional lymph nodes
gInfection that developed after ≥ 48 h in hospital or secondary to surgical or medical procedure
hBefore admission to intensive care
iGastro-intestinal
jDisseminated intravascular coagulopathy
kIntra-cranial
lFirst value within 90 min after admission except for “Norepinephrine” which is the mean dose the first 12 h
mSystolic blood pressure
nProthrombin time
oActivated partial thromboplastin time
Sample size was based on the number of available patients during the study period. Variables were summarized using mean or median with standard deviation or range as distribution measurement. The propensity score matching was performed using SAS version 9.4 (SAS Institute Inc., Cary, NC, USA) prior to any comparison between the groups. Kaplan–Meier survival analysis was performed and is presented in graphs with corresponding stratified log-rank test. In accordance with the previous recommendations [18] comparisons between the groups after propensity score matching was performed with paired hypothesis testing using SPSS Statistics version 24 (SPSS Inc., Chicago, Ill., USA). A two-sided P value of less than 0.05 was considered to indicate statistical significance. Continuous variables are presented as median (interquartile range) and all categorical variables are presented as numbers (percentage).
Results
Study population and propensity score match
Of 9490 ICU admissions 1347 were diagnosed with severe sepsis or septic shock. After elimination of multiple admissions, age < 18 and patients who received high-grade transfusion, 864 patients were included. The propensity score match of these patients resulted in 237 patients in the RBC group and 237 patients in the control group (Fig. 1). The rate of inclusion per year in respective group is illustrated in Additional file 1. Baseline values including comorbidity, special treatments, vital signs and laboratory results at admission in the unmatched and matched study population are summarized in Tables 1 and 2. Matching reduced standardized difference between the groups in baseline characteristics to less than 10% for all variables except norepinephrine. For baseline variables not included in the matching, differences between the groups were eliminated after the matching for all variables except for “Reason for admission, Gastric”, Table 2.
Fig. 1.
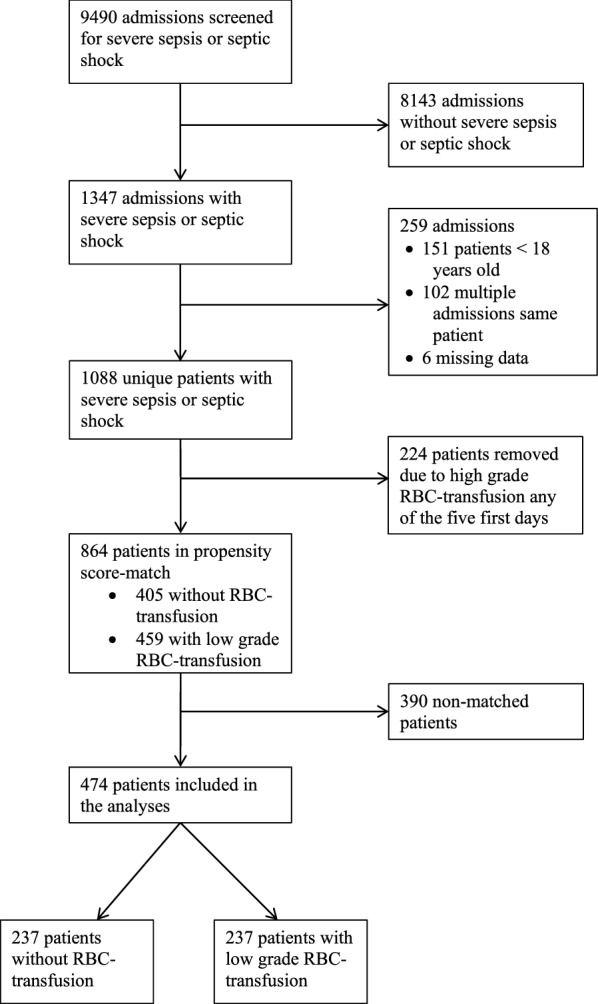
Consort diagram
Table 2.
Unmatched baseline characteristics
| Unmatched groups | Propensity-matched groups | |||||
|---|---|---|---|---|---|---|
| Controls, n = 405 | RBCa, n = 459 | P-valueb | Controls, n = 237 | RBC, n = 237 | P valuec | |
| SAPS 3d, median (IQRe) | 66 (58–77) | 71 (62–81) | < 0.001 | 69 (60–80) | 69 (59–79) | N.S. |
| First SOFAf | 8 (5–10) | 9 (6–11) | < 0.001 | 8 (5–11) | 8 (5–10) | N.S. |
| Days before ICUg | 0 (0–2) | 1 (0–5) | < 0.001 | 0 (0–2) | 1 (0–3) | N.S. |
| Reasons for admissionh, n (%) | ||||||
| CNSi | 91 (22) | 92 (20) | N.S. | 58 (25) | 57 (24) | N.S. |
| Hematologic | 39 (9.6) | 64 (14) | N.S. | 26 (11) | 27 (11) | N.S. |
| Gastric | 88 (22) | 148 (32) | < 0.001 | 51 (21) | 74 (31) | 0.02 |
| Metabolic | 82 (20) | 95 (21) | N.S. | 53 (22) | 51 (21) | N.S. |
| Respiratory | 188 (146) | 239 (52) | N.S | 111 (47) | 130 (55) | N.S. |
| Cardiovascular | 67 (17) | 75 (16) | N.S. | 35 (15) | 41 (17) | N.S. |
| Hepatic | 29 (7.2) | 43 (9.4) | N.S. | 22 (9.3) | 22 (9.3) | N.S. |
| Renal | 138 (34) | 160 (35) | N.S. | 89 (38) | 93 (39) | N.S. |
| Other | 42 (10) | 34 (7.4) | N.S. | 24 (10) | 26 (11) | N.S. |
| Arrival route n (%) | ||||||
| Emergency department | 115 (28) | 93 (20) | 0.007 | 64 (27) | 54 (23) | N.S. |
| General ward | 199 (49) | 232 (51) | N.S. | 128 (54) | 120 (51) | N.S. |
| Intermediate care | 7 (1.7) | 19 (4.1) | 0.046 | 3 (1.3) | 11 (4.6) | N.S. |
| Operation | 30 (7.4) | 37 (8.0) | N.S. | 21 (8.9) | 22 (9.2) | N.S. |
| Other ICU | 39 (9.6) | 48 (10) | N.S. | 20 (8.4) | 29 (12) | N.S. |
| Other arrival route | 15 (3.7) | 30 (6.5) | N.S. | 1 (0.42) | 1 (0.42) | N.S. |
aRed blood cell transfusion
bMann–Whitney or Chi-2 test
cWilcoxon rank sum or McNemar´s test
dSimplified acute physiology score 3
eInterquartile range
fSequential organ failure assessment
gDays on hospital before admission to the intensive care unit
hPatients may have more than one reason for admission
iCentral nervous system
All RBC transfusions were leucoreduced. Median hemoglobin level in the RBC group immediately before RBC transfusion was 95 g/L (88–104). Immediately after the RBC transfusion, the median hemoglobin level was 101 g/L (93–109). The median hemoglobin level on day 0 was 103 g/L (95–108) for the RBC group and 117 g/L (104–131) for the control group (P < 0.001). Daily hemoglobin levels during the first 5 days of ICU admission in both groups are shown in Fig. 2. The median volume of RBC transfusion in the RBC group the first five days after admission was 177 ml/day (110–291). The majority of patients were transfused during the first 2 days of admission (Fig. 3).
Fig. 2.
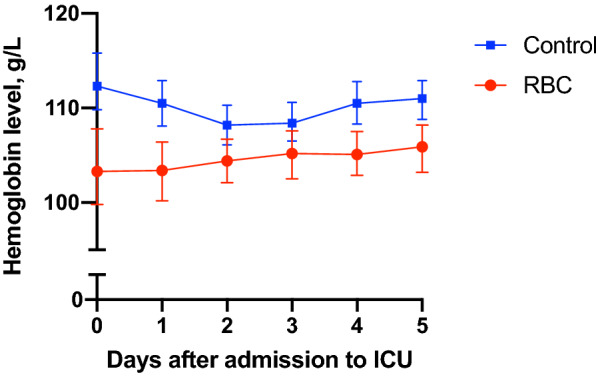
Median hemoglobin level with interquartile range. RBC = group with patients who received red blood cell transfusion any of the first 5 days
Fig. 3.
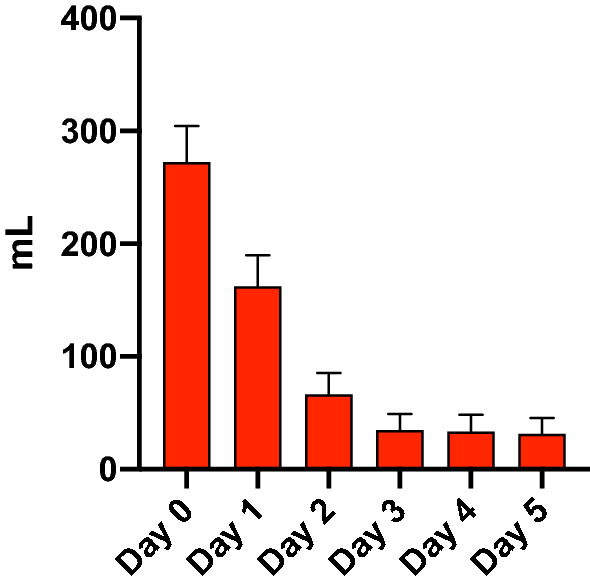
Mean red blood cell transfusion per day with 95% confidence interval in the RBC group. RBC = group
Outcomes
Detailed results of the outcome measures are presented in Table 3. In summary, mortality for patients in the RBC group was higher at 90 and 180 days compared to patients in the control group (Table 3 and Fig. 4). The absolute risk increase for death at 180 days for patients in the RBC group was 11% (95% CI 1.7–19%); (P = 0.018). The AKIN max was higher in the RBC group and patients in the RBC group were more likely to receive RRT, compared to patients in the control group. There was no difference in DAF of RRT between the groups. DAF of vasopressors and mechanical ventilation was lower in the RBC group than in the control group, indicating more pronounced circulatory and respiratory failure in the RBC group. Patients in the RBC group demonstrated a higher median SOFA-max score than patients in the control group.
Table 3.
Main outcome variables
| Outcome | Propensity-matched groups | Relative risk (95% CIa) | Absolute risk increase (95% CI) | Pb | |
|---|---|---|---|---|---|
| Control n = 237 | RBCcn = 237 | ||||
| 90-day mortality | 80 (34) | 102 (43) | 1.28 (1.01–1.61) | 9.3% (0.6–18%) | 0.032 |
| 180-day mortality | 91 (38) | 116 (49) | 1.27 (1.04–1.57) | 11% (1.7–19%) | 0.018 |
| RRTd | 21 (8.9) | 48 (20) | 2.29 (1.41–3.69) | 11% (5.1–18%) | 0.001 |
| AKIN | 0 (0–2) | 0 (0–3) | 0.001 | ||
| DAFe of RRT | 28 (16–28) | 28 (9–28) | 0.29 | ||
| DAF of vasopressors | 26 (13–27) | 23 (7–26) | 0.009 | ||
| DAF of mechanical ventilation | 26 (12–28) | 21 (4–27) | 0.002 | ||
| SOFA maxf | 9 (7–12) | 11 (8–13) | < 0.001 | ||
Data are presented as number (%) or median (interquartile range)
aConfidence interval
bWilcoxon rank sum or McNemar´s test
cLow-grade red blood cell transfusion defined as < 670 ml any of the first 5 days
dRenal Replacement Therapy
eDays Alive and Free
fSequential Organ Failure Assessment score the first 10 days after admission
Fig. 4.

Kaplan–Meier curves of 180-day survival in the control group (blue line) and the RBC group (red line) (P = 0.046, stratified log-rank test). RBC = group with patients who received red blood cell transfusion any of the first 5 days
Fluids and RBC transfusion
During the first 5 days of ICU stay, there was no difference in crystalloid or colloid administration or total fluid balance between the two groups (Table 4). Patients in the RBC group received more total fluids and produced more urine the first 5 days compared to the control group.
Table 4.
Fluid therapy, first 5 days
| Fluids per day | Propensity score-matched groups | Pb | |||
|---|---|---|---|---|---|
| Control, n = 237 | RBCa, n = 237 | ||||
| Median | IQRc | Mediann | IQR | ||
| Colloidsd (ml) | 342 | 100–688 | 357 | 206–621 | 0.939 |
| Crystalloidse (ml) | 1200 | 482–2547 | 1120 | 500–2015 | 0.082 |
| Fluids in, totalf (ml) | 3495 | 2301–4557 | 3920 | 3127–4963 | < 0.001 |
| Urine output (ml) | 1916 | 429–2772 | 2295 | 906–3134 | 0.005 |
| Total fluid balanceg (ml) | 544 | 0–2066 | 645 | − 100 to 1568 | 0.765 |
| RBC transfusion (ml) | 0 | 0–0 | 177 | 110–291 | < 0.001 |
For patients with ICU stay < 5 days, the mean per day was calculated for the length of stay
aLow-grade red blood cell transfusion defined as < 670 ml (< 2 units) any of the first 5 days
bWilcoxon rank sum test
cInterquartile range
dDefined as albumin (200 mg/ml), albumin (5 mg/ml), dextran 70 (60 mg/ml) and hydroxyethyl starch (200/0.5 and 130/0.4)
eCrystalloids represents the sum of NaCl 9 mg/ml and Ringer´s Acetate
fFluids in, total represents the sum of all enteral and parenteral administered fluids but not RBC transfusions
gInsensible perspiration and RBC transfusions not included
Sensitivity analysis
The sensitivity analysis was performed to investigate any effects of hemoglobin level at admission on the outcomes. This was done by including the median hemoglobin level the admission day in the matching protocol. In this analysis, the starting point was the same original population of 864 patients with severe sepsis or septic shock as in the main analysis (Fig. 1). The propensity score matching resulted in 116 patients in the control group and 116 patients in the RBC group. The matching was good with < 10% standardized difference in all variables except 3 (systolic blood pressure, platelets and creatinine) (Additional file 2). Median hemoglobin level in the RBC group immediately before RBC transfusion was 95 g/L (88–103). The median hemoglobin level day 0 was 107 g/L (105–110) for the RBC group and 106 g/L (102–111) for the control group. For hemoglobin levels the first 5 days in both groups please see Fig. 5. The differences between groups were essentially unchanged compared to the primary analyses (Additional file 3).
Fig. 5.
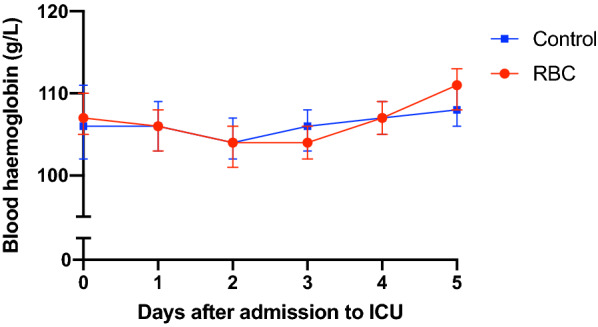
Median hemoglobin level with interquartile range in the sensitivity analysis that included hemoglobin level day 0 in the matching. RBC = group with patients who received red blood cell transfusion any of the first 5 days
Discussion
In the present study, low-grade leukoreduced RBC transfusion in critically ill septic patients was associated with increased mortality, increased kidney, circulatory and respiratory failure as well as higher SOFA-max score.
With the propensity score matching, we aimed to create the RBC and the control groups as similar as possible with respect to severity of illness at ICU admission. Because a low hemoglobin at admission may be a result of an underlying condition which may influence outcome independent of RBC transfusions, we performed a sensitivity analysis in which hemoglobin concentration at admission was included in the propensity score matching. Although the results of this analysis are slightly less robust due to the lower number of matched patients and hence lower power, the results were very similar. Further, pre-matching differences between the groups in baseline variables not included in the propensity score matching were erased after the matching for all variables except for “Gastric reason for admission” (Table 2). Taken together, this supports the robustness in the propensity score matching and in the findings in the main analysis.
The observed hemoglobin level of 95 g/L before transfusion may appear high given that current guidelines suggest a transfusion trigger of 70 g/L in the absence of ongoing ischemia. As mentioned above, the present study was performed in an institution with a liberal tradition of RBC transfusions and before the publication of the TRISS trial a transfusion trigger of 100 g/L was accepted in hemodynamically unstable patients with sepsis. After 2014, a more restrictive approach was implemented and the observed hemoglobin level before transfusion, therefore, reflects this change of practice.
In contrast to our results, two randomized trials comparing liberal (hemoglobin level goal > 90–100 g/L) vs restrictive (> 70 g/L) transfusion strategy in critically ill patients with sepsis or septic shock did not detect a difference in mortality or need for vasopressors, mechanical ventilation or RRT between the treatment strategies [7, 8]. It should be noted that previous RCTs on different hemoglobin thresholds for RBC transfusions did not study the possible negative effects of RBC transfusions but rather the effects of different thresholds for RBC transfusions [7–9]. This means that also patients in the low threshold group received a significant number of RBC units. In contrary, the present study included a control group with patients who did not receive any RBC transfusions at all during the study period. Thus, when evaluating if RBC transfusions are harmful, independent of hemoglobin levels within a safe interval, observational studies like the present may have some benefits. Our result demonstrated that the majority of RBCs were administered within the first days after ICU admission. Interestingly, the largest RCT on transfusion thresholds in septic shock to date, the TRISS trial, included patients on average 22 h after admission and could not demonstrate a difference between a low and high transfusion trigger [8]. This raises the possibility that the effect of transfusions on outcome could be time dependent, in the sense that the early RBC transfusions given to septic patients might be the transfusions with highest risk.
As mentioned above, previous observational studies on the effect of RBC transfusions in sepsis have reported a decrease in mortality [10, 11]. In contrast to our study, these studies did not exclude patients receiving massive transfusions. Because massive transfusions indicate active bleeding, a condition in which the risk–benefit ratio may favor transfusion, it is possible that this difference in study design may explain the difference in results. Moreover, the average transfused patients in both of these studies were transfused at hemoglobin of 75–80 g/L which could contribute to the difference in results.
What is the potential pathophysiological mechanism of the observed increased mortality and morbidity after RBC low-grade transfusions in our study? As mentioned above, known adverse effects of RBC transfusion include TACO, TRALI and TRIM, all of which may cause negative effects in many organs [6]. Although patients in the RBC group received more fluids the first 5 days, the fluid balance was not different between the groups, which would indicate that fluid overload (TACO) was not the reason for the differences in outcome. The incidence of TRALI is previously estimated to be about one case per 12 000 transfusions [19]. Given that TRALI most commonly occurs after plasma transfusion and that no episodes of TRALI presentation were reported for included patients we believe that it is unlikely to the main cause of the differences between the groups even if underreported. TRIM represents an interaction of a multitude of immunomodulatory mediators in the RBC transfusion with the immune system, leading to both proinflammatory and immunosuppressive effects [20]. In the setting of sepsis, such effects may be deleterious and represents a potential mechanism by which RBCs may adversely affect outcome.
Limitations
We recognize the limitations in the present study due to its retrospective nature. Although baseline values were carefully adjusted for severity of illness, the presence of undetected factors of relevance for outcome such as differences in comorbidities cannot be ruled out. Further, the study was done at a single department which limits the external validity. The risk–benefit ratio for transfusions is likely to be dependent on the Hb level at which RBC are transfused. Thus, it is important to emphasize that the results may only be valid for the transfusion level observed in our cohort and may not be generalized to other transfusion triggers.
Although there is evidence for the safety of a restrictive transfusion strategy in sepsis, we still lack knowledge of safety in certain sub-populations such as septic patients with myocardial ischemia, severe hypoxemia or acute hemorrhage. Furthermore, the potentially harmful effects of RBC transfusion on morbidity and long-term mortality warrants further evaluation including, e.g., individualized therapy and methods of preventing or treating anemia without RBC transfusion.
Conclusion
In conclusion, this propensity score-matched study of patients with severe sepsis and septic shock with low-grade or no RBC transfusion indicates increased morbidity and long-term mortality of RBC transfusion in a liberal transfusion setting. These findings support the current Surviving sepsis campaign guidelines of restrictive transfusion strategy [21].
Supplementary information
Additional file 1: Number of inclusions per year in the control and RBC group.
Additional file 2: Table of patient demographics before and after propensity matching, sensitivity analysis.
Additional file 3: Table of main outcome variables, sensitivity analysis.
Acknowledgements
We would like to thank intensive care nurse Ann Svensson Gustafsson and computer technician Jan Karlsson for invaluable help with data extraction from the patient data management system.
Abbreviations
- AKIN
Acute kidney injury network
- DAF
Days alive and free
- ICU
Intensive care unit
- RBC
Red blood cell
- RCT
Randomized controlled trials
- RRT
Renal replacement therapy
- TACO
Transfusion-associated cardiac overload
- TRALI
Transfusion-related acute lung injury
- TRIM
Transfusion-related immunomodulation
Authors’ contributions
TK designed the study. TK built the database. CUN wrote the first version of the manuscript. TK and PB performed the first revision of the manuscript. FH and TK performed the statistical analyses. All authors contributed to the interpretation of the data, revised the manuscript critically, and gave final approval of the version to be published. All authors read and approved the final manuscript.
Funding
Open access funding provided by Lund University. Department funding only.
Availability of data and materials
The datasets used and/or analyzed in the current study are available from the corresponding author on reasonable request.
Ethics approval and consent to participate
This study was approved by Swedish Ethical Review Authority in Lund, Sweden (registration numbers 2014/916 and 2018/866). All participants were offered an opt-out via advertisement in the local newspaper and the board waived the requirement for written informed consent.
Consent for publication
Not applicable.
Competing interests
The authors declare that they have no competing interests.
Footnotes
Publisher's Note
Springer Nature remains neutral with regard to jurisdictional claims in published maps and institutional affiliations.
Supplementary information
Supplementary information accompanies this paper at 10.1186/s13613-020-00727-y.
References
- 1.Loftus TJ, Mira JC, Stortz JA, Ozrazgat-Baslanti T, Ghita GL, Wang Z, et al. Persistent inflammation and anemia among critically ill septic patients. J Trauma Acute Care Surg. 2019;86(2):260–267. doi: 10.1097/TA.0000000000002147. [DOI] [PMC free article] [PubMed] [Google Scholar]
- 2.Holst LB. Benefits and harms of red blood cell transfusions in patients with septic shock in the intensive care unit. Dan Med J. 2016;63(2):B5209. [PubMed] [Google Scholar]
- 3.Vincent JL. Which carries the biggest risk: anaemia or blood transfusion? Transfus Clin Biol. 2015;22(3):148–150. doi: 10.1016/j.tracli.2015.05.001. [DOI] [PubMed] [Google Scholar]
- 4.Vincent J-L. Transfusion thresholds: the dangers of guidelines based on randomized controlled trials. Intensive Care Med. 2020;46:714–716. doi: 10.1007/s00134-019-05889-3. [DOI] [PubMed] [Google Scholar]
- 5.Jandu AS, Vidgeon S, Ahmed N. Anaemia and transfusion triggers in critically ill patients—what we have learnt thus far. J Intensive Care Soc. 2019;20(4):284. doi: 10.1177/1751143718783615. [DOI] [PMC free article] [PubMed] [Google Scholar]
- 6.Carson JL, Triulzi DJ, Ness PM. Indications for and adverse effects of red-cell transfusion. N Engl J Med. 2017;377(13):1261–1272. doi: 10.1056/NEJMra1612789. [DOI] [PubMed] [Google Scholar]
- 7.Hébert PC, Wells G, Blajchman MA, Marshall J, Martin C, Pagliarello G, et al. A multicenter, randomized, controlled clinical trial of transfusion requirements in critical care. Transfusion requirements in critical care investigators, canadian critical care trials group. N Engl J Med. 1999;340(6):409–417. doi: 10.1056/NEJM199902113400601. [DOI] [PubMed] [Google Scholar]
- 8.Holst LB, Haase N, Wetterslev J, Wernerman J, Guttormsen AB, Karlsson S, et al. Lower versus higher hemoglobin threshold for transfusion in septic shock. N Engl J Med. 2014;371(15):1381–1391. doi: 10.1056/NEJMoa1406617. [DOI] [PubMed] [Google Scholar]
- 9.Bergamin FS, Almeida JP, Landoni G, Galas FRBG, Fukushima JT, Fominskiy E, et al. Liberal versus restrictive transfusion strategy in critically ill oncologic patients: the transfusion requirements in critically ill oncologic patients randomized controlled trial. Crit Care Med. 2017;45:766–773. doi: 10.1097/CCM.0000000000002283. [DOI] [PubMed] [Google Scholar]
- 10.Mark DG, Morehouse JW, Hung Y-Y, Kene MV, Elms AR, Liu V, et al. In-hospital mortality following treatment with red blood cell transfusion or inotropic therapy during early goal-directed therapy for septic shock: a retrospective propensity-adjusted analysis. Crit Care. 2014;18(5):496. doi: 10.1186/s13054-014-0496-y. [DOI] [PMC free article] [PubMed] [Google Scholar]
- 11.Park DW, Chun B-C, Kwon S-S, Yoon YK, Choi WS, Sohn JW, et al. Red blood cell transfusions are associated with lower mortality in patients with severe sepsis and septic shock: a propensity-matched analysis. Crit Care Med. 2012;40:3140–3145. doi: 10.1097/CCM.0b013e3182657b75. [DOI] [PubMed] [Google Scholar]
- 12.Vandenbroucke JP, von Elm E, Altman DG, Gøtzsche PC, Mulrow CD, Pocock SJ, et al. Strengthening the reporting of observational studies in epidemiology (strobe): explanation and elaboration. Int J Surg. 2014;12(12):1500–1524. doi: 10.1016/j.ijsu.2014.07.014. [DOI] [PubMed] [Google Scholar]
- 13.Levy MM, Fink MP, Marshall JC, Abraham E, Angus D, Cook D, et al. 2001 sccm/esicm/accp/ats/sis international sepsis definitions conference. Intensive Care Med. 2003;29(4):530–538. doi: 10.1007/s00134-003-1662-x. [DOI] [PubMed] [Google Scholar]
- 14.Russell JA, Lee T, Singer J, De Backer D, Annane D. Days alive and free as an alternative to a mortality outcome in pivotal vasopressor and septic shock trials. J Crit Care. 2018;47:333–337. doi: 10.1016/j.jcrc.2018.05.003. [DOI] [PubMed] [Google Scholar]
- 15.Mehta RL, Kellum JA, Shah SV, Molitoris BA, Ronco C, Warnock DG, et al. Acute kidney injury network: report of an initiative to improve outcomes in acute kidney injury. Crit Care. 2007;11(2):R31. doi: 10.1186/cc5713. [DOI] [PMC free article] [PubMed] [Google Scholar]
- 16.Austin PC. An introduction to propensity score methods for reducing the effects of confounding in observational studies. Multivariate Behav Res. 2011;46(3):399–424. doi: 10.1080/00273171.2011.568786. [DOI] [PMC free article] [PubMed] [Google Scholar]
- 17.Normand SLT, Landrum MB, Guadagnoli E, Ayanian JZ, Ryan TJ, Cleary PD, et al. Validating recommendations for coronary angiography following acute myocardial infarction in the elderly: a matched analysis using propensity scores. J Clin Epidemiol. 2001;54(4):387–398. doi: 10.1016/S0895-4356(00)00321-8. [DOI] [PubMed] [Google Scholar]
- 18.Austin PC. Comparing paired vs non-paired statistical methods of analyses when making inferences about absolute risk reductions in propensity-score matched samples. Stat Med. 2011;30(11):1292–1301. doi: 10.1002/sim.4200. [DOI] [PMC free article] [PubMed] [Google Scholar]
- 19.Toy P, Gajic O, Bacchetti P, Looney MR, Gropper MA, Hubmayr R, et al. Transfusion-related acute lung injury: incidence and risk factors. Blood. 2012;119(7):1757–1767. doi: 10.1182/blood-2011-08-370932. [DOI] [PMC free article] [PubMed] [Google Scholar]
- 20.Remy KE, Hall MW, Cholette J, Juffermans NP, Nicol K, Doctor A, et al. Mechanisms of red blood cell transfusion-related immunomodulation. Transfusion. 2018;58(3):804. doi: 10.1111/trf.14488. [DOI] [PMC free article] [PubMed] [Google Scholar]
- 21.Rhodes A, Evans LE, Alhazzani W, Levy MM, Antonelli M, Ferrer R, et al. Surviving sepsis campaign: international guidelines for management of sepsis and septic shock: 2016. Intensive Care Med. 2017;43(3):304–377. doi: 10.1007/s00134-017-4683-6. [DOI] [PubMed] [Google Scholar]
Associated Data
This section collects any data citations, data availability statements, or supplementary materials included in this article.
Supplementary Materials
Additional file 1: Number of inclusions per year in the control and RBC group.
Additional file 2: Table of patient demographics before and after propensity matching, sensitivity analysis.
Additional file 3: Table of main outcome variables, sensitivity analysis.
Data Availability Statement
The datasets used and/or analyzed in the current study are available from the corresponding author on reasonable request.