

Summary
In this study, we aim to automate the sleep stage scoring process of overnight polysomnography (PSG) data while adhering to expert-based rules. We developed a sleep stage scoring algorithm utilizing the Generalized Linear Modeling (GLM) framework and extracted features from electroencephalogram (EEG), electromyography (EMG) and electrooculogram (EOG) signals based on predefined rules of the American Academy of Sleep Medicine (AASM) Manual for Scoring Sleep. Specifically, features were computed in 30-second epochs in the time and frequency domains of the signals and were then used to model the probability of an epoch being in each of five sleep stages; N3, N2, N1, REM or Wake. Finally, each epoch was assigned to a sleep stage based on model predictions. The algorithm was trained and tested on PSG data from 38 healthy individuals with no reported sleep disturbances. The overall scoring accuracy reached on the test set was 81.50 α 1.14% (Cohen’s kappa, κ = 0.73 α 0.02). The test set results were highly comparable to the training set, indicating robustness of the algorithm. Furthermore, our algorithm was compared to 3 well-known commercialized sleep-staging tools and achieved higher accuracies than all of them. Our results suggest that automatic classification is highly consistent with visual scoring. We conclude that our algorithm can reproduce the judgment of a scoring expert and is also highly interpretable. This tool can assist visual scorers to speed up their process (from hours to minutes) and provides a method for a more robust, quantitative, reproducible and cost-effective PSG evaluation supporting assessment of sleep and sleep disorders.
Keywords: Sleep, Polysomnography, Sleep Stages, Automated Scoring
Introduction
An estimated 50-70 million Americans suffer from a chronic sleep disorder adversely affecting daily functioning and overall health (Institute of Medicine (US) Committee on Sleep Medicine and Research, 2006). However, the majority of individuals who meet the diagnostic criteria for a sleep disorder are underdiagnosed, undiagnosed and or untreated.
One important tool used to characterize sleep and evaluate certain sleep disorders is overnight polysomnography (PSG), which involves simultaneously collecting multiple physiological recordings noninvasively. The data is then scored and reviewed in 30-second windows (epochs) by a registered sleep technologist who uses guidelines established by the American Academy of Sleep Medicine (AASM). This scoring process typically requires a total of 1-3 hours (Johns Hopkins Center for Sleep, personal communication, December 2018). Although accredited labs may vary on their degree of “software assisted” staging programs, the current industry standard mandates visual scoring (Berry et al., 2018).
Numerous research studies have been conducted to establish the reliability of a completely automated scoring process. Limitations of existing automated scoring methods include having an unsupervised and/or uninterpretable decision procedure (e.g., as in Ebrahimi et al., 2008; Patanaik et al., 2018; Sors et al., 2018; Stephansen et al., 2018; Sun et al., 2017; Tsinalis et al., 2016), involving spectral features that are not familiar to the sleep experts. Additionally, most methods were developed using only a small subset of the PSG recordings (Sors et al., 2018; Sun et al., 2017; Supratak et al., 2017) that generally fails to provide sufficient information to discriminate between certain sleep stages (Bódizs et al., 2008; Zoubek et al., 2007). Moreover, several automated scoring methods attempt to distinguish between only a few of the sleep stages, and sometimes even aggregate some of the stages (Ebrahimi et al., 2008; Fonseca et al., 2015; Jo et al., 2010; Ma et al., 2011; Malaekah et al., 2016; Oropesa et al., 1999; Sinha, 2008; Sun et al., 2017).
In order to build a clinically adoptable system that is both accurate and interpretable, we employed the Generalized Linear Model (GLM) framework to model the probability of sleep stages within each epoch as a function of PSG features. The GLMs were constructed using clinically relevant features inspired by the same criteria scoring experts follow for visual scoring. Specifically, the features were extracted in the time and frequency domains of EEG, EMG, and EOG signals based on predefined rules of the AASM Manual (Berry et al., 2018). Our models are thus interpretable and follow the rationale of an expert scorer who collectively considers a number of the PSG recordings when determining the appropriate sleep stage. To evaluate performance, we computed the agreement between this automated program and a visual scoring expert. Additionally, we compared the performance of our system to automatic scoring tools of three commercial software programs that are widely used for sleep diagnostics.
Methods
Study Population
A total of 38 healthy adults participated in the study (Table 1). The data were randomly split into a training set and a test set with 19 participants in each group. This partition was performed 50 times to generate 50 different training and test sets for model validation. For each partition, the training set was used to construct the GLMs for each sleep stage and the performance of the algorithm was then evaluated using the test set.
Table 1.
Population statistics.
| Subject statistics | Training Set | Test Set |
|---|---|---|
| Gender (M / F) | 7 / 12 | 9 / 10 |
| Age (years) | 23.8 ± 3.0 | 24.6 ± 3.4 |
| Ethnicity (Caucasian/White / Asian / Black) | 9/ 5/ 5 | 8/ 8/ 3 |
| PSQI | 2.2 ± 1.7 | 3.7 ± 2.1 |
| Time in bed (hours) | 6.2 ± 0.1 | 6.2 ± 0.1 |
This study was approved by the Johns Hopkins Medicine Institutional Review Boards and all participants provided informed consent prior to enrollment. All participants were evaluated by certified sleep specialists who conducted a clinical interview that also included a number of validated sleep surveys. Only right-handed participants were included and none were ambidextrous (using the Edinburgh Handedness Inventory) (Caplan & Mendoza, 2011). All participants completed Pittsburgh Sleep Quality Index (PSQI) (Buysse et al., 1989) to assess sleep quality. Both “good sleepers” (PSQI ≤ 5) and “poor sleepers” (PSQI > 5) were included in the study although the majority of participants (89.5%) had PSQI ≤ 5. Participants were not diagnosed with any sleep disorder, any neurological disorder, nor with any major medical or psychiatric disorder (e.g., congestive heart failure, stroke, seizure disorder, history of psychotic disorders, dementia, substance abuse). Participants were excluded if they endorsed symptoms consistent with Restless Legs Syndrome (RLS), circadian rhythm sleep wake disorders or had evidence of clinically significant sleep apnea (Apnea Hypopnea Index (AHI) > 5) on PSG. Menstrual cycle phase was recorded. Participants were not permitted to use alcohol, caffeine, or tobacco during any time of the study. None of the participants were on opioids, sedative hypnotics, antipsychotics, antidepressants, β-blockers, stimulants, mood stabilizers, or thyroid/diabetes medications.
Data Acquisition
The polysomnography was conducted in the Johns Hopkins Clinical Research unit according to AASM sleep laboratory technical and procedural guidelines (Berry et al., 2018). The recordings were performed utilizing the same sleep laboratory software, equipment model and procedural protocol for all participants. The collected PSG data included six EEG channels (F3-A2, F4-A1, C3-A2, C4-A1, O1-A2 and O2-A1), two EOG channels (right EOG-A2 and left EOG-A2), three EMG channels (chin, right leg and left leg), one ECG channel, respiratory flow and effort, oximeter, thermistor and cannula. Further details of the PSG data collection are included in Appendix S1.1 of the Supplemental Materials.
Data Analysis
Human Expert Visual Scoring
All PSG recordings were analyzed by a seasoned licensed and registered sleep technician using the Embla RemLogic sleep diagnostic software. The recordings were visually scored according to the AASM Manual for Scoring Sleep and Associated Events (Berry et al., 2018) by assigning one of five possible stages (N3, N2, N1, REM or Wake) to every 30-second epoch of the data. Two board-certified sleep medicine physicians reviewed and finalized all recordings.
Automated Sleep Stage Scoring Algorithm
The proposed automated sleep scoring system consists of five main steps. Prior to analysis, the data were preprocessed in accordance with AASM criteria and RemLogic settings (described below). Secondly, features inspired by the AASM scoring manual were extracted from the PSG signals, each aimed to capture specific characteristics of the different sleep stages. Thirdly, we applied a multinomial GLM to represent the probability of each sleep stage as a function of PSG features. In other words, we generated one GLM for each sleep stage. Please see more details of the GLM construction below. Then we performed the sleep stage scoring by assigning each epoch a sleep stage using model predictions and finally, a set of temporal contextual smoothing rules was applied on the annotated data.
All data analysis and scoring algorithm implementation was done in Mathworks MATLAB R2016b.
(i). Data Preprocessing
The PSG recordings used in this study include four EEG channels (F3-A2, F4-A1, C4-A1 and O1-A2), both EOG channels (right and left eye) and three EMG channels (chin, right leg and left leg). In fact, the EEG features were computed from all six channels. We then selected the four most informative channels by generating probability distributions for each EEG metric and each channel conditioned on the sleep stage and identified the channels giving the best separation of sleep stages. The signals were filtered using third order high- and low-pass Butterworth filters. The cutoff frequencies for each signal type and filter settings in RemLogic were formatted based on the AASM guidelines (Appendix S1.2, Table S1). Epochs containing major movements and muscle artifacts, obscuring the signals for more than half an epoch, were manually identified in accordance with AASM recommendations (see Appendix S1.2.1 in the Supplemental Materials for further details). On average, 4.25 ± 2.50 of epochs (mean ± std) were labeled as artifact epochs per patient. The sleep stage scoring was performed with and without including those epochs. We report the results of the latter application below. Scoring results without removing major artifact epochs are reported in Appendix S2.1.
(ii). Feature Extraction
The continuous PSG recordings were divided into non-overlapping 30-second epochs for feature extraction. The features were based on the AASM criteria and were aimed at quantifying the AASM scoring rules by capturing the corresponding characteristics of PSG data in the time and frequency domains. The final set of features used to construct the GLMs comprised of the 11 most informative PSG features that were considered most relevant by our team of sleep experts. Table 2 lists the features that were used to construct the models as well as the physiological meaning of each feature. Thus, the final set of features reflects translation of sleep expert knowledge into metrics that can be used for automated processing. Note that our models only consider physiological features already used in staging classification and thus we did not include other visual scoring regarding factors such as AHI, oxygen saturation, periodic limb movements of sleep (PLMS), REM sleep behavior disorder (RBD), parasomnias and more. For a more detailed description of the feature extraction procedure and computation of each feature, please see Appendix S1.3.
Table 2.
The features used in the classifier.
| Covariate | Quantitative feature | Signal | AASM feature |
|---|---|---|---|
| x1 | Delta Power | F3-A2 EEG | Moderate to high delta activity |
| x2 | Delta Power | F4-A1 EEG | High delta activity |
| x3 | Theta Power | O1-A2 EEG | Low theta activity |
| x4 | Alpha Power | O1-A2 EEG | Alpha rhythm observed |
| x5 | Beta Power | F3-A2 EEG | Low beta activity |
| x6 | Maximum Spindle Duration | F3-A2 EEG | Spindles present |
| x7 | Number of Spindles | C4-A1 EEG | Spindles present |
| x8 | EOG10.3-35 | Right EOG and Left EOG | Eye movements present/absent |
| x9 | EOG20.1−0.45 | Right EOG and Left EOG | Eye movements present |
| x10 | EOG30.3−0.45 | Right EOG and Left EOG | Little to no rapid eye movements |
| x11 | EMG Energy | EMG Chin, Left Leg, Right Leg | Increased EMG activity |
The EOG features are combinations of the cross- and autocorrelations of the two EOG signals, and the EMG energy is strongly linked to muscular activity. Spindles were detected using the Wendt algorithm and the length of a single spindle was restricted to 0.5-2 seconds.
(iii). GLM Construction
The GLM construction process was repeated 50 times, each time using a new random partition of patients into a training and a test set. For each iteration, we constructed GLMs (McCullagh & Nelder, 1989) using 19 patient PSG recordings (training set) and tested scoring accuracy using the remaining 19 patient recordings (test set). For a given patient, we defined as the probability of being in sleep stage s in epoch e. The probabilities must satisfy the constraint for all e. To ensure that the above constraint was met, we applied GLM to model for s = {1,2,3,4} = {N1, N2, N3, REM}. Specifically,
| (1) |
where xi denotes the features listed in Table 2 and βsi is the corresponding coefficient estimate for feature i in model s. The probability of being in s = 5 (Wake) is then just computed as one minus the probability of the other four stages explicitly modeled, i.e. .
The GLM framework uses maximum likelihood estimation to solve for the model regression coefficients that best fit the data. We constructed the models using the whole set of 11 features, but only the features that made statistically significant contributions to the model, i.e. the corresponding coefficient estimate was significantly different from zero (p < 0.05, were kept in the final model for each sleep stage. All features were normalized before fitting the models for easier identification of the most important covariates.
(iv). Automatic Sleep Stage Classification
The sleep stage classification was performed on the test set. For each epoch e, the GLMs were used to compute probabilities, , of being in each of the five possible stages. The epoch was then assigned the most likely sleep stage (i.e. ) the sleep stage with the highest probability). We report the classification performance of the 50 iterations (mean ± std) below.
(v). Temporal Smoothing
Sleep is a continuous process and thus alternating between different sleep stages every 30 seconds is highly unlikely. The AASM Manual has a number of rules that recommend considering the neighboring epochs for the scoring of a current epoch, particularly as it relates to scoring continuous epochs of REM sleep or N2. Therefore, a smoothing process utilizing the temporal contextual information was applied after performing the GLM-based scoring described above. These smoothing rules refer to the relationship between epochs prior to and after each epoch. Specifically, let A, B and C represent the possible stages. Then three consecutive epochs of A, B, A were replaced with A, A, A and four consecutive epochs of A, B, B, A or A, B, C, A were replaced with A, A, A, A.
(vi). Performance Evaluation
The performance of the automatic GLM scoring system was evaluated by comparing the agreement between the automatic classification and the human expert scoring which served as the gold standard. In addition, we measured performance of RemLogic’s Scoring Assistant, Sleepware G3’s Somnolyzer and Polysmith’s Stage Assist in the same manner on our data set for comparison. We used four different metrics to evaluate performance. The overall agreement was evaluated using two metrics: (i) scoring accuracy (A) and (ii) Cohen’s kappa (κ) (Cohen, 1960), which is another measure for the overall agreement that also corrects for the probability of the agreement occurring by chance. Additionally, we computed two metrics for the agreement per sleep stage: (i) precision (Ps) and (ii) recall (Rs). The overall scoring accuracy was defined as the percentage of epochs where the automatic algorithm was in agreement with the human scorer and was computed as:
| (2) |
In addition, we defined precision for sleep stage s as:
| (3) |
The second sleep stage specific metric, recall, represents the percentage of epochs that the automatic classifier got correct out of all epochs that the sleep expert labeled as a particular sleep stage and was computed as:
| (4) |
We used the same 50 training and test set partitions to obtain distributions of performance metrics (scoring accuracy, precision, recall and scoring time) for each method and finally, we compared the performance of each commercial tool to our approach using an unpaired two sample t-test.
Automated Scoring with Commercialized Software Tools
In addition to computing the agreement between our algorithm and a scoring expert, we chose to compare the performance of our approach to automatic scoring tools of three widely used commercial sleep diagnostic software programs. Thus, all PSG recordings were also annotated using the automatic tools of Embla RemLogic, Philips Respironics’ Sleepware G3 and Polysmith by Nihon Kohden.
(i). RemLogic Scoring Assistant
The RemLogic software provides an option of scoring the PSG recordings automatically using the Scoring Assistant tool. The Scoring Assistant stages sleep according to current scoring guidelines by identifying waveform patterns characteristic of the different sleep stages in EEG, EOG and submental EMG channels of the PSG data. The tool typically analyzes a full night sleep study in 1-5 minutes (RemLogic 3.4 Help, D-1307-004, Revision 05, 2014). The traces used for the analysis are reported in Table S2.
(ii). Sleepware G3 Somnolyzer
The Somnolyzer (Anderer et al., 2005, 2010) is an automatic computer-assisted sleep scoring system offered by the Philips Respironics’ Sleepware G3 sleep diagnostics software. The Somnolyzer follows the R&K and the current AASM standards and applies the same scoring rules a human expert would. The channels used for the automatic analysis by the Somnolyzer are reported in Table S3.
(iii). Polysmith Stage Assist
In Polysmith, a sleep diagnostic software offered by Nihon Kohden, PSG recordings can be autoscored using the Stage Assist feature. The sleep analysis detects many of the waveforms present in EEG, EOG and EMG signals of the PSG and uses this information to automatically determine sleep stages according to the R&K or the AASM criteria (PolysmithTM User Manual 8.0. Rev. 12/17/2010, 2010). Table S3 lists the channels used for the autoscoring by the Stage Assist.
Results
Performances on the training set are reported in Appendix S2.1.
GLM Coefficients
Fig. 1 shows the final set of features and their coefficient estimates for each model, averaged across all 50 iterations. Note that the probability of being in the Wake stage is just computed as one minus the probability of the other 4 stages that are explicitly modeled.
Figure 1.
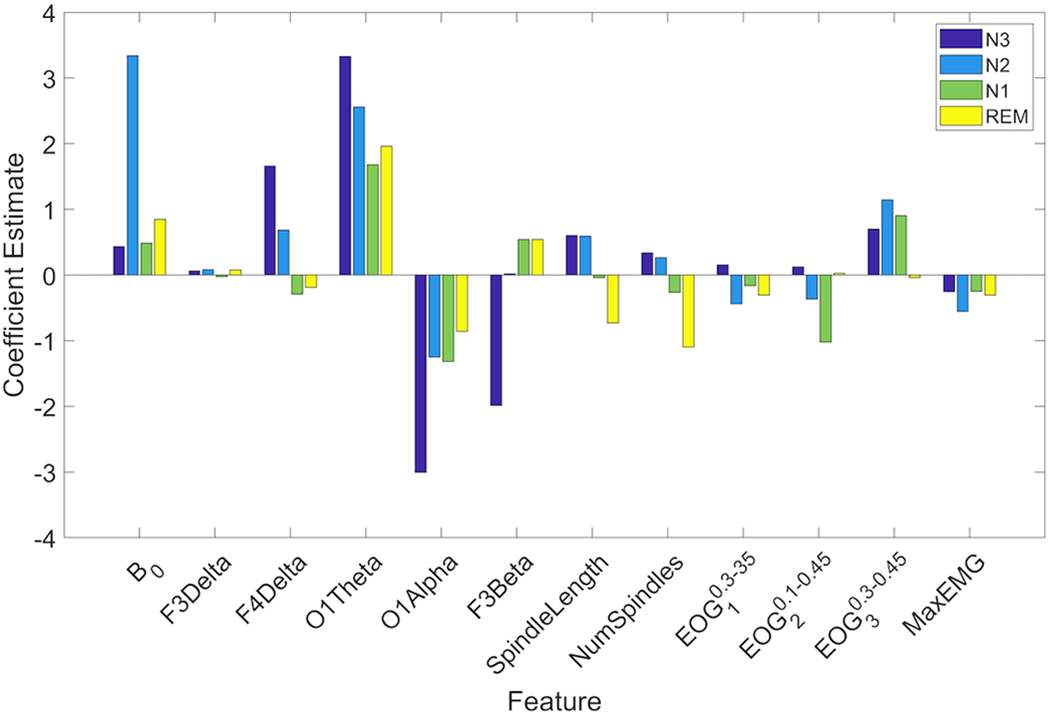
Coefficient estimates of all features for the four GLM models, averaged across all training sets. Only features that had coefficient estimates statistically significantly different from zero were included in each model. Navy bars represent coefficient estimates of the GLM model for N3 (pN3). Blue bars show coefficient estimates of pN2, green bars are the coefficient estimates of pN1 and coefficient estimates of pREM are shown in yellow. Note that the probability of being in the Wake stage is just computed as one minus the probability of the other 4 stages that are explicitly modeled.
GLM Scoring Performance
The performance of the GLM scoring algorithm on the test set was comparable, and only slightly lower than for the training set, both without and with removing major movement and artifact epochs. Performance results on data without artifacts removed are reported in Appendix S2.1. After artifacts were removed from the data set, the overall accuracy of the test set was 81.50 ± 1.14% (mean ± std) and Cohen’s kappa (κ) was 0.73 ± 0.02. Examples of hypnograms scored by the human expert compared to hypnograms generated by the algorithm can be found in Appendix S2.2. As Fig. 2(a) shows, the highest precision was generally obtained for stage N3, and the highest recall was obtained for stage N2, followed closely by stages REM, Wake and N3. Precision and recall were significantly lower for stage N1 compared to the other stages.
Figure 2.
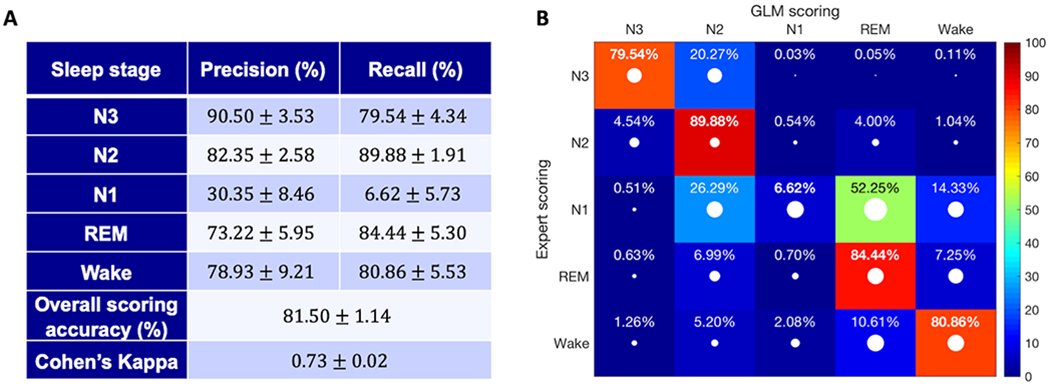
Scoring results of the test set. (a) Precision and recall (mean ± std) are reported for each sleep stage along with the overall scoring accuracy and Cohen’s kappa. (b) Confusion matrix for the automatic scoring algorithm. The values are the percentage of epochs (mean value) belonging to the stage scored by the expert (indicated by the rows) that were classified by our system as the stage indicated by the columns (recall). The white dots represent the standard deviation of the reported values. The diagonal elements, shown in bold, represent the percentage of epochs where the automatic classifier was in agreement with the human expert for each sleep stage.
Fig. 2(b) shows the confusion matrix after scoring the test set a total of 50 times. As noted above, the highest number of misclassification errors occurred for stage N1. For N1, over 50% of the misclassifications occurred between the N1-REM pair. The second and third most frequently misclassified pairs were N1-N2 and N1-Wake, respectively. Another common misclassification error was scoring stage N3 (as scored by the expert) as stage N2. The remaining pairs all had misclassification rates below 10%.
Performance of Commercialized Software Tools
Fig. 3(a) and 3(b) compare the scoring accuracy and the scoring time (i.e. the time it takes to annotate a full night study), respectively, of the automated GLM scoring algorithm and the commercialized software programs. All the automated scoring tools (i.e. the GLM algorithm as well as all commercialized programs) had a significantly lower scoring time than the human scorer. In addition, the performance of the GLM algorithm – including both scoring accuracy and scoring time – was statistically significantly (p < 0.05) better than that of all the commercialized software tools. More detailed performance results of each commercial tool are reported below and in the Supplemental Materials (Appendix S2.1).
Figure 3.
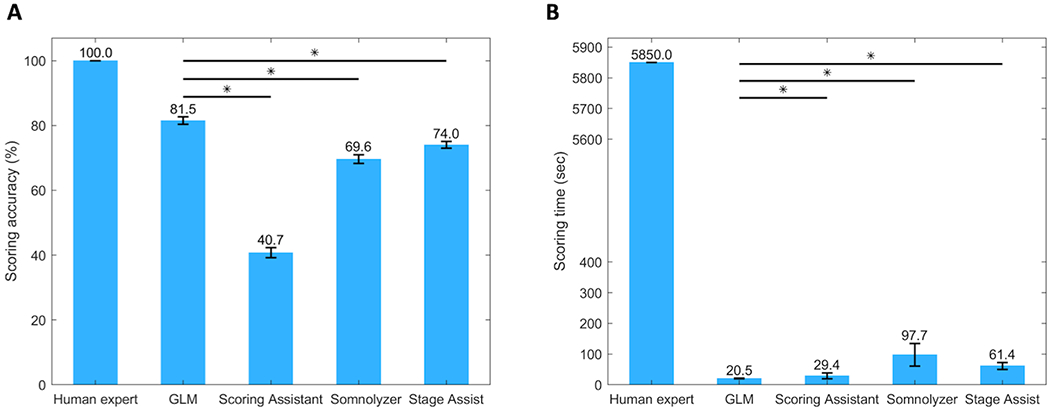
Performance comparison of the GLM algorithm to commercialized software programs and a human scorer in terms of (a) scoring accuracy and (b) scoring time of a full night study. GLM = GLM scoring algorithm. Asterisks (*) denote significant difference (p < 0.05).
RemLogic Scoring Assistant
Using the Scoring Assistant to score our data set yielded an overall scoring accuracy of 40.75 ± 1.53% and Cohen’s kappa κ = 0.22 ± 0.02 on the test set, which was highly comparable to the performance on the training set.
Sleepware G3 Somnolyzer
Using the Somnolyzer, the overall scoring accuracy in the test cohort was 69.62 ± 1.38% with Cohen’s kappa equal to κ = 0.55 ± 0.02. The Somnolyzer did not always assign all epochs a sleep stage, but instead labelled them as ‘No Stage (NS)’. On average, 1.51 ± 0.24% (mean ± std) epochs were left unscored by the Somnolyzer.
Polysmith Stage Assist
The overall test set scoring accuracy of the Stage Assist was 74.02 ± 1.04% and Cohen’s kappa was κ = 0.64 ± 0.01. Similar to the Somnolyzer, not all epochs were assigned a sleep stage by the Stage Assist. On average 0.36 ± 0.08% were left unscored.
Scoring Time
Using the GLM scoring algorithm, the average scoring time of a full night sleep study is reduced from around 1.63 ± 0.63 hours (mean ± std), or 5,850 ± 2,250 seconds, by a human expert to 20.49 ± 1.02 seconds (Fig. 3(b)). In comparison, it took the Scoring Assistant on average 29.37 ± 9.55 seconds to score each study also resulting in a much lower scoring accuracy. For the Somnolyzer and the Stage Assist we assumed that the unscored epochs will be manually scored by a human expert. This resulted in an average scoring time of 1.63 ± 0.61 minutes (97.72 ± 36.84 seconds) for the Somnolyzer and 61.39 ± 11.05 seconds for the Stage Assist.
Discussion
At present, the standard procedure of PSG data analysis is heavily dependent upon human visual scoring. With the growing need for sleep health care, the current sleep processing paradigm will prove to be increasingly costly and resource demanding in an already resource challenged environment. Here, a new system for automatic sleep stage scoring of PSG data has been proposed. The algorithm was trained on a set of 19 participants and its performance was evaluated on another set of 19 participants. To evaluate performance, the procedure was repeated 50 times yielding an overall scoring accuracy of 81.50 ± 1.14% (mean ± std) and Cohen’s kappa equal to κ = 0.73 ± 0.02.
The performances of existing automatic sleep scoring methods show a high degree of variability, with the agreement between human scoring and automated classifiers ranging from around 70% to 90% (Ebrahimi et al., 2008; Virkkala et al., 2007; Zhang et al., 2016).While higher classification accuracies have been reported in the literature compared to our proposed method, not all methods can be compared fairly. First of all, there is great variability in the size and quality of the data sets used, with many studies applying their algorithms on small sets of data (20 total subjects or less) (Ebrahimi et al., 2008; Figueroa Helland et al., 2010; L. Fraiwan et al., 2012; Hsu et al., 2013; Jo et al., 2010; Lajnef et al., 2015; Liang et al., 2012; Ma et al., 2011; Malaekah et al., 2016; Oropesa et al., 1999; Sinha, 2008; Yang & Xia, 2016). Using a sufficient number of recordings for training and testing is important to ensure consistent performance, both on different individuals and across data sets. The types of data sets used differ across existing methods as well. Numerous studies apply their algorithms to whole night recordings (Fonseca et al., 2015; L. Fraiwan et al., 2012; Güneş et al., 2010; Imtiaz & Rodriguez-Villegas, 2015; Lajnef et al., 2015; Liang et al., 2012, 2016; Malaekah et al., 2016; Patanaik et al., 2018; Stephansen et al., 2018; Sun et al., 2017; Virkkala et al., 2007; Yang & Xia, 2016; Zoubek et al., 2007) while others sample the same number of epochs from each sleep stage (Oropesa et al., 1999; Zoubek et al., 2007). Additionally, many studies obtaining classification accuracies in the high end of the reported range combine the most commonly confused stages into a single stage (e.g., combining all non-REM stages or N1 and N2 into light sleep) (Ebrahimi et al., 2008; Fonseca et al., 2015; Jo et al., 2010; Ma et al., 2011; Malaekah et al., 2016; Oropesa et al., 1999; Sinha, 2008). Furthermore, many methods are developed using the original scoring manual by Rechtshaffen and Kales (R&K) (Ebrahimi et al., 2008; Figueroa Helland et al., 2010; Fonseca et al., 2015; L. Fraiwan et al., 2012; Güneş et al., 2010; Liang et al., 2012, 2016; Malaekah et al., 2016; Oropesa et al., 1999; Sinha, 2008; Tsinalis et al., 2016; Virkkala et al., 2007; Yang & Xia, 2016; Zoubek et al., 2007) while others utilize the newer version by AASM (L. Fraiwan et al., 2012; Imtiaz & Rodriguez-Villegas, 2015; Lajnef et al., 2015; Ma et al., 2011; Malaekah et al., 2016; Patanaik et al., 2018; Stephansen et al., 2018; Sun et al., 2017; Zhang et al., 2016). Finally, the annotated inter-scorer reliability amongst sleep experts has been found to be only around 82% (Danker-Hopfe et al., 2009; Rosenberg & Van Hout, 2013). In some studies, performance is evaluated using scoring from a single expert (Lajnef et al., 2015; Liang et al., 2012, 2016; Oropesa et al., 1999), while others use recordings scored by multiple experts (Fonseca et al., 2015; L. Fraiwan et al., 2009, 2012; Imtiaz & Rodriguez-Villegas, 2015; Stephansen et al., 2018; Tsinalis et al., 2016; Virkkala et al., 2007; Zoubek et al., 2007). Moreover, a number of studies only report the performance on epochs where more than one scorer agree on the sleep stage, yielding a “cleaner” data set with fewer ambiguous epochs (Sinha, 2008; Stephansen et al., 2018; Zoubek et al., 2007).
Based on these aforementioned factors, it is clear that direct comparison between different studies is complicated. Therefore, we chose to compare our approach to automatic scoring tools of three commercialized software programs used by many sleep centers: The RemLogic Scoring Assistant, The Sleepware G3 Somnolyzer and Polysmith’s Stage Assist. As Fig. 3 shows, the GLM approach outperformed all of the commercial programs in terms of both scoring accuracy and scoring time.
RemLogic’s Scoring Assistant is intended as an aid in sleep staging but does not replace a sleep scoring specialist, which was clearly demonstrated by the tool’s unsatisfactory performance on our data set, with only 40.75 ± 1.53% agreement with the human scorer on the test set. No epochs were left unscored by the Scoring Assistant. In contrast, 1.51 ± 0.24% and 0.36 ± 0.08% of epochs were left unscored by the Somnolyzer and the Stage Assist respectively, likely yielding a cleaner set of data used for the scoring analysis.
An important limiting factor of the visual scoring method is the amount of time it takes to score each study. Not only does it contribute to high operating costs of sleep centers but is also expensive in terms of valuable expert time. A seasoned registered sleep technologist at the Johns Hopkins Sleep Center takes around 0.5-1.5 hours on average to stage a full night sleep study, followed by a 0.5-0.75 hour review and final interpretation in the hands of a certified sleep specialist (Johns Hopkins Center for Sleep, personal communication, December 2018).
The Scoring Assistant analyzed a full night study in around 30 seconds on average. The results then need to be accepted, edited or rejected by a sleep scoring specialist, further adding to the time it takes to analyze each study. The shortest autoscore run-time was achieved with the Somnolyzer (roughly 9 seconds per study on average). However, some epochs were left unscored and by assuming that these epochs will be manually scored by a sleep expert, the average scoring time of a full night’s recording increased to approximately 2 minutes.
The Stage Assist outperformed the other commercial autoscore programs in terms on accuracy but was slower in terms of run-time. On average, the Stage Assist autoscored one sleep study in roughly 40 seconds with a small number of epochs left unscored. As described above, we then assume that a human expert manually scores these epochs, resulting in an autoscoring time of roughly 1 minute per sleep study. In comparison, the average run-time of our algorithm was 20.49 ± 1.02 seconds for feature extraction and scoring of a full night study. It is therefore evident that automating the scoring process using the GLM approach can greatly increase the efficiency of sleep stage scoring by reducing the time and cost of the procedure while still delivering reliable results.
The performance of the proposed algorithm represents several desirable and superlative properties. The GLM method employs a generalized form of linear regression to fit the data and provides easily interpretable models that describe patterns of feature interactions within the different sleep stages. The features of the models are inspired by the AASM scoring manual and rules established and quantified by sleep experts through visual inspection. Furthermore, the scoring accuracy of the test set was highly comparable to the training set accuracy, suggesting the robustness of performance on different data sets.
Despite the fact that algorithms differ in many ways, the results of our algorithm are similar to performances of existing sleep stage classification systems, with stage N1 recurrently being the most misclassified sleep stage (Figueroa Helland et al., 2010; L. Fraiwan et al., 2009, 2012; Güneş et al., 2010; Hsu et al., 2013; Imtiaz & Rodriguez-Villegas, 2015; Liang et al., 2012; Tsinalis et al., 2016; Virkkala et al., 2007; Zoubek et al., 2007). Moreover, the results are in accordance with reported agreement rates per sleep stage amongst human experts (Rosenberg & Van Hout, 2013). Generally, the best agreement is achieved with stages N2, REM and Wake. N3 is most frequently confused with stage N2 and disagreement with the scoring of N1 includes scoring of N2, Wake and REM. N1 shares certain spectral similarities with both REM and Wake, making it difficult to distinguish between those stages (Berry et al., 2018; Imtiaz & Rodriguez-Villegas, 2015). Furthermore, N1 constitutes only 2-5% of total sleep (Institute of Medicine (US) Committee on Sleep Medicine and Research, 2006), and thus the data available for training the classifiers is very limited.
The majority of misclassification errors in our algorithm are likely due to absence of characteristic sleep stage features or the presence of multiple or overlapping features within a single epoch (see Fig. S14 for examples of misclassified epochs). It is also possible that our quantitative features may not sufficiently identify differences in the signal patterns in some situations and signal interference, where the signals pick up the activity of other signals, makes it difficult to capture certain characteristics as well.
Conclusion and Future Work
The discussion above highlights some of the limitations of the current method that should be addressed in future work. Identifying useful features based on other rules of the AASM Manual that have not yet been employed or through exploration may be essential to improve the detection of stages N1 and N3 particularly. We also expect improvements of our current contextual smoothing rules, for example by considering sleep stage transition patterns described in the AASM Manual, to further enhance the agreement with human experts.
Furthermore, it is desirable to extend these results in young healthy individuals to older healthy individuals and to the more challenging cases of patients with sleep problems. We do not expect performance to change significantly with the possible exception of extreme cases.
Finally, given that the purpose of this algorithm was solely sleep scoring, we did not take other human scoring parameters, such as AHI, oxygen saturation, PLMS, RBD or parasomnias, into account. Future work could include further expanding our algorithm to consider these other parameters as well.
Our results suggest that the automatic classification is highly consistent with visual scoring and the error in the algorithm is likely due to the ambiguous boundaries between adjacent sleep stages inherent within the current scoring guidelines. The disagreements may in fact be more reflective of the “gold standard” approach rather than an insufficiency of the computational procedures. We conclude that an automatic classification algorithm based on the GLM framework, and importantly using easily interpretable features, extracted from the AASM Manual, can to a large extent reproduce the judgment of a visual scoring expert. Therefore, we see this tool as assisting visual scorers to speed up their process and providing a way to diagnose sleeping disorders in a more robust, quantitative and ultimately cost-effective manner.
Supplementary Material
Acknowledgements
This work was supported by JHU CFAR NIH/NIAID fund 1P30AI094189-01A1 and by a grant from the American Epilepsy Society.
Footnotes
Disclosure Statement
Ms. Gunnarsdottir, Dr. Salas, Dr. Ewen, Ms. Hu and Dr. Sarma report no conflicts of interest. Dr. Gamaldo has received royalties from Up- to- date Inc. for publications. Dr. Gamaldo is a paid consultant for Jazz Pharmaceuticals. Dr. Allen reports grants from American Regent Pharma, outside the submitted work. In addition, Ms. Gunnarsdottir, Dr. Gamaldo, Dr. Salas, Dr. Ewen and Dr. Sarma have a patent JHU ref C15403 pending.
References
- Anderer P, Gruber G, Parapatics S, Woertz M, Miazhynskaia T, Klosch G, … Dorffner G (2005). An E-health solution for automatic sleep classification according to Rechtschaffen and Kales: Validation study of the Somnolyzer 24 × 7 utilizing the Siesta database. Neuropsychobiology, 51(3), 115–133. 10.1159/000085205 [DOI] [PubMed] [Google Scholar]
- Anderer P, Moreau A, Woertz M, Ross M, Gruber G, Parapatics S, … Dorffner G (2010). Computer-assisted sleep classification according to the standard of the American Academy of Sleep Medicine: Validation study of the AASM version of the Somnolyzer 24 × 7. Neuropsychobiology, 62(4), 250–264. 10.1159/000320864 [DOI] [PubMed] [Google Scholar]
- Berry RB, Brooks R, Gamaldo CE, Harding SM, Marcus CL, & Vaughn BV (2018). The AASM Manual for the Scoring of Sleep and Associated Events: Rules, Terminology and Technical Specifications, Version 2.5. Darien, IL: American Academy of Sleep Medicine. [Google Scholar]
- Bódizs R, Sverteczki M, & Mészáros E (2008). Wakefulness-sleep transition: Emerging electroencephalographic similarities with the rapid eye movement phase. Brain Research Bulletin, 76(1–2), 85–89. 10.1016/j.brainresbull.2007.11.013 [DOI] [PubMed] [Google Scholar]
- Buysse DJ, Reynolds CF, Monk TH, Berman SR, & Kupfer DJ (1989). The Pittsburgh Sleep Quality Index: A new instrument for psychiatric practice and research. Psychiatry Research, 28(2), 193–213. 10.1016/0165-1781(89)90047-4 [DOI] [PubMed] [Google Scholar]
- Caplan B, & Mendoza JE (2011). Edinburgh Handedness Inventory. In Kreutzer JS, DeLuca J, & Caplan B (Eds.), Encyclopedia of Clinical Neuropsychology (pp. 928–928). 10.1007/978-0-387-79948-3_684 [DOI] [Google Scholar]
- Cohen J (1960). A coefficient of agreement for nominal scales. Educational and Psychological Measurement, 20, 37–46. [Google Scholar]
- Danker-Hopfe H, Anderer P, Zeitlhofer J, Boeck M, Dorn H, Gruber G, … Dorffner G (2009). Interrater reliability for sleep scoring according to the Rechtschaffen & Kales and the new AASM standard. Journal of Sleep Research, 18(1), 74–84. 10.1111/j.1365-2869.2008.00700.x [DOI] [PubMed] [Google Scholar]
- Ebrahimi F, Mikaeili M, Estrada E, & Nazeran H (2008). Automatic sleep stage classification based on EEG signals by using neural networks and wavelet packet coefficients. Conference Proceedings: Annual International Conference of the IEEE Engineering in Medicine and Biology Society, 2008, 1151–1154. 10.1109/IEMBS.2008.4649365 [DOI] [PubMed] [Google Scholar]
- Figueroa Helland VC, Gapelyuk A, Suhrbier A, Riedl M, Penzel T, Kurths J, & Wessel N (2010). Investigation of an automatic sleep stage classification by means of multiscorer hypnogram. Methods of Information in Medicine, 49(5), 467–472. 10.3414/ME09-02-0052 [DOI] [PubMed] [Google Scholar]
- Fonseca P, Long X, Radha M, Haakma R, Aarts RM, & Rolink J (2015). Sleep stage classification with ECG and respiratory effort. Physiological Measurement, 36(10), 2027–2040. 10.1088/0967-3334/36/10/2027 [DOI] [PubMed] [Google Scholar]
- Fraiwan L, Khaswaneh NY, & Lweesy KY (2009). Automatic Sleep Stage Scoring with Wavelet Packets Based on Single EEG Recording. World Academy of Science, Engineering and Technology, 30, 485–488. [Google Scholar]
- Fraiwan L, Lweesy K, Khasawneh N, Wenz H, & Dickhaus H (2012). Automated sleep stage identification system based on time–frequency analysis of a single EEG channel and random forest classifier. Computer Methods and Programs in Biomedicine, 108(1), 10–19. 10.1016/j.cmpb.2011.11.005 [DOI] [PubMed] [Google Scholar]
- Güneş S, Polat K, & Yosunkaya Ş (2010). Efficient sleep stage recognition system based on EEG signal using k-means clustering based feature weighting. Expert Systems with Applications, 37(12), 7922–7928. 10.1016/j.eswa.2010.04.043 [DOI] [Google Scholar]
- Hsu Y-L, Yang Y-T, Wang J-S, & Hsu C-Y (2013). Automatic sleep stage recurrent neural classifier using energy features of EEG signals. Neurocomputing, 104, 105–114. 10.1016/j.neucom.2012.11.003 [DOI] [Google Scholar]
- Imtiaz SA, & Rodriguez-Villegas E (2015). Automatic sleep staging using state machine-controlled decision trees. Conference Proceedings: Annual International Conference of the IEEE Engineering in Medicine and Biology Society, 2015, 378–381. 10.1109/EMBC.2015.7318378 [DOI] [PubMed] [Google Scholar]
- Institute of Medicine (US) Committee on Sleep Medicine and Research. (2006). Sleep Disorders and Sleep Deprivation: An Unmet Public Health Problem (Colten HR & Altevogt BM, Eds.). Retrieved from http://www.ncbi.nlm.nih.gov/books/NBK19960/ [PubMed]
- Jo HG, Park JY, Lee CK, An SK, & Yoo SK (2010). Genetic fuzzy classifier for sleep stage identification. Computers in Biology and Medicine, 40(7), 629–634. 10.1016/j.compbiomed.2010.04.007 [DOI] [PubMed] [Google Scholar]
- Lajnef T, Chaibi S, Ruby P, Aguera P-E, Eichenlaub J-B, Samet M, … Jerbi K (2015). Learning machines and sleeping brains: Automatic sleep stage classification using decision-tree multi-class support vector machines. Journal of Neuroscience Methods, 250, 94–105. 10.1016/j.jneumeth.2015.01.022 [DOI] [PubMed] [Google Scholar]
- Liang S-F, Kuo C-E, Hu Y-H, Pan Y-H, & Wang Y-H (2012). Automatic Stage Scoring of Single-Channel Sleep EEG by Using Multiscale Entropy and Autoregressive Models. IEEE Transactions on Instrumentation and Measurement, 61(6), 1649–1657. 10.1109/TIM.2012.2187242 [DOI] [Google Scholar]
- Liang S-F, Kuo C-E, Shaw F-Z, Chen Y-H, Hsu C-H, & Chen J-Y (2016). Combination of Expert Knowledge and a Genetic Fuzzy Inference System for Automatic Sleep Staging. IEEE Transactions on Biomedical Engineering, 63(10), 2108–2118. 10.1109/TBME.2015.2510365 [DOI] [PubMed] [Google Scholar]
- Ma H, Hu B, Jackson M, Yan J, & Zhao W (2011). A Hybrid Classification Method using Artificial Neural Network Based Decision Tree for Automatic Sleep Scoring. World Academy of Science, Engineering and Technology, (55), 279–284. [Google Scholar]
- Malaekah E, Abdullah H, & Cvetkovic D (2016). Automatic Sleep Stage Detection Based on Electrooculography. In Ibrahim F, Usman J, Mohktar MS, & Ahmad MY (Eds.), International Conference for Innovation in Biomedical Engineering and Life Sciences (pp. 193–197). Singapore: Springer Singapore. [Google Scholar]
- McCullagh P, & Nelder JA (1989). Generalized Linear Models, Second Edition CRC Press. [Google Scholar]
- Oropesa E, Cycon HL, & Jobert M (1999). Sleep Stage Classification using Wavelet Transform and Neural Network (Technical Report No. ICSI Technical Report TR-99-008).
- Patanaik A, Ong JL, Gooley JJ, Ancoli-Israel S, & Chee MWL (2018). An end-to-end framework for real-time automatic sleep stage classification. Sleep, 41(5). 10.1093/sleep/zsy041 [DOI] [PMC free article] [PubMed] [Google Scholar]
- PolysmithTM User Manual 8.0. Rev December/17/2010. (2010). Gainesville, FL: Neutronics, Inc. A Nihon Kohden Company. [Google Scholar]
- RemLogic 3.4 Help, D-1307-004, Revision 05. (2014). Canada: Embla Systems, a division of Natus Medical Incorporated. [Google Scholar]
- Rosenberg RS, & Van Hout S (2013). The American Academy of Sleep Medicine inter-scorer reliability program: Sleep stage scoring. Journal of Clinical Sleep Medicine: JCSM: Official Publication of the American Academy of Sleep Medicine, 9(1), 81–87. 10.5664/jcsm.2350 [DOI] [PMC free article] [PubMed] [Google Scholar]
- Sinha RK (2008). Artificial neural network and wavelet based automated detection of sleep spindles, REM sleep and wake states. Journal of Medical Systems, 32(4), 291–299. 10.1007/s10916-008-9134-z [DOI] [PubMed] [Google Scholar]
- Sors A, Bonnet S, Mirek S, Vercueil L, & Payen J-F (2018). A convolutional neural network for sleep stage scoring from raw single-channel EEG. Biomedical Signal Processing and Control, 42, 107–114. 10.1016/j.bspc.2017.12.001 [DOI] [Google Scholar]
- Stephansen JB, Olesen AN, Olsen M, Ambati A, Leary EB, Moore HE, … Mignot E (2018). Neural network analysis of sleep stages enables efficient diagnosis of narcolepsy. Nature Communications, 9(1), 1–15. 10.1038/s41467-018-07229-3 [DOI] [PMC free article] [PubMed] [Google Scholar]
- Sun H, Jia J, Goparaju B, Huang G-B, Sourina O, Bianchi MT, & Westover MB (2017). Large-Scale Automated Sleep Staging. Sleep, 40(10). 10.1093/sleep/zsx139 [DOI] [PMC free article] [PubMed] [Google Scholar]
- Supratak A, Dong H, Wu C, & Guo Y (2017). DeepSleepNet: A Model for Automatic Sleep Stage Scoring Based on Raw Single-Channel EEG. IEEE Transactions on Neural Systems and Rehabilitation Engineering, 25(11), 1998–2008. 10.1109/TNSRE.2017.2721116 [DOI] [PubMed] [Google Scholar]
- Tsinalis O, Matthews PM, & Guo Y (2016). Automatic Sleep Stage Scoring Using Time-Frequency Analysis and Stacked Sparse Autoencoders. Annals of Biomedical Engineering, 44(5), 1587–1597. 10.1007/s10439-015-1444-y [DOI] [PMC free article] [PubMed] [Google Scholar]
- Virkkala J, Hasan J, Värri A, Himanen S-L, & Müller K (2007). Automatic sleep stage classification using two-channel electro-oculography. Journal of Neuroscience Methods, 166(1), 109–115. 10.1016/j.jneumeth.2007.06.016 [DOI] [PubMed] [Google Scholar]
- Yang F, & Xia B (2016). Single Electrooculogram Channel-Based Sleep Stage Classification In Wang R & Pan X (Eds.), Advances in Cognitive Neurodynamics (V) (pp. 595–600). 10.1007/978-981-10-0207-6_80 [DOI] [Google Scholar]
- Zhang J, Wu Y, Bai J, & Chen F (2016). Automatic sleep stage classification based on sparse deep belief net and combination of multiple classifiers. Transactions of the Institute of Measurement and Control, 38(4), 435–451. 10.1177/0142331215587568 [DOI] [Google Scholar]
- Zoubek L, Charbonnier S, Lesecq S, Buguet A, & Chapotot F (2007). Feature selection for sleep/wake stages classification using data driven methods. Biomedical Signal Processing and Control, 2(3), 171–179. 10.1016/j.bspc.2007.05.005 [DOI] [Google Scholar]
Associated Data
This section collects any data citations, data availability statements, or supplementary materials included in this article.