

Abstract
Life in complete darkness has driven the evolution of a suite of troglobitic features in the blind Mexican cavefish Astyanax mexicanus, such as eye and pigmentation loss. While regressive evolution is a hallmark of obligate cave-dwelling organisms, constructive (or augmented) traits commonly arise as well. The cavefish cranium has undergone extensive changes compared to closely-related surface fish. These alterations are rooted in both cranial bones and surrounding sensory tissues such as enhancements in the gustatory and lateral line systems. Cavefish also harbor numerous cranial bone asymmetries: fluctuating asymmetry of individual bones and directional asymmetry in a dorsal bend of the skull. This asymmetry is mirrored by the asymmetrical patterning of mechanosensory neuromasts. We explored the relationship between facial bones and neuromasts using in vivo fluorescent co-labeling and micro-computed tomography. We found an increase in neuromast density within dermal bone boundaries across three distinct populations of cavefish compared to surface-dwelling fish. We also show that eye loss disrupts early neuromast patterning, which in turn impacts the development of dermal bones. While cavefish exhibit alterations in cranial bone and neuromast patterning, each population varied in the severity. This variation may reflect observed differences in behavior across populations. For instance, a bend in the dorsal region of the skull may expose neuromasts to water flow on the opposite side of the face, enhancing sensory input and spatial mapping in the dark.
Keywords: Dermal bone, Bone fragmentation, Neuromast, Eye loss, Cranial bend
Graphical Abstract
Introduction
As a consequence of life in total darkness, cave-dwelling organisms evolve regressive (diminished) and constructive (enhanced) phenotypes (Culver, 1982), and many of these changes are rooted in alterations across embryogenesis (Jeffery, 2001). In Astyanax mexicanus cavefish, a deep collection of literature reflects substantial attention towards regressive changes, such as loss or reduction of eyes (Wilkens, 1971; Zilles et al. 1983; Jeffery & Martasian, 1998), pigmentation (Protas et al. 2006; Gross et al. 2009) and surface fish-like behaviors including aggression (Burchards et al. 1985), schooling (Wilkens, 1988; Kowalko et al. 2013) and diurnal activity (Duboué et al. 2012; Beale, 2013; Carlson & Gross, 2018). More recently, constructive traits have come into focus with studies on numerical increases in taste buds (Varatharasan et al. 2009) and teeth (Protas et al. 2008; Atukorala et al. 2013), enhanced lipid stores (Xiong et al. 2018; Riddle, Aspiras et al. 2018) and increased numbers of mechanosensory neuromasts (Teyke, 1990; Montgomery et al. 2001; Yoshizawa et al. 2010).
One area that is difficult to categorize as either regressive or constructive in cavefish are changes to the craniofacial complex. Specifically, an extreme alteration found across cavefish populations is the “fragmentation” of certain craniofacial bones into discrete elements (Mitchell et al. 1977; Yamamoto et al. 2003; reviewed in Gross & Powers, 2015). Because this alteration yields an increase in the number of facial bones, it was originally characterized as constructive (Jeffery, 2001). Further, this trait was among the first phenotypes described in the original scientific description of these fish, shortly after their discovery (Hubbs & Innes, 1936). Fragmentation is a highly unusual phenotype in which the third suborbital (synonymous with infraorbital) bone (SO3), undergoes early and/or late alterations to its ossification program, yielding a mature bone essentially broken into a series of smaller pieces (Yamamoto et al. 2003; Powers et al. 2018a). Hubbs and Innes (1936) proposed this phenotype was caused by injury either sustained during the life of the fish, or during post-mortem handling. However, discovery of the same phenotype in additional cave populations in the 1940s contravened this notion (Alvarez 1946; 1947).
A second alteration to the craniofacial complex is the reduction in the number of suborbital (SO) bones within the circumorbital series in cavefish. This regressive trait occurs through either the spontaneous fusion of bones or the absence of the last bone in the series, the SO6 bone. Finally, a third and extreme alteration to the skull is cranial “bending”, or an anterior-posterior deflection from symmetry, which is solely found in cave-dwelling morphs (Powers et al. 2017). Unlike SO3 fragmentation and SO bone loss, this phenotype is most likely to impact the left (but not the right side) of the cranium. The precise function of these unusual phenotypes remains unknown; however, some evidence suggests these cranial aberrations may be advantageous. First, the SO3 bone autonomously undergoes fragmentation, even when an eye is experimentally re-introduced to the orbit of the cavefish skull (Yamamoto et al. 2003). Additionally, facial bone fragmentation and fusion harbor a robust genetic basis, which is only detectable on one side of the head (Gross et al. 2014). Finally, SO3 fragmentation, a reduction in the number SO bones, and cranial bending have reportedly evolved several times in multiple independent cave localities (Mitchell et al. 1977; Powers et al. 2017).
A constructive trait that mirrors craniofacial patterning, in terms of distribution and asymmetry, are sensory neuromasts. These mechanosensory organs are implicated in a variety of adaptive behaviors in cavefish, including vibration attraction behavior (VAB; Yoshizawa et al. 2010) and lateral swimming preference (Burt de Perera & Braithwaite, 2005). Recently, Yoshizawa et al. (2012) demonstrated that VAB is mediated by neuromasts present in the vicinity of the SO3 bone, and lateral preference is biased towards the left side of the head (Fernandes et al. 2018). Interestingly, Burt de Perera and Braithwaite (2005) found that when introduced to an arena with novel objects, cavefish are biased in their approach, using their right side, which may be associated with convex cranial morphology resulting from a leftward bend.
To this point, however, the relationship between craniofacial alterations, sensation, and adaptive behavior remains unclear. Moreover, it is unknown precisely how these alterations are manifested (or not) across the broad distribution of Astyanax cavefish localities. To better understand the putative relationship between these diverse traits, it is necessary to characterize the integrated anatomical distribution of both phenotypes alongside other regressive traits (such as vision loss). In this report, we present the first robust co-analysis of craniofacial phenotypes and sensory neuromasts across the geographic distribution of cavefish localities.
Our findings show that multiple cavefish populations undergo orbital bone fragmentation, however the architecture and severity of fragmentation differs by locality. Moreover, two types of neuromasts (superficial and canal) are implicated in qualitatively different cranial changes. Superficial neuromasts (SN) are densely distributed atop the SO3 bone in multiple localities (consistent with Yoshizawa et al. 2012), while canal neuromasts (CN), along with regressed eyes, are associated with fewer suborbital bones and variation in orbital shape. Finally, we discovered that cranial bending is present across geographically- and phylogenetically-distinct populations of Astyanax cavefishes, however this bending is variable with respect to severity and direction. This work provides novel insight to the relationship between cranial bone aberrations and constructive sensory enhancements. Collectively, these traits may underlie adaptations to life in complete darkness by augmenting adaptive behaviors evolving in blind, cave-dwelling organisms.
Material and Methods
Fish husbandry
We evaluated three lab-reared populations of Astyanax mexicanus cavefish originating from caves of the Sierra de El Abra region in northeastern Mexico. Surface fish originated from the Río Sabinas and Río Valles drainages near Ciudad Valles, Mexico. Adult brood stock of Pachón (pedigree 138), Tinaja (pedigree 19), Chica cavefish (commercially sourced) and surface fish (pedigree 155) were generously provided by Dr. Richard Borowsky (NYU) and bred for several generations at the University of Cincinnati. Fish were maintained at an aquatic facility in the Gross lab, and experiments were performed with Institutional Animal Care and Use Committee (IACUC) approval (Protocol #10-01-21-01). Adult fish were housed in 5-gallon glass tanks with filtered reverse-osmosis water treated with sodium bicarbonate and Instant Ocean salts to create conditioned system water (pH 7.3±0.2 and conductivity ~800±50μS). All fish were reared on a 12h:12h light/dark cycle at a water temperature of 23±2°C and fed TetraMin Pro flake food once daily.
In vivo fluorescent labeling of dermal bone and neuromasts
Live fish were stained with calcein (Sigma Aldrich C0875) to label bone and 2-(4-(dimethylamino)styryl)-N-ethylpyridinium iodide (DASPEI; Sigma Aldrich D3418) to label canal (CN) and superficial neuromasts (SN) as described in Powers et al. (2018b). For imaging, fish were anesthetized by immersion in ice-cold system water for approximately 15 seconds. Fluorescent images were collected at 7.81x magnification under the GPF (calcein; 488nm) and TXR (DASPEI; 561nm) filters using a Leica stereomicroscope (M205FA) and Leica Application Suite software (LAS v3.8, Wetzlar, Germany). Images were overlaid to visualize bone and neuromasts (Figs. 1, 3 and 5).
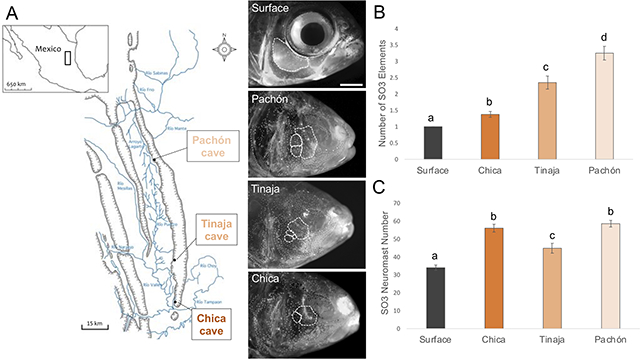
Figure 1. Three geographically-distinct populations of cavefish exhibit bone fragmentation and an increase in the number of SO3 superficial neuromasts.

The species Astyanax mexicanus includes surface-dwelling morphs inhabiting river systems throughout Mexico and cave-dwelling morphs found in caves throughout the El Abra mountain range (A). Fragmentation, as defined by the number of separate suborbital #3 (SO3) bony elements, was assessed for surface fish and three populations of cavefish (B; Chica, Tinaja and Pachón). The number of superficial neuromasts within the SO3 bony region were scored for each population (C). Pairwise t-tests were performed and populations were grouped by statistical significance (a-d). White scale bar set to 3mm. Map adapted from Mitchell et al. (1977).
Figure 3. Neuromasts more densely populate cavefish SO3 bones.

Delaunay triangulation and Voronoi decomposition were used to analyze a metric for the distance between SO3 neuromasts on the SO3 bony landscape (A). Neuromast density (calculated by neuromast number divided by area) was analyzed across each population for superficial neuromasts (B) on the SO3 (white outline) and for the crescent area (defined by the boundary of neuromast canals; red outline). Pairwise t-tests were performed and populations were grouped by statistical significance (a-d, a’-d’). White scale bar set to 3mm.
Figure 5. Cavefish depart from a stereotypical pattern of infraorbital canal neuromasts and suborbital bones.

Surface demonstrate a pattern of 9 infraorbital canal neuromasts (CN; 2 on the SO1–3 bones and 1 on the SO4–6 bones) in > 90% of specimens on both the right (solid gray) and left (gray stripe) sides of the face (A). A representative Chica cavefish exhibits two ectopic CN (11 total), SO3 bone fragmentation and SO4+5 fusion on the left side of the face (B). Tinaja cavefish also depart from the established pattern, with a representative individual having 5 CN, SO3 bone fragmentation, SO4+5 fusion and an absent SO6 bone (C). Additionally, Pachón cavefish also exhibit atypical patterning of CN and SO bones. The representative Pachón cavefish has 8 CN, SO3 bone fragmentation, SO4+5 fusion and an absent SO6 bone (D).
Two-dimensional (2D) measurements within the cranium
Area measurements were carried out using ImageJ software (FIJI v1.0; Bethesda, MD). The ‘polygon’ tool was used to select an area within .tif images. Areas of interest were the SO3 bone and an area defined as the ‘crescent’ as a proxy for the cheek area, encompassing the region under the eye that borders the infraorbital and opercle canals (outlined in red in Fig. 3, n=20 for each population). The length tool in FIJI was used to measure the diameter of the eye orbit, an area surrounded by the infraorbital canal and suborbital bone (Fig. 6). Pixel units were converted to millimeters using Microsoft Excel (v.16.12). Area measurements were normalized using standard (snout-ventral) length in millimeters.
Figure 6. Cavefish without SO6 bones have smaller eye orbits.

Normalized eye orbit diameter was recorded for Chica, Tinaja and Pachón cavefish (A). Volume-rendered micro-CT of representative Pachón cavefish with an SO6 bone (highlighted orange) and without an SO6 bone (gray window) are shown with eye orbits highlighted in blue (B). Pairwise t-tests were performed and populations were grouped by statistical significance (p <0.05 = *, <0.01= **, < 0.001= ***).
Within defined areas, neuromasts were counted using the manual ‘point selection’ tool and the automated ‘find maxima’ function in ImageJ. The Delaunay Voronoi plug-in was used to create a Delaunay triangulation of neuromast spatial distribution within the SO3 bony region (Fig. 3). Delaunay triangulation is a geometric analysis wherein discrete points are connected to form triangles. Each triangle forms a circumcircle and the centers are connected to form a Voronoi diagram of polygons. The Voronoi polygon size serves as a metric for the distance between points in a given space (Lee & Schachter, 1980).
SO bones of each individual were outlined with the ‘freeform’ shape tool and the number of bones (MS PowerPoint v.16.27), degree of SO3 fragmentation, presence/absence of the SO6 (Fig. 6), and any fusion events were noted (Fig. 5). CNs within the SO bones were marked with a diamond shape, and their number and position within the series was recorded. CNs of interest are confined within the infraorbital canal and notably larger than the SNs and were differentiated and counted accordingly (Fig. 5). For all metrics, paired t-tests (StatPlus:mac v6.2.21) were used to compare populations and Bonferroni correction was used to account for multiple comparisons (Tables S1–S9).
Three-dimensional (3D) analysis of SO3 bony metrics
High-resolution micro-computed tomography (micro-CT) scanning was performed at the University of Cincinnati Vontz Imaging Core (Cincinnati, OH). Individual DICOM files (~1,400 x-ray slices) were reconstructed into a three-dimensional skull using the ‘volume-rendering’ tool in Amira software (v.6.0; FEI Company, Hillsboro, OR). SO3 bones were isolated from the cranium using the ‘segmentation’ tool to create surface files for quantitative analysis (Fig. 2). From these files, the surface area (mm2) and volume (mm3) were calculated using the measurement tool. Each SO3 bone was measured in triplicate and averaged for surface area (mm2) and volume (mm3). These values were normalized by standard length of specimen to account for size differences between individuals and populations (Fig. 2, 4).
Figure 2. Cavefish have smaller SO3 bones than surface fish.

Surface area (mm2) was measured on 3D surface files of segmented SO3 bones from micro-computed tomography (Micro-CT) scans (A). Inter-fragment space is devoid of calcified tissue (B). Volume-rendered micro-CT images for Surface, Chica, Tinaja and Pachón specimens are shown with a 3D generated surface of the SO3 (C; pseudo-colored in green). Pairwise t-tests were performed and populations were grouped by statistical significance (a-c).
Figure 4. Bone fragmentation increases SO3 surface area in cavefish.

Surface area was analyzed across groups assigned by binary scores for fragmentation and number of elements in Chica (A), Tinaja (B), and Pachón (C) cavefish. Surface area was plotted against the number of superficial neuromasts on the SO3 bone for each population in a linear regression analysis. The triangle shape represents the mean value for SO3 neuromast number and R scores indicate the correlation coefficient. Pairwise t-tests were performed and populations were grouped by statistical significance (a-b; p <0.05 = *, <0.01= **, < 0.001= ***).
The dorso-cranial bend was calculated based on angle measurements from surface rendered micro-CT images (surface n=25, Chica n=23, Tinaja n=24, and Pachón n=22). Using ImageJ, deflection from midline (the supraoccipital bone) to the most distal points of the left and right maxillary bones was used to determine polarity and degree of asymmetry. An asymmetry index score (Katsumata et al. 2005) was calculated by subtracting the left-side angle of deflection from the right-side in each individual, with positive indices indicating a leftward bend (Fig. 7).
Figure 7. Three populations of cavefish exhibit a dorso-cranial bend.

The angle between the supraoccipital bone (midline) and the right and left maxillary bones were measured and an asymmetry index was calculated by subtracting the right-side angle from the left. Surface fish demonstrate dorso-cranial symmetry (A), while Chica (B), Tinaja (C), and Pachón (D) cavefish exhibit a dorso-cranial bend. Positive asymmetry index scores indicate a bend to the left, a score of zero indicates perfect symmetry, and negative scores depict a bend to the right.
Results
Multiple cavefish populations exhibit alterations in suborbital bone architecture
Consistent with historical accounts (Hubbs & Innes, 1936; Alvarez, 1946; 1947; Mitchell et al. 1977), we observed fragmentation of the SO3 bone across three geographically-distinct populations of cavefish (Fig.1A). Surface fish rarely display bone fragmentation in nature and we did not observe any cases of fragmentation in our experimental group. Interestingly, we discovered variation in severity of fragmentation across cavefish populations. Pachón cavefish exhibited the highest degree of fragmentation (90%, on at least one side of the face) and a range of SO3 elements from 1 – 7 (mean = 3.25; Fig. 1B). Tinaja cavefish showed an intermediate degree of SO3 fragmentation (70%) with the number of elements ranging from 1 – 6 (mean = 2.35; Fig. 1B). Chica cavefish had the lowest frequency of SO3 bone fragmentation (32.5%), which were least severe, ranging from 1 – 3 elements (mean = 1.35; Fig. 1B). The average number of SO3 fragments was significantly different across each population (Table S1).
We previously reported that Pachón cavefish have smaller SO3 bones compared to surface fish (Powers et al. 2018a). These measurements were conducted from 2D microscopy (lateral view) images in juvenile fish (<1 year). Using micro-CT imaging, we created 3D surface models of the SO3 bones in adult fish (Fig. 2C). In cavefish with SO3 bone fragmentation, bony fragments completely separated with no calcified tissue within the inter-fragment space (Fig. 2B), consistent with previous findings (Powers et al. 2018a).
From our 3D models, we measured bony surface area (mm2) and volume (mm3) for SO3 bones in surface fish and three populations of cavefish (Fig. 2A). Interestingly, we observed no difference between normalized SO3 surface area in surface fish (0.31mm2/SL) and Chica cavefish (0.30mm2/SL; Fig. 2A). Pachón and Tinaja cavefish, however, showed a significant decrease in SO3 surface area. Pachón cavefish had an SO3 surface area of 0.23mm2/SL, and Tinaja cavefish had the smallest SO3 surface area of 0.19mm2/SL (Fig. 2A). The average SO3 surface area was significantly different between each cavefish population (Table S2).
Next, we evaluated whether the process of bone fragmentation impacts SO3 size. In all three cavefish populations, fragmented SO3 bones yielded a significantly larger surface area than unfragmented bones (Fig. 4A–C). Interestingly, when surface area was binned by number of separate elements, we found that there was a significant increase in SO3 surface area when bones were fragmented into 3 elements for all three cavefish populations (Fig. 4A–C; Table S3–S5). In SO3 bones with 4+ fragments, however, surface area was not increased. Similarly, bone fragmentation was associated with an increase in SO3 volume (Fig. S1). In summary, cavefish have smaller SO3 bones than surface fish, and fragmentation increases SO3 surface area and volume.
Cavefish SO3 bones are densely populated by superficial neuromasts
Previously, we reported an increase in the number of SNs within the boundaries of the SO3 bone in cavefish (Gross et al. 2016). Interestingly, neuromast patterning on the SO3 bone is more asymmetric in cavefish compared to surface fish (Gross et al. 2016), mirroring asymmetries in SO3 bone fragmentation. Because superficial neuromasts in this region are associated with cave-adapted behaviors (Yoshizawa et al. 2010; 2012), we evaluated SN number and density on the SO3 bone across multiple populations. Three cavefish populations exhibited significantly more SNs on the SO3 bone compared to surface fish (Fig. 1C). Pachón and Chica cavefish exhibit a similar number of SO3 SN (mean = 58.53 and 56.03, respectively), followed by Tinaja cavefish (mean = 44.83), while surface fish had the fewest (mean = 34; Fig. 1C; Table S6).
Next, we analyzed SO3 SN density, i.e. the number of SO3 SN over SO3 area (mm2). Similar to SO3 SN number, all cavefish populations exhibit a higher SO3 SN density compared to surface fish (Fig. 3B). Pachón cavefish had a significantly higher SO3 SN density than other populations (mean = 17.31 SO3 NM/area). Tinaja and Chica cavefish had similar SO3 SN densities (mean = 12.73 and 12.09, respectively), while surface fish had significantly lower SO3 SN density (mean = 9.16; Table S7). We also evaluated neuromast density in the facial region we termed the ‘crescent’, bounded by the infraorbital and suborbital canals (Methods, Fig. 3). Similar to SO3 SN density, cavefish populations exhibited significantly higher SN density in the crescent compared to surface fish (Fig. 3B; Table S8). We also analyzed the ‘distance’ between SNs on the spatial landscape of the SO3 bone using Delaunay triangulation and Voronoi diagrams (Fig. 3A; Table S9). Surface fish had significantly larger distances (i.e., lower density) between SO3 SN (36.83) compared to the cavefish populations: Chica (33.57), Tinaja (30.71) and Pachón (28.31).
Finally, using linear regression, we determined that larger SO3 bones were correlated with an increase in the number of SO3 SN in each cavefish population (Fig. 4A–C; Chica R=0.98, Tinaja R=0.94, and Pachón 0.98). It is possible that bone fragmentation increases SO3 surface area and volume in cavefish, allowing for a concomitant increase of SO3 SN that mediate cave-associated behaviors.
Cavefish depart from stereotypical patterning of infraorbital canal neuromasts and suborbital bones
Similar to aberrant and asymmetrical patterns of superficial neuromasts, cavefish exhibit changes in canal neuromast patterning (Wilkens, 1989; Powers et al. 2018b). We characterized canal neuromasts (CN) within the infraorbital canal that runs through the suborbital (SO) bones. Surface fish conform to a stereotypical pattern of CN patterning with 9 CN associated with 6 SO bones: 2 CN for each SO1–3 and 1 CN for SO4–6 (Powers et al. 2018b). Adult surface fish from our experimental group adhered to this stereotypical pattern in >90% of observations (Fig. 5A). All three populations of cavefish, however, deviated from stereotypical patterning. Owing to bone fragmentation, spontaneous fusions, and bone loss, cavefish rarely exhibited a typical pattern of 6 bones within the circumorbital series (Chica 28.5%, Tinaja 34%, and Pachón 28.5%; Fig. 5B–D). Similarly, cavefish rarely had 9 CN (Chica 23.5%, Tinaja 10.5%, and Pachón 36.5%). We did not observe, however, any significant left-right differences in SO or CN patterning in any of the populations (Fig. 5A–D).
Powers et al. (2018b) previously demonstrated that CNs serve as ossification centers for SO bones. We found no correlation between the number of CN and SO3 bone fragmentation (i.e. ectopic CN do not produce SO3 fragments) in each of the cavefish populations. We did find, however, that when the ninth CN was missing, the SO6 bone was also absent. This was never observed in surface fish. In cavefish, however, the terminal (or ninth) CN was missing in ~76% (Tinaja and Pachón) and ~83% (Chica) of the individuals we assayed (Fig. 5B–D). In all instances, the SO6 bone was also absent.
Eye loss contributes to variation in orbital shape, impacting canal neuromast and suborbital bone patterning
We hypothesized that eye loss and the collapse of the eye orbit during craniofacial development may disrupt CN patterning, impacting SO bone development. To determine if eye loss (and subsequent orbital collapse) influences CN and SO bone patterning, we measured the diameter of the eye orbit normalized to SL (Fig. 6A). Cavefish showed variation in eye orbit size across populations, with Chica having the largest eye orbit (mean = 0.29mm/SL), followed by Tinaja (mean = 0.23mm/SL) and then Pachón (mean = 0.21mm/SL). Similar to CN patterning, we did not find evidence of directional asymmetry in eye orbit size for any cavefish population.
Individual fish were binned into groups with and without SO6 bones (Fig. 6A). Chica cavefish with an SO6 bone (0.30mm/SL) had significantly larger eye orbits compared with those missing an SO6 bone (0.25mm/SL; p=0.0004). Similarly, Tinaja cavefish with an SO6 bone (0.22mm/SL) had significantly larger eye orbits than those missing an SO6 bone (0.17mm/SL; p<0.0001). Lastly, Pachón cavefish with an SO6 present (0.23mm/SL) had significantly larger eye orbits than when the SO6 bone was absent (0.21mm/SL; p=0.013).
Cavefish exhibit a variable dorso-cranial bend compared to symmetric skulls in surface fish
We previously described a dorso-cranial bend in adult Pachón and Tinaja cavefish based on geometric morphometric analyses (Powers et al. 2017). We assessed the presence and severity of a bend in surface fish and three cavefish populations (Methods). Surface fish skulls showed little deviation from an asymmetry index of 0, indicating dorso-cranial symmetry (Fig. 7A). Chica cavefish, however, exhibited both positive (up to 7.5) and negative (down to −5.8) scores, suggesting fluctuating asymmetry of the dorso-cranial bend in this population (Fig. 7B). Tinaja cavefish had mostly positive asymmetry index scores (indicating an overall leftward bias), however, bending was less extreme (up to 5.6; Fig. 7C). Pachón cavefish exhibited a clear and extreme leftward bias, with asymmetry indices up to 12.1 (Fig. 7D). Despite observed lateral asymmetries in number of SO3 bone fragments or SO3 SN patterning, neither were found to be associated with the directional dorso-cranial bend.
Discussion
Distinct populations of cavefish demonstrate variability in constructive craniofacial traits
Jeffery (2001) categorized both bone fragmentation and the increase in cranial neuromasts as constructive traits in cavefish. Typically, experiments in Astyanax cavefish have focused on comparing a single cave population (usually Pachón) with surface fish. Here, we describe the evolution of both traits across three geographically- and phylogenetically-distinct populations of cavefish. We found that while each population harbors an increase in both SO3 bone number and SO3 SN compared to surface fish, the results are variable across cave populations. Pachón cavefish showed the greatest severity in bone fragmentation and a large increase in SN number. Chica cavefish, however, harbor the least severe bone fragmentation, but had a similar increase in SO3 SN to Pachón. Conversely, Tinaja exhibit bone fragmentation similar to Pachón, but had the least number of SNs within the SO3 region. Further, we also found variability in SO3 SN density with Pachón having the highest, Tinaja intermediate and Chica and with the lowest.
The variation we observed in these constructive traits may be the result of the complex phylogenetic history between cave systems (reviewed in Gross, 2012). For example, the Pachón cave population has been characterized as a phylogenetically old population (Wilkens, 1988; Coghill et al. 2014) with low genetic diversity (Strecker et al. 2003). Chica cavefish have been described as originating from the same lineage as Pachón (Downing et al. 2002; Ornelas-García et al. 2008), however, they have been classified as having high genetic diversity (Strecker et al. 2003). Like Pachón, the Tinaja cavefish population has been described as having low genetic diversity (Strecker et al. 2003), however, was found to have originated from a different lineage (Downing et al. 2002; Ornelas-García et al. 2008).
Bradic et al. (2012) suggested that gene flow from surface to cave populations (and even between cave populations) has occurred historically and is likely continuing. This was supported by work from Herman et al. (2018), which suggested that evidence of hybridization may explain variability in cave-associated traits. Haudorf et al. (2011) suggested eye size variability within Chica cavefish may be explained by periodic hybridization with surrounding surface fish populations. If Chica cavefish experience an increase in hybridization, they may resemble surface fish more closely in terms of SO3 bone number and SN density. For other cavefish populations, however, it is unclear the extent to which Pachón and Tinaja cavefish undergo hybridization. Espinasa et al. (2014) argued that nutrient limitations in the caves can impede hybridization because invading surface fish cannot survive long enough to procreate. It is also possible that some caves are better suited for hybridization than others owing to geological and environmental conditions.
While SO3 bone fragmentation and SN number are characterized as constructive traits because bone and SN number both show an increase in cavefish (Jeffery, 2001), whether they are adaptive is unclear. In particular, it is possible that bone fragmentation is not of biological relevance in cavefish and occurs as a consequence of genetic drift. It is difficult to imagine bone fragmentation as a beneficial trait, yet it has been observed across multiple cavefish populations derived from distinct lineages (Alvarez 1946; 1947; Mitchell et al. 1977) and harbors a genetic basis (Gross et al. 2014). Here, we show that bone fragmentation can increase SO3 surface area and that increased surface area is positively correlated with an increase in SO3 SNs (Fig. 4). It is also possible that bone fragmentation facilitates SN proliferation, increasing sensory input in the absence of vision. SNs are important for promoting wakefulness (Jaggard et al. 2017), rheotaxis (Kulpa et al. 2015) and vibration attraction behavior (Yoshizawa et al. 2010). Jeffery (2009) discusses pleiotropy as a possible evolutionary mechanism for eye regression citing a positive association between shh expression and taste bud enhancement and conversely a negative association with eye development. Therefore, it is possible that SO3 fragmentation evolved via indirect selection for neuromast proliferation. Future studies should evaluate cave-associated behaviors across populations with variability in SO3 bone fragmentation and SN number in order to determine how they may mediate cave-associated behaviors.
Mechanosensory neuromast patterning influences skeletal traits in cavefish
Jeffery and Yamamoto (2000) hypothesized that changes in SO bone structure are caused by either an expansion into the collapsed eye orbit, or alternatively, the formation of ectopic ossification centers during development. They suggested that formation of new ossification centers may result from more cranial neuromasts (Schemmel, 1967; Jollie, 1975). Indeed, SO3 fragments can originate from ectopic ossification (Yamamoto et al. 2003), but more frequently, separate elements arise from post-ossification bone remodeling (Powers et al. 2018a). These mechanisms were described in Pachón, and therefore it is unknown if these same mechanisms are involved in other cavefish populations. With the expansion of the lateral line in cavefish, the cranial nerves that innervate the neuromasts have also expanded (Sumi et al. 2015), especially within the cheek region where the SO3 resides. Underlying cranial nerves may recruit bone remodeling cells (osteoclasts) to resorb SO3 bony tissue causing fragmentation, although this remains to be tested. While it is unclear whether SN are involved in alterations to SO bones, CN show a clear role in SO patterning.
We previously described the developmental patterning of CN and SO bones in juvenile surface and Pachón cavefish, showing that CN serve as ossification centers for SO bones (Powers et al. 2018b). Here, we characterized the CN and SO bone pattern in adult surface and three populations of cavefish. All three cavefish populations depart from the stereotypical pattern observed in surface fish. Cavefish do not demonstrate a clear polarity (increase or decrease) in the number of CN within the infraorbital canal. Therefore, it is unclear whether changes to the CN pattern confer a change in sensory perception. CN patterning, however, does influence SO bone patterning. When CN are positioned too closely together, SO bones fuse (Powers et al. 2018b). Further, when the last CN in the infraorbital chain is absent, the SO6 bone fails to form. We observed this in each cavefish population, but never in surface fish.
Yamamoto et al. (2003) hypothesized that the loss of the eye in cavefish could influence the morphogenesis of the orbital bones. They tested this by performing an experimental lentectomy wherein they transplanted a surface fish lens into a cavefish embryo, inducing eye formation and restoring orbital shape. Interestingly, SO3 bone number was not affected by eye development. The authors did find, however, that when experimental cavefish formed an eye, the SO series developed in a stereotypical pattern without bony fusion or the loss of the SO6 bone (Yamamoto et al. 2003). This suggests that the development of a circular eye orbit is necessary for maintaining SO bone patterning.
We tested this by looking at eye orbit diameter, CN and SO bone patterning in surface fish and the three populations of cavefish. Similar to Yamamoto et al. (2003), we found that surface fish always had an SO6 bone. In approximately 25% of cavefish (across each population), the terminal CN (CN9) in the infraorbital canal was absent along with the SO6 bone. When we measured the eye orbit diameter in cavefish with missing SO6 bones versus fish with SO6 bones present, we found that cavefish with smaller eye orbits were more likely to lack CN9s and therefore SO6 bones. This suggests that eye regression and subsequent orbital collapse in early development disrupts CN patterning, which later prevents ossification in the SO6 region. Interestingly, in Chica specimens with SO6 absent, the eye orbit was larger than Tinaja and Pachón when the SO6 was present. This may reflect global cranial differences between populations.
Alternatively, genes involved in eye development, rather than orbital morphology, may influence CN, and in turn SO bone patterning. This could occur through a disruption in CN migration or proliferation. Jeffery et al. (2000) found that increased expression of shh is involved in eye degradation through apoptosis, as well as taste bud and oral jaw expansion. However, shh expression was not correlated with an increase the number of neuromasts or alterations in SO bone morphology. To date, there have not been any quantitative trait loci (QTL) genetic association studies identifying an overlap between eye size, neuromast and SO bone number QTL. Yoshizawa et al. (2012), however, did identify overlapping QTL associated with a decrease in eye size and an increase in the number of eye orbit SN. Since different cavefish populations demonstrate variability in eye size reduction, it will be interesting to look further into possible pleiotropic interactions between genes co-regulating eye size and constructive craniofacial traits.
Cranial bending in adult cavefish may evoke sensory laterality
Along with laterally asymmetric traits, cavefish exhibit a dorso-cranial bend compared to symmetric skulls in surface fish. While global skull asymmetry in fish is rare, notable examples include flatfishes (Friedman, 2008) and scale-eating cichlids (Hori, 1993). Interestingly, in flatfishes (Friedman, 2008), scale-eating cichlids (Takeuchi et al. 2016), and Astyanax cavefish (Powers et al. 2017), individuals are more symmetric as juveniles, but shift towards an asymmetric skull in adults. This is likely attributed to behavioral changes across life history. For example, scale-eating cichlids feed on zooplankton as juveniles, but switch to selectively feeding on one side of the flank of their prey fish as adults (Takeuchi et al. 2016). This asymmetric morphology and behavior observed in scale-eating cichlids is associated with laterality in neuroanatomy (Lee et al. 2017). Further, Lee et al. (2017) show differences in gene expression specific to the telencephalon, known as a region for sensory processing, suggesting that asymmetric morphology and lateralized behavior are integrated with sensory processing.
In the present study, we found that Pachón and Tinaja cavefish demonstrate a dorso-cranial bend virtually always biased toward the left. In contrast, Chica cavefish showed variability in bend, fluctuating between the right and left. Windsor et al. (2014) suggested that dorsal symmetry in the fish skull causes a sensory ‘blind spot’ in terms of decreased exposure of lateral SN to water flow. Therefore, a deviation from dorso-cranial symmetry likely exposes the side of the face opposite of the bend to increased water flow (Sharma et al. 2009). An increase in the flow field allows for better spatial mapping of surroundings in the absence of visual input.
If the bend indeed serves to simply increase exposure of neuromasts to water flow, it could be assumed that the skull would drift between left- and right-bending individuals, which is what we observed in the Chica population. In the Pachón and Tinaja populations, however, we found that most individuals exhibit a directional bias toward the left. A likely explanation is that a leftward bend (exposing right-side SN to water flow) confers sensory handedness (discussed in Powers et al. 2017) as a cave-associated trait. Cavefish exhibit ‘wall-following’ behavior comprised of unidirectional swimming near tank boundaries (Sharma et al. 2009). It is possible that cavefish exhibit lateral preference in sensation similar to a human navigating a dark room using their dominant hand.
The dorso-cranial bend in the cavefish skull is likely related to cave-adapted behaviors. Yoshizawa et al. (2010) characterized vibration attraction behavior (VAB) in multiple populations of cavefish. Interestingly, Tinaja and Chica cavefish do not exhibit strong VAB compared to Pachón cavefish (Yoshizawa, 2015), underscoring the variability in behavior across cavefish populations. Fernandes et al. (2018) went on to discover an asymmetric association between SN and VAB, with the left side SO3 SN showing a stronger VAB level compared to the right. This is not the first observation of laterality in cavefish behavior. Burt de Perera & Braithwaite (2005) found that Astyanax cavefish preferentially use their right-side lateral line during swimming behavior assays. Interestingly, lateral line use correlates with use of the left hemisphere of the brain (McCormick, 1989). Taken together, it appears that cavefish use their left-sided SN for VAB (Fernandes et al. 2018) and their right-sided SN to investigate novel stationary objects (Burt de Perera & Braithwaite, 2005). It is possible that the bend in the skull serves to enhance spatial mapping on the right-side (opposite of the bend), while the SN on the side of the bend have a reduced exposure to water flow, but an enhanced preference for sensing vibration.
While both SN and CN exhibit lateral asymmetry in number and spatial distribution (Gross et al. 2016; Powers et al. 2018b), there is not a clear directional bias for an increase on either side of the face. Neuromast patterning is established in early juveniles (Hinaux et al. 2011; Powers et al. 2018b) when the cranium is symmetric (Powers et al. 2017). As the dorso-cranial bend manifests in adult cavefish, it may facilitate a change in the neuromasts on the opposite side of the bend, increasing sensitivity. Future experiments should test the sensitivity of SN on the side opposite of the bend for both left and right bending fish.
Conclusions
Here, we provide evidence for sensory-skeletal integration during the development of the cavefish craniofacial complex, which has undergone extensive changes over the course of evolution. In particular, alterations to dermal facial bones have been difficult to categorize as regressive or constructive evolutionary changes. We show that three distinct populations of cavefish exhibit an increase in the number of facial bones (SO3 fragmentation) as well as an enhancement of superficial neuromasts (SN) positioned on these bones. Alterations to the early developmental pattern of canal neuromasts (CN), likely during eye loss, impact the positioning of facial bones later during development in cavefish. Finally, cavefish exhibit a dorso-cranial bend that varies in severity and directional bias across distinct populations. Changes to the skull and the augmentation of the cranial lateral line likely evolved in concert to mediate cave-adapted behaviors. Future behavioral studies are necessary to determine if there is a relationship between the dorso-cranial bend and sensory neuromast-mediated behaviors.
Supplementary Material
Supplemental Figure 1. Bone fragmentation increases SO3 volume in cavefish. Volume (voxels converted to mm3) was measured for each population and assigned to groups based on binary scores for bone fragmentation and number of SO3 elements in Chica (A), Tinaja (B), and Pachón (C) cavefish. Pairwise t-tests were performed and populations were grouped by statistical significance (a-c).
Acknowledgments
The authors would like to acknowledge present and past members of the Gross lab for helpful discussions regarding this project. We wish to especially thank Jenny Sung, Shane Kaplan and Andrew Gangidine for assistance with imaging and data cataloguing, as well as Dr. Brian Carlson for data analysis advice. We would also like to acknowledge the University of Cincinnati Vontz Center for Imaging Laboratory (VCIL) for performing micro-CT scanning services. This work was supported by funding (to J.B.G) from the US National Institute of Health (NIDCR R01-DE025033) and the US National Science Foundation (DEB-1457630). A.K.P. is supported by the Ruth L. Kirschstein NRSA Individual Fellowship (NIAMS 1F32AR076187-01).
Footnotes
Data deposition: All raw data used for analysis in this manuscript can be found in the supplemental materials.
References
- Alvarez J (1946). Revisión del género Anoptichthys con descripción de una especies nueva (Pisc. Characidae). Anales de la Escuela Nacional de Ciencias Biológicas Mexico, 4, 263–282 [Google Scholar]
- Alvarez J (1947). Descripción de Anoptichthys hubbsi caracindo ciego de La Cueva de Los Sabinos. S. L. P. Revisita de la Sociedad Mexicana de Historia Natural, 8, 215–219. [Google Scholar]
- Atukorala ADS, Hammer C, Dufton M, & Franz-Odendall TA (2013). Adaptive evolution of the lower jaw dentition in Mexican tetra (Astyanax mexicanus). Evolutionary Development, 4, 1–11. [DOI] [PMC free article] [PubMed] [Google Scholar]
- Beale A, Guibal C, Tamai TK, Klotz L, Cowen S, Peyric E, Reynoso VH, Yamamoto Y, & Whitmore D (2013). Nature Communications, DOI: 10.1038/ncomms3769. [DOI] [PubMed] [Google Scholar]
- Borowsky R (2013). Eye regression in blind Astyanax cavefish may facilitate the evolution of an adaptive behavior and its sensory receptors. BMC Biology, 11, 1–3. [DOI] [PMC free article] [PubMed] [Google Scholar]
- Bradic M, Beerli P, García-de León FJ, Esquivel-Bobadilla S, & Borowsky RL (2012). Gene flow and population structure in the Mexican blind cavefish complex (Astyanax mexicanus). BMC Evolutionary Biology, 12, 10.1186/1471-2148-12-9. [DOI] [PMC free article] [PubMed] [Google Scholar]
- Burchards H, Dölle A, & Parzefall J (1985). Aggressive behaviour of an epigean population of Astyanax mexicanus (Characidae, Pisces) and some obervations of three subterranean populations. Behavioural Processes, 11, 225–235. [DOI] [PubMed] [Google Scholar]
- Burt de Perera T & Braithwaite VA (2005). Laterality in a non-visual sensory modality – the lateral line of fish. Current Biology, 15, 241–242. [DOI] [PubMed] [Google Scholar]
- Carlson BM & Gross JB (2018). Characterization and comparison of activity profiles exhibited by the cave and surface morphotypes of the blind Mexican tetra, Astyanax mexicanus. Comparative Biochemistry and Physiology, Part C, 208, 114–129. [DOI] [PMC free article] [PubMed] [Google Scholar]
- Coghill LM, Hulsey CD, Chaves-Campos J, García de Leon FJ, & Johnson SG (2014). Next generation phylogeography of cave and surface Astyanax mexicanus. Molecular Phylogenetics and Evolution, 79, 368–374. [DOI] [PubMed] [Google Scholar]
- Culver DC (1982). Cave life: evolution and ecology. Cambridge, MA: Harvard University Press. [Google Scholar]
- Dowling TE, Martasian DP, & Jeffery WR (2002). Evidence for multiple genetic forms with similar eyeless phenotypes in the blind cavefish, Astyanax mexicanus. Molecular Biology and Evolution, 19, 446–455. [DOI] [PubMed] [Google Scholar]
- Duboué ER, Borowsky RL, & Keene AC (2012). Β-Adrenergic signaling regulates evolutionarily derived sleep less in the Mexican cavefish. Brain, Behavior and Evolution, 80, 233–243. [DOI] [PubMed] [Google Scholar]
- Espinasa L, Bibliowicz J, Jeffery WR, & Rétaux S (2014). Enhanced prey capture skills in Astyanax cavefish larvae are independent from eye loss. EvoDevo, 5, 1–7. [DOI] [PMC free article] [PubMed] [Google Scholar]
- Fernandes VFL, Macaspac C, Lu L, & Yoshizawa M (2018). Evolution of the developmental plasticity and a coupling between left mechanosensory neuromasts and an adaptive foraging behavior. Developmental Biology, 441, 262–271. [DOI] [PubMed] [Google Scholar]
- Friedman M (2008). The evolutionary origin of flatfish asymmetry. Nature, 454, 209–212. [DOI] [PubMed] [Google Scholar]
- Gross JB, Borowsky R, & Tabin CJ (2009). A novel role for Mc1r in the parallel evolution of depigmentation in independent populations of the cavefish Astyanax mexicanus. PLoS Genetics, 5, 1–14. [DOI] [PMC free article] [PubMed] [Google Scholar]
- Gross JB (2012). The complex origin of Astyanax cavefish. BMC Evolutionary Biology, 12, 105. [DOI] [PMC free article] [PubMed] [Google Scholar]
- Gross JB & Powers AK (2015). The evolution of the cavefish craniofacial complex: Biology and Evolution of the Mexican Cavefish (1st ed.). San Diego, CA: Elsevier. [Google Scholar]
- Gross JB, Stahl BA, Powers AK, & Carlson BM (2016). Natural bone fragmentation in the blind cave-dwelling fish, Astyanax mexicanus: candidate gene identification through integrative comparative genomics. Evolution and Development, 18, 7–18. [DOI] [PMC free article] [PubMed] [Google Scholar]
- Gunter H & Meyer A (2013). Trade-offs in cavefish sensory capacity. BMC Biology, 11, 1–3. [DOI] [PMC free article] [PubMed] [Google Scholar]
- Hausdorf B, Wilkens H, & Strecker U (2011). Population genetic patterns revealed by microsatellite data challenge the mitochondrial DNA based taxonomy of Astyanax in Mexico (Characidae, Teleostei). Molecular Phylogenetics and Evolution, 60, 89–97. [DOI] [PubMed] [Google Scholar]
- Herman A, Brandvain Y, Weagley J, Jeffery WR, Keene AC, Kono TJY, Bilandžija H, Borowsky R, Espinasa L, O’Quin K, Ornelas-García CP, Yoshizawa M, Carlson B, Maldonado E, Gross JB, Cartwright RA, Rohner N, Warren WC, & McGaugh SE (2018). The role of gene flow in rapid and repeated evolution of cave-related traits in Mexican tetra, Astyanax mexicanus. Molecular Ecology, 27, 4397–4416. [DOI] [PMC free article] [PubMed] [Google Scholar]
- Hinaux H, Pottin K, Chalhoub H, Père S, Elipot Y, Legendre L, & Rétaux S (2011). A developmental staging table for Astyanax mexicanus surface fish and Pachón cavefish. Zebrafish, 8, 155–165. [DOI] [PubMed] [Google Scholar]
- Hori M (1993). Frequency-dependent natural selection in the handedness of scale-eating cichlid fish. Science, 260, 216–219. [DOI] [PubMed] [Google Scholar]
- Hubbs CL & Innes WT (1936). The first known blind fish of the family Characidae: A new genus from Mexico. Occasional Papers of the Museum of Zoology, 342, 1–10. [Google Scholar]
- Jaggard J, Robinson BG, Stahl BA, Oh I, Masek P, Yoshizawa M, & Keene AC (2017). The lateral line confers evolutionarily derived sleep loss in the Mexican cavefish. Journal of Experimental Biology, 220, 284–293. [DOI] [PubMed] [Google Scholar]
- Jeffery WR & Martasian DP (1998). Evolution of eye regression in the cavefish Astyanax: Apoptosis and the Pax-6 gene. American Zoologist, 38, 685–696. [Google Scholar]
- Jeffery WR, Strickler AG, Guiney S, Heyser DG, & Tomarev SI (2000). Prox1 in eye degeneration and sensory organ compensation during development and evolution of the cavefish Astyanax. Development Genes and Evolution, 210, 223–230. [DOI] [PubMed] [Google Scholar]
- Jeffery WR (2001). Cavefish as a model system in evolutionary developmental biology. Developmental Biology, 231, 1–12. [DOI] [PubMed] [Google Scholar]
- Jeffery WR (2009). Regressive evolution in Astyanax cavefish. Annual Reviews of Genetics, 43, 25–47. [DOI] [PMC free article] [PubMed] [Google Scholar]
- Jollie M (1975). Development of the head skeleton and pectoral girdle in Esox. Journal of Morphology, 147, 61–88. [DOI] [PubMed] [Google Scholar]
- Katsumata A, Fujishita M, Maeda M, Ariji Y, Ariji E, Langlais MS (2005). 3D-CT evaluation of facial asymmetry. Oral Surgery, Oral Medicine, Oral Pathology, Oral Radiology, and Endodontology, 99, 212–220. [DOI] [PubMed] [Google Scholar]
- Kowalko JE, Rohner N, Rompani SB, Peterson BK, Linden TA, Yoshizawa M, Kay EH, Weber J, Hoekstra HE, Jeffery WR, Borowsky R, & Tabin CJ (2013). Loss of schooling behavior in cavefish through sight-dependent and sight-independent mechanisms. Current Biology, 23, 1874–1833. [DOI] [PMC free article] [PubMed] [Google Scholar]
- Kulpa M, Bak-Coleman J, & Coombs S (2015). The lateral line is necessary for blind cavefish rheotaxis in non-uniform flow. The Journal of Experimental Biology, 218, 1603–1612. [DOI] [PubMed] [Google Scholar]
- Lee DT & Schachter BJ (1980). Two algorithms for constructing a Delaunay Triangulation. International Journal of Computer and Information Sciences, 9, 219–242. [Google Scholar]
- Lee HJ, Schneider RF, Manousaki T, Kang JH, Lein E, Franchini P, Meyer A (2017). Lateralized feeding behavior is associated with asymmetrical neuroanatomy and lateralized gene expressions in the brain in scale-eating cichlid fish. Genome Biology and Evolution, 9, 3122–3136. [DOI] [PMC free article] [PubMed] [Google Scholar]
- Lloyd E, Olive C, Stahl BA, Jaggard JB, Amaral P, Duboué ER, & Keene AC (2018). Evolutionary shift towards lateral line dependent prey capture behavior in the blind Mexican cavefish. Developmental Biology, 441, 328–337. [DOI] [PMC free article] [PubMed] [Google Scholar]
- McCormick CA (1989). Central lateral line mechanosensory pathways in bony fish: The mechanosensory lateral line. New York, NY: Springer. [Google Scholar]
- Mitchell RW, Russell WH, & Elliott WR (1977). Mexican eyeless characin fishes, genus Astyanax: environment, distribution, and evolution. Special Publications The Museum Texas Tech University, 12, 1–89. [Google Scholar]
- Montgomery JC, Coombs S, & Baker CF (2001). The mechanosensory lateral line system of the hypogean form of Astyanax fasciatus. Experimental Biology of Fishes, 62, 87–96. [Google Scholar]
- Ornelas-García CP, Domínguez-Domínguez O, & Doadrio I (2008). Evolutionary history of the fish genus Astyanax Baird & Girard (1854) (Actinopterygii, Characidae) in Mesoamerica reveals multiple morphological homoplasies. BMC Evolutionary Biology, 8, 10.1186/1471-2148-8-340. [DOI] [PMC free article] [PubMed] [Google Scholar]
- Powers AK, Davis EM, Kaplan SA, & Gross JB (2017). Cranial asymmetry arises later in the life history of the blind Mexican cavefish, Astyanax mexicanus. PLoS ONE, 12, 10.1371/journal.pone.0177419. [DOI] [PMC free article] [PubMed] [Google Scholar]
- aPowers AK, Kaplan SA, Boggs TE, & Gross JB (2018). Facial bone fragmentation in blind cavefish arises through two unusual ossification processes. Scientific Reports, 8, 10.1038/s41598-018-25107-2. [DOI] [PMC free article] [PubMed] [Google Scholar]
- bPowers AK, Boggs TE, & Gross JB (2018). Canal neuromast position prefigures developmental patterning of the suborbital bone series in Astyanax cave- and surface- dwelling fish. Developmental Biology, 441, 252–261. [DOI] [PMC free article] [PubMed] [Google Scholar]
- Protas ME, Hersey C, Kochanek D, Zhou Y, Wilkens H, Jeffery WR, Zon LI, Borowsky R, & Tabin CJ (2006). Genetic analysis of cavefish reveals molecular convergence in the evolution of albinism. Nature Genetics, 38, 107–111. [DOI] [PubMed] [Google Scholar]
- Protas M, Tabansky I, Conrad M, Gross JB, Vidal O, Tabin CJ, & Borowsky R (2008). Multi-trait evolution in a cave fish, Astyanax mexicanus. Evolution and Development, 10, 196–209. [DOI] [PubMed] [Google Scholar]
- Riddle MR, Aspiras AC, Gaudenz K, Peuß R, Sung JY, Martineau B, Peavey M, Box AC, Tabin JA, McGaugh S, Borowsky R, Tabin CJ, & Rohner N (2018). Insulin resistance in cavefish as an adaptation to a nutrient-limited environment. Nature, 555, 647–651. [DOI] [PMC free article] [PubMed] [Google Scholar]
- Schemmel C (1967). Vergleichende untersuchungen an den hautsinnesorganen ober- und unterirdisch lebender Astyanax-formen. Zeitschrift für Morphologie der Tiere, 61, 255–316. [Google Scholar]
- Sharma S, Coombs S, Patton P, & Burt de Perrera T (2009). The function of wall-following behaviors in the Mexican blind cavefish and a sighted relative, the Mexican tetra (Astyanax). J Comp Physiol A, 195, 225–240. [DOI] [PubMed] [Google Scholar]
- Strecker U, Bernatchez L, & Wilkens H (2012). Genetic divergence between cave and surface populations of Astyanax in Mexico (Characidae, Teleostei). Molecular Ecology, 12, 699–710. [DOI] [PubMed] [Google Scholar]
- Sumi K, Asaoka R, Nakae M, & Sasaki K (2015). Innervation of the lateral line system in the blind cavefish Astyanax mexicanus (Characidae) and comparisons with the eyed surface-dwelling form. Ichthyological Research, 62, 420–430. [Google Scholar]
- Teyke T (1990). Morphological differences in neuromasts of the blind cave fish Astyanax hubbsi and the sighted river fish Astyanax mexicanus. Brain, Behavior and Evolution, 35, 23–30. [DOI] [PubMed] [Google Scholar]
- Wilkens H (1971). Genetic interpretation of regressive evolutionary processes: Studies on hybrid eyes of two Astyanax cave populations (Characidae, Pisces). Evolution, 25, 530–544. [DOI] [PubMed] [Google Scholar]
- Wilkens H (1988). Evolution and genetics of epigean and cave Astyanax fasciatus (Characidae, pisces). Evolutionary Biology, 23, 271–367. [Google Scholar]
- Wilkens H, Strecker U, & Yager J (1989). Eye reduction and phylogenetic age in ophidiiform cave fish. Journal of Zoological Systematics and Evolutionary Research, 27, 126–134). [Google Scholar]
- Windsor SP, Tan D, & Montgomery JC (2008). Swimming kinematics and hydrodynamic imaging in the blind Mexican cave fish (Astyanax fasciatus). The Journal of Experimental Biology, 211, 2950–2959. [DOI] [PubMed] [Google Scholar]
- Xiong S, Krishnan J, Peuß R, & Rohner N (2018). Early adipogenesis contributes to excess fat accumulation in cave populations of Astyanax mexicanus. Developmental Biology, 441, 297–304. [DOI] [PubMed] [Google Scholar]
- Yamamoto Y & Jeffery WR (2000). Central role for the lens in cave fish eye degeneration. Science, 289, 631–633. [DOI] [PubMed] [Google Scholar]
- Yamamoto Y, Espinasa L, Stock DW, Jeffery WR (2003). Development and evolution of craniofacial patterning is mediated by eye-dependent and -independent processes in the cavefish Astyanax. Evolution and Development, 5, 435–446. [DOI] [PubMed] [Google Scholar]
- Yamamoto Y & Jeffery WR (2000). Central role for the lens in cave fish eye degeneration. Science, 289, 631–633. [DOI] [PubMed] [Google Scholar]
- Yoshizawa M, Gorički Š, Soares D, & Jeffery WR (2010). Evolution of a behavioral shift mediated by superficial neuromasts helps cavefish find food in darkness. Current Biology, 20, 1631–1636. [DOI] [PMC free article] [PubMed] [Google Scholar]
- Yoshizawa M & Jeffery WR (2011). Evolutionary tuning of an adaptive behavior requires enhancement of the neuromast sensory system. Communicative and Integrative Biology, 4, 89–91. [DOI] [PMC free article] [PubMed] [Google Scholar]
- Yoshizawa M, Ashida G, & Jeffery WR (2012). Parental genetic effects in a cavefish adaptive behavior explain disparity between nuclear and mitochondrial DNA. Evolution, 66, 2975–2982. [DOI] [PMC free article] [PubMed] [Google Scholar]
- Yoshizawa M, Jeffery WR, van Netten SM, & McHenry MJ (2014). The sensitivity of lateral line receptors and their role in the behavior of Mexican blind cavefish (Astyanax mexicanus). The Journal of Experimental Biology, 217, 886–895. [DOI] [PMC free article] [PubMed] [Google Scholar]
- Yoshizawa M, O’Quin KE, & Jeffery WR (2013). Evolution of an adaptive behavior and its sensory receptors promotes eye regression in blind cavefish: response to Borowsky (2013). BMC Biology, 11, 1–3. [DOI] [PMC free article] [PubMed] [Google Scholar]
- Yoshizawa M (2015). The evolution of sensory adaptation in Astyanax mexicanus: Biology and evolution of the Mexican cavefish (1st ed.). Thorofare, NJ: Edwards Brothers Malloy. [Google Scholar]
- Zilles K, Tillmann B, Bennemann R (1983). The development of the eye in Astyanax mexicanus (Characidae, Pisces), its blind cave derivative, Anoptichthys jordani (Characidae, Pisces), and their crossbreds. Cell and Tissue Research, 229, 423–432. [DOI] [PubMed] [Google Scholar]
Associated Data
This section collects any data citations, data availability statements, or supplementary materials included in this article.
Supplementary Materials
Supplemental Figure 1. Bone fragmentation increases SO3 volume in cavefish. Volume (voxels converted to mm3) was measured for each population and assigned to groups based on binary scores for bone fragmentation and number of SO3 elements in Chica (A), Tinaja (B), and Pachón (C) cavefish. Pairwise t-tests were performed and populations were grouped by statistical significance (a-c).