

Abstract
Tumor-associated antigens (TAAs) are self-molecules abnormally expressed on tumor cells, which elicit humoral and cellular immunity and are targets of immunosurveillance. Immunity to TAAs is found in some healthy individuals with no history of cancer and correlates positively with a history of acute inflammatory and infectious events and cancer risk reduction. This suggests a potential role in cancer immunosurveillance for the immune memory elicited against disease-associated antigens (DAAs) expressed on infected and inflammed tissues that are later recognized on tumors as TAAs. To understand probable sources for DAA generation, we investigated in vitro the role of inflammation that accompanies both infection and carcinogenesis. After exposure of normal primary breast epithelial cells to pro-inflammatory cytokines IL1β, IL6, and TNFα, or macrophages producing these cytokines, we saw transient overexpression of well-known TAAs, carcinoembryonic antigen (CEA) and Her-2/neu, and overexpression and hypoglycosylation of MUC1. We documented inflammation-induced changes in the global cellular proteome by 2D Difference Gel Electrophoresis (2D-DIGE) combined with mass spectrometry and identified seven new DAAs. Through gene profiling, we showed that the cytokine treatment activated NF-κB and transcription of the identified DAAs. We tested three in vitro-identified DAAs, Serpin B1, S100A9, and SOD2, and found them overexpressed in premalignant and malignant breast tissues as well as in inflammatory conditions of the colon, stomach, and liver. This new category of TAAs, which are also DAAs, represent a potentially large number of predictable, shared, immunogenic, and safe antigens to use in preventative cancer vaccines and as targets for cancer therapies.
Keywords: Tumor-associated antigens, 2D-DIGE, pro-inflammatory cytokines, breast cancer, cancer vaccines
Introduction
Genetic mutations and epigenetic modifications can lead to cellular transformation and cancer (1). Successful tumor immunosurveillance relies on the recognition of tumor antigens by the immune cells. Tumor antigen discovery efforts have led to the identification of a large number of tumor antigens that are targets of immunity in cancer patients (2). The focus was initially on identifying tumor-specific antigens encoded by mutated genes uniquely present in tumor cells that could elicit antitumor immunity without autoimmunity (3,4). However, spontaneous immune responses to mutated antigens were not often found in cancer patients (5). The majority of antitumor immune responses were instead directed against non-mutated self-antigens that were abnormally expressed in tumor cells compared to normal cells and consequently named tumor-associated antigens (TAAs). TAAs include overexpressed molecules such as Her-2/neu (6), MUC1 (7), carcinoembryonic antigen (CEA)(8), Cyclin B1 (9), survivin (10), and mesothelin (11), among others; molecules with dysregulated stage- or tissue-specific expression such as cancer-testis antigens (12) and oncofetal antigens (13); or molecules with altered post-translational modifications such as hypoglycosylated MUC1 (14), aberrantly phosphorylated peptides (15), or aberrantly citrullinated antigens (16). It was later shown that aberrant expression of many of these antigens and the immune response against them could also be detected on premalignant precursors of various cancers (17–19).
Unexpectedly, immune memory responses to some of these well-known TAAs were found not only in patients with cancer but also, albeit with lesser frequency, in healthy individuals with no cancer history (20–22). This immunity correlates with a reduced risk of cancer. For example, antibodies against hypoglycosylated MUC1 are found in women who experience acute infectious or inflammatory events early in life and who then have a reduced risk of ovarian cancer later in life (23–25). Epidemiological studies in lymphoma, stomach, colorectal, breast, and ovarian cancer found that childhood diseases such as chicken pox and pertussis, as well as repeated cold and influenza infections throughout life, significantly decrease life-time risk for these cancers (26). These findings generated a new hypothesis that cancer-risk reduction relies on effective immunosurveillance directed against abnormal self-antigens transiently expressed on infected or inflamed tissues as disease-associated antigens (DAAs) and later on cancer cells as TAAs (25). This hypothesis based on epidemiological observations was tested in a mouse study that showed that influenza-experienced mice better control tumor challenge than naïve mice, through the generation of cellular immunity and long-lasting immune memory against infection-induced DAAs expressed as TAAs on the mouse lung tumor cell line used for the challenge (27). However, the biological processes involved in the changes in self-antigen expression on infected cells and the duration of those changes were not investigated. Because these changes reveal potentially important TAAs for effective cancer immunosurveillance, and thus also targets for cancer immunotherapy or immunoprevention, a robust setting is needed for additional tumor antigen discovery.
Epithelial cells express functional cytokine receptors and can secrete cytokines (28,29). In a model of colitis-associated colon cancer, overexpression of hypoglycosyated MUC1 on intestinal epithelial cells is shown to establish a positive regulation on inflammatory cytokines that promote tumor growth and progression and exert a positive feedback on MUC1 expression (30). Another study finds that macrophages play a role in the promotion of tumor development by interacting with colon cells and changing glycosylation of MUC1 (31). The present study aimed to establish a reproducible in vitro system to test the action of inflammatory cytokines commonly present during infections and in the tumor microenvironement as a biological process responsible for changing self-antigen expression on normal cells turning them into DAAs. We exposed primary human mammary epithelial cells to IL1β, IL6, and TNFα (32), or to soluble products of polarized macrophages. We measured by flow cytometry and immunofluorescence microscopy changes in expression over time of the well-known TAAs MUC1, Her-2/neu, and CEA. We repeated these experiments and reproduced our results in a second system using the immortal but non-transformed mammary epithelial cell line MCF-10A, grown in monolayers or 3D cultures. Using 2D Difference Gel Electrophoresis (2D-DIGE), we compared the whole cell proteomes pre- and post-cytokine treatment and isolated seven differentially expressed DAAs that we characterized by mass spectrometry. We showed that these transiently inflammation-induced DAAs were expressed as TAAs in primary tumor tissues and in other tissues affected by chronic inflammatory conditions.
Materials and methods
Antibodies
Mouse monoclonal antibody 3C6, a gift from the late Dr. Hilgers (Free University, Amsterdam), was used to stain normal MUC1 and human antibody H14K6 (33) to stain the hypoglycosylated form of MUC1. Her-2/neu was detected with Herceptin® (trastuzumab, Genentech Inc., San Francisco, CA, USA) and CEA with antibody CEACAM/CD66e (R&D Systems, Minneapolis, MN, USA). HRP-conjugated anti-SOD2 (sc-133134), anti-S100A9 (sc-376772), and anti-S100A8 (sc-48352) were obtained from Santa Cruz Biotechnology (Dallas, TX, USA). HRP anti-Serpin B1 (OTI3B4) was obtained from Novus Biologicals (Centennial, CO, USA), and HRP β-Actin (13E5) was purchased from Cell Signaling (Danvers, MA, USA). APC-conjugated F(ab’)2 fragment specific to human IgG (Jackson Immunoresearch, West Grove, PA, USA) and FITC-conjugated goat anti-mouse IgG (Invitrogen, Carlsbad, CA, USA) were used as secondary antibodies.
Cell culture and cytokine treatment
Human primary mammary epithelial cells (MEPic) were purchased from ScienCell Research Laboratories, Inc. (Carlsbad, CA, USA) and cultured according to supplier’s instructions. MEPic were used at passages 2 to 5. The MCF10A cell line was purchased from ATCC (Manassas, VA, USA) and was maintained as a monolayer for less than 15 passages in Dulbecco’s Modified Eagle’s Medium-F12 (DMEM/F12) (11320033, Gibco, ThermoFisher Scientific, Waltham, MA, USA) supplemented with 5% horse serum (16050122, Gibco), 1% penicillin/streptomycin (17-602E, Lonza, Bale, Switzerland), 0.5 μg/mL hydrocortisone (37150, StemCell, Cambridge, MA, USA), 100 ng/mL cholera toxin (C-8052, Sigma-Aldrich, Saint-Louis, Mi, USA), 10 μg/mL insulin (1285014, Gibco), and 20 ng/mL recombinant human epidermal growth factor (EGF) (PHG0311, Invitrogen) (MCF10A medium). Both cell lines were regularly tested for Mycoplasma contamination by PCR. Cells were maintained for less than 6 months after receipt from the suppliers and, therefore, were not re-authenticated. All cell lines were maintained at 37 °C in a humidified atmosphere containing 5% CO2.
3D overlay cultures were generated as previously published (34). Briefly, 8-chamber slides (#354118, Falcon CultureSlides, Corning, NY, USA) were coated with 40 µL of Matrigel (Corning ® Matrigel ® Matrix, #356234) and 5000 cells/well were seeded in medium containing 2% Matrigel and EGF (5 ng/mL). 70% confluent cells (monolayers) or 60 mm clusters (3D culture) were stimulated for the specified amount of time with TNFα (R&D Systems (Mineapolis, MN,USA), #210-TA; 12.5 ng/mL), IL1β (R&D Systems, #201-LB; 12.5 ng/mL), and IL6 (R&D Systems, #206-IL; 50 ng/mL) alone or in combination. Cytokine concentrations to be used in the experiments were determined by preliminary experiments on epithelial cultures (Supplementary Figure S1A) and on no change of expression of β-actin as the internal control (Supplementary Figure S1B). Concentrations were in the range of what was previously used to induce MUC1 overexpression in normal mammary epithelial cells (35). Untreated cells in monolayers or 3D clusters were used as controls.
Coincubation with polarized macrophages or their products
Human peripheral blood mononuclear cells (PBMCs) were isolated from buffy coats of healthy blood donors (purchased from Vitalant, Pittsburgh, PA) by Ficoll™ (Sigma-Aldrich) density gradient. Monocytes were sorted by magnetic-activated cell sorting (MACS) using magnetic beads conjugated with anti-human CD14 (CD14 MicroBeads, human, Miltenyi Biotech, Bergish Gladbach, Germany) and cultured for 5 days in RPMI 1640 culture medium and M-CSF (100 ng/mL; R&D systems) to differentiate them into non-polarized (M0) monocyte-derived macrophages. Macrophages were then washed and polarized during 24 hours into M1-like macrophages by incubation with IFNγ (100 ng/mL; R&D system, #285-IF) or into M2-like macrophages by incubation with IL4 (50 ng/mL; R&D Systems, #204-IL) and IL13 (50 ng/mL; R&D Systems, #213-ILB). Control macrophages were incubated in RPMI media only. Macrophages were further activated by adding LPS (20 ng/mL; Sigma-Aldrich) to media containing priming stimuli for another 24 hours (48-hour activation). Cells were washed in PBS, and 24 hours after cytokine removal, supernatant was collected, cytokine secretion measured as described below, and 2 mL of the supernatant was added to each well of MCF10A culture for 72 hours. Alternatively, macrophages were plated simultaneously with untreated MCF10A (targets) to a ratio macrophages/targets of 1:10 and then cultured for 24 hours in MCF10A medium.
Flow cytometry
At the indicated timepoints, 2×10⁵ to 106 MEPiC or MCF10A cells were trypsinized, collected, washed and stained with a viability dye (1:1000 dilution in PBS, Ghost Red 780, #13-0865, TONBO Biosciences, San Diego CA, USA) for 15 minutes at 4 °C. Cells were fixed with a fixation/permeabilization solution (Cytofix/Cytoperm™, Cat No: 554715, BD Biosciences, Franklin Lakes, NJ, USA) for 20 minutes at 4 °C. Cells were stained with anti-CEA antibody (1:100), anti-MUC1 antibody (1:100), trastuzumab (1:2000), and H14K6 (1:200) diluted in flow cytometry buffer (PBS + 1% BSA) for 30 minutes at 4 °C, followed by two washes with BD wash buffer. Cells were then stained with secondary antibodies (see ‘Antibodies” section; 1:200 dilution in flow cytometry buffer) for 30 minutes at 4 °C. Samples were run on a BD Fortessa flow cytometer and 30,000 total events were recorded per sample. Samples were gated based on the negative signal for APC-Cy7 (i.e., live cells) and APC (human) or FITC (mouse) mean fluorescence intensities (MFIs) were measured using FlowJo (BD).
Cytokine-based assays (CBA)
Supernatants were collected as described above for the determination of cytokine production at different time points before, during, and after treatment with pro-inflammatory cytokines or coincubation with macrophage-secreted products. Collected supernatants were stored at −80 °C until used. The LEGENDplex™ (Biolegend, San Diego, CA, USA) bead-based multiplex assay was used to measure the following cytokines : IL1β, IFNα2, IFNγ, TNFα, MCP-1, IL4, IL6, IL8, IL10, IL12p70, IL15, IL17A, IL18, IL23, IL33. A serial dilution of the inflammatory cytokine panel, including a blank, was run on the same plate according to the manufacturer’s instructions and read using a BD Fortessa flow cytometer. Five thousand total events were recorded per sample, and FlowJo (BD) was used to measure the median fluorescence intensity of the PE signal for each population of beads (according to their APC signal). Concentration of a particular analyte was then determined based on the median value of the standard curve using the LEGENDplex™ data analysis software(BioLegend). Cytokines were considered undetectable below 2 pg/mL.
Immunofluorescence microscopy
After 10 days of culture, 3D cultures were treated with proinflammatory cytokines for 72 hours and then fixed in 4% paraformaldehyde for 20 minutes and permeabilized in 0.5% Triton-X100 (Sigma-Aldrich) for 20 minutes. The fixed cells were incubated with 350 µL of 3C6 (1:200), trastuzumab (1:200), and H14K6 antibodies (1:200) for 1 hour at room temperature followed by 1 hour incubation at room temperature with 1:500 secondary anti-mouse Cy3 antibody or FITC-conjugated anti-human IgG (Invitrogen). Nuclei were stained in mounting medium with DAPI (VectorLab, Burlingame, CA, USA). Visualization was performed on an Olympus Fluoview 1000 confocal microscope at the Center for Biologic Imaging, University of Pittsburgh.
2D-DIGE and liquid chromatography/mass spectrometry (LC/MS) analysis
For MEPiC and MCF10A, total cell lysates were generated from a confluent 10 cm2 culture plate by scraping the cells in 100 µL of lysis buffer (7M Urea, 2 M Thiourea, 10 mM Hepes pH 8.0, 10 mM DTT, 4% CHAPS) followed by a 30-minute incubation on ice, 5 cycles of 30s ON/30s OFF sonication (Bioruptor ® Pico, Diagenode, Denville, NJ, USA), and centrifugation for 15 minutes at 14,000 rpm. Extracted proteins were stored at −80 °C. One hundred µg of untreated and treated samples were labelled with Cy3- and Cy5-NHS minimal-labeling DIGE dyes (GE Healthcare, Uppsala, Sweden) diluted in dimethylformamide (DMF) (Sigma) for 30 minutes on ice. Labeling of the two samples was also reversed (reciprocal labeling) and run concurrently on a second 2D-DIGE gel to eliminate dye-dependent differences, constituting a technical replicate (Supplementary Figure S2). First-dimension isoelectric point focusing (IEF) and second-dimension SDS-PAGE were conducted as described (36) with the following modifications. Proteins were separated in the first-dimension on 18 cm pH 3-10NL IPG strips on a Protean i12 IEF cell apparatus (Bio-Rad, Hercules, CA, USA) for 32,000 volt-hours. The samples were then separated on the second-dimension SDS-PAGE in 12% polyacrylamide gels in Tris-glycine-SDS running buffer (12g of Tris (Sigma-Aldrich), 57.6g of Glycine (Sigma-Aldrich), 20 mL of 20%SDS (Bio-Rad) in 4L dH20). After electrophoresis, the gels were fixed in a solution of 40% methanol and 10% acetic acid. The gels were imaged on a custom-built (Dr. Minden laboratory), fluorescent gel imager that housed a robotic spot-cutting head. The resultant fluorescent images were analyzed, and selected spots were then cut from the gels and identified via Nano LC-ESI-MS/MS, as described (37) with no modification. We performed two biological replicates for each cell line and two technical replicates for each biological replicate. After identification, the characteristics of the proteins and their sequences were obtained through the Uniprot database (https://www.uniprot.org). We also predicted the antigenicity of the identifed proteins by determining the number of HLA-A*02 binding epitopes using the NetMHCpan 4.0 server that predicts binding of peptides to any MHC molecule of known sequence using artificial neural networks (ANNs) (http://www.cbs.dtu.dk/services/NetMHCpan/).
Western blotting
Total proteins from untreated and treated MEPiC and MCF10A cells were extracted following the same procedure as described above for 2D-DIGE analysis. 50 ug of proteins were separated by SDS-PAGE and transferred to PVDF membranes (#1620177, Bio-Rad). Blots were incubated for 1 hour at room temperature with the (1:1000) HRP-conjugated antibodies as indicated (see “Antibodies” section). β-actin was used as a loading control. Blots were developed with chemiluminescence reagents (SuperSignal West Pico Substrate, cat. #34580, ThermoFisher).
RNA extraction and qRT PCR
Total RNA was isolated from 90% confluent cell cultures using Qiagen Mini kit (QIAGEN, Germantown, MD, USA) and following manufacturer’s instructions. RNA was either used for cDNA synthesis or directly for Nanostring analysis (see below). First-strand cDNA was synthesized in a volume of 20µL containing 1µg of total RNA, 1µL of random hexamer, 0.5mM dNTPs, and 200U of SuperScript™ IV Reverse Transcriptase (SuperScript IV First-Strand Synthesis System Kit, ThermoFisher). Synthesis of cDNA was performed according to the manufacturer’s protocol with an initial step at room temperature for 10 minutes, followed by 10 minutes at 50°C and 10 minutes at 80°C in a thermocycler (Mastercycler X50s, Eppendorf, Germany). Remaining RNA was removed with an incubation at 37°C for 20 minutes with 1µL/sample of RNase H (SuperScript IV First-Strand Synthesis System Kit). PCR amplification was performed using SYBR™ Green Master Mix (QIAGEN), 2 µL of cDNA as a template, and 1µL of cDNA-specific sense and anti-sense primers shown in Supplementary Table S1 (obtained from Integrated DNA Technologies©, Coralville, IO, USA). PCR was performed for 40 cycles at 95°C for 15s, annealed at the temperature indicated in Supplementary Table S1 for 15s, and 72 °C for 15s in the Step One Plus (Applied Biosystems, Foster city, CA, USA). mRNA expression fold changes were calculated according to the ΔΔCt method (38) and β-actin was used for normalization.
Gene expression profiling
Epithelial cell responses to inflammatory cytokines were examined using nCounter Human Immunology Panel v2 (NanoString Technologies, Seattle, WA, USA). 100 ng of total RNA from each sample was hybridized with 8 µL of the NanoString detection probe-containing mastermix for 16 hours at 67°C. After hybridization, samples were loaded in standard 12-stripe NanoString tubes and purified by the nCounter Prep-station (NanoString). Purified samples were loaded in the analysis cartridge by the Prep-station, and the cartridge containing purified RNA hybrids was analyzed via the MaxFlex nCounter system (NanoString) at the Genomics Research Core (University of Pittsburgh). Data were analysed using the Advanced Analysis function (without correcting for multiple comparison) of the NSolver 4.0 software, following the procedure described in the package instructions (22). Normalization of mRNA content that adjusts for positive control size factors, background noise, and housekeeping gene size factors, as well as differential expression, was performed. A gene was considered significantly overexpressed if associated with an adjusted p < 0.01.
Immunohistochemistry
Human tissue arrays were obtained from BioChain (Newark, CA, USA) and contained 38 cases of unpaired normal, inflamed, and tumor tissues from the digestive tract and glands (#Z7020020) and 18 cases of normal, premalignant, and malignant conditions of the breast (#Z7020010). Slides were deparaffinized by baking overnight at 59°C. Endogenous peroxidase activity was eliminated by treatment with 30% H2O2 for 15 minutes at room temperature. Antigen retrieval was performed by microwave heating in 0.1% citrate buffer for 10 minutes. Non-specific binding sites were blocked with 1% BSA. Reaction with anti-SerpinB1 (1:100), anti-SOD2 (1:100), and anti-S100A9 (1:50) was performed for 1 hour at room temperature. Positive signals were visualized by a DAB Substrate Kit (cat. #550880, BD Pharmingen) according to the manufacturer’s protocol. Histology sections were viewed on an Olympus BX40 microscope. Images were acquired using Leica DFC420 camera and Leica Application Suite version 2.7.1 R1. Images were scored by measuring the percentage of IHC positively labeled cells, 0: 0%; +: <30%; ++: 30 to 60%; and +++: >60%.
Statistical analyses
Significance analyses were performed by using GraphPad Prism software version 7.0 (GraphPad Inc. San Diego, CA). Results were represented as means ± standard error of the mean (SEM) or standard deviation (SD) as specified in the legend. Statistical means and significance were analyzed using unpaired two-tailed student’s t-tests or Dunnett’s multiple comparison tests (two-way ANOVA). Significance for all experiments was defined as follows: *p<0.05, **p<0.01, ***p<0.001.
Results
TAA expression in normal epithelial cells exposed to inflammatory cytokines
Inflammatory cytokines were used to treat primary cultures of epithelial mammary cells (MEPiC) that have low (normal) expression of three well-known TAAs: MUC1, which is aberrantly expressed and hypoglycosylated in a variety of epithelial cancers and in chronic inflammation (39); Her-2/neu, which is overexpressed in over 25% of breast cancers (40); and CEA, which is overexpressed primarily in colorectal cancers but also in breast cancer (41). Cells were incubated for 24, 48, or 72 hours with either single cytokines or a cocktail of IL6 and TNFα or IL6, TNFα, and IL1β. Changes in expression, or in the case of MUC1, a change in glycosylation, were measure by flow cytometry and shown as mean fluorescence intensity (MFI)(Figure 1A) or fold-change over untreated cells (Figure 1B). Single cytokines alone did not have a measurable effect on TAA expression at any time point, but the combination or IL6 and TNFα increased expression of Her-2/neu at 72 hours. Exposure to IL6, IL1β and TNFα for 72 hours caused a 1.8-fold increase in MUC1 expression, a 1.9-fold increase in its hypoglycosylated form, a 2-fold increase in Her-2/neu, and a 2.9-fold increase in CEA expression over untreated cells (Figure 1B).
Figure 1: Changes in expression of four known TAAs upon exposure of primary mammary epithelial cells (MEPiC) to pro-inflammatory cytokines.
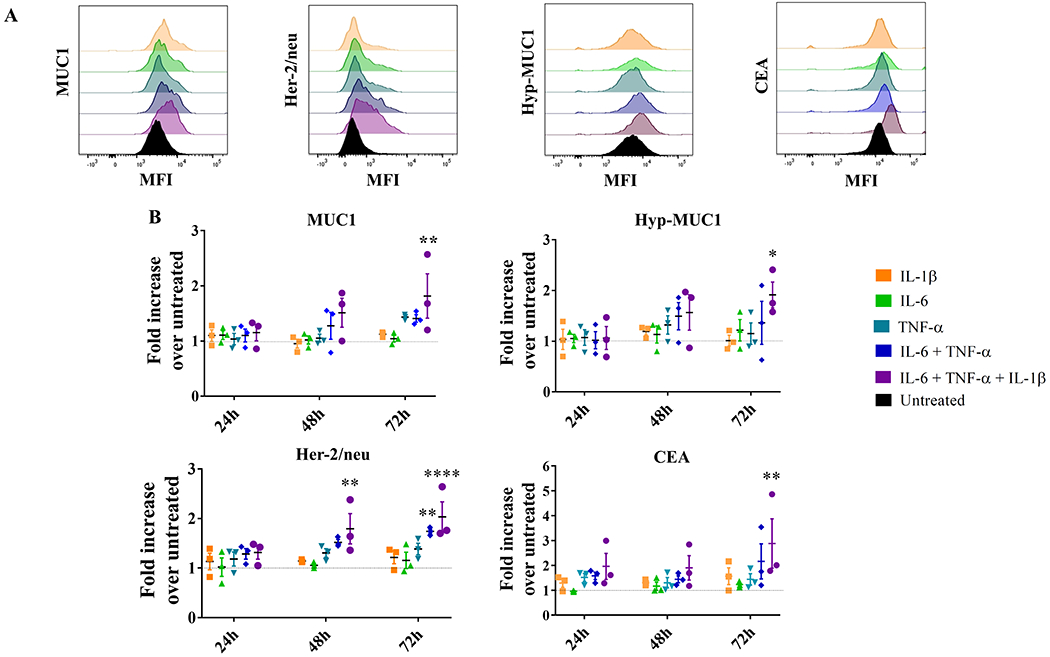
(A) MUC1, Her-2/neu, hypoglycolysated MUC1 (hyp-MUC1), and CEA expression on untreated MEPiC (black) and following treatment for 72 hours with different cytokines or their combinations (indicated by different colors). MFI, mean fluorescence intensity. (B) Fold-increase in the expression of MUC1, hyp-MUC1, Her-2/neu, and CEA on MEPiC treated with different pro-inflammatory cytokines (indicated by different colors) for different durations of time, over untreated cells (dashed line). Results are presented as mean values±SEM of three experiments. Dunnett’s multiple comparisons test: ***p<0.001, **p<0.01, *p<0.05. The following cytokine concentrations were used: IL6 (50 ng/mL), IL1β (12.5 ng/mL), and TNFα (12.5 ng/mL).
We then repeated the experiment with an immortal, but not transformed, breast epithelial cell line, MCF10A (42) and found a significant increase in MUC1, the hypoglycosylated form of MUC1, Her-2/neu, and CEA expression after 72 hours with the combination of the three cytokines compared to untreated cells (Figure 2A). Single cytokines did not have a measureable effect on TAA expression, but the combination of IL6 and TNFα for 48 and 72 hours increased expression of MUC1. Changes in expression of MUC1 and Her-2/neu began as early as 24 hours after the addition of the three cytokines, whereas CEA was only significantly overexpressed in cells treated for 72 hours (Figure 2B). The exposure of MCF10A to IL6, IL1β, and TNFα for 72 hours caused a 1.85-fold increase in MUC1 expression, a 1.75-fold increase in its hypoglycosylated form, a 1.7-fold increase in Her-2/neu, and a 1.8-fold increase in CEA expression over untreated cells.
Figure 2: Changes in expression of four TAAs upon exposure of MCF10A cells to pro-inflammatory cytokines.
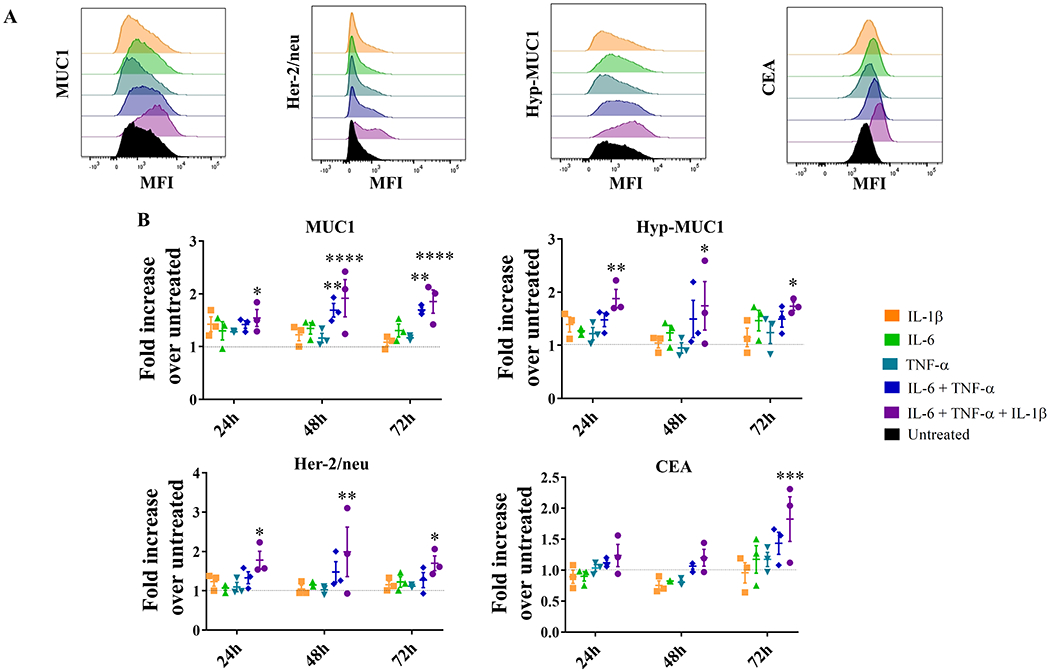
(A) MUC1, Her-2/neu, hypoglycolysated MUC1 (hyp-MUC1), and CEA expression on untreated MCF10A cells (black) and following treatment for 72 hours with different cytokines or their combinations (indicated by different colors). (B) Fold-increase of MUC1, hypoglycolysated MUC1 (Hyp-MUC1), Her-2/neu, and CEA expression by MCF10A cells treated with different pro-inflammatory cytokines (indicated by different colors) for different durations, over untreated cells (dashed line). Results are presented as mean values±SEM of three experiments. Dunnett’s multiple comparisons test: ***p<0.001, **p<0.01, *p<0.05. The following concentrations were used: IL6 (50 ng/mL), IL1β (12.5 ng/mL), and TNFα (12.5 ng/mL).
The follow-up experiments examined the duration of this abnormal antigen expression. We expected that it would be acute and transient in order to avoid chronic inflammation (43) but long enough to provide sufficient exposure time to the antigens and prime an immune response. We observed MCF10A cells for two weeks post-exposure to inflammatory cytokines and found that changes in antigen expression measured at 72 hours of treatment persisted at least three more days post cytokine removal (Supplementary Figure S3A) and then returned gradually to their basal level over one week (Supplementary Figure S3B). We also found that exposure to the three pro-inflammatory cytokines at once resulted in an increase in secretion of other pro-inflammatory cytokines by epithelial cells (MCF10A), such as MCP1, IL8, and IL33, which returned to levels produced by untreated cells after two days in control culture conditions (Supplementary Figure S4).
In order to test a potentially more physiologically relevant in vitro model, we grew MCF10A as 3D cultures and exposed them to the above cocktail of IL1β, IL6, and TNFα for 72 hours and measured the expression of MUC1, hypoglycosylated MUC1, and Her-2/neu by immunofluorescence microscopy. We found similar results. Pre-treatment, the cells had low (undetectable) expression of MUC1 and Her-2/neu (Supplementary Figure S5A), which increased post-treatment (Supplementary Figure S5B). Hypoglycosylated MUC1, which was undetectable pre-treatment (Supplementary Figure S5C), was expressed after treatment in a non-polarized, punctate fashion (Supplementary Figure S5D). In addition to overexpression and hypoglycosylation, loss of polarization is a major characteristic of MUC1 expression on tumors (39).
Changes in antigen expression after exposure to polarized, activated macrophages
We also measured antigenic changes in response to a more complex inflammatory signal that would be encountered in vivo by incubating MCF10A cells with polarized macrophages and their secreted products. As early as 24 hours of coincubation with M1-like macrophages, we saw a significant increase in expression of MUC1, hypoglycosylated MUC1, and CEA in epithelial cells (Supplementary Figure S6). Exposure to M1-like macrophage supernatant for 72 hours similarly increased expression levels of MUC1 and hypoglycosylated MUC1 but not Her-2/neu (Figure 3A) and CEA (Supplementary Figure S7). We analyzed the cytokine profile of the three supernatants to determine why those from M1-like macrophages were more effective than supernatants from M0- or M2-like macrophages in increasing TAA expression. We found that M1-like macrophages had the highest production of IL6, IFNγ, and MCP-1 (Figure 3B). TNFα was overall low, albeit still slightly higher in M1-like macrophages. The difference may not be sufficient to also credit this cytokine for contributing to higher TAA expression. Although IL6 and MCP-1 are produced de novo and we washed cultures to remove polarizing cytokines, we cannot completely exclude the possibility that the high concentration of IFNγ in supernatants from M1-like macrophages and IL4 from M2-like macrophages may still be present in addition to de novo–produced cytokines.
Figure 3: Change in expression of TAAs in MCF10A cells exposed to supernatants of polarized primary macrophages.
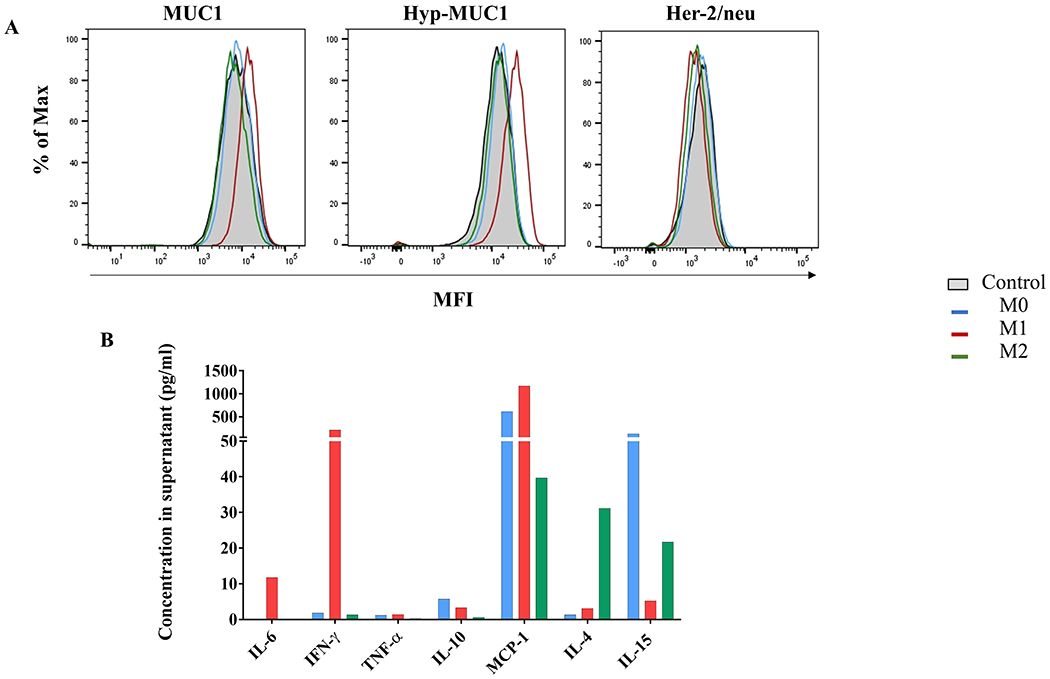
(A) MUC1, hypoglycosylated MUC1, and Her-2/neu expression after 72 hours of incubation with supernatant from primary polarized macrophages compared to control MCF10A (gray). (B) Cytokine concentrations in macrophage supernatants used in (A). Supernatants were collected 24 hours after the end of polarization/activation and cytokine concentrations assessed by cytokine-based assay. M1-like (red), M2-like (green), or M0 (blue) macrophages.
Because the effects of the cytokine treatment on MCF10A cells were similar to that seen on primary epithelial cultures, and because the 3D cultures did not show significant differences in results compared to monolayer cultures (Supplementary Figure S8), we conducted the rest of the experiments with the MCF10A cell line grown as monolayers. Our expectation was that this would provide the simplest, most reproducible, and most abundant source of cells for identification of new DAAs/TAAs.
Identification and characterization of seven new DAAs as potential TAAs
The inflammation-induced changes described above for three already known TAAs were used to indicate normal cells that responded to treatment and could potentially have altered expression of other self-molecules. To identify molecules specifically expressed in cells exposed to our inflammatory cytokines, we extracted proteins from treated and untreated cells and labeled them separately with two different cyanine-based, amine-reactive, minimal-labeling dyes and resolved them by 2D-DIGE (36). Figure 4A is a representative 2D gel where proteins from untreated (red) and treated (green) MCF10A were resolved and visualized as spots. Image analysis revealed a dozen proteins that were differentially expressed in all experiments done with either primary epithelial cultures or the MCF10A cell line (see Supplementary Figure S1 for MEPic results). Nine protein spots, which were most clearly different and reproducible accross the biological replicates from the two cell lines (circles), were excised from the gel, digested into peptides with trypsin, and subjected to mass spectrometry analysis (Supplementary Table S2). Spot 1 was identified as the eukaryotic elongation factor 2 (eEF2) that is found in the nucleus and is involved in translation elongation. Spots 2 and 3 were identified as nicotinamide phosphoribosyl-transferase (NAMPT) and likely represented two isoforms. The mass spectrometry data indicated that one of these isoform was acetylated in its N-terminal region in treated cells (Supplementary Table S3) .The secreated form of NAMPT can behave as a cytokine with immunomodulatory properties (44). Spot 4 was identified as the leukocyte elastase inhibitor Serpin B1, known to play an essential role in the regulation of the innate immune response, inflammation, and cellular homeostasis (45). Spot 5, Serpin B3, is a cytoplasmic protein known to modulate the host immune response against tumor cells (46). Spot 6 was recognized as the mitochondrial protein superoxide dismutase (SOD2) known to be involved in the elimination of superoxide radicals toxic to biological systems (47). Spots 7 and 8 were identified as isoforms of S100A9, whereas spot 9 was identified as S100A8. These cell surface proteins act as alarmins or danger-associated molecular pattern (DAMP) molecules that can stimulate innate immune cells (48). We querried the sequences of the DAAs for peptides capable of binding human HLA and found many strong binders and weak binders, both potentially good candidates for stimulating CD8+ and CD4+ T cells (Supplementary Table S4).
Figure 4: Changes in the overall proteome of MCF10A cells treated with pro-inflammatory cytokines and selection of differentially expressed DAAs.
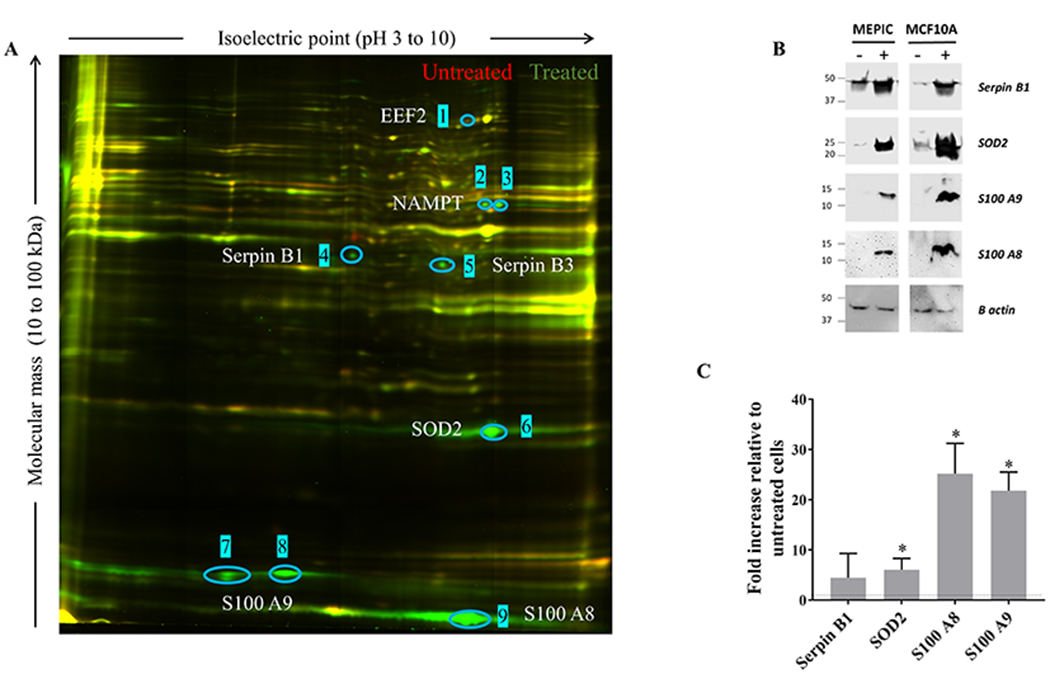
(A) Proteins extracted from treated cells were labeled with Cy3-NHS (green); proteins from untreated cells were labeled with Cy5-NHS (red); labeled proteins were mixed and resolved on 2D-DIGE. Unchanged proteins in the two lysates migrate identically and appear as yellow spots. Proteins unique to untreated cells appear as red spots, and those unique to treated cells as green spots. Blue circles and numbers indicate spots that were picked for sequencing. (B) Total protein lysates from treated and untreated cells were resolved on SDS gels and immunoblotted with antibodies against SOD2, Serpin B1, S100A8, and S100A9. β-actin was used as a loading control. Results are representative of two independent experiments. (C) mRNA expression fold-change of 2D-DIGE-identified DAAs in cytokine-treated MCF10A cells relative to untreated cells (dashed line). Results are presented as mean values±SD of 5 biological replicates. Student T-test: ***p<0.001, **p<0.01, *p<0.05. Treated cells were exposed to IL6 (50 ng/mL), IL1β (12.5 ng/mL), and TNFα (12.5 ng/mL) for 72 hours.
We confirmed the results of the 2D-DIGE by Western blot on SOD2, Serpin B1, S100A8, and S100A9. We observed that these four antigens were overexpressed in both MEPiC- and MCF10A-treated cells (Figure 4B). We also investigated their relative mRNA expression by qRT-PCR in MCF10A cells and found that their transcription was upregulated in treated cells compared to untreated controls (Figure 4C).
Mechanisms of regulation of DAA expression in inflammation
To investigate what regulates changes in antigen expression following inflammation, we profiled differences in expression of 579 genes involved in immune responses and inflammation using the Nanostring nCounter Human Immunology V2 Panel. Gene expression in cells exposed to inflammatory cytokines for 72 hours was compared to untreated cells. In treated mammary epithelial cells, 29 significantly upregulated genes were identified as having log2 fold-change expression >1 compared to untreated cells (Figure 5A). Gene Set Analysis (GSA) showed that the 10 top differentially expressed gene sets were related to responses to other organisms, to biotic stimulus, or linked to transmembrane receptor binding activity (Figure 5B). The results of the GSA and the list of upregulated genes suggested the involvement of NF-κB signaling in the upregulation of DAA expression in the setting of inflammation. Several of the genes identified as upregulated were indeed related to the NF-κB signaling pathway (Figure 5C). Finally, we compared the gene profile of treated primary epithelial cells and MCF10A cells and found that the increased expression of 33 genes, including those associated with NF-κB signaling, was common to the two cell populations (Figure 5D).
Figure 5: Biological response to the inflammatory cytokine treatment is associated with upregulation of genes involved in NF-κB signaling.
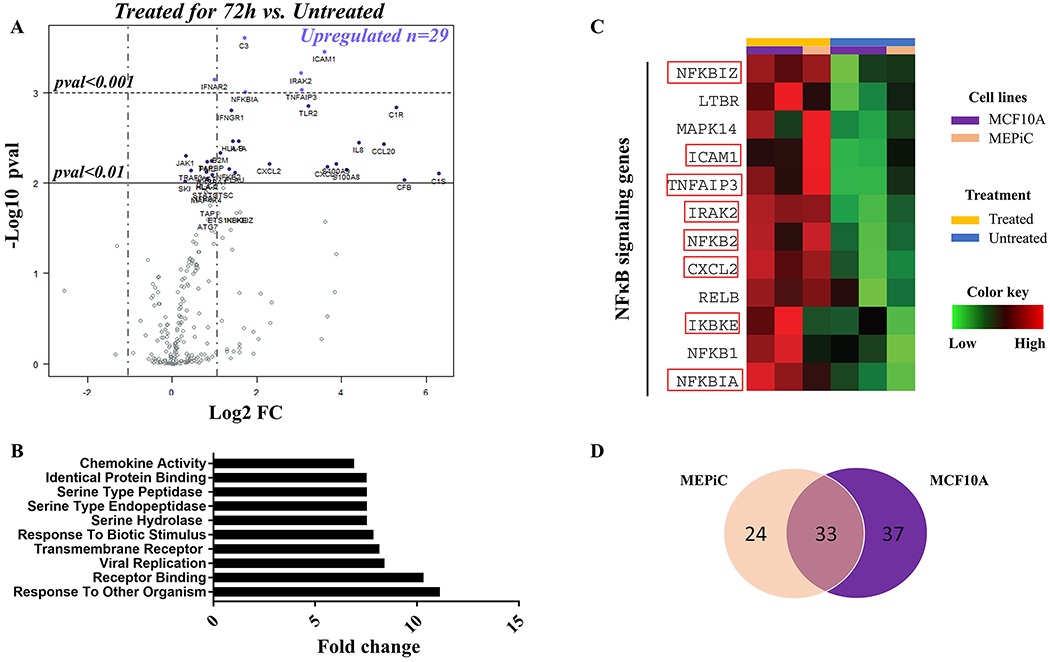
(A) Volcano plot displaying differentially expressed genes in treated mammary epithelial cells compared to untreated cells. Names of mRNA probes indicate genes that reached significance in difference of expression. The horizontal lines show the threshold of p<0.01 (continuous) or p<0.001(dashed). Vertical dashed lines represent the threshold for upregulation (Log2 FC>1) and downregulation (Log2 FC<−1). (B) Differential expression of the top 10 gene sets in treated cells compared to untreated cells. (C) Heatmap representation of expression of 12 genes involved in NF-κB signaling in MEPiC (orange) and MCF10A (purple) treated (yellow) or untreated (blue) cells. Names of genes significantly overexpressed in treated cells are framed in red. The color key was provided by the software and shows a gradient from low (log2 FC <–1) to high (log2 FC>1) expression compared to untreated cells. (D) Venn diagram of the highest differentially expressed genes in treated cells over untreated cells shared between MCF10A and MEPiC cells. Treated cells were exposed to IL6 (50 ng/mL), IL1β (12.5 ng/mL), and TNFα (12.5 ng/mL) for 72 hours.
Expression of DAAs in inflammatory, premalignant, and malignant tissues
All experiments above were done in vitro with relevant primary cells or immortalized cell lines. It was important to determine if these DAAs/TAAs can also be abnormally expressed in vivo. We used immunohistochemistry and commercially available antibodies for three of the seven DAAs/TAAs, SOD2, Serpin B1, and S100A9, to examine normal, inflamed, preneoplastic, and neoplastic tissue sections of the human breast, and also normal, inflamed, and malignant lesions of the esophagus, stomach, intestine, liver, gallbladder, and pancreas (Table 1). We observed varying expression of DAAs in normal tissues, and certain organs had no expression, whereas others had low expression. For example, normal breast did not express SOD2 or S100A9 but did express low Serpin B1. Similarly, normal expression of a single DAA varied between organs. For example, SOD2 was not expressed at all in normal breast, esophagus, and stomach but had low expresion in normal small intestine, colon, liver, gallbladder, and pancreas. One or more of these DAAs were expressed as early as hyperplasia and persisted through adenocarconoma, whereas others were expressed athigher levels at late stages of carcinogenesis. Table 1 also shows high expression of one or more of these DAAs in chronic inflammatory conditions such as esophagitis, hepatitis, and gastritis. In Figure 6, we show examples of immunohistochemical staining for expression of these DAAs on various diseased tissues compared with corresponding normal tissues.
Table 1:
In vivo expression of DAAs/TAAs SOD2, S100A9, and Serpin B1
| Anatomic site | Pathology | SOD2 | S100A9 | Serpin B1 |
|---|---|---|---|---|
| Breast | Normal (2) | 01 | 0 | + |
| Hyperplasia (5) | + | + | ++ | |
| Fibroadenoma (3) | + | + | + | |
| Paget’s disease (1) | + | + | + | |
| Ductal carcinoma in situ (1) | +++ | + | + | |
| Invasive ductal carcinoma stage II (3) | +++ | + | ++ | |
| Invasive ductal carcinoma stage III (3) | +++ | + | ++ | |
| Esophagus | Normal (1) | 0 | + | + |
| Chronic esophagitis (1) | 0 | + | ++ | |
| Squamous cell carcinoma stage II (2) | + | ++ | ++ | |
| Squamous cell carcinoma stage III (1) | + | ++ | 0 | |
| Stomach | Normal (1) | + | + | + |
| Chronic gastritis (1) | + | + | ++ | |
| Gastric ulcer (1) | + | + | + | |
| Adenocarcinoma Stage I (2) | 0 | + | + | |
| Adenocarcinoma Stage II (1) | + | + | + | |
| Adenocarcinoma Stage III (1) | + | ++ | + | |
| Fibrosarcoma (1) | 0 | 0 | 0 | |
| Small intestine | Normal (1) | + | + | 0 |
| Chronic enteritis (1) | ++ | + | + | |
| Granuloma (1) | +++ | +++ | 0 | |
| Adenocarcinoma Stage II (1) | + | 0 | + | |
| Colon | Normal (1) | + | 0 | + |
| Chronic colitis (1) | + | 0 | ++ | |
| Adenoma (1) | 0 | 0 | 0 | |
| Adenocarcinoma Stage II (2) | + | 0 | 0 | |
| Adenocarcinoma Stage III (1) | + | + | 0 | |
| Liver | Normal (1) | + | 0 | + |
| Chronic viral hepatitis (4) | ++ | + | ++ | |
| Hepatocellular carcinoma Stage II (3) | +++ | + | + | |
| Cholangiocarcinoma Stage II (1) | 0 | ++ | ++ | |
| Gallbladder | Normal (1) | + | + | + |
| Chronic cholecystitis (1) | + | + | ++ | |
| Adenocarcinoma Stage II (1) | + | + | + | |
| Pancreas | Normal (1) | + | + | 0 |
| Adenocarcinoma Stage II (1) | + | + | 0 | |
Human tissue sections (numbers of samples given in parentheses) were stained with specific antibodies as described in Materials and Methods. Expression was assessed by comparing cases to corresponding normal tissues: Images were scored by measuring the percentage of IHC positively labeled cells, 0, 0%; +, <30%; ++, 30 to 60%; and +++, >60%.
Figure 6: In vivo expression of DAAs/TAAs SOD2, S100A9, and Serpin B1.
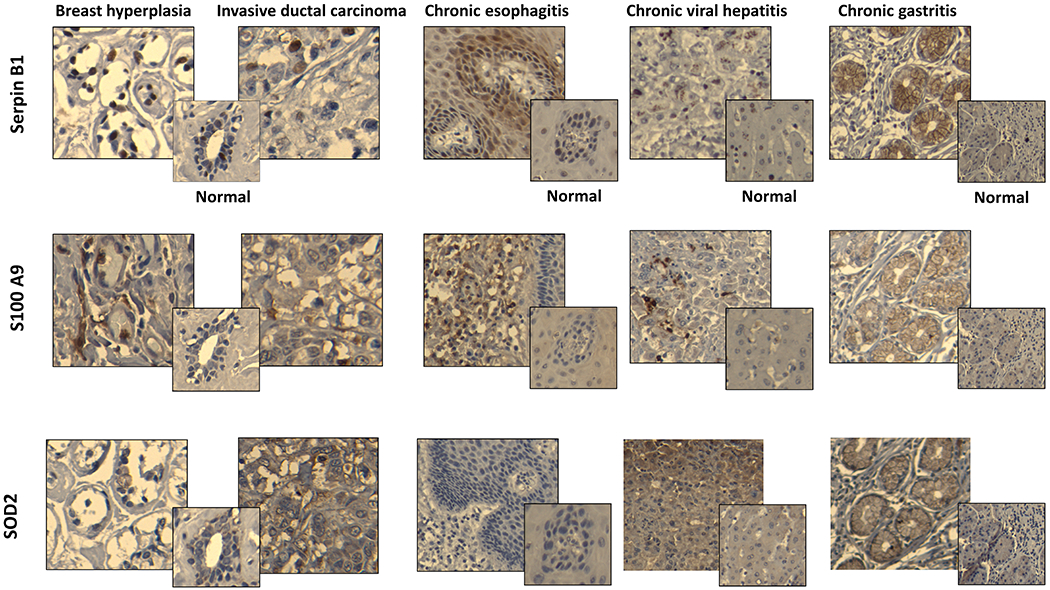
Representative images of paraffin-embedeed tissue sections of breast hyperplasia, breast invasive ductal carcinoma, chronic esophagitis, chronic viral hepatitis, and chronic gastritis stained with relevant antibodies (see Materials and Methods). Corresponding normal tissues stained with the same antibodies are shown in smaller squares. All slides were scanned at 10X magnification in order to select for a high resolution images at 20X.
Discussion
Our data support the idea that acute inflammation accompanying infections could cause transient abnormal expression of self-antigens that are also found constitutively abnormally expressed in tumor cells and can therefore be categorized as disease-associated/tumor-associated antigens (DAAs/TAAs). In a reproducible in vitro model of acute inflammation, where we exposed normal primary epithelial cell cultures or an immortalized epithelial cell line to a cocktail of proinflammatory cytokines IL1β, TNFα, and IL6, we demonstrated that this exposure led to a transient increase in expression of well-known, and for our purposes, indicator prototype TAAs, CEA, MUC1 and Her-2/neu. This effect was reproducible and robust and could serve well for identification of TAAs that could be potential targets for cancer immunotherapy.
We used this in vitro system to identify seven antigens, eEF2, NAMPT, Serpins B1, Serpin B3, SOD2, S100A8, and S100A9, self-molecules whose expression increased or changed significantly and transiently upon treatment with the cytokines. Through transcriptional analyses of the related genes, we were able to show that these changes in protein expression resulted from changes in transcription, except for NAMPT and Serpin B3. It was previously demonstrated that mRNA expression does not correlate with protein abundance and can be associated to post-translational modifications or an increase in protein stability (49). The post-transcriptional modification of NAMPT could account for its stability and consequently increased expression.
Using differential gene expression analysis, we showed that NF-κB signaling was activated in treated cells, as could be expected from known signaling pathways engaged by IL1β, TNFα, and IL6. This pathway could also be involved in the regulation of expression of the identified DAAs. SOD2 is a well-known target of NK-κB involved in antioxidant responses (50), and Serpin B1 has already been shown to be positively regulated by NF-κB and to suppress TNF-induced apoptosis (51). S100A8 and S100A9 have been reported to activate NF-κB (52) but also to be NF-κB targets during malignant progression of human liver carcinogenesis (53).
Because acute inflammation is a common process that can lead to inflammatory diseases, infections, and cancer, and also because NF-κB signaling is similarly expressed and inducible in most cell types (54), we investigated and confirmed upregulation of these DAAs in human tissues from a variety of diseases. Using available antibodies against three of these antigens, Serpin B1, S100A9, and SOD2, we showed that they were abnormally expressed in tissues from inflammatory diseases such as esophagitis, gastritis, and hepatitis, as well as in premalignant breast tissues and in malignant breast, colon, and pancreas. Several published studies already report overexpression of these same proteins in infections, inflammatory diseases, and cancer. For example, high circulating S100A8 and S100A9 were found in patients suffering from bacterial and fungal infections (55). Serpin B1 is reported to be expressed in ulcerative colitis (56), whereas chronic lung inflammation and lung carcingenesis are associated with SOD2 upregulation (35). Adenocarcinomas of the stomach as well as squamous cell carcinomas of the esophagus also show increased expression of SOD2 (57). Finally, dysregulated expression of multiple members of the S100 family has been identified as a common feature of human cancers (58), and they are also considered as biomarkers of chronic inflammatory pathologies such as rheumatoid arthritis and inflammatory bowel disease (59). In addition to the DAAs we tested, eEF2 and SerpinB3 are reported as novel TAAs (60,61), and NAMPT is upregulated in many malignancies including obesity-associated cancers (62). Serpin B3 is also reported to be overexpressed in macrophages infected by Toxoplasma gondii (63), and NAMPT-specific antibodies are found at high concentrations in children with acute infections (64). Thus, all the antigens we identified post-inflammation are bonafide DAAs/TAAs expressed in inflammatory events, infections, and cancer.
Further work should assess the immunogenicity of each of these DAAs/TAAs and their potential to elicit a tumor-rejection or a tumor-protection response. Many of the DAAs/TAAs identified so far are conserved between species, which will facilitate their preclinical testing in animal models. Immunogenicity and antitumor potential of the prototype DAAs/TAAs, MUC1, CEA, and Her-2/neu are already well-known and our results suggest that the identified DAAs contained epitopes able to bind human HLA. Some DAAs could simultaneously be antigens and activators of innate responses. For instance, S100A8 and S100A9 are known to mediate migration of macrophages to the tumor site and regulate immune homeostatis (65).
We postulated that presentation and recognition of DAAs abnormally transiently expressed during viral or other acute infections by T and B cells could generate a long-lasting immune memory against DAAs/TAAs, crucial for effective immunosurveillance of cancer. The prompt arrival of DAA-specific antibodies and memory T cells to the site of the developing tumor expressing these same antigens as TAAs could result in elimination of these cells and also promote priming of tumor-specific responses directed against unique mutations or other shared antigens through epitope spreading, adding to the efficacy of immunosurveillance. Thus, a better understanding on how early-life inflammatory events and personal history of infections can prepare the immune system to fight against future challenges, both infectious and malignant, could help to design new preventative and therapeutic strategies (66). Based on this concept, a preventative strategy could be envisioned where the lack of sufficiently strong DAA-specific immune memory, due to limited early exposure to infectious inflammatory events, could be compensated for by a vaccine composed of a cocktail of representative and validated DAAs (67). Because the DAAs we identified are shared by multiple cancer types, it supports the idea that development of such vaccines could one day confer “universal” protection against cancer and very likely provide first responders to new pandemic pathogens.
Supplementary Material
Acknowledgments
We are highly appreciative of the help and advice from Dr. Anda Vlad and Ms. Mary Strange, Dr. Simon Watkins and Morgan Jessup, and Ms. Jia Xue. This project used the Hillman Center for Biologic Imaging and Genomics Research Core that are supported in part by award P30CA047904.
Financial support:
This work was supported by NIH grant R35 CA210039 to OJF.
Footnotes
Conflict of interest statement :
O.J.F. is on the External Advisory Boards of GeoVax, Biovelocita and Immodulon.
References
- 1.Hanahan D, Weinberg RA. Review Hallmarks of Cancer : The Next Generation Cell. Elsevier Inc; 2011;144:646–74. [DOI] [PubMed] [Google Scholar]
- 2.Finn OJ. Human Tumor Antigens Yesterday, Today, and Tomorrow. Cancer Immunol Res. 2017;5:347 LP-354. [DOI] [PMC free article] [PubMed] [Google Scholar]
- 3.Kawakami Y, Wang X, Shofuda T, Sumimoto H, Tupesis JP, Fitzgerald E, et al. Isolation of a New Melanoma Antigen, MART-2, Containing a Mutated Epitope Recognized by Autologous Tumor-Infiltrating T Lymphocytes J Immunol. American Association of Immunologists; 2001;166:2871–7. [DOI] [PubMed] [Google Scholar]
- 4.Rajasagi M, Shukla SA, Fritsch EF, Keskin DB, DeLuca D, Carmona E, et al. Systematic identification of personal tumor-specific neoantigens in chronic lymphocytic leukemia Blood. American Society of Hematology; 2014;124:453–62. [DOI] [PMC free article] [PubMed] [Google Scholar]
- 5.Robbins PF, Lu Y-C, El-Gamil M, Li YF, Gross C, Gartner J, et al. Mining exomic sequencing data to identify mutated antigens recognized by adoptively transferred tumor-reactive T cells. Nat Med. 2013;19:747–52. [DOI] [PMC free article] [PubMed] [Google Scholar]
- 6.Slamon DJ, Godolphin W, Jones LA, Holt JA, Wong SG, Keith DE, et al. Studies of the HER-2/neu proto-oncogene in human breast and ovarian cancer. Science. 1989;244:707–12. [DOI] [PubMed] [Google Scholar]
- 7.Vlad AM, Kettel JC, Alajez NM, Carlos CA, Finn OJ. MUC1 Immunobiology: From Discovery to Clinical Applications. Adv Immunol. 2004. page 249–93. [DOI] [PubMed] [Google Scholar]
- 8.Nollau P, Scheller H, Kona-Horstmann M, Rohde S, Hagenmüller F, Wagener C, et al. Expression of CD66a (human C-CAM) and other members of the carcinoembryonic antigen gene family of adhesion molecules in human colorectal adenomas. Cancer Res. 1997;57:2354–7. [PubMed] [Google Scholar]
- 9.Kao H, Marto JA, Hoffmann TK, Shabanowitz J, Finkelstein SD, Whiteside TL, et al. Identification of Cyclin B1 as a Shared Human Epithelial Tumor-Associated Antigen Recognized by T Cells J Exp Med. The Rockefeller University Press; 2001;194:1313. [DOI] [PMC free article] [PubMed] [Google Scholar]
- 10.Schmidt SM, Schag K, Müller MR, Weck MM, Appel S, Kanz L, et al. Survivin is a shared tumor-associated antigen expressed in a broad variety of malignancies and recognized by specific cytotoxic T cells. Blood. 2003;102:571–6. [DOI] [PubMed] [Google Scholar]
- 11.Argani P, Iacobuzio-Donahue C, Ryu B, Rosty C, Goggins M, Wilentz RE, et al. Mesothelin Is Overexpressed in the Vast Majority of Ductal Adenocarcinomas of the Pancreas Clin Cancer Res. American Association for Cancer Research; 2001;7:3862–8. [PubMed] [Google Scholar]
- 12.Adams S, Greeder L, Reich E, Shao Y, Fosina D, Hanson N, et al. Expression of cancer testis antigens in human BRCA-associated breast cancers: potential targets for immunoprevention? Cancer Immunol Immunother. 2011;60:999–1007. [DOI] [PMC free article] [PubMed] [Google Scholar]
- 13.Kerk S, Pearson AT, Warner K, Zhang Z, Finkel K, Helman J, et al. 5T4 oncofetal antigen as a prognostic marker and target for treatment in head and neck squamous cell carcinoma J Clin Oncol. American Society of Clinical Oncology; 2016;34:e17516–e17516. [Google Scholar]
- 14.Nath S, Mukherjee P. MUC1: A multifaceted oncoprotein with a key role in cancer progression Trends Mol Med. Elsevier Ltd; 2014;20:332–42. [DOI] [PMC free article] [PubMed] [Google Scholar]
- 15.Meyer VS, Drews O, Günder M, Hennenlotter J, Rammensee H-G, Stevanovic S. Identification of Natural MHC Class II Presented Phosphopeptides and Tumor-Derived MHC Class I Phospholigands J Proteome Res. American Chemical Society; 2009;8:3666–74. [DOI] [PubMed] [Google Scholar]
- 16.Brentville VA, Metheringham RL, Gunn B, Symonds P, Daniels I, Gijon M, et al. Citrullinated Vimentin Presented on MHC-II in Tumor Cells Is a Target for CD4+ T-Cell-Mediated Antitumor Immunity. Cancer Res. 2016;76:548–60. [DOI] [PubMed] [Google Scholar]
- 17.Nitta T, Sugihara K, Tsuyama S, Murata F. Immunohistochemical study of MUC1 mucin in premalignant oral lesions and oral squamous cell carcinoma. Cancer. 2000;88:245–54. [DOI] [PubMed] [Google Scholar]
- 18.Suzuki H, Graziano DF, McKolanis J, Finn OJ. T Cell-Dependent Antibody Responses against Aberrantly Expressed Cyclin B1 Protein in Patients with Cancer and Premalignant Disease. Clin Cancer Res. 2005;11:1521–6. [DOI] [PubMed] [Google Scholar]
- 19.Silk AW, Finn OJ. Cancer vaccines: a promising cancer therapy against all odds. Future Oncol. 2007;3:299–306. [DOI] [PubMed] [Google Scholar]
- 20.Vella L a, Yu M, Fuhrmann SR, El-Amine M, Epperson DE, Finn OJ. Healthy individuals have T-cell and antibody responses to the tumor antigen cyclin B1 that when elicited in mice protect from cancer. Proc Natl Acad Sci U S A. 2009;106:14010–5. [DOI] [PMC free article] [PubMed] [Google Scholar]
- 21.Tabuchi Y, Shimoda M, Kagara N, Naoi Y, Tanei T, Shimomura A, et al. Protective effect of naturally occurring anti-HER2 autoantibodies on breast cancer. Breast Cancer Res Treat. 2016;157:55–63. [DOI] [PubMed] [Google Scholar]
- 22.Pinheiro SP, Hankinson SE, Tworoger SS, Rosner BA, McKolanis JR, Finn OJ, et al. Anti-MUC1 Antibodies and Ovarian Cancer Risk: Prospective Data from the Nurses’ Health Studies Cancer Epidemiol Biomarkers Prev. American Association for Cancer Research; 2010;19:1595–601. [DOI] [PMC free article] [PubMed] [Google Scholar]
- 23.Terry KL, Titus-Ernstoff L, McKolanis JR, Welch WR, Finn OJ, Cramer DW. Incessant Ovulation, Mucin 1 Immunity, and Risk for Ovarian Cancer Cancer Epidemiol Biomarkers Prev. American Association for Cancer Research; 2007;16:30–5. [DOI] [PubMed] [Google Scholar]
- 24.Cramer DW, Titus-Ernstoff L, McKolanis JR, Welch WR, Vitonis AF, Berkowitz RS, et al. Conditions Associated with Antibodies Against the Tumor-Associated Antigen MUC1 and Their Relationship to Risk for Ovarian Cancer Cancer Epidemiol Biomarkers Prev. American Association for Cancer Research; 2005;14:1125–31. [DOI] [PubMed] [Google Scholar]
- 25.Cramer DW, Vitonis AF, Pinheiro SP, McKolanis JR, Fichorova RN, Brown KE, et al. Mumps and ovarian cancer: moder interpretation of an historic association. Cancer Causes Control. 2011;21:1193–201. [DOI] [PMC free article] [PubMed] [Google Scholar]
- 26.Cramer DW, Finn OJ. Epidemiological perspective on immune-surveillance in cancer. Curr Opin Immunol. 2012;23:265–71. [DOI] [PMC free article] [PubMed] [Google Scholar]
- 27.Iheagwara UK, Beatty PL, Van PT, Ross TM, Minden JS, Finn OJ. Influenza virus infection elicits protective antibodies and T cells specific for host cell antigens also expressed as tumor associated antigens : a new view of cancer immunosurveillance. Cancer Immunol Res. 2015;2:263–73. [DOI] [PMC free article] [PubMed] [Google Scholar]
- 28.Brenaut P, Lefèvre L, Rau A, Laloë D, Pisoni G, Moroni P, et al. <Contribution of mammary epithelial cells to the.pdf>. 2014;1–20. [DOI] [PMC free article] [PubMed] [Google Scholar]
- 29.Reinecker HC, Podolsky DK. Human intestinal epithelial cells express functional cytokine receptors sharing the common gamma c chain of the interleukin 2 receptor Proc Natl Acad Sci U S A. National Academy of Sciences; 1995;92:8353–7. [DOI] [PMC free article] [PubMed] [Google Scholar]
- 30.Cascio S, Faylo JL, Sciurba JC, Xue J, Ranganathan S, Lohmueller JJ, et al. Abnormally glycosylated MUC1 establishes a positive feedback circuit of inflammatory cytokines, mediated by NF-κB p65 and EzH2, in colitis-associated cancer. Oncotarget. 2017;8:105284–98. [DOI] [PMC free article] [PubMed] [Google Scholar]
- 31.Kvorjak M, Ahmed Y, Miller ML, Sriram R, Coronnello C, Hashash JG, et al. Cross-talk between Colon Cells and Macrophages Increases ST6GALNAC1 and MUC1-sTn Expression in Ulcerative Colitis and Colitis-Associated Colon Cancer. Cancer Immunol Res. 2020;8:167–78. [DOI] [PMC free article] [PubMed] [Google Scholar]
- 32.Feghali c A, Wright TM. Cytokines acute and chronic inflammation. Front Biosci. 1997;1. [DOI] [PubMed] [Google Scholar]
- 33.Lohmueller JJ, Sato S, Popova L, Chu IM, Tucker MA, Barberena R, et al. Antibodies elicited by the first non-viral prophylactic cancer vaccine show tumor-specificity and immunotherapeutic potential Sci Rep. Nature Publishing Group; 2016;6:1–12. [DOI] [PMC free article] [PubMed] [Google Scholar]
- 34.Debnath J, Muthuswamy SK, Brugge JS. Morphogenesis and oncogenesis of MCF-10A mammary epithelial acini grown in three-dimensional basement membrane cultures. Methods. 2003;30:256–68. [DOI] [PubMed] [Google Scholar]
- 35.Yi L, Shen H, Zhao M, Shao P, Liu C, Cui J, et al. Inflammation-mediated SOD-2 upregulation contributes to epithelial-mesenchymal transition and migration of tumor cells in aflatoxin G1-induced lung adenocarcinoma Sci Rep. Nature Publishing Group; 2017;7:1–13. [DOI] [PMC free article] [PubMed] [Google Scholar]
- 36.Minden JS. Two-Dimensional Difference Gel Electrophoresis. Methods Mol Biol. 2012. page 287–304. [DOI] [PubMed] [Google Scholar]
- 37.Balasubramani M, Nakao C, Uechi GT, Cardamone J, Kamath K, Leslie KL, et al. Characterization and detection of cellular and proteomic alterations in stable stathmin-overexpressing, taxol-resistant BT549 breast cancer cells using offgel IEF/PAGE difference gel electrophoresis Mutat Res. NIH Public Access; 2011;722:154–64. [DOI] [PMC free article] [PubMed] [Google Scholar]
- 38.Livak KJ, Schmittgen TD. Analysis of relative gene expression data using real-time quantitative PCR and the 2-ΔΔCT method Methods. Academic Press Inc; 2001;25:402–8. [DOI] [PubMed] [Google Scholar]
- 39.Cascio S, Finn OJ. Intra-and extra-cellular events related to altered glycosylation of MUC1 promote chronic inflammation, tumor progression, invasion, and metastasis. Biomolecules. 2016;6:1–16. [DOI] [PMC free article] [PubMed] [Google Scholar]
- 40.Carlsson J, Nordgren H, Sjöström J, Wester K, Villman K, Bengtsson NO, et al. HER2 expression in breast cancer primary tumours and corresponding metastases. Original data and literature review Br J Cancer. Nature Publishing Group; 2004;90:2344. [DOI] [PMC free article] [PubMed] [Google Scholar]
- 41.Shao Y, Sun X, He Y, Liu C, Liu H. Elevated Levels of Serum Tumor Markers CEA and CA15–3 Are Prognostic Parameters for Different Molecular Subtypes of Breast Cancer PLoS One. Public Library of Science; 2015;10:e0133830. [DOI] [PMC free article] [PubMed] [Google Scholar]
- 42.Soule HD, Maloney TM, Wolman SR, Peterson WD, Brenz R, McGrath CM, et al. Isolation and characterization of a spontaneously immortalized human breast epithelial cell line, MCF-10. Cancer Res. 1990;50:6075–86. [PubMed] [Google Scholar]
- 43.Coussens LM, Werb Z. Inflammation and cancer. Nature. 2002;420:860–7. [DOI] [PMC free article] [PubMed] [Google Scholar]
- 44.Audrito V, Messana VG, Deaglio S. NAMPT and NAPRT: Two Metabolic Enzymes With Key Roles in Inflammation. Front. Oncol. Frontiers Media S.A; 2020. page 358. [DOI] [PMC free article] [PubMed] [Google Scholar]
- 45.Choi YJ, Kim S, Choi Y, Nielsen TB, Yan J, Lu A, et al. SERPINB1-mediated checkpoint of inflammatory caspase activation. Nat Immunol. 2019;20:276–87. [DOI] [PMC free article] [PubMed] [Google Scholar]
- 46.Turato C, Scarpa M, Kotsafti A, Cappon A, Quarta S, Biasiolo A, et al. Squamous cell carcinoma antigen 1 is associated to poor prognosis in esophageal cancer through immune surveillance impairment and reduced chemosensitivity Cancer Sci. Blackwell Publishing Ltd; 2019;110:1–12. [DOI] [PMC free article] [PubMed] [Google Scholar]
- 47.Thorpe GW, Reodica M, Davies MJ, Heeren G, Jarolim S, Pillay B, et al. Superoxide radicals have a protective role during H2O 2 stress Mol Biol Cell. American Society for Cell Biology; 2013;24:2876–84. [DOI] [PMC free article] [PubMed] [Google Scholar]
- 48.Xia C, Braunstein Z, Toomey AC, Zhong J, Rao X. S100 Proteins As an Important Regulator of Macrophage Inflammation Front Immunol. Frontiers; 2018;8:1908. [DOI] [PMC free article] [PubMed] [Google Scholar]
- 49.de Sousa Abreu R, Penalva LO, Marcotte EM, Vogel C. Global signatures of protein and mRNA expression levels. Mol Biosyst. 2009;5:1512–26. [DOI] [PMC free article] [PubMed] [Google Scholar]
- 50.Morgan MJ, Liu ZG. Crosstalk of reactive oxygen species and NF-κB signaling Cell Res. Nature Publishing Group; 2011. page 103–15. [DOI] [PMC free article] [PubMed] [Google Scholar]
- 51.Kasza A, Kiss DL, Gopalan S, Xu W, Rydel RE, Koj A, et al. Mechanism of plasminogen activator inhibitor-1 regulation by oncostatin M and interleukin-1 in human astrocytes J Neurochem. NIH Public Access; 2002;83:696–703. [DOI] [PMC free article] [PubMed] [Google Scholar]
- 52.Wang S, Song R, Wang Z, Jing Z, Wang S, Ma J. S100A8/A9 in inflammation. Front. Immunol. Frontiers Media S.A; 2018. page 1298. [Google Scholar]
- 53.Németh J, Stein I, Haag D, Riehl A, Longerich T, Horwitz E, et al. S100A8 and S100A9 are novel nuclear factor kappa b target genes during malignant progression of murine and human liver carcinogenesis. Hepatology. 2009;50:1251–62. [DOI] [PubMed] [Google Scholar]
- 54.Baumgart S, Ellenrieder V, Fernandez-Zapico ME. Oncogenic transcription factors: Cornerstones of inflammation-linked pancreatic carcinogenesis. Gut. 2013;62:310–6. [DOI] [PMC free article] [PubMed] [Google Scholar]
- 55.Hsu K, Champaiboon C, Guenther BD, Sorenson BS, Khammanivong A, Ross KF, et al. Anti-infective protective properties of s100 calgranulins Antiinflamm Antiallergy Agents Med Chem. NIH Public Access; 2009;8:290–305. [DOI] [PMC free article] [PubMed] [Google Scholar]
- 56.Uchiyama K, Naito Y, Takagi T, Mizushima K, Hirai Y, Hayashi N, et al. Serpin B1 protects colonic epithelial cell via blockage of neutrophil elastase activity and its expression is enhanced in patients with ulcerative colitis Am J Physiol Liver Physiol. American Physiological Society; Bethesda, MD; 2012;302:G1163–70. [DOI] [PubMed] [Google Scholar]
- 57.Miranda A, Janssen L, Bosman CB, van Duijn W, de Ruit MMO, Kubben FJGM, et al. Superoxide Dismutases in Gastric and Esophageal Cancer and the Prognostic Impact in Gastric Cancer Clin Cancer Res. American Association for Cancer Research; 2000;6:3183–92. [PubMed] [Google Scholar]
- 58.Gebhardt C, Németh J, Angel P, Hess J. S100A8 and S100A9 in inflammation and cancer. Biochem Pharmacol. 2006;72:1622–31. [DOI] [PubMed] [Google Scholar]
- 59.Foell D, Frosch M, Sorg C, Roth J. Phagocyte-specific calcium-binding S100 proteins as clinical laboratory markers of inflammation Clin. Chim. Acta Elsevier; 2004. page 37–51. [DOI] [PubMed] [Google Scholar]
- 60.Oji Y, Tatsumi N, Fukuda M, Nakatsuka SI, Aoyagi S, Hirata E, et al. The translation elongation factor eEF2 is a novel tumor-associated antigen overexpressed in various types of cancers. Int J Oncol. 2014;44:1461–9. [DOI] [PMC free article] [PubMed] [Google Scholar]
- 61.Saidak Z, Morisse MC, Chatelain D, Sauzay C, Houessinon A, Guilain N, et al. Squamous Cell Carcinoma Antigen-encoding Genes SERPINB3/B4 as Potentially Useful Markers for the Stratification of HNSCC Tumours. Anticancer Res. 2018;38:1343–52. [DOI] [PubMed] [Google Scholar]
- 62.Dalamaga M, Christodoulatos GS, Mantzoros CS. The role of extracellular and intracellular Nicotinamide phosphoribosyl-transferase in cancer: Diagnostic and therapeutic perspectives and challenges. Metabolism. 2018;82:72–87. [DOI] [PubMed] [Google Scholar]
- 63.Ahn H-J, Kim JY, Ryu K-J, Nam H-W. STAT6 activation by Toxoplasma gondii infection induces the expression of Th2 C-C chemokine ligands and B clade serine protease inhibitors in macrophage. Parasitol Res. 2009;105:1445–53. [DOI] [PubMed] [Google Scholar]
- 64.Gesing J, Scheuermann K, Wagner IV, Löffler D, Friebe D, Kiess W, et al. NAMPT serum levels are selectively elevated in acute infectious disease and in acute relapse of chronic inflammatory diseases in children Antoniou AN, editor. PLoS One. Public Library of Science; 2017;12:e0183027. [DOI] [PMC free article] [PubMed] [Google Scholar]
- 65.Xia C, Braunstein Z, Toomey AC, Zhong J, Rao X. S100 proteins as an important regulator of macrophage inflammation. Front. Immunol. Frontiers Media S.A; 2018. [DOI] [PMC free article] [PubMed] [Google Scholar]
- 66.Jacqueline C, N. B, Charrière GM, Thomas F, Roche B. Personal history of infections and immunotherapy: unexpected links and possible therapeutic opportunities In press. Oncoimmunology. Taylor & Francis; 2018;0:e1466019. [DOI] [PMC free article] [PubMed] [Google Scholar]
- 67.Finn OJ. Vaccines for cancer prevention: a practical and feasible approach to the cancer epidemic. Cancer Immunol Res. 2014;2:708–13. [DOI] [PMC free article] [PubMed] [Google Scholar]
Associated Data
This section collects any data citations, data availability statements, or supplementary materials included in this article.