Abstract
This study evaluates the resolution-dependent influences of compressed sensing (CS) in MRI quantification of T2 mapping in articular cartilage with osteoarthritis (OA). T2-weighed 2D experiments of healthy and OA cartilage were fully sampled in k-space with five echo times at both 17.6 μm and 195.3 μm in-plane resolutions; termed as microscopic MRI (μMRI) and macroscopic MRI (mMRI) respectively. These fully sampled k-space data were under-sampled at various 2D CS accelerating factors (AF = 4 – 32). The under-sampled data were reconstructed individually into 2D images using nonlinear reconstruction, which were used to calculate the T2 maps. The bulk and zonal variations of T2 values in cartilage were evaluated at different AFs. The study finds that the T2 images at AFs up to 8 preserved major visual information and produced negligible artifacts for μMRI. The T2 values remained accurate for different sub-tissue zones at various AFs. The absolute difference between the CS (AF up to 32) and the Ground Truth (i.e., using 100% of the k-space data) of the mean T2 values through the whole tissue depth was higher in mMRI versus μMRI. For mMRI (where the resolution mimics the clinical MRI of human cartilage), the quantitative T2 mapping at AFs up to 4 showed negligible variations. This study demonstrates that both clinical MRI and μMRI can benefit from the use of CS in image acquisition, and μMRI benefits more from the use of CS by acquiring much less data, without losing significant accuracy in the quantification of T2 maps in osteoarthritic cartilage.
Keywords: compressed sensing, MRI, cartilage, microscopic, T2, clinical
Graphical Abstract
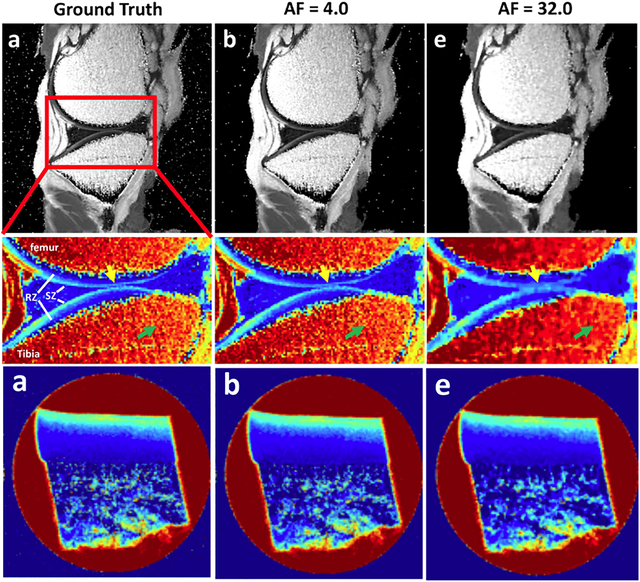
Clinical and pre-clinical MRI (μMRI) can both benefit from the use of compressed sensing (CS) in image acquisition for quantitative T2 mapping. μMRI reaps greater benefit from the use of CS by acquiring sufficient data in shorter time, without loss of significant accuracy in T2 changes due to osteoarthritic cartilage.
Introduction
Articular cartilage is a thin layer of load-bearing tissue that enables efficient movement of the joints by reducing frictions1,2. Microscopically, it is mainly composed of water, proteoglycans, collagen, chondrocytes3. Conditional on the alignment of collagen fibers with respect to the tissue surface, articular cartilage can be conceptually subdivided to three histological zones: the superficial zone (SZ) with fibers parallel to the tissue surface, the transitional zone (TZ) with fibers randomly oriented, and the radial zone (RZ) with fibers perpendicular to the tissue surface4,5. The mechanisms of degeneration of articular cartilage is important to our understanding for the evolution of joint degenerative and traumatic diseases6.
The relaxation parameters in MRI have been widely used to detect the tissue degradation, such as T1 (spin-lattice relaxation time), T1ρ (spin-lattice relaxation time in the rotating frame), and T2 (spin-spin relaxation time)7–12. In general, quantitative mapping of articular cartilage requires acquiring multiple relaxation weighted images for single- or multi-exponential fitting13. Higher number of weighted images may result in a more precise determination of the relaxation times, with the penalty of linearly increased scan time. Compressed sensing (CS) as an acquisition-accelerating technique in MRI has been developed on the premise of reconstructing an image from a set of highly under-sampled data14–16. For example, since T1ρ attracts more attention due to its sensitivity to proteoglycan content8,17, Pandit et al accelerated T1ρ acquisition for knee cartilage up to 3 times without introducing major deviations in quantification relaxation time measurement using a combination of CS and data-driven parallel imaging18. Accelerating 3D-T1ρ mapping of cartilage with CS is feasible up to acceleration factor (AF) of 10 with T1ρ error below 6.5% when using the optimal regularization parameters for CS reconstruction36.
T2 mapping is one of the most studied MRI parameters for knee cartilage due to the availability of imaging sequences on all major vendors10,12. It is known that T2 is sensitive to water, collagen content, and tissue anisotropy4,19. Quantitative T2 mapping provides information about the interaction of water molecules and the collagen network within the articular cartilage. Alteration of T2 values have been shown to correlate with changes in water content, as well as collagen structure, orientation, and organization, and to be associated with changes in hyaline cartilage and its degradation20,21. Peng et al accelerated exponential parameterization of T2 relaxation with multi-coil Cartesian sampling and a mix of sparsity and low-rank priors22.
To the best of our knowledge, acceleration of the T2 mapping using CS has not been reported yet for μMRI studies. A single high-resolution multi-component T2 relaxation scan at microscopic resolution is very time-consuming, thus, reducing the scan time by CS is higher desirable13. This study aimed to evaluate the resolution-dependent influences of compressed sensing (CS) in MRI quantification of T2 mapping in articular cartilage with osteoarthritis (OA). We aim to explore the potential benefits of CS (at different AFs) in T2 mapping between healthy and osteoarthritic animal cartilage at two spatial resolutions, microscopic vs. macroscopic. Both resolutions are important in MRI of cartilage, since one can characterize the sub-tissue zones, while the other mimics the whole-body MRI of human joints. The quantification of T2 values in different layers of cartilage were quantified and used as the criteria to access the performance of CS.
Materials and Methods
Specimen Preparation
Intact healthy and OA knee joints, harvested from sacrificed mature canines, were used for this study with the approval of the institutional review committees. The OA knee was sacrificed 12 weeks after ACL (anterior cruciate ligament) transection surgery. After trimmed off excess tissues (muscles and skins), the intact knee joints were placed in a sample holder and imaged using a Varian MRI system with a 7T/20 cm horizontal magnet (Santa Clara. CA), at a 2D in-plane pixel size of 195.3 μm. For the remaining of this report, the resultant data from this system is labeled as low-resolution macro-MRI (mMRI). After the imaging of the intact joints, each joint capsule was opened to harvest a number of rectangular cartilage-bone plugs, each approximately 3 × 3 × 5 mm3 in size, from the medial tibial plateau, with each block representing a specific topographical location on the medial joint surface. The blocks were immersed in the physiological saline solution, which also contained 1mM Gd-DTPA2- contrast agent and 1% protease inhibitor cocktail (Sigma, MO). The specimens were maintained at 4°C (never frozen). The images from the cartilage-bone plugs at a 2D in-plane pixel size of 17.6μm were labeled as high-resolution micro-MRI (μMRI) in this report.
Macroscopic MRI (mMRI) Protocols
Quantitative mMRI T2 imaging of the intact joints was performed using a spin-echo (SE) multi-slice multi-echo (MSME) pulse sequence. The FOV was set at 5cm thickness with a matrix size of 256×256, which yielded an in-plane 195.3μm pixel size. The repetition time was 3s with ten echo times at an increment of 10ms with the minimum echo time at 10ms. Ten image slices, each with a slice thickness of 1mm and approx. 2.5mm apart from each other, were acquired with the interleaved format. For this study, only one of the slices from each of healthy and OA joints were used for analysis.
Microscopic MRI (μMRI) Protocols
Quantitative μMRI T2 imaging of the cartilage-bone plugs was performed at room temperature on a Bruker AVANCE II 300 NMR spectrometer, equipped with a 7T/89mm vertical-bore magnet and microimaging accessory (Billerica, MA). The 2D spin-echo imaging experiments were carried out with an acquisition matrix of 256×128 (which was post-reconstructed into a 256×256 matrix) and a single slice thickness of 1mm. The Field of View was 0.45cm×0.45cm, resulting in the 2D in-plane pixel size of 17.6μm. The repetition time TR was 0.8s23.
Quantitative 2D T2 imaging experiments were performed at both 0° and 55° with respect to the B0, and followed the previously established protocols. The elapsed time between the rf pulses in the CPMG T2-weighting segment was 1ms and the five echo times in imaging ranged from 2ms to 100ms19. All quantitative relaxation images were calculated subsequently by a single-component fit on a pixel-by-pixel basis24. A 10-pixel column was chosen from the center of each image and averaged to yield one depth-dependent relaxation profile and standard deviations.
Compressed Sensing Reconstruction
The varied density k-space sampling pattern is generated from a probability density function to maximize the incoherence14. The k-space points in the center of k-space were fully sampled (radius at least of 10 pixels), and the sampling became gradually sparse to the high frequency area16,25. The sampling patterns are generated for 4 different acceleration factors (AF = 4, 8, 16, and 32). The AF is the acquired k-space points divided by the total points of the k-space, which result in sampling the k-space data from 25.0% (at AF = 4) to 3.125% (at AF = 32) respectively. The sampling patterns are illustrated in the supplemental Figure 1.
Compressed sensing was applied on the k-space data of all individual T2-weighted 2D images by minimizing the following function with nonlinear conjugate gradients algorithm (and 200 iterations)16:
| (2) |
where x is the image and y is its corresponding k-space, F is the FFT, Ψ is the sparse transform, λ1 and λ2 are regularization parameters, and TV is the total variation. In this study, λ1 ranges from 0.002 to 0.010 for the sparse solution and λ2 ranges from 0.0012 to 0.011 for the data consistency, depending on the AFs (the supplemental Figure 2). Various CS acceleration factors (AF = 1, 4, 8, 16, and 32, where 1 stands for the fully sampled data and 32 stands for using 1/32 of the fully sampled data) were used to assess the accuracy for quantitative T2 values in the cartilage.
Results
mMRI T2-weighted images at various acceleration factors
Figure 1 shows the mMRI T2-weighted intensity images, comparing the fully sampled k-space images (the ground truth (GT)) and the under-sampled images with AF of 4, 8, 16, and 32, including both control (CTRL, a-e) and osteoarthritis (OA, f-j) knee joints. The qualities of the reconstructed T2 images were visually comparable with the ground truth at AF up to 8 with major information qualitatively preserved and negligible artifacts, while the qualities of the constructed images became visibly inferior at AFs of 16 and 32 (white arrows, enlarged images). With higher AFs (16 and 32), the image quality diminished, with exhibition of spatial blurring.
Figure 1.
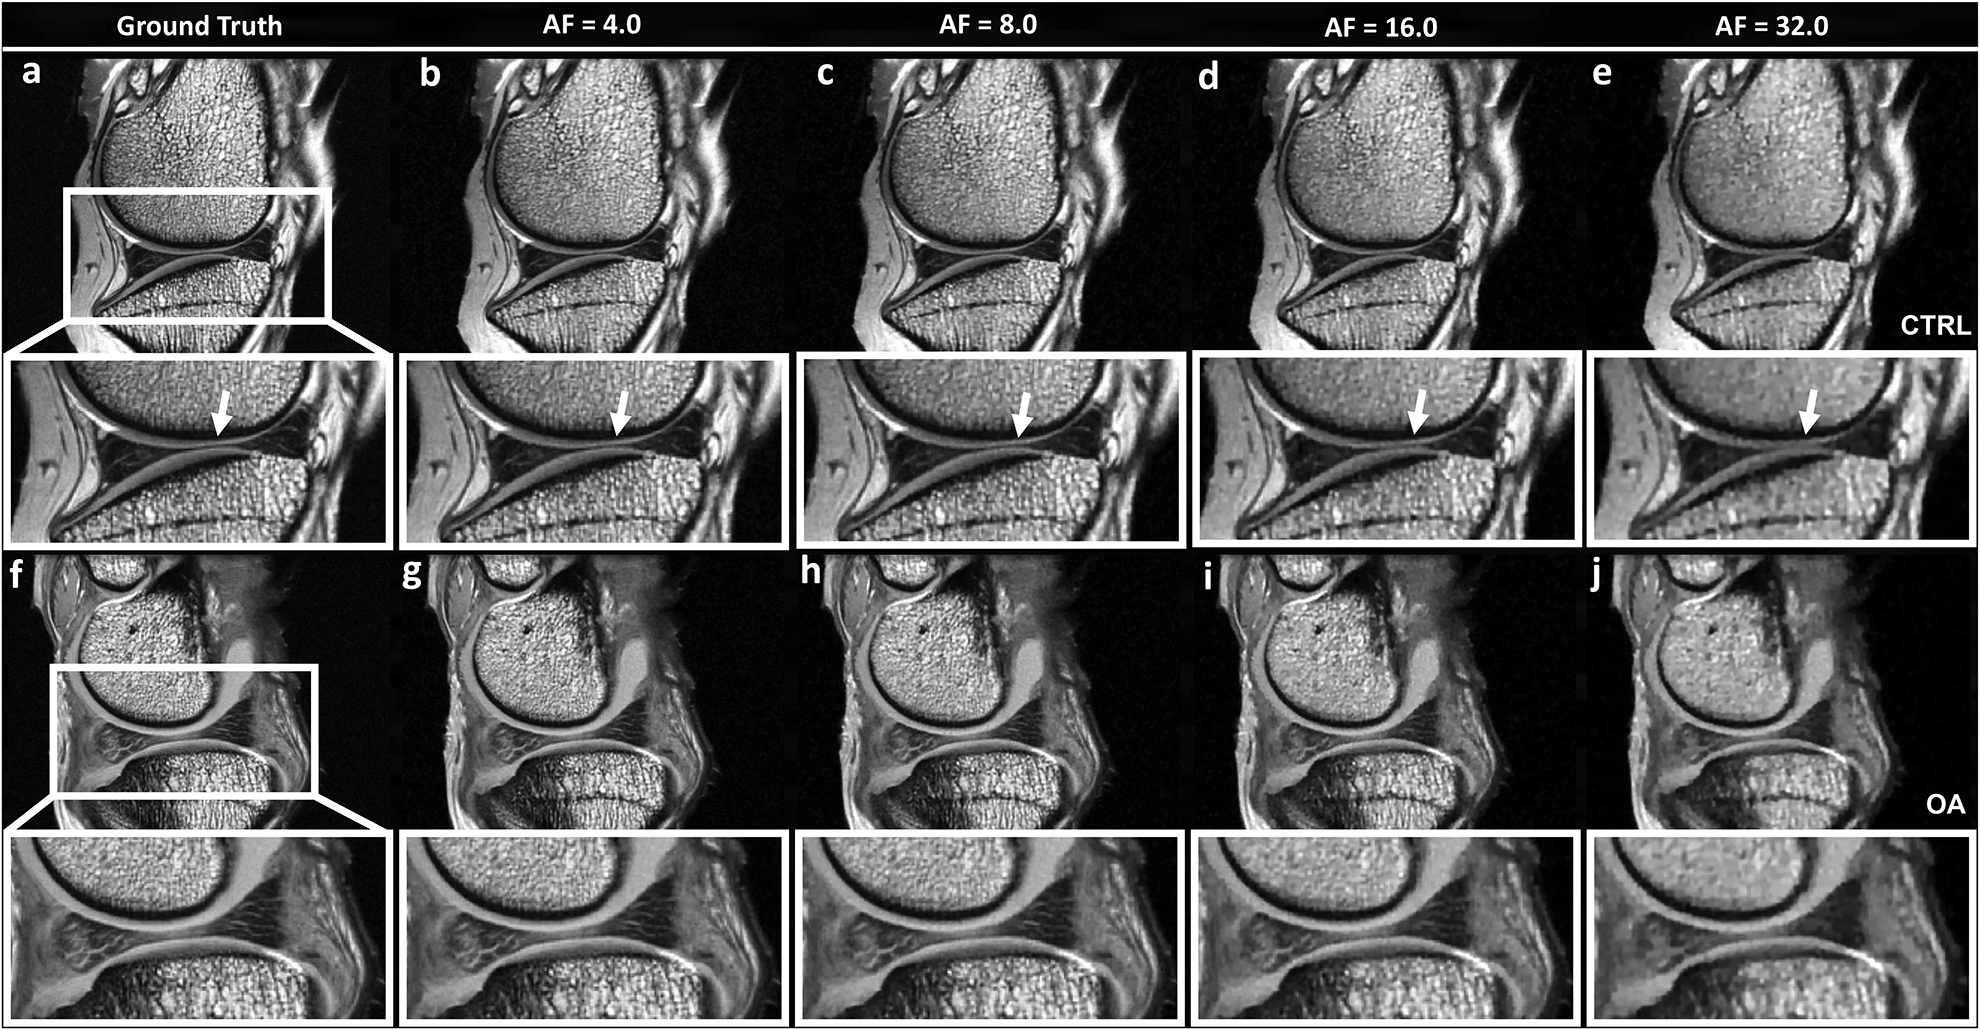
The fully sampled k-space mMRI T2-weighted images (ground truth GT) and the under sampled images with AF of 4, 8, 16, and 32, including both control (CTRL, a-e) and osteoarthritis (OA, f-j) knee joints. The qualities of the reconstructed images were visually comparable with the GT at AF up to 8 with major information qualitatively preserved and negligible artifacts, while the qualities of the reconstructed images became visibly inferior at AFs of 16 and 32 (white arrows, enlarged images). With higher AFs (16 and 32), the image quality diminished to some extent, with exhibition of spatial blurring.
mMRI T2 maps at various acceleration factors
Figure 2 shows the quantitative mMRI T2 maps and the error maps at different AFs. Interpretations reached from this set of data are; firstly, T2 values showed strong depth-dependent properties throughout the cartilage region, where SZ had higher T2 values than RZ and secondly, the deviation from the ground truth gradually increased with higher AF, where the images became blurring in both cartilage and bone regions, especially for AF of 16 and 32. The cartilage interface between tibia and femur (green arrows) were less distinct due to the loss of high frequency information. The bone regions (yellow arrows and white arrowheads) always exhibited higher difference compared to cartilage regions.
Figure 2.
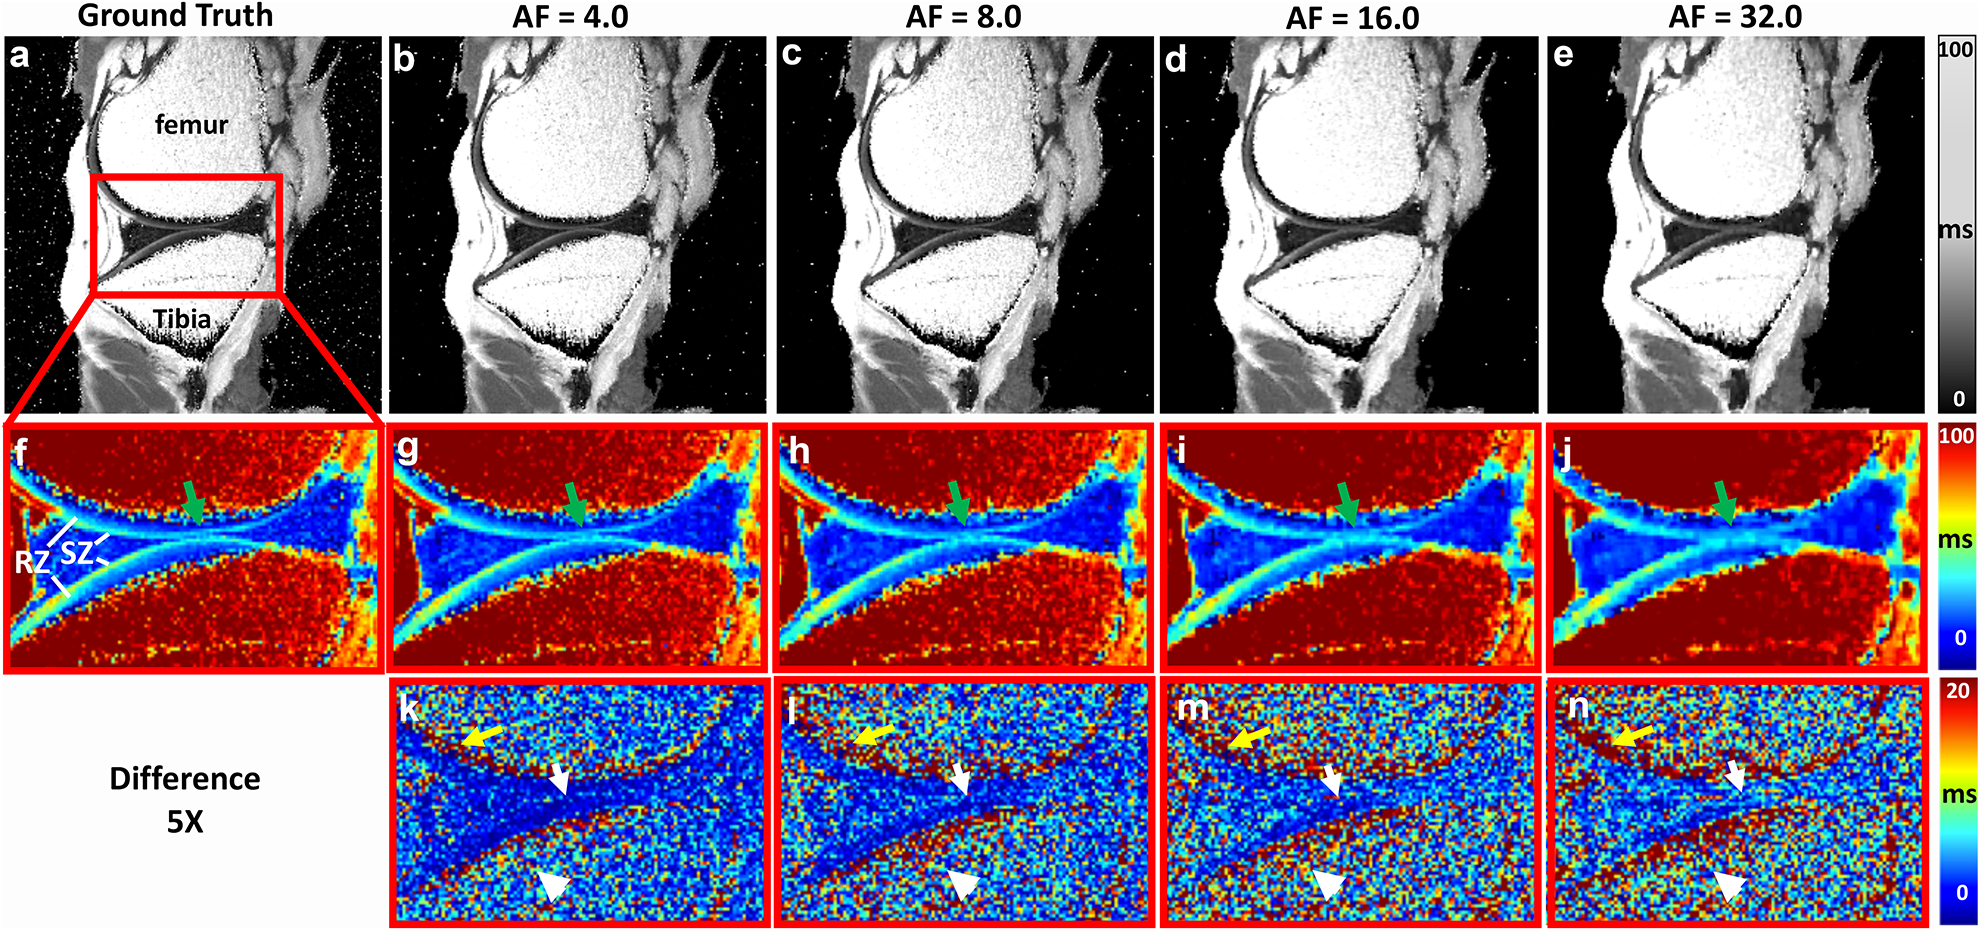
Quantitative mMRI T2 maps at different AFs. T2 values showed strong depth-dependent properties throughout the cartilage region, where SZ had higher T2 values than RZ. The deviation from the GT gradually increased with higher AF, where the images became blurring in both cartilage (green arrows) and bone (white arrowheads) regions, especially for AF of 16 and 32. The while arrows in the 5x difference maps mark the interface between the femoral and tibial cartilage.
μMRI T2-weighted images at various acceleration factors
Figure 3 shows the μMRI T2-weighted intensity images, comparing the fully sampled k-space images (ground truth) and the under-sampled images with AF of 4, 8, 16, and 32, including both control (CTRL, a-e) and osteoarthritis (OA, f-j) knee joints at 0° respect to the main magnetic field. Compared to CTRL, OA cartilage was much thicker, which was the sign for an early stage degradation. The qualities of the reconstructed T2-weighted images were visually comparable with the ground truth at AF up to 8 with major information qualitatively preserved and negligible artifacts, while the qualities of the constructed images became visibly inferior at AF of 32 (e, black arrows). With higher AF (16 and 32), the image quality diminished, with exhibition of spatial blurring. T2 weighted images at different echo times (2ms and 100 ms) at the magic angle showed the similar results for both CTRL and OA (supplemental figure 3).
Figure 3.
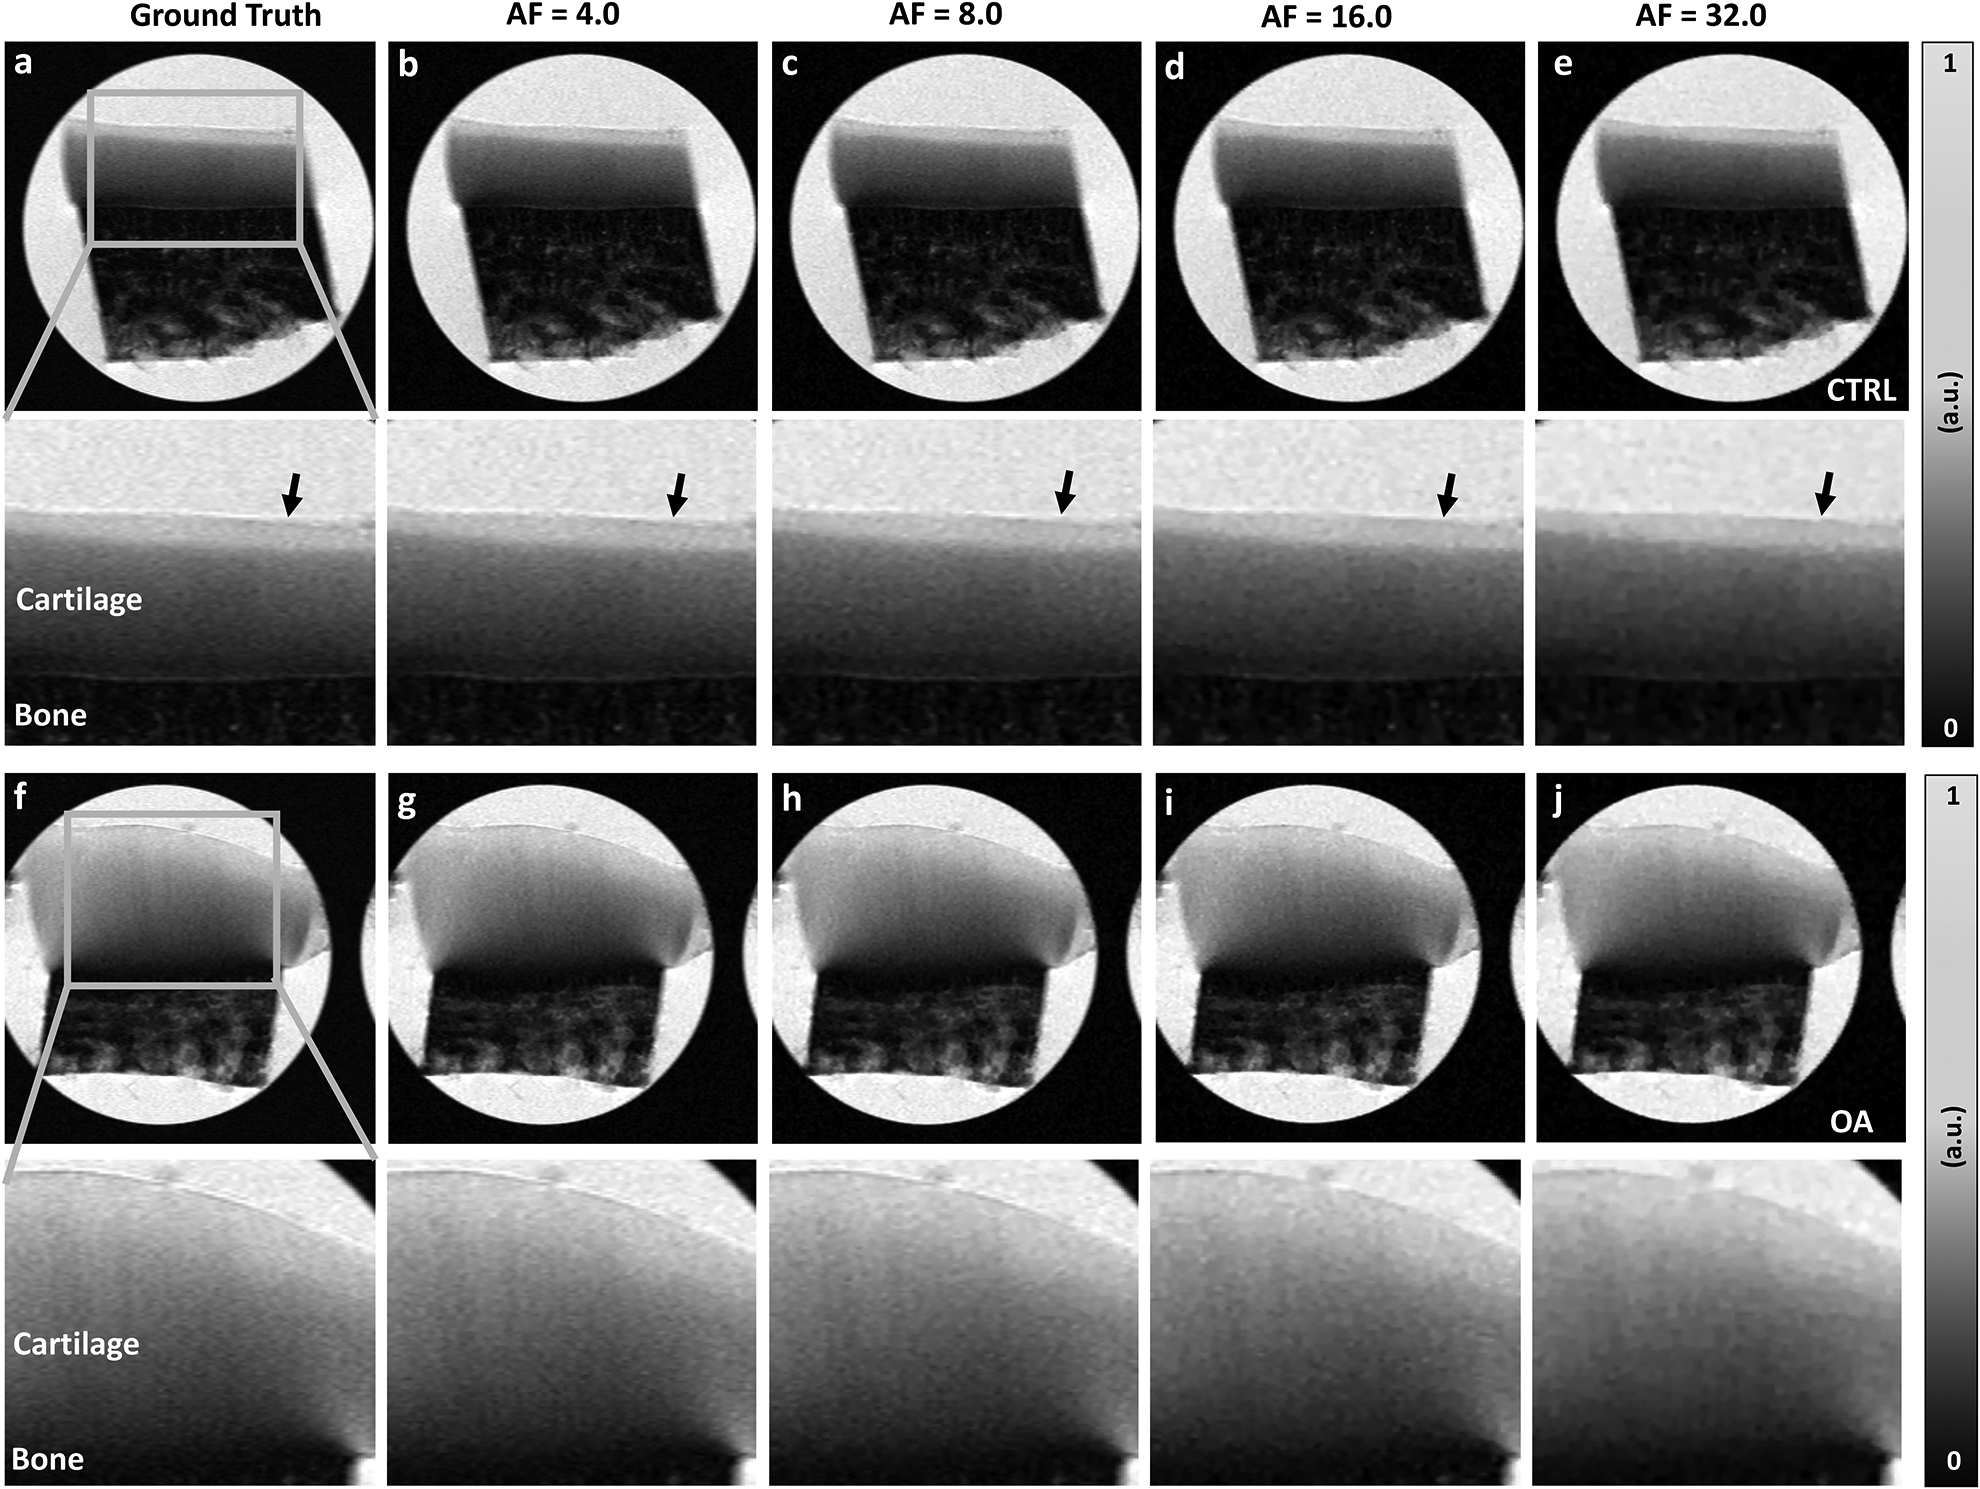
The fully sampled k-space μMRI T2-weighted images (GT) and the under sampled images with AF of 4, 8, 16, and 32, including both control (CTRL, a-e) and osteoarthritis (OA, f-j) knee joints at 0° respect to the main magnetic field. Compared to CTRL, the thickness of OA cartilage was much larger. The qualities of the reconstructed T2-weighted images were visually comparable with the GT at AF up to 8 with major information qualitatively preserved and negligible artifacts (black arrows mark the cartilage surface). With higher AF (16 and 32), the image quality diminished to some extent, with exhibition of spatial blurring.
μMRI T2 maps at various acceleration factors
Figure 4 shows the quantitative μMRI T2 images at different AFs (4, 8, 16, and 32) and the corresponding error maps from the ground truth. T2 values showed strong depth-dependent properties throughout both CTRL (a) and OA (j) cartilage regions, where SZ and TZ (red arrows) have higher T2 values than RZ (yellow arrows). The deviation from the ground truth gradually increases with higher AF, in cartilage regions for both CTRL (white arrowheads) and OA (white arrows) specimens, especially at high AF.
Figure 4.
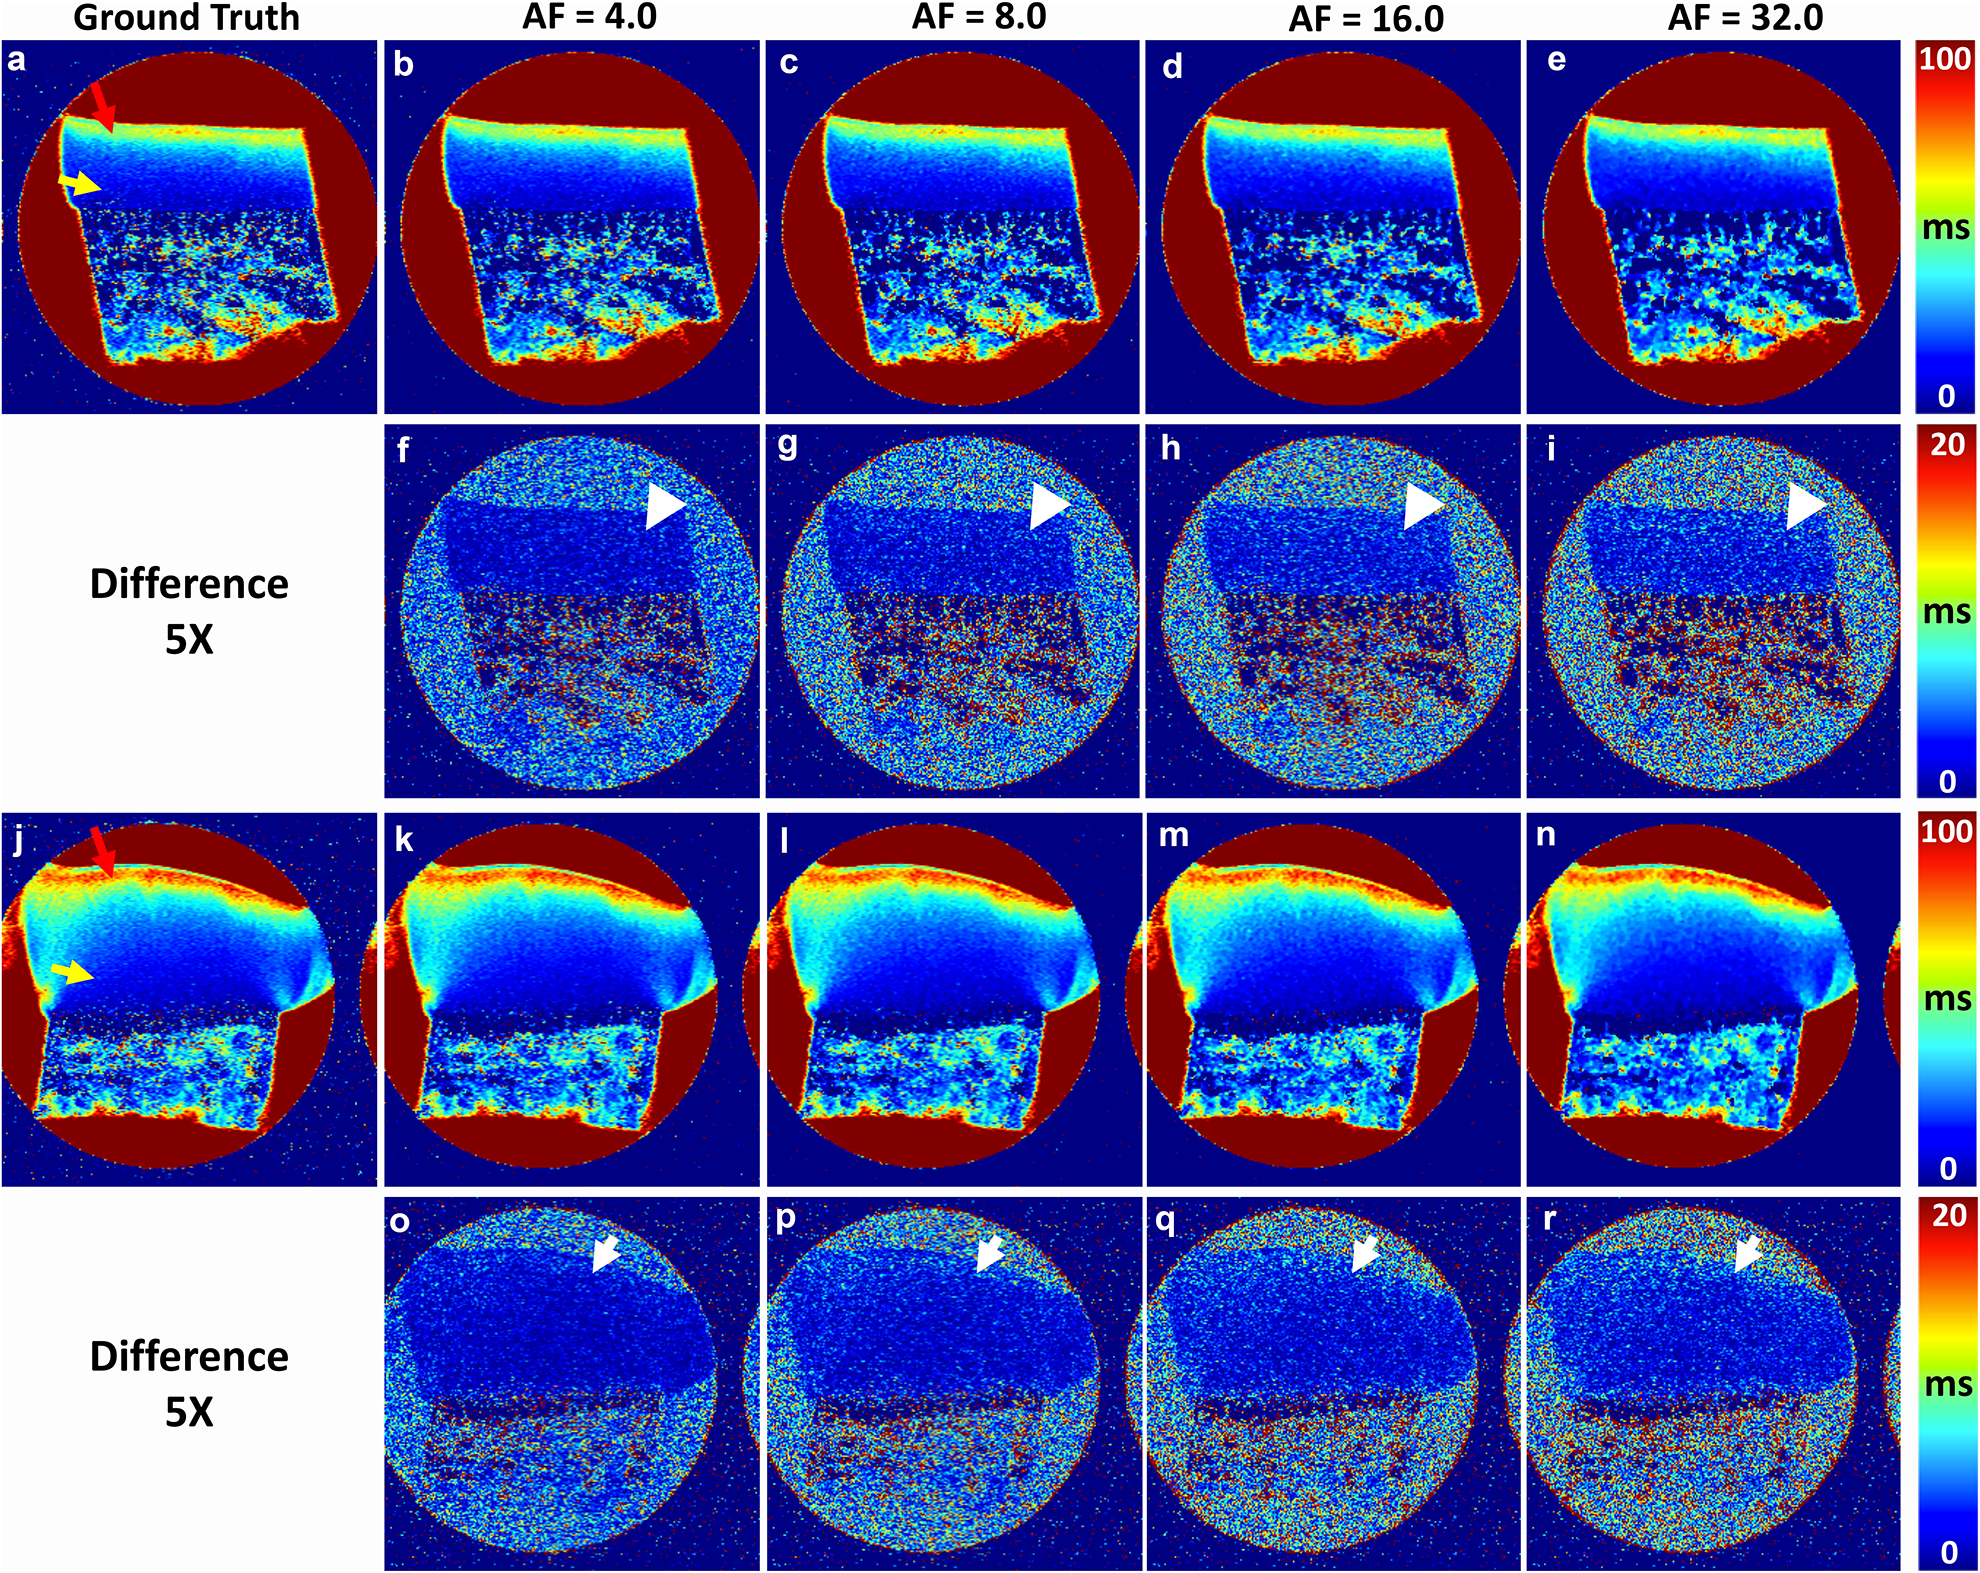
Quantitative μMRI T2 at different AFs (4, 8, 16, and 32) and the corresponding error maps (5x) from the ground truth (a, j), where the images a-e are healthy cartilage while the images j-n are diseased cartilage. The color arrows in a and j mark the surface tissue and deep tissue. The white arrows and white arrowheads in the difference maps mark the regions with high deviations from the ground truth.
T2 profiles at various acceleration factors
Figure 5 illustrates the quantitative depth-dependent T2 profiles of CTRL and OA cartilages at both microscopic and macroscopic resolution. Several distinct features can be identified in these complex T2 profiles at different orientations. First, cartilage had clear laminar appearance in the T2 profiles at 0° for both CTRL and OA, and for both μMRI (a-b) and mMRI (e-f), which shows the OA was at the early stage. The profiles showed similar trend in both μMRI and mMRI, where TZ had higher T2 values than SZ and RZ. The T2 values in μMRI increased at 55° (c-d), while the laminar appearance was still apparent. Second, μMRI T2 values of OA (b, d) were always higher than the T2 values of CTRL (a, c) through the whole tissue depth, regardless of the orientation. Third, the μMRI T2 profiles derived from different CS acceleration factors were consistent with the fully sampled data even at AF of 32. The mMRI T2 profiles at different CS acceleration factors (e-f) had similar trends, while the deviations were visually larger at SZ and deep part of RZ.
Figure 5.
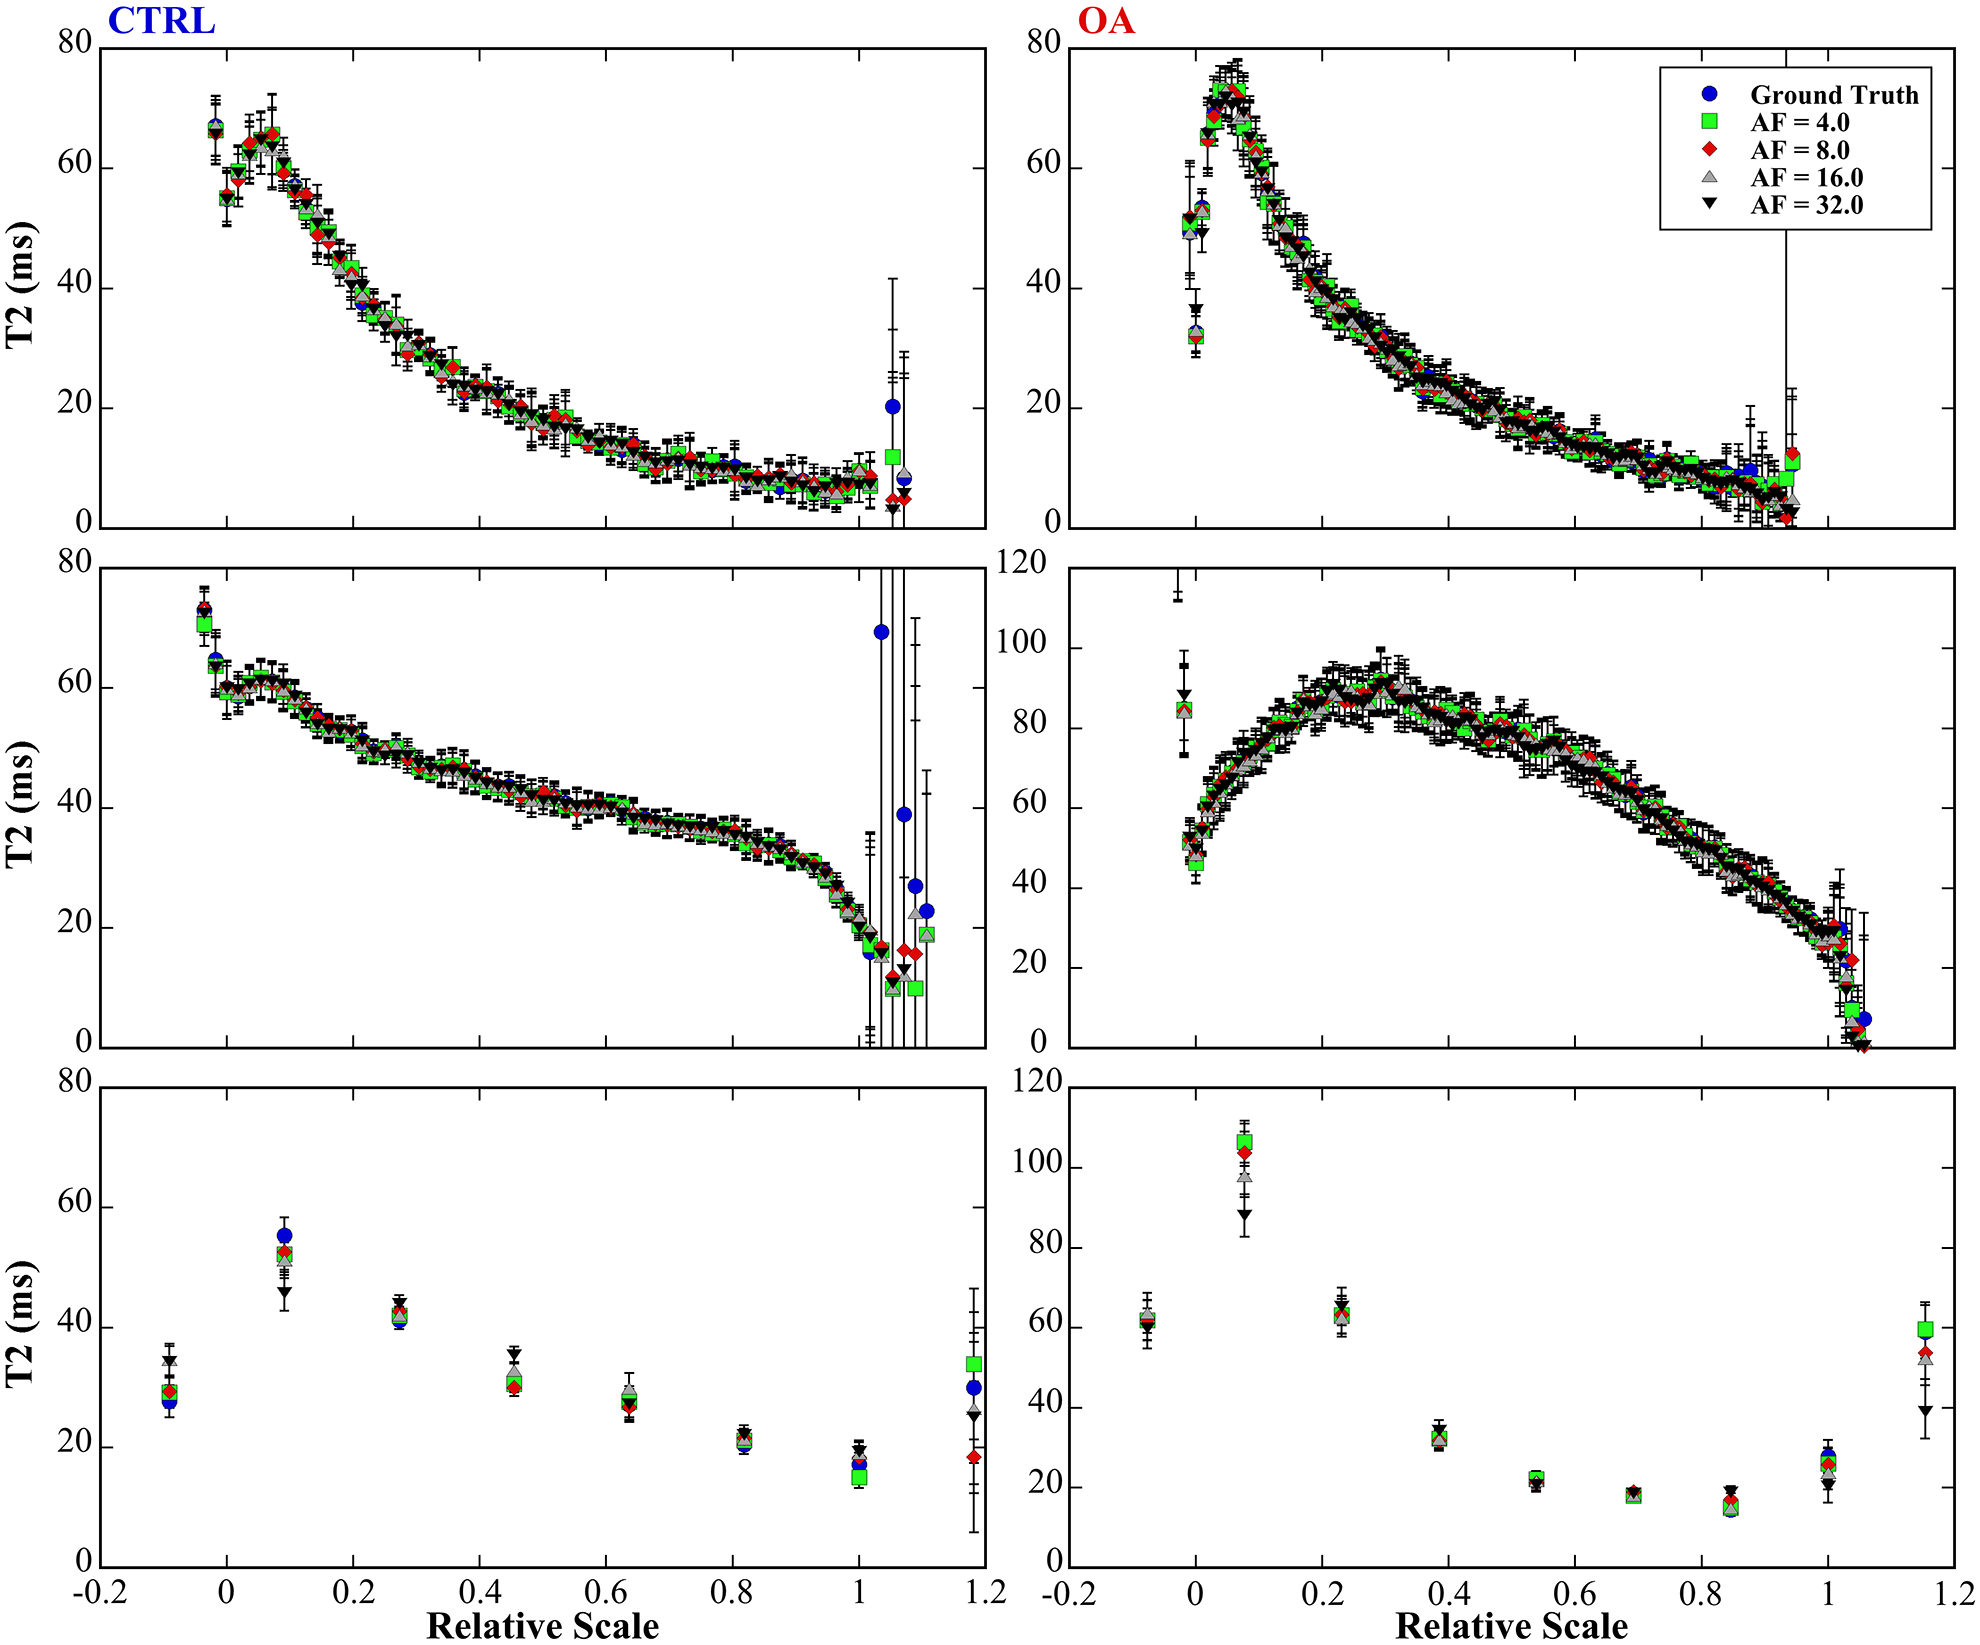
The quantitative depth-dependent T2 profiles of CTRL and OA cartilages at both microscopic (a-b at 0°, c-d at 55°) and macroscopic resolution (e-f). The tissue had clear laminar appearance in the T2 profiles at 0° for both CTRL (a) and OA (b), and for both μMRI (e) and mMRI (f). The μMRI T2 profiles derived from different CS acceleration factors were consistent with the fully sampled data even at AF of 32. The mMRI T2 profiles (e-f) at different CS acceleration factors had similar trends, while the deviations were visually larger at SZ and RZ.
Quantitative Zonal Comparisons of T2 values
Figure 6 shows the zonal changes of T2 in articular cartilage at various AFs (4, 8, 16, 32) for both μMRI (0° and 55°) and mMRI. In the zonal analysis, the whole cartilage thickness was divided5 to 4 sub-tissue structural zones for both mMRI and μMRI: SZ, TZ, and upper RZ (RZI) and lower RZ (RZII) in order to investigate the T2 variations in these sub-tissue zones at different AFs for both CTRL and OA. In μMRI, the maximum variation was found at the RZII (OA) with 2.75 % difference from the ground truth with AF of 32 at 0°, while the maximum variation was found at the RZII (OA) with 2.2 % with AF of 32 at 55°. These variations of zonal T2 values in μMRI were found to have no significant differences even at AF of 32. In contrast, in mMRI of zonal T2 analysis, a number of statistically differences existed in both SZ and RZII when AF was at 32.
Figure 6.
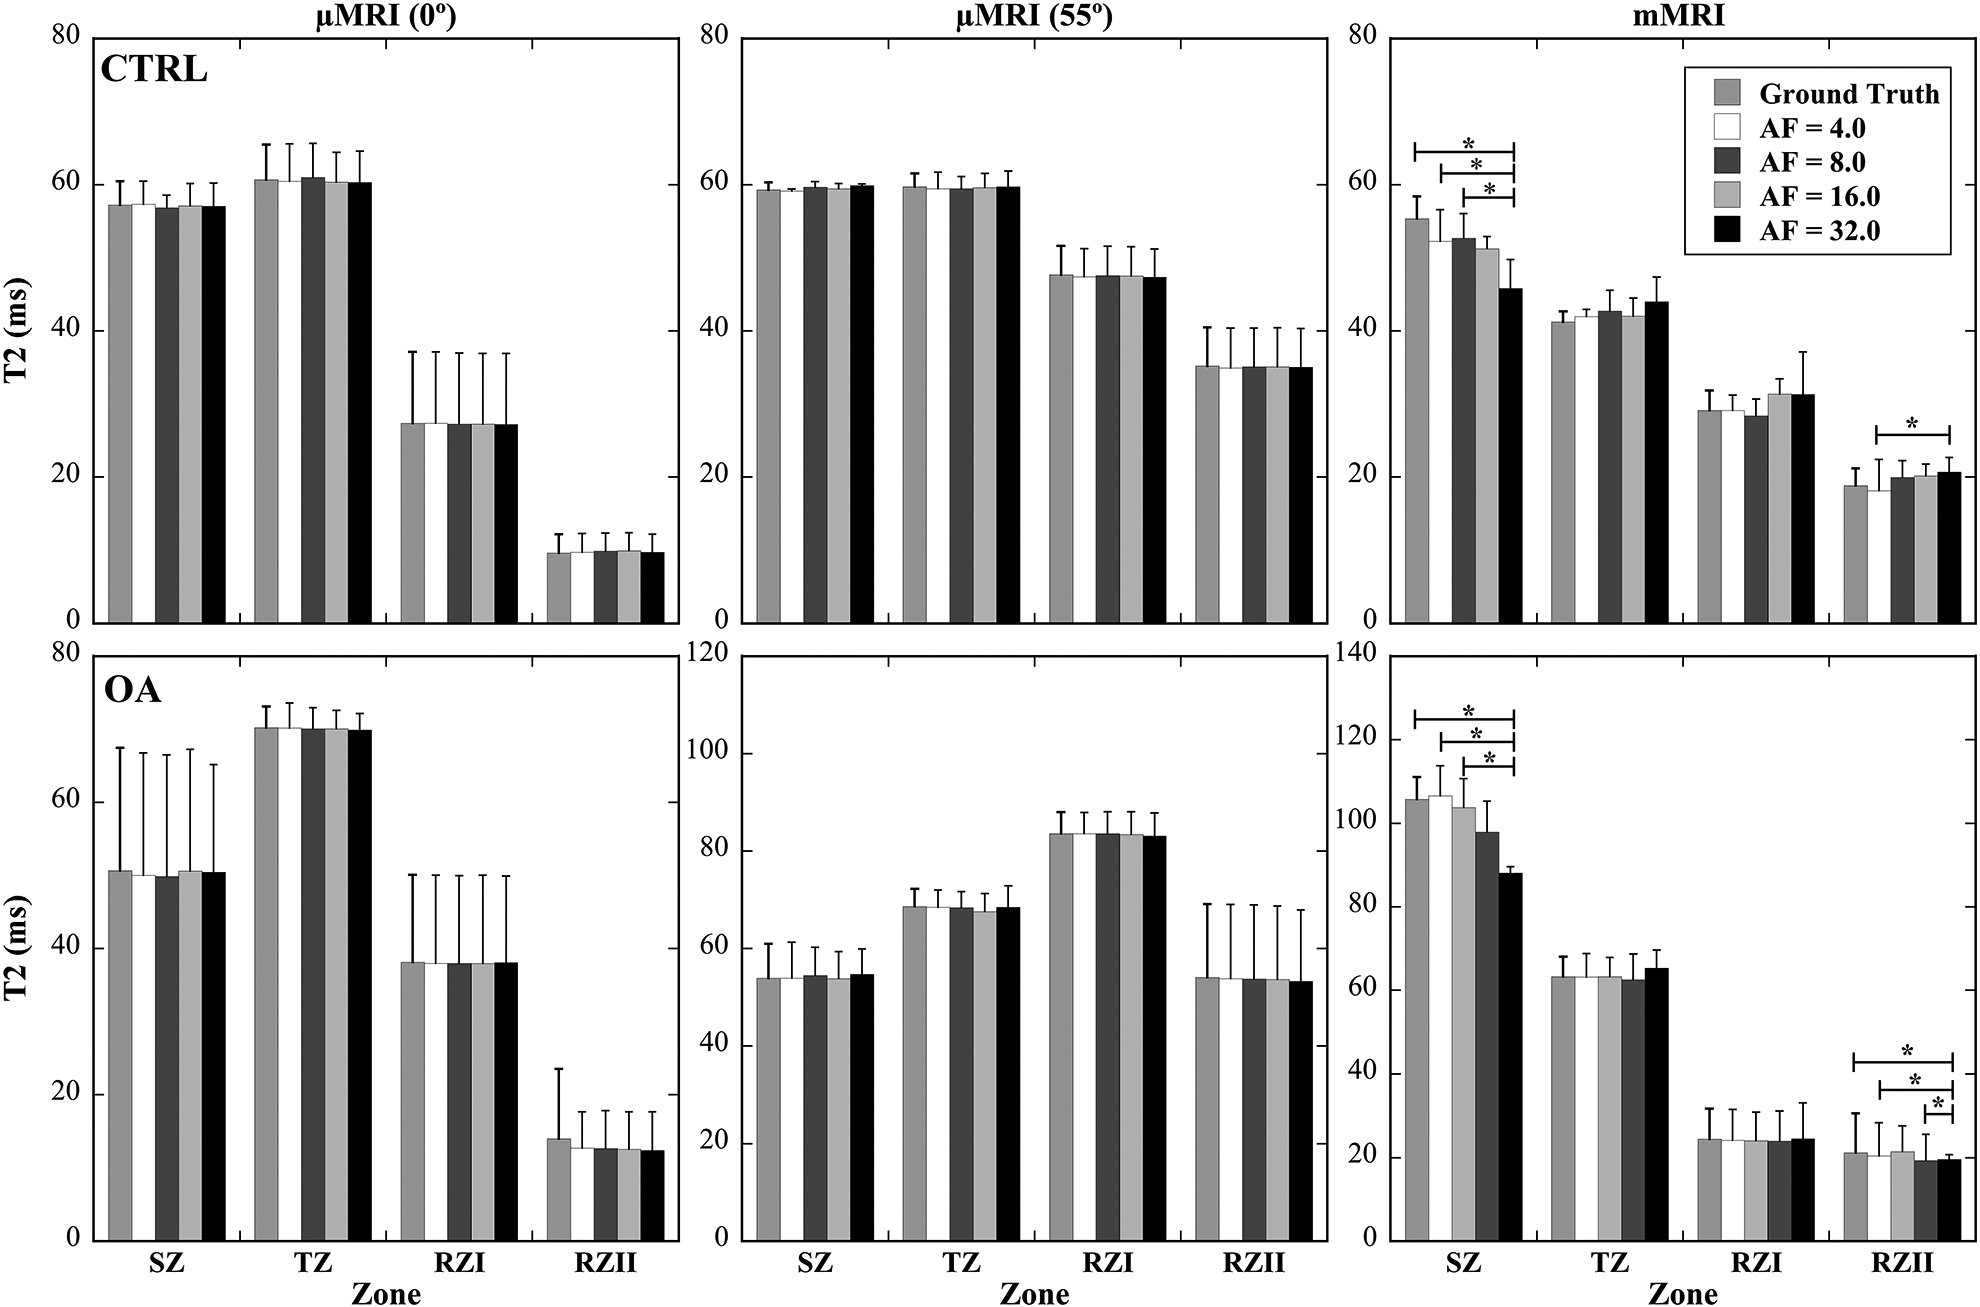
The zonal changes of T2 in articular cartilage at various AFs (4, 8, 16, 32) for both μMRI (0° and 55°) and mMRI. The whole cartilage thickness was divided to 4 sub-tissue structural zones for both mMRI and μMRI: SZ, TZ, and upper RZ (RZI) and lower RZ (RZII) in order to investigate the T2 variations in these zones at different AFs for both CTRL and OA. The asterisks indicate the statistical significance from the pair-wise comparisons using a Tukey HSD test with p<0.05 as significant.
Figure 7 shows the percentage differences of the whole cartilage T2 between the ground truth and various AFs (4, 8, 16, 32). In general, T2 values were found to increase with increasing AFs, when compared to the ground truth. In μMRI images at both 0° and 55° orientations (Fig 7a, 7b), both CTRL and OA images showed similar increases from the ground truth linearly for each of AFs, all with very small variations. In mMRI images (Fig 7c), both CTRL and OA images showed a much higher percent difference, with OA having the highest variations (i.e., high deviations from the ground truth, i.e., over 20%) at high AFs (8 – 32).
Figure 7.
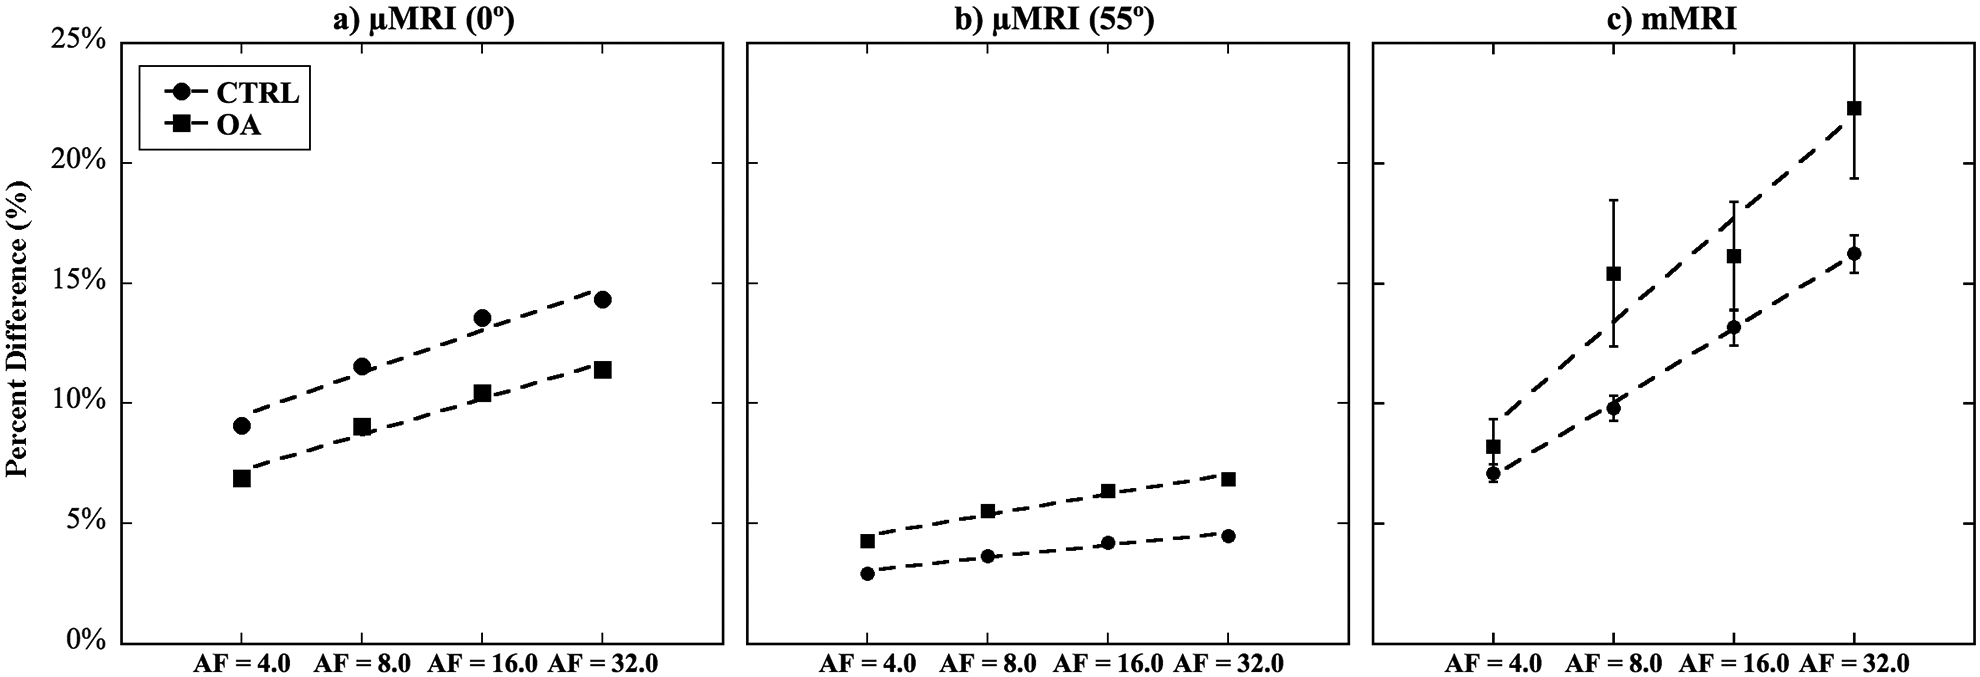
The percent changes of T2 values across the whole articular cartilage thickness at various AFs (4, 8, 16, 32), when comparing with the T2 values at the ground truth.
Discussion
MRI of the knee joint is often challenging because of the complex anatomy, thin layer tissues such as cartilage and meniscus, and short and depth-dependent T2/T2* values9,13,26. Therefore, high spatial resolution images are crucial to accurately identify knee anatomy and pathology. The μMRI is suitable for preclinical studies but the acquisition time could take hours depending on the scan protocols27. In addition, we always use the magnetization-prepared imaging sequences in our cartilage imaging, which generate the quantitative relaxation data much less susceptible to the other experimental parameters in imaging protocols5. In the past decade, CS has been applied in quantitative musculoskeletal MRI at various resolutions to reduce the scan time16,18,22. However, the comparison of CS performance between clinical MRI and μMRI has not been investigated in detail.
One subtle but important reason to use two resolutions in this MRI CS study of cartilage came from the imaging scaling in MRI of cartilage27. The mMRI resolution in this study was about 200μm, which can resolve the canine cartilage with 5 pixels inside the thickness of the cartilage (Fig 5). The percentage thickness, where each pixel accounts for the portion of cartilage thickness, in this mMRI study of canine cartilage is therefore similar to the percentage thickness of each pixel in whole-body clinical MRI of human cartilage in an intact joint, where a thicker cartilage is typically resolved by 4–5 larger pixels. Therefore, the low-resolution mMRI of canine cartilage mimics almost exactly the tissue averaging situation in clinical MRI of human cartilage27. The results in this mMRI (i.e., pseudo-clinical MRI) study should reflect the consequence of using CS approach in clinical MRI of cartilage degradation in OA research, which is compared with the results from the much higher resolution μMRI.
The superficial zone of articular cartilage has distinct structural features and unique mechanical properties4,6,28. The collagen fibers are aligned parallel to the articular surface compared to the perpendicular fibers in the deep radial zone. The proteoglycan content and fixed charge density are lower than in the deep zone29. Early to mild OA change could be characterized by the loss of proteoglycans in the surface area30–32. Although these changes were not accompanied by significant structural disturbances in the tissue, they were associated with increased type II collagen and aggrecan synthesis33. It has been reported that early OA articular cartilage degeneration can be observed focally, thus, high spatial resolution MRI is ideal to detect early OA more accurately8,30,31,34. However, clinical MRI suffers from lower spatial resolution in a reasonable scan time, where various acceleration methods can become useful35–38. The results in this study suggests that more efficient data acquisition using CS in clinical MRI can be used to improve spatial resolution14,16,25,39.
Although both T2-weighed images and T2 maps of μMRI exhibits qualitatively good image quality even at AFs of 16, the images begin to blur at high AFs, which may be caused by the reduction of high frequency components in k-space, hence, making it more difficult to recover the fine details of the image16. The blurring effects have much more severe consequences for mMRI when AF is higher than 4. The reason for the AF difference between μMRI and mMRI is the number of pixels for the important features in the images. In mMRI, there are only a few pixels through the whole cartilage thickness, the blurring effects may have a major impact due to the partial volume effect and further affect the quantification in SZ and RZII. Indeed, significantly higher T2 percent difference was confirmed in these two regions in mMRI (Fig 7c), which calls attention for the application of CS to detect the zonal differences in early OA at macroscopic resolution. In contrast, there are about 60 pixels in μMRI (10 times of mMRI) through the whole cartilage thickness, which results in better tolerance to the blurring effects. The μMRI T2-weighted images exhibits relatively plain structure in each layer without sharp edges and fine structures; the high frequency component leaking is also reduced compared to the complex anatomy of the whole knee joint with various types of connective tissues and bones in mMRI.
An experimental note should be made here. As evident from Figure 3, the OA samples, which came from approximately the same location on the medial tibial surface as the healthy cartilage, were thicker than the healthy cartilage. This increase in cartilage thickness was largely due to the disease itself. At the early stage of OA, cartilage is known to swell, because OA cartilage had less proteoglycans and higher fibrillation due to the disease. At the same time, swelling of tissue in the buffer solution cannot be ruled out. In our imaging practice, we paid attention to a few experimental details, which make the influences of swelling small. First, both healthy and OA samples were placed in the same batch of the buffer solution. Second, we always keep the interface between cartilage and bone intact, to minimize the swelling. Finally, our quantitative comparisons always come from the middle part of the specimens, away from the horizontal edges where swelling are more likely.
In conclusion, to the best of our knowledge, this is the first study that comparing the CS performance of T2 values in cartilage at both μMRI and mMRI (i.e., pseudo-clinical MRI) using the same specimens. The use of CS in quantitative T2 MRI is still very much an open field and we reveal the challenges of using CS for quantitative imaging of cartilage, especially in the SZ and deep RZ of cartilage. We show that both μMRI and mMRI can benefit from the use of CS in image acquisition; we also show that the time-consuming μMRI can benefit more from the use of CS in imaging acquisition. The reduction of the scan time can be translated into achieve higher spatial resolution with the same scan time.
Supplementary Material
Supplement Figure 1. The optimized k-space sampling patterns at different AFs.
Supplement Figure 2. The reconstructed T2 weighted images (echo times of 2 ms and 100 ms) are highly dependent on the regularization parameters.
Supplement Figure 3. The μMRI T2 weighted images (echo times of 2ms and 100 ms) at different AFs for both CTRL and OA at the magic angle.
Acknowledgments
Yang Xia is grateful to the National Institutes of Health for the R01 grants (AR052353 and AR069047). The Center for In Vivo Microscopy is supported through NIH awards P41 EB015897 (to Dr. G Allan Johnson). This work is also supported by Charles E. Putman MD Vision Award of the Department of Radiology, Duke University School of Medicine (to Nian Wang and Charles E. Spritzer). The authors thank Drs. Cliff Les and Hani Sabbah (Henry Ford Hospital, Detroit) for providing the canine specimens, and Ms. Carol Searight (Department of Physics, Oakland University) for editorial comments on the manuscript.
Grant Support: NIH R01 grants (AR052353, AR069047)
A list of all abbreviations
- MR
Magnetic Resonance
- MRI
Magnetic Resonance Imaging
- mMRI
Macroscopic Magnetic Resonance Imaging
- μMRI
Microscopic Magnetic Resonance Imaging
- CS
Compressed Sensing
- GT
Ground Truth
- AF
Acceleration Factor
- OA
Osteoarthritis
- ACL
Anterior Cruciate Ligament
- SZ
Superficial Zone
- TZ
Transitional Zone
- RZ
Radial Zone
- 2D
Two Dimensional
- 3D
Three Dimensional
- CTRL
Control
- T1
Spin-lattice Relaxation Time
- T1ρ
Spin-lattice Relaxation Time in the Rotating Frame
- T2
Spin-spin Relaxation Time
- SE
Spin Echo
- CPMG
Carr-Purcell-Meiboom-Gill sequence
References
- 1.Morrison J The mechanics of the knee joint in relation to normal walking. Journal of biomechanics. 1970;3(1):51–61. [DOI] [PubMed] [Google Scholar]
- 2.Maroudas A Biophysical Chemistry of Cartilaginous Tissues with Special Reference to Solute and Fluid Transport. Biorheology. 1975;12(3–4):233–248. [DOI] [PubMed] [Google Scholar]
- 3.Lehner KB, Rechl HP, Gmeinwieser JK, Heuck AF, Lukas HP, Kohl HP. Structure, Function, and Degeneration of Bovine Hyaline Cartilage - Assessment with Mr Imaging Invitro. Radiology. 1989;170(2):495–499. [DOI] [PubMed] [Google Scholar]
- 4.Xia Y MRI of articular cartilage at microscopic resolution. Bone Joint Res. 2013;2(1):9–17. [DOI] [PMC free article] [PubMed] [Google Scholar]
- 5.Xia Y, Moody JB, Burton-Wurster N, Lust G. Quantitative in situ correlation between microscopic MRI and polarized light microscopy studies of articular cartilage. Osteoarthritis Cartilage. 2001;9(5):393–406. [DOI] [PubMed] [Google Scholar]
- 6.Amiri S, Cooke D, Kim IY, Wyss U. Mechanics of the passive knee joint. Part 1: the role of the tibial articular surfaces in guiding the passive motion. P I Mech Eng H. 2006;220(H8):813–822. [DOI] [PubMed] [Google Scholar]
- 7.Xia Y, Moody JB, Alhadlaq H. Orientational dependence of T2 relaxation in articular cartilage: A microscopic MRI (microMRI) study. Magn Reson Med. 2002;48(3):460–469. [DOI] [PubMed] [Google Scholar]
- 8.Li X, Han ET, Ma CB, Link TM, Newitt DC, Majumdar S. In vivo 3T spiral imaging based multi-slice T(1rho) mapping of knee cartilage in osteoarthritis. Magn Reson Med. 2005;54(4):929–936. [DOI] [PubMed] [Google Scholar]
- 9.Du J, Carl M, Bae WC, et al. Dual inversion recovery ultrashort echo time (DIR-UTE) imaging and quantification of the zone of calcified cartilage (ZCC). Osteoarthritis Cartilage. 2013;21(1):77–85. [DOI] [PMC free article] [PubMed] [Google Scholar]
- 10.Bredella MA, Tirman PF, Peterfy CG, et al. Accuracy of T2-weighted fast spin-echo MR imaging with fat saturation in detecting cartilage defects in the knee: comparison with arthroscopy in 130 patients. AJR Am J Roentgenol. 1999;172(4):1073–1080. [DOI] [PubMed] [Google Scholar]
- 11.Bashir A, Gray ML, Burstein D. Gd-DTPA2- as a measure of cartilage degradation. Magn Reson Med. 1996;36(5):665–673. [DOI] [PubMed] [Google Scholar]
- 12.Anz AW, Lucas EP, Fitzcharles EK, Surowiec RK, Millett PJ, Ho CP. MRI T2 mapping of the asymptomatic supraspinatus tendon by age and imaging plane using clinically relevant subregions. Eur J Radiol. 2014;83(5):801–805. [DOI] [PubMed] [Google Scholar]
- 13.Wang N, Xia Y. Experimental issues in the measurement of multi-component relaxation times in articular cartilage by microscopic MRI. J Magn Reson. 2013;235:15–25. [DOI] [PMC free article] [PubMed] [Google Scholar]
- 14.Lustig M, Donoho D, Pauly JM. Sparse MRI: The application of compressed sensing for rapid MR imaging. Magn Reson Med. 2007;58(6):1182–1195. [DOI] [PubMed] [Google Scholar]
- 15.Wang N, Anderson RJ, Badea A, et al. Whole mouse brain structural connectomics using magnetic resonance histology. Brain Struct Funct. 2018;223(9):4323–4335. [DOI] [PMC free article] [PubMed] [Google Scholar]
- 16.Wang N, Badar F, Xia Y. Compressed sensing in quantitative determination of GAG concentration in cartilage by microscopic MRI. Magn Reson Med. 2018;79(6):3163–3171. [DOI] [PMC free article] [PubMed] [Google Scholar]
- 17.Wang N, Kahn D, Badar F, Xia Y. Molecular Origin of a Loading-Induced Black Layer in the Deep Region of Articular Cartilage at the Magic Angle. Journal of Magnetic Resonance Imaging. 2015;41(5):1281–1290. [DOI] [PMC free article] [PubMed] [Google Scholar]
- 18.Pandit P, Rivoire J, King K, Li X. Accelerated T1rho acquisition for knee cartilage quantification using compressed sensing and data-driven parallel imaging: A feasibility study. Magn Reson Med. 2016;75(3):1256–1261. [DOI] [PMC free article] [PubMed] [Google Scholar]
- 19.Wang N, Xia Y. Depth and orientational dependencies of MRI T(2) and T(1rho) sensitivities towards trypsin degradation and Gd-DTPA(2-) presence in articular cartilage at microscopic resolution. Magn Reson Imaging. 2012;30(3):361–370. [DOI] [PMC free article] [PubMed] [Google Scholar]
- 20.Dunn TC, Lu Y, Jin H, Ries MD, Majumdar S. T2 relaxation time of cartilage at MR imaging: comparison with severity of knee osteoarthritis. Radiology. 2004;232(2):592–598. [DOI] [PMC free article] [PubMed] [Google Scholar]
- 21.Glaser C New techniques for cartilage imaging: T2 relaxation time and diffusion-weighted MR imaging. Radiol Clin North Am. 2005;43(4):641–653, vii. [DOI] [PubMed] [Google Scholar]
- 22.Peng X, Ying L, Liu Y, Yuan J, Liu X, Liang D. Accelerated exponential parameterization of T2 relaxation with model-driven low rank and sparsity priors (MORASA). Magn Reson Med. 2016;76(6):1865–1878. [DOI] [PubMed] [Google Scholar]
- 23.Wang N, Chopin E, Xia Y. The effects of mechanical loading and gadolinium concentration on the change of T1 and quantification of glycosaminoglycans in articular cartilage by microscopic MRI. Phys Med Biol. 2013;58(13):4535–4547. [DOI] [PMC free article] [PubMed] [Google Scholar]
- 24.Wang N, Badar F, Xia Y. MRI properties of a unique hypo-intense layer in degraded articular cartilage. Phys Med Biol. 2015;60(22):8709–8721. [DOI] [PMC free article] [PubMed] [Google Scholar]
- 25.Wang N, Mirando AJ, Cofer G, Qi Y, Hilton MJ, Johnson GA. Diffusion tractography of the rat knee at microscopic resolution. Magnetic resonance in medicine. 2019;81(6):3775–3786. [DOI] [PubMed] [Google Scholar]
- 26.Mesgarzadeh M, Schneck CD, Bonakdarpour A. Magnetic resonance imaging of the knee and correlation with normal anatomy. Radiographics. 1988;8(4):707–733. [DOI] [PubMed] [Google Scholar]
- 27.Xia Y. Resolution ‘scaling law’ in MRI of articular cartilage. Osteoarthritis Cartilage. 2007;15(4):363–365. [DOI] [PMC free article] [PubMed] [Google Scholar]
- 28.Amiri S, Cooke D, Kim IY, Wyss U. Mechanics of the passive knee joint. Part 2: interaction between the ligaments and the articular surfaces in guiding the joint motion. P I Mech Eng H. 2007;221(H8):821–832. [DOI] [PubMed] [Google Scholar]
- 29.Raya JG, Arnoldi AP, Weber DL, et al. Ultra-high field diffusion tensor imaging of articular cartilage correlated with histology and scanning electron microscopy. MAGMA. 2011;24(4):247–258. [DOI] [PubMed] [Google Scholar]
- 30.Li X, Yu C, Wu H, et al. Prospective comparison of 3D FIESTA versus fat-suppressed 3D SPGR MRI in evaluating knee cartilage lesions. Clin Radiol. 2009;64(10):1000–1008. [DOI] [PubMed] [Google Scholar]
- 31.Lohmander LS, Hoerrner LA, Dahlberg L, Roos H, Bjornsson S, Lark MW. Stromelysin, tissue inhibitor of metalloproteinases and proteoglycan fragments in human knee joint fluid after injury. J Rheumatol. 1993;20(8):1362–1368. [PubMed] [Google Scholar]
- 32.Raya JG, Melkus G, Adam-Neumair S, et al. Change of diffusion tensor imaging parameters in articular cartilage with progressive proteoglycan extraction. Invest Radiol. 2011;46(6):401–409. [DOI] [PubMed] [Google Scholar]
- 33.Maldonado M, Nam J. The Role of Changes in Extracellular Matrix of Cartilage in the Presence of Inflammation on the Pathology of Osteoarthritis. Biomed Research International. 2013. [DOI] [PMC free article] [PubMed] [Google Scholar]
- 34.Matcher SJ. What can biophotonics tell us about the 3D microstructure of articular cartilage? Quant Imaging Med Surg. 2015;5(1):143–158. [DOI] [PMC free article] [PubMed] [Google Scholar]
- 35.Zibetti MVW, Sharafi A, Otazo R, Regatte RR. Compressed sensing acceleration of biexponential 3D-T1rho relaxation mapping of knee cartilage. Magn Reson Med. 2019;81(2):863–880. [DOI] [PMC free article] [PubMed] [Google Scholar]
- 36.Zibetti MVW, Sharafi A, Otazo R, Regatte RR. Accelerating 3D-T1rho mapping of cartilage using compressed sensing with different sparse and low rank models. Magn Reson Med. 2018;80(4):1475–1491. [DOI] [PMC free article] [PubMed] [Google Scholar]
- 37.Pakin SK, Xu J, Schweitzer ME, Regatte RR. Rapid 3D-T1rho mapping of the knee joint at 3.0T with parallel imaging. Magn Reson Med. 2006;56(3):563–571. [DOI] [PubMed] [Google Scholar]
- 38.Kijowski R, Rosas H, Samsonov A, King K, Peters R, Liu F. Knee imaging: Rapid three-dimensional fast spin-echo using compressed sensing. J Magn Reson Imaging. 2017;45(6):1712–1722. [DOI] [PMC free article] [PubMed] [Google Scholar]
- 39.Madelin G, Chang G, Otazo R, Jerschow A, Regatte RR. Compressed sensing sodium MRI of cartilage at 7T: preliminary study. J Magn Reson. 2012;214(1):360–365. [DOI] [PMC free article] [PubMed] [Google Scholar]
Associated Data
This section collects any data citations, data availability statements, or supplementary materials included in this article.
Supplementary Materials
Supplement Figure 1. The optimized k-space sampling patterns at different AFs.
Supplement Figure 2. The reconstructed T2 weighted images (echo times of 2 ms and 100 ms) are highly dependent on the regularization parameters.
Supplement Figure 3. The μMRI T2 weighted images (echo times of 2ms and 100 ms) at different AFs for both CTRL and OA at the magic angle.


