

Summary
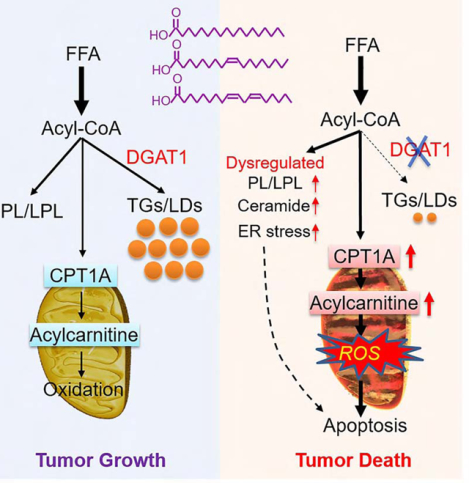
Glioblastoma (GBM), a mostly lethal brain tumor, acquires large amounts of free fatty acids (FAs) to promote cell growth. But how the cancer avoids lipotoxicity is unknown. Here, we identify that GBM upregulates diacylglycerol-acyltransferase 1 (DGAT1) to store excess FAs into triglycerides and lipid droplets. Inhibiting DGAT1 disrupted lipid homeostasis and resulted in excessive FAs moving into mitochondria for oxidation, leading to the generation of high levels of reactive oxygen species (ROS), mitochondrial damage, cytochrome c release and apoptosis. Adding N-acetyl-cysteine or inhibiting FA shuttling into mitochondria decreased ROS and cell death induced by DGAT1 inhibition. We show in xenograft models that targeting DGAT1 blocked lipid droplet formation, induced tumor cell apoptosis and markedly suppressed GBM growth. Together, our study demonstrates that DGAT1 upregulation protects GBM from oxidative damage and maintains lipid homeostasis by facilitating storage of excess FAs. Targeting DGAT1 could be a promising therapeutic approach for GBM.
Keywords: DGAT1, fatty acids, triglycerides, lipid droplets, ROS, mitochondria, oxidative stress, glioblastoma
Graphical Abstract
eTOC
Cheng et al. report that GBM is marked by upregulation of DGAT1, leading to the diversion of fatty acids into lipid droplets and thus preventing lipotoxicity. Inhibition of DGAT1 suppresses GBM growth, suggesting a possible therapeutic strategy to treat this devastating brain cancer.
Introduction
Fatty acids (FAs) are essential lipids in cells as they constitute the major structural components of membrane lipids (i.e., glycerophospholipids and sphingolipids) while also serving as an important energy source through mitochondria-mediated β-oxidation and tricarboxylic acid (TCA) cycle catabolism (Carracedo et al., 2013; Currie et al., 2013b; Qu et al., 2016). However, excess FAs or accumulation of intermediates of FA metabolism can cause cytotoxicity, leading to cell damage (Ertunc and Hotamisligil, 2016; Listenberger et al., 2003). Thus, controlling free FA levels and sustaining their homeostasis by channeling them into mitochondria for oxidation and/or to structural lipids is critical to maintain proper cellular function.
In cancer cells, many studies have demonstrated that lipid metabolism is significantly altered, especially FA synthesis, which is greatly elevated in various types of cancers (Cheng et al., 2018a; Guo et al., 2014; Menendez and Lupu, 2007). However, how tumor cells maintain lipid homeostasis to prevent lipotoxicity is unknown. We recently observed that lipid droplets (LDs), the specific lipid-storage organelles, are prevalent in glioblastoma (GBM) (Geng et al., 2016; Geng and Guo, 2017), the most lethal primary brain tumor (Wen and Reardon, 2016). LDs are also detected in prostate, colon and renal cancers (Accioly et al., 2008; Qiu et al., 2015; Yue et al., 2014). Nevertheless, the role of LDs in cancer cells remains unclear. It is known that LDs are commonly formed in adipose tissues (Walther and Farese, 2012). They are also formed in hepatocytes and macrophages in individuals with fatty liver or atherosclerosis (Krahmer et al., 2013). LDs store large quantities of triglycerides (TGs) and cholesteryl esters, which are surrounded by a phospholipid monolayer that integrates various proteins (Walther and Farese, 2012). The final and committed step for TG synthesis is regulated by two diacylglycerol-acyltransferases, DGAT1 and DGAT2 (Coleman and Lee, 2004; Coleman and Mashek, 2011). These enzymes, which are transmembrane proteins residing in the endoplasmic reticulum (ER), catalyze the esterification of FA-CoA, also called acyl-CoA, with diacylglycerol (DAG) to form TGs, which are then assembled and bud from the ER into the cytosol to form LDs (Yen et al., 2008).
DGAT1 is highly expressed in the intestine to promote FA absorption, and it is also expressed in the testis, adipose tissues and liver (Cases et al., 1998). Expression of DGAT2 is high in the liver and adipose tissues, but low in the intestine (Cases et al., 2001). However, the expression pattern and function of DGAT1 and DGAT2 have rarely been studied in human cancers. Therefore, important questions remain to be answered, including 1) is DGAT1 or DGAT2 upregulated in human cancers to promote TG synthesis and LD formation?; 2) does TG and LD formation play an important role in maintaining lipid homeostasis and tumor growth?; and 3) does inhibition of DGAT1 or DGAT2 disrupt lipid homeostasis and cause lipotoxicity that can kill tumor cells? Addressing these important questions may lead to the identification of unique lipid metabolism pathways operating in malignancies and thus promising new approaches for cancer therapy.
In this study, we demonstrate that DGAT1, but not DGAT2, is highly expressed in GBM and plays a dominant role in promoting excess FA storage into TGs and LDs to protect GBM from oxidative damage. Inhibiting DGAT1 induces striking GBM cell apoptosis and reduction of tumor growth in vitro and in vivo. Thus, our study uncovers the previously unrecognized molecular mechanism regulating lipid homeostasis in GBM and provides a promising new approach for GBM therapy.
Results
GBM tissues contain large amounts of TGs and express high levels of DGAT1 that are associated with poor patient survival
To explore how FA homeostasis is regulated in GBM, we examined whether TGs are formed in patient tumor tissues by using thin layer chromatography (TLC). We found that GBM tumor tissues contain large amounts of TGs compared with normal brain tissues (Figure 1A). Western blot and immunohistochemistry (IHC) analysis showed that DGAT1 is highly expressed in GBM tumor tissues compared with normal brains (Figures 1B, 1C and S1A), which correlated with the prevalence of LDs in tumor tissues, as examined by immunofluorescence (IF) staining of the LD membrane protein, TIP47 (Figure 1C, lower panels) (Geng et al., 2016).
Figure 1. GBM tumors contain large amounts of TGs and express high levels of DGAT1 that are associated with poor patient survival.

(A) TLC analysis of TG levels in human normal brains vs. tumor tissues from individuals with GBM. *P < 0.001.
(B) A representative Western blot (n = 2 blots in total) of DGAT1 from human normal brain vs. GBM tumors. Protein disulfide-isomerase family A, member 1 (PDIA1), an ER-resident protein, was used as a loading control.
(C) Representative IHC staining (n = 3 images in total) of DGAT1 in human normal brain vs. GBM tumor samples (upper panels). IF staining (n = 5 images in total) of LDs via using TIP47 antibody (lower panels). Nucleus was stained with DAPI. Scale bar, 50 μm for IHC, 10 μm for IF images.
(D) RT-qPCR analysis of mRNA expression in human GBM tumor samples (n = 10) and normalized to DGAT1 average expression. *P < 0.001.
(E) Boxplot analysis of gene expression in samples from individuals with GBM (n = 153), ovarian (n = 303), prostate (n = 497), breast (n = 1009) and liver (n = 371) cancer in the TCGA RNA-seq databases. RPKM, reads per kilobase million. *P < 0.001.
(F and G) IHC analysis of DGAT1 expression in glioma tissues in the TMA (n = 62) (F, upper panels). LDs were detected by IF via TIP47 staining (red) (F, lower panels). Scale bar, 20 μm for IHC, 10 μm for IF. DGAT1 levels were quantified by H-score (G). *P < 0.01. PA, pilocytic astrocytoma, grade I; A2, astrocytoma grade II; AA, anaplastic astrocytoma, grade III.
(H and I) Kaplan-Meier plot of survival data from individuals with GBM based on DGAT1 protein levels in TMA analyzed in panels F and G (mean = 180) (H), or based on DGAT1 mRNA levels in GBM TCGA database (RNA-seq) (I). The optimal cut-off 9.503 was applied to stratify the high vs. low groups.
See also Figure S1.
As the current commercial DGAT2 antibodies are not reliable (Ackerman et al., 2018; Herker et al., 2010), we were unable to detect the DGAT2 protein in tissues from individuals with GBM and in cancer cell lines. Thus, we compared the mRNA levels of DGAT1 vs. DGAT2 in specimens from 10 individuals with GBM by real-time PCR (RT-qPCR). The data showed that DGAT1 expression was significantly higher than DGAT2 expression in the same tumor tissues (Figures 1D, S1B and S1C). We further examined mRNA levels in GBM tissues in The Cancer Genome Atlas (TCGA) database (Cerami et al., 2012; Gao et al., 2013). The data showed that DGAT1 mRNA expression was much higher than that of DGAT2 in GBM tumor tissues (Figures 1E and S1D). TCGA pan-cancer data analysis further showed that high levels of DGAT1 mRNA occurred in ovarian, prostate, breast, liver and many other cancer types (Figures 1E, S1D and S1E), while high DGAT2 mRNA was only observed in bladder, breast, liver, head & neck and thyroid cancers (Figures 1E and S1E).
We further examined DGAT1 protein levels in tumor tissues from individuals with grade I-IV astrocytomas using a tissue microarray (TMA) (n = 62). IHC staining showed that grade IV GBM tissues contained the highest levels of DGAT1 in comparison with anaplastic astrocytoma (AA, grade III), astrocytoma II (A2) and pilocytic astrocytoma (PA, grade I) (Figure 1F and 1G), correlating with the LD prevalence in GBM tissues (Figure 1F, lower panels). Furthermore, survival analysis showed that high protein levels of DGAT1 in tumor tissues were associated with poor survival of individuals with GBM (Figure 1H). Accordingly, TCGA gene expression database analysis showed that high levels of DGAT1 mRNA expression were inversely correlated with overall survival in individuals with GBM (Figures 1I and S1F), which was further confirmed by analysis of the Rembrandt gene expression database (Figure S1G). Together, these data strongly suggest that DGAT1 may play a critical role in regulating TG and LD formation and serve as a prognostic marker and molecular target in GBM.
Inhibition of DGAT1, but not DGAT2, significantly suppresses TG and LD formation and induces GBM cell death
We next examined the respective role of DGAT1 and DGAT2 in regulating TG synthesis and LD formation in GBM cells. RT-qPCR showed that DGAT1 expression was significantly higher than DGAT2 expression in multiple GBM cell lines and patient-derived GBM30 cells (Geng et al., 2016; Ru et al., 2016) (Figures 2A and S2A), which is consistent with their expression patterns in tumor tissues from individuals with GBM (Figures 1D, 1E, S1C and S1D). The pattern of DGAT1 compared with DGAT2 expression in ovarian cancer cell line 2008 was similar as the one in GBM cells (Figure S2A). In contrast, the expression of DGAT2 was similar as that of DGAT1 in liver (HepG2), bladder (HTB5), breast (MDA468) and thyroid (8505C) cancer cell lines (Figures 2A and S2A). The expression levels of DGAT1 vs. DGAT2 in different types of cancer cell lines are consistent with their expression pattern in tumor specimens from the TCGA database (Figures 1E, S1D and S1E).
Figure 2. Inhibition of DGAT1, but not DGAT2, significantly suppresses TG and LD formation and induces GBM cell death.
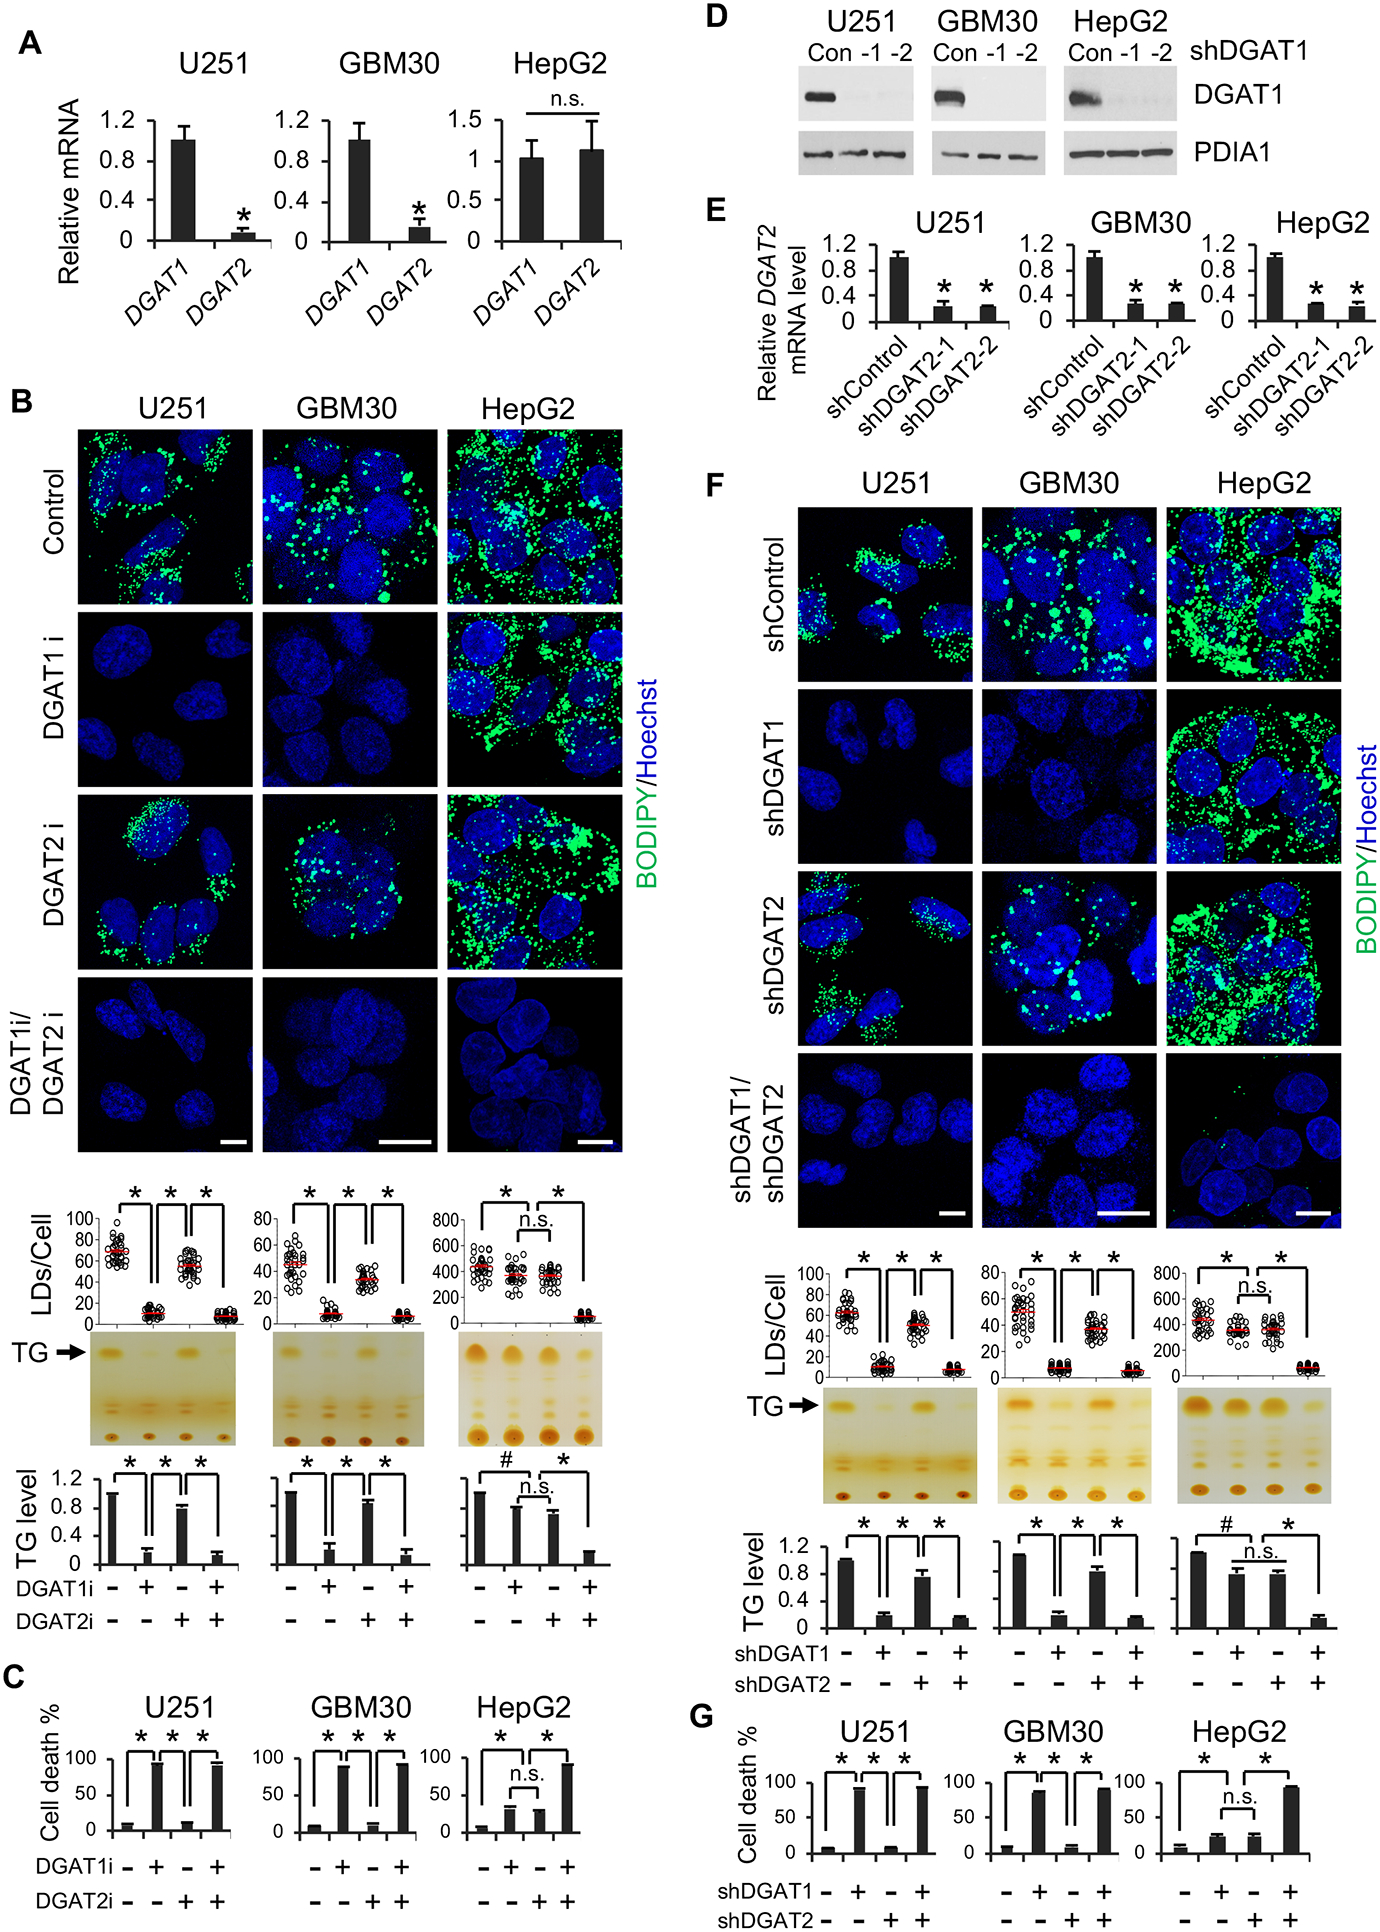
(A) RT-qPCR analysis of mRNA expression (mean ± SD, n = 3) in GBM cells (U251 and GBM30) and in liver cancer cell line (HepG2). *P < 0.01; n.s., not significant.
(B) Representative fluorescence imaging (n = 6 images in total) of LDs stained with BODIPY 493/503 (green) (upper panels) and TLC analysis (n = 3) of TG levels (lower panels) in different cancer cells treated with/without DGAT1 inhibitor A-922500 (20 μg/ml) or DGAT2 inhibitor PF-06424439 (20 μg/ml) for 24 hr. Nuclei were stained with Hoechst 33342 (blue). Scale bar, 10 μm. *P < 0.001; #P < 0.05.
(C) Percentage of dead cells (mean ± SD, n = 3) after treatment with DGAT1 or DGAT2 inhibitor for 3 days as in panel B. *P < 0.0001.
(D) A representative Western blot (n = 3 blots in total) of DGAT1 expression after shRNA knockdown for 48 hr.
(E) RT-qPCR analysis of DGAT2 mRNA expression (mean ± SD, n = 3) in different cancer cells after shRNA knockdown for 48 hr. *P < 0.01.
(F) Representative fluorescence imaging (n = 6 images in total) of LDs stained as panel B (upper panels) and TLC analysis of TG levels (lower panels) in different cancer cells after shRNA knockdown of DGAT1 or DGAT2 for 48 hr. Scale bar, 10 μm. *P < 0.001; #P < 0.05.
(G) Percentage of dead cells (mean ± SD, n = 3) after shRNA knockdown of DGAT1 or DGAT2 for 4 days. *P < 0.0001; #P < 0.001.
See also Figure S2.
We then treated GBM cells for 24 hr with inhibitors for DGAT1 (A-922500, 20 μg/ml) (King et al., 2010; Zhao et al., 2008) or DGAT2 (PF-06424439, 20 μg/ml) (Futatsugi et al., 2015). We found that inhibition of DGAT1 dramatically reduced the number of LDs (stained by BODIPY 493/503, upper panels) and levels of TGs (analyzed by TLC, lower panels) in all examined GBM cells (Figures 2B and S2B). In contrast, pharmacological inhibition of DGAT2 only resulted in a minor reduction of the LDs/TG levels (Figures 2B and S2B). Moreover, concurrently inhibiting DGAT1 and DGAT2 did not further reduce the levels of LDs and TGs compared to DGAT1 inhibition alone (Figures 2B and S2B). However, in HepG2 cells, inhibition of DGAT1 or DGAT2 only slightly decreased the levels of LDs and TGs, and inhibition of both enzymes was required to strongly reduce their levels (Figure 2B). These data suggest that DGAT1 plays a key role in TG and LD formation in GBM cells, while TG and LD formation are controlled by both enzymes in liver cancers. Interestingly, inversely correlated to TG and LD reduction, pharmacological inhibition of DGAT1 for 3 days greatly induced GBM cell death (Figures 2C and S2C), while inhibition of both enzymes was required for cell death of HepG2 cells (Figure 2C).
We further used a genetic inhibition approach to confirm the role of DGAT1 vs. DGAT2 in regulating TG and LD formation in GBM cells. Consistent with the effects of pharmacological inhibition (Figures 2B and S2B), downregulation of DGAT1 for 48 hr via lentivirus-mediated shRNA markedly reduced TG and LD levels in all examined GBM cells, while DGAT2 knockdown only caused a minor reduction (Figures 2D–2F and S2D–S2F), and no further significant decrease of TG and LD levels was observed upon combined knockdown of both enzymes (Figure 2F). In contrast, in HepG2 cells, only the knockdown of both enzymes resulted in dramatic TG and LD reduction (Figure 2D and 2F). Moreover, DGAT1 knockdown led to time-dependent GBM cell death (Figures 2G, S2G and S2H). In contrast, this effect required knockdown of both enzymes in HepG2 cells (Figure 2G). We further examined two additional GBM patient-derived cells lines, GBM83 and GBM169. Both pharmacological and shRNA inhibition of DGAT1 caused similarly dramatic reduction of LDs and marked cell death in these primary cells (Figure S2I and S2L). We then used the CRISPR-Cas9 system to knock out DGAT1 to confirm its role on LD formation in GBM U251 cells. Consistent with shRNA knockdown data, sgRNA-mediated knockout dramatically reduced DGAT1 protein levels and LD amounts in U251 cells (Figure S2M and S2N).
Together, these data strongly demonstrate that DGAT1 plays a dominant role in regulating TG synthesis and LD formation in GBM cells, while DGAT2 expressed at low levels in GBM plays a minor role in TG synthesis and LD formation. Moreover, our data show that targeting DGAT1 induces marked GBM cell death.
DGAT1 inhibition results in mitochondrial damage, ROS elevation and GBM cell apoptosis
To identify the leading cause of GBM cell death upon DGAT1 inhibition, we examined GBM cellular morphology by transmission electron microscopy (TEM). Micrographs showed that the structure of mitochondria was severely disrupted upon pharmacological (A-922500, 24 hr) or genetic (shRNA, 48 hr) inhibition of DGAT1. Mitochondria became fragmented and round and lost cristae in comparison with the lengthy tubular shape of mitochondria in control cells (Figures 3A, 3B, S3A and S3B). We further used confocal microscopy to examine mitochondrial morphology after MitoTracker Red staining. Consistent with the TEM observation, fluorescence imaging showed that the tubular mitochondria (red) observed in control cells became fragmented and round after pharmacological or genetic inhibition of DGAT1, accompanied by the disappearance of LDs (green) (Figures 3C, 3D, S3C and S3D). In addition, inhibiting DGAT1 significantly reduced mitochondrial membrane potential (Figure S3E and S3F). In contrast, there was no obvious damage to mitochondria upon pharmacological or genetic inhibition of DGAT2 (Figures 3A, 3C, S3C and S3D).
Figure 3. Inhibition of DGAT1 causes mitochondrial damage, ROS production and GBM cell apoptosis.
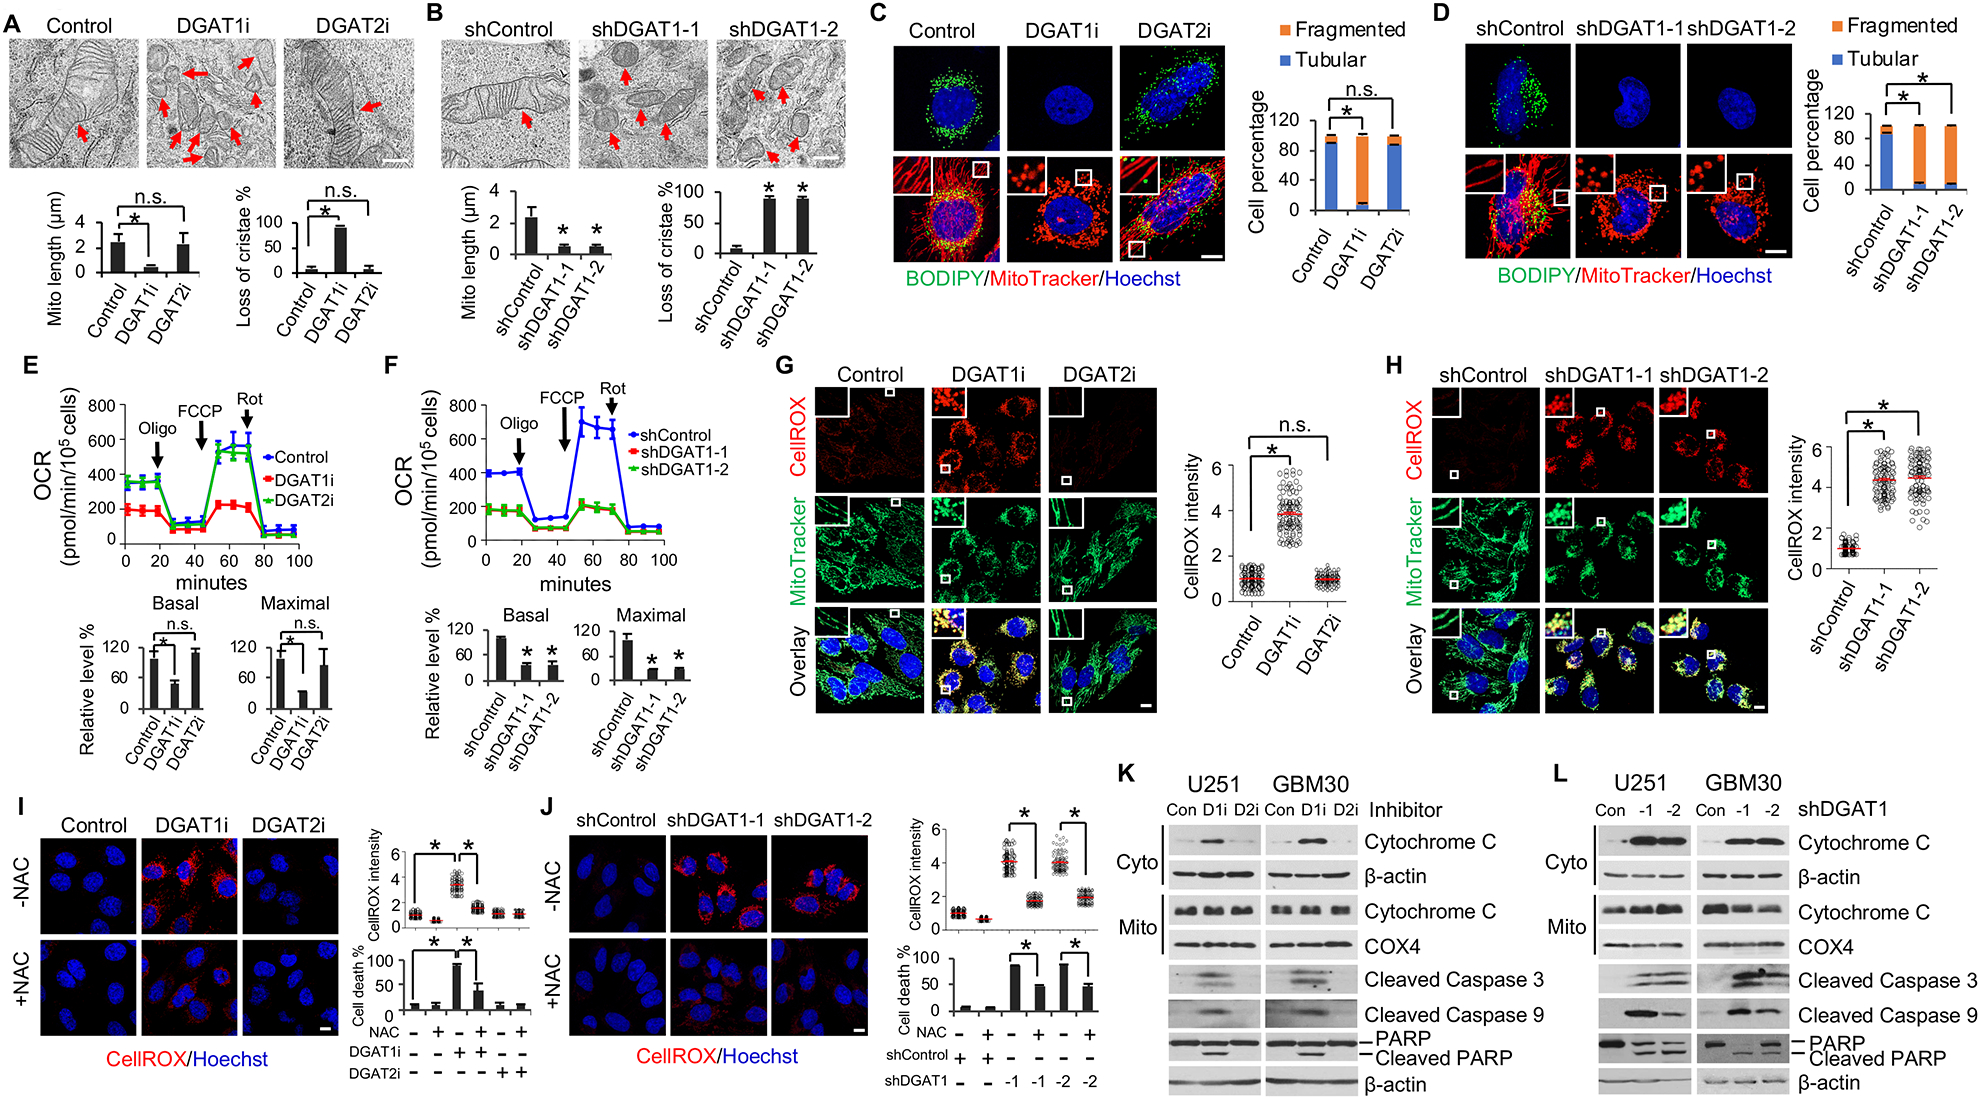
(A and B) Representative TEM imaging (n = 20 images in total) of the mitochondria in U251 cells treated with/without DGAT1 inhibitor A-922500 (20 μg/ml) or DGAT2 inhibitor PF-06424439 (20 μg/ml) for 24 hr (A) or shDGAT1 knockdown for 48 hr (B). Scale bar, 500 nm. Red arrows indicate mitochondria. Over 100 mitochondria in each group were quantified (mean ± SEM). *P < 0.0001.
(C and D) Representative fluorescence imaging (n = 12 images in total) of LDs (green) and mitochondria (red) in U251 cells treated with/without DGAT1 or DGAT2 inhibitor (C) or shDGAT1 (D) as in panels A and B. Scale bar, 10 μm. More than 100 cells were quantified for tubular or fragmented mitochondria (mean ± SEM). *P < 0.001.
(E and F) Oxygen consumption rate (OCR) (mean ± SD, n = 3) in U251 cells treated with/without DGAT1 or DGAT2 inhibitor (E) or shRNA (F) as in panels A and B. Oligo, oligomycin; FCCP, carbonyl cyanide 4-trifluoromethoxy-phenylhydrazone; Rot, rotenone. *P < 0.0001.
(G and H) Representative fluorescence imaging (n = 12 images in total) of ROS (red) detected with CellROX Deep Red and mitochondria (green) in U251 cells treated with/without DGAT1 or DGAT2 inhibitor (G) or shRNA (H) as in panels A and B. ROS levels were quantified in more than 100 cells (mean ± SD). *P < 0.0001. Scale bar, 10 μm.
(I and J) Representative fluorescence images (n = 12 images in total) of ROS in U251 cells treated with/without DGAT1 inhibitor (I) or shRNA (J) as in panels A and B in the presence or absence of NAC (1 mM). Scale bar, 10 μm. Dead cell percentage were counted after treatment for 3 days (mean ± SD, n = 3) (right bottom panels). *P < 0.0001.
(K and L) A representative Western blot (n = 3 blots in total) of GBM cells treated with/without DGAT1 (D1i) inhibitor A-922500 (20 μg/ml) or DGAT2 (D2i) inhibitor PF-06424439 (20 μg/ml) for 24 hr (K) or shRNA against DGAT1 for 72 hr (L). Cyto, cytosol. Mito, mitochondria.
See also Figures S3, S4 and S5.
Next, we examined whether mitochondrial activity was impaired upon DGAT1 inhibition by measuring oxygen consumption rate (OCR) using a Seahorse instrument (Cvrljevic et al., 2011; Londhe et al., 2018). The data showed that both pharmacological (A-922500, 20 μg/ml for 24 hr) and genetic inhibition of DGAT1 (48 hr) markedly reduced the OCR compared with control cells, while no effect was observed upon DGAT2 inhibitor (PF-06424439, 20 μg/ml for 24 hr) (Figures 3E, 3F, S3G and S3H). Moreover, none of treatments affected extracellular acidification rate (ECAR) (Figure S3G–S3I). These data demonstrate that inhibition of DGAT1 to block TG and LD formation severely impaired mitochondrial structure and function.
We then examined whether DGAT1 inhibition led to the production of reactive oxygen species (ROS) in GBM cells. Using CellROX Deep Red staining (Liu et al., 2012), fluorescence imaging showed that ROS (red) were markedly elevated upon pharmacological or genetic inhibition of DGAT1 (Figures 3G, 3H and S3J–S3L). In contrast, inhibition of DGAT2 did not increase ROS production in GBM cells (Figures 3G, S3J and S3K). Moreover, the ROS production (red) was localized to the mitochondria (green), as shown by yellow fluorescence in the overlay imaging (Figures 3G, 3H and S3J–S3L), demonstrating that the greater ROS upon DGAT1 inhibition was generated in the mitochondria than vehicle (control) treated cells.
We then examined whether treating cells with the ROS scavenger N-acetyl-cysteine (NAC) (Aruoma et al., 1989) could reduce cell death induced by DGAT1 inhibition. The data showed that NAC significantly decreased both ROS production and cell death caused by DGAT1 inhibition (Figure 3I and 3J). Furthermore, western blot showed that DGAT1 inhibition resulted in high levels of cytochrome c release from the mitochondria to the cytosol (Figure 3K and 3L) and strongly induced apoptosis in GBM cells, as demonstrated by the dramatic upregulation in the cleaved caspase 3, cleaved caspase 9 and PARP proteins as compared with control (Figures 3K, 3L, S3M and S3N).
We then examined the effects of DGAT1 inhibition under low glucose conditions in GBM cells. Similar with culturing cells in 25 mM glucose (Figures 2B, 2C, 3G and S3J), pharmacological inhibition of DGAT1 with A-922500 (20 μg/ml, 24 hr) also blocked LD formation, triggered high level of ROS and mitochondrial damage, and induced marked cell death in GBM cells cultured in 1 mM and 5 mM glucose (Figure S4A–S4C).
We further examined the effects of DGAT1 inhibition on ER stress and found that acute pharmacological inhibition of DGAT1 by its inhibitor A-922500 (20 μg/ml, 24 hr) upregulated the protein levels of BIP and CHOP (Figure S5A), two key players and biomarkers of ER stress (Lee, 2005; Nishitoh, 2012). To examine whether elevated ER stress contributes to DGAT1 inhibition-induced GBM cell death, we inhibited ER stress by suppressing the activity of PRKR-like endoplasmic reticulum kinase (PERK) or inositol-requiring enzyme 1 alpha (IRE1a), two major upstream players in ER stress cascades, with their inhibitors GSK2656157 and 4μ8C, respectively (Atkins et al., 2013; Cross et al., 2012). These inhibitions, alone or in combination, did not exert rescue effects on cell death promoted by DGAT1 inhibition (Figure S5B). Moreover, chronic inhibition of DGAT1 by shRNA knockdown did not induce ER stress, as evident by the unchanged expression of BIP and CHOP (Figure S5C). In contrast, both pharmacological and genetic inhibition of DGAT1 severely damaged mitochondria (Figures 3A–3F and S3), elevated ROS (Figure 3G–3J), and promoted cytochrome c release and apoptosis (Figures 3K, 3J, S3M and S3N). Together, these data strongly demonstrate that ROS and mitochondrial damage induced by DGAT1 inhibition are sufficient to trigger GBM cell death.
Inhibiting DGAT1 disrupts lipid homeostasis and increases acylcarnitine levels, leading to severe oxidative stress that kills GBM cells
To uncover the underlying mechanism leading to mitochondrial damage and apoptosis upon DGAT1 inhibition, we first checked whether supplementing GBM cells with excess FAs could induce severe cytotoxicity when FA storage was blocked. We knocked down DGAT1 using shRNA and then cultured cells in charcoal-stripped FBS media supplemented with individual C16:0, C18:0, C18:1 FAs or their mixture at different concentrations (0, 10, 20 and 30 μM). The data showed that these FAs, even at 30 μM, did not induce toxicity in control GBM cells infected with scramble shRNA after 16 hr supplementation (Figure S6A and S6B). In contrast, when their storage was blocked in shDGAT1 knockdown cells (Figure S6A), all FAs, either alone or in mixture, induced marked cell death in a dose- and time-dependent manner (Figure S6A and S6B), and resulted in a greater ROS production than either DGAT1 inhibition or FA supplement alone (Figure S6C). These data demonstrate that un-stored excess FAs trigger severe oxidative stress and cell death in GBM.
We then performed lipidomics to examine whether DGAT1 knockdown resulted in the significant accumulation of free FAs that induced toxicity to kill GBM cells. The data showed that control cells contained a pool of free FAs with different lengths and saturation (Figure S6D). Unexpectedly, we did not observe any significant accumulation in free FAs in DGAT1-knockdown cells, as compared with control cells (Figures 4A and S6D), contrary to our original thought that DGAT1 inhibition would cause the accumulation of free FAs. We then extensively analyzed and compared lipid profiles in GBM cells between DGAT1 knockdown and control groups. We found that acylcarnitines (AC), which are converted from FAs by carnitine palmitoyltransferase 1 (CPT1) and shuttled into mitochondria for oxidation and energy production (Qu et al., 2016; Schreurs et al., 2010), were remarkably elevated, along with TG reduction (Figure 4A–4C). Accordingly, the levels of acetyl-CoA (C2:0), the major product of FA breakdown by β-oxidation in mitochondria, were dramatically increased (Figure 4A and 4D). Moreover, the major structural lipids, i.e., phosphatidylcholine (PC), phosphatidylethanolamine (PE), lysophosphatidylcholine (LPC), and lysophosphatidylethanolamine (LPE), were significantly increased upon DGAT1 inhibition (Figures 4A, 4E, 4F and S5E–S5H). In contrast, many lipid species in phosphatidylserine (PS), phosphatidylinositol (PI), phosphatidylglycerol (PG), lysophosphatidylserine (LPS), lysophosphatidylinositol (LPI) and lysophosphatidylglycerol (LPG), which are found in low amounts in structural lipids, were downregulated (Figures 4A, 4E, 4F, S6E and S6H). In addition, we found that ceramides were modestly increased upon DGAT1 inhibition (Figure 4G). Altogether, the lipidomics analysis show that blocking TG and LD formation does not induce free FA accumulation, but shifts them to the major structural lipids PC/PE and mitochondria, leading to the disruption of lipid homeostasis and oxidative stress (Figure 4H).
Figure 4. Genetic inhibition of DGAT1 significantly alters lipid homeostasis and dramatically elevates acylcarnitine and acetyl-CoA levels in GBM cells.
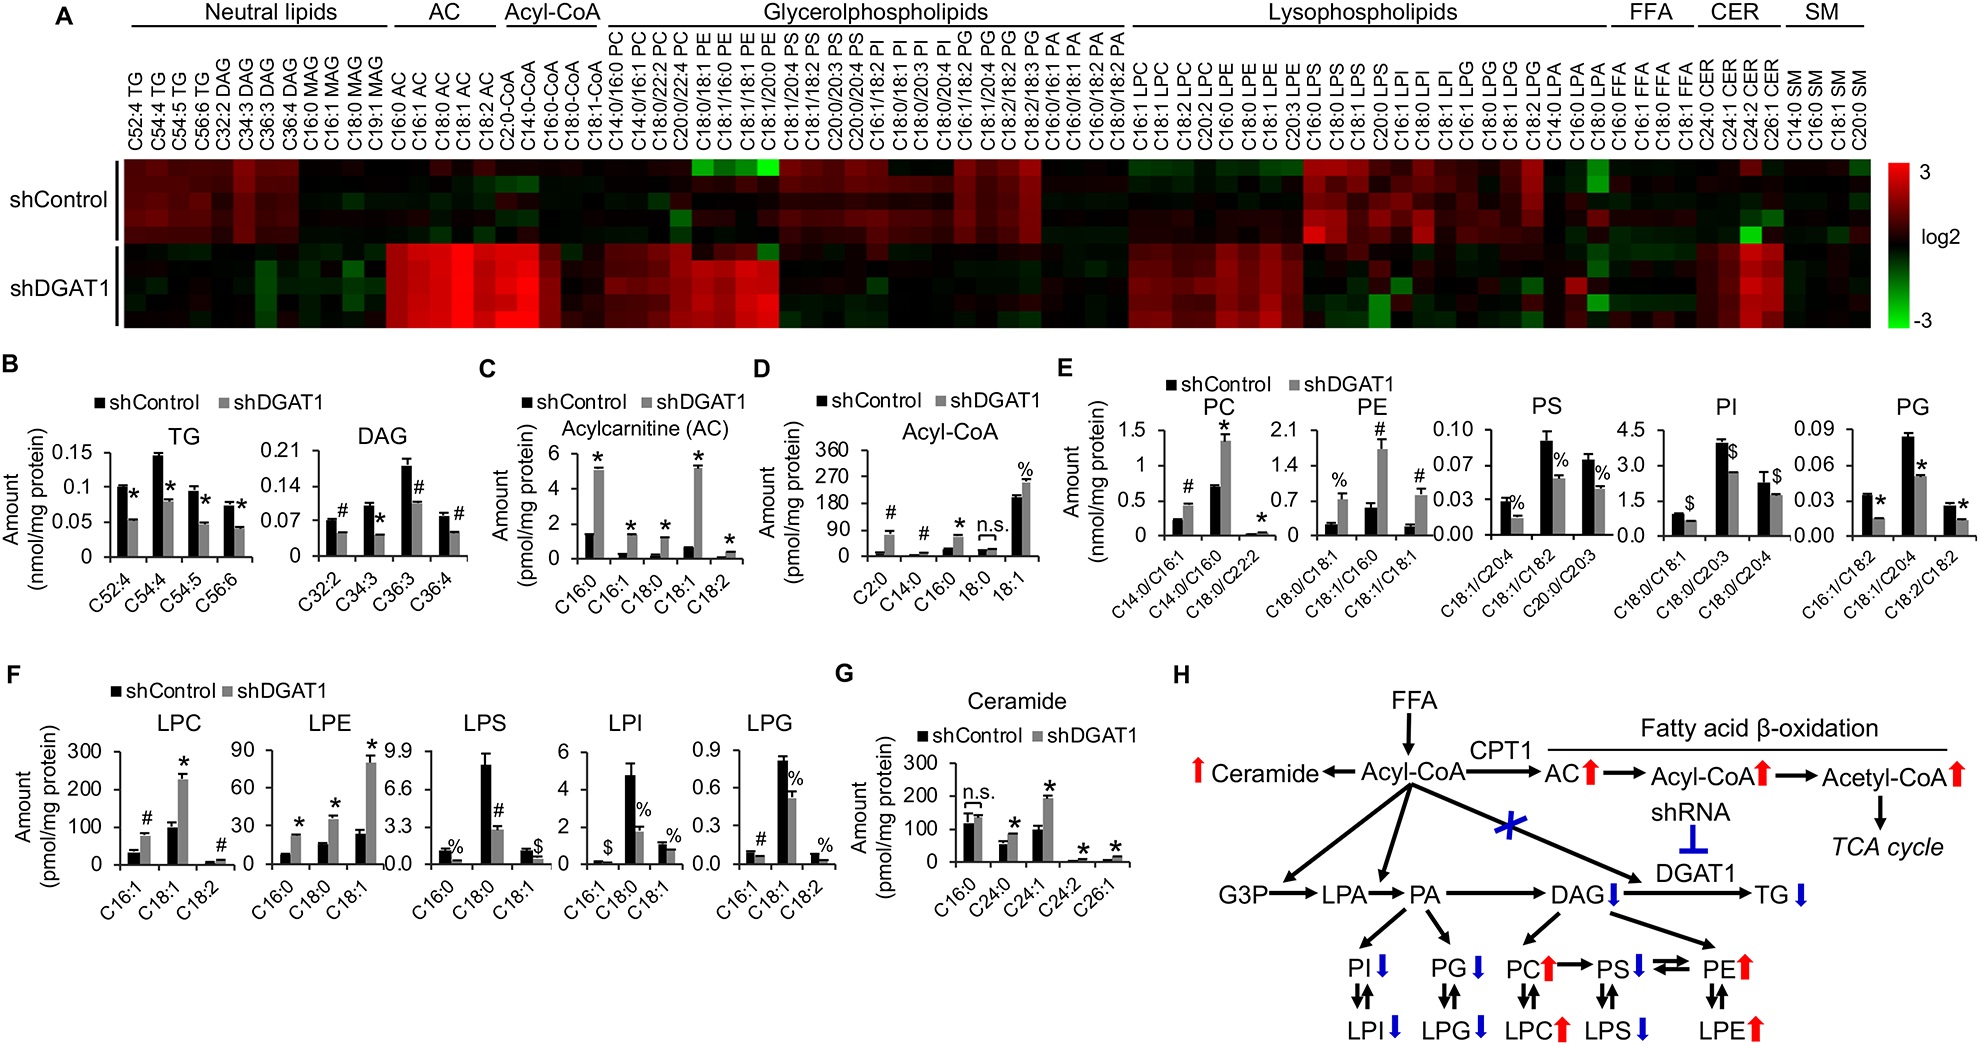
(A) Heatmap of representative lipids in U251 cells with/without shRNA knockdown of DGAT1 (60 hr) analyzed by lipidomics. AC, acylcarnitine; FFA, free fatty acid; CER, ceramide; SM, sphingomyelin.
(B-G) Levels of representative individual lipid species in U251 cells with/without shDGAT1 knockdown (mean ± SEM, n = 5). *P < 0.0001; #P < 0.001; %P < 0.01; $P < 0.05 in comparison to shControl cells. PC, phosphatidylcholine; PE, phosphatidylethanolamine; PS, phosphatidylserine; PI, phosphatidylinositol; PG phosphatidylglycerol; PA, phosphatidic acid; LPC, lysophosphatidylcholine; LPE, lysophosphatidylethanolamine; LPS, lysophosphatidylserine; LPI, lysophosphatidylinositol; LPG, lysophosphatidylglycerol; LPA, lysophosphatidic acid.
(H) Summary of the lipid profiling changes in U251 cells after knockdown of DGAT1. G3P, glycerol-3-phosphate.
See also Figure S6.
We found that DGAT1 knockdown resulted in a greater level of acylcarnitines compared to the control group (Figure 5A). We then tested whether the increased acylcarnitines cause mitochondrial toxicity and induction of GBM cell death. We, thus, supplemented GBM cells with C16:0-, C18:0- or C18:1-carnitines for 24 hr. As with DGAT1 inhibition (Figure 3), fluorescence imaging showed that all supplemented acylcarnitines strongly induced mitochondrial fragmentation and swelling (Figures 5B and S7A) and reduced oxygen consumption (Figure 5C), while extracellular acidification rate (ECAR) was not affected (Figure S7B). Treatment with these species of acylcarnitines also dramatically increased cytochrome c release (Figure S7C), cleavage of caspase 3, cleaved caspase 9 and PARP proteins (Figure 5D), and GBM cell death (Figure S7D). Moreover, ROS levels (red) were remarkably elevated by addition of any acylcarnitine (Figure 5E, upper panels), while they did not induce significant ER stress in GBM cells, as shown by the stable levels of BIP and CHOP proteins (Figure S7E). Moreover, neutralizing ROS with NAC significantly reduced acylcarnitine-induced GBM cell death (Figure 5E). These data demonstrate that DGAT1 inhibition increases acylcarnitine levels and FA oxidation, which cause severe oxidative stress and GBM cell killing.
Figure 5. Elevated acylcarnitine induced by DGAT1 inhibition damages the mitochondria and are associated with CPT1A upregulation.
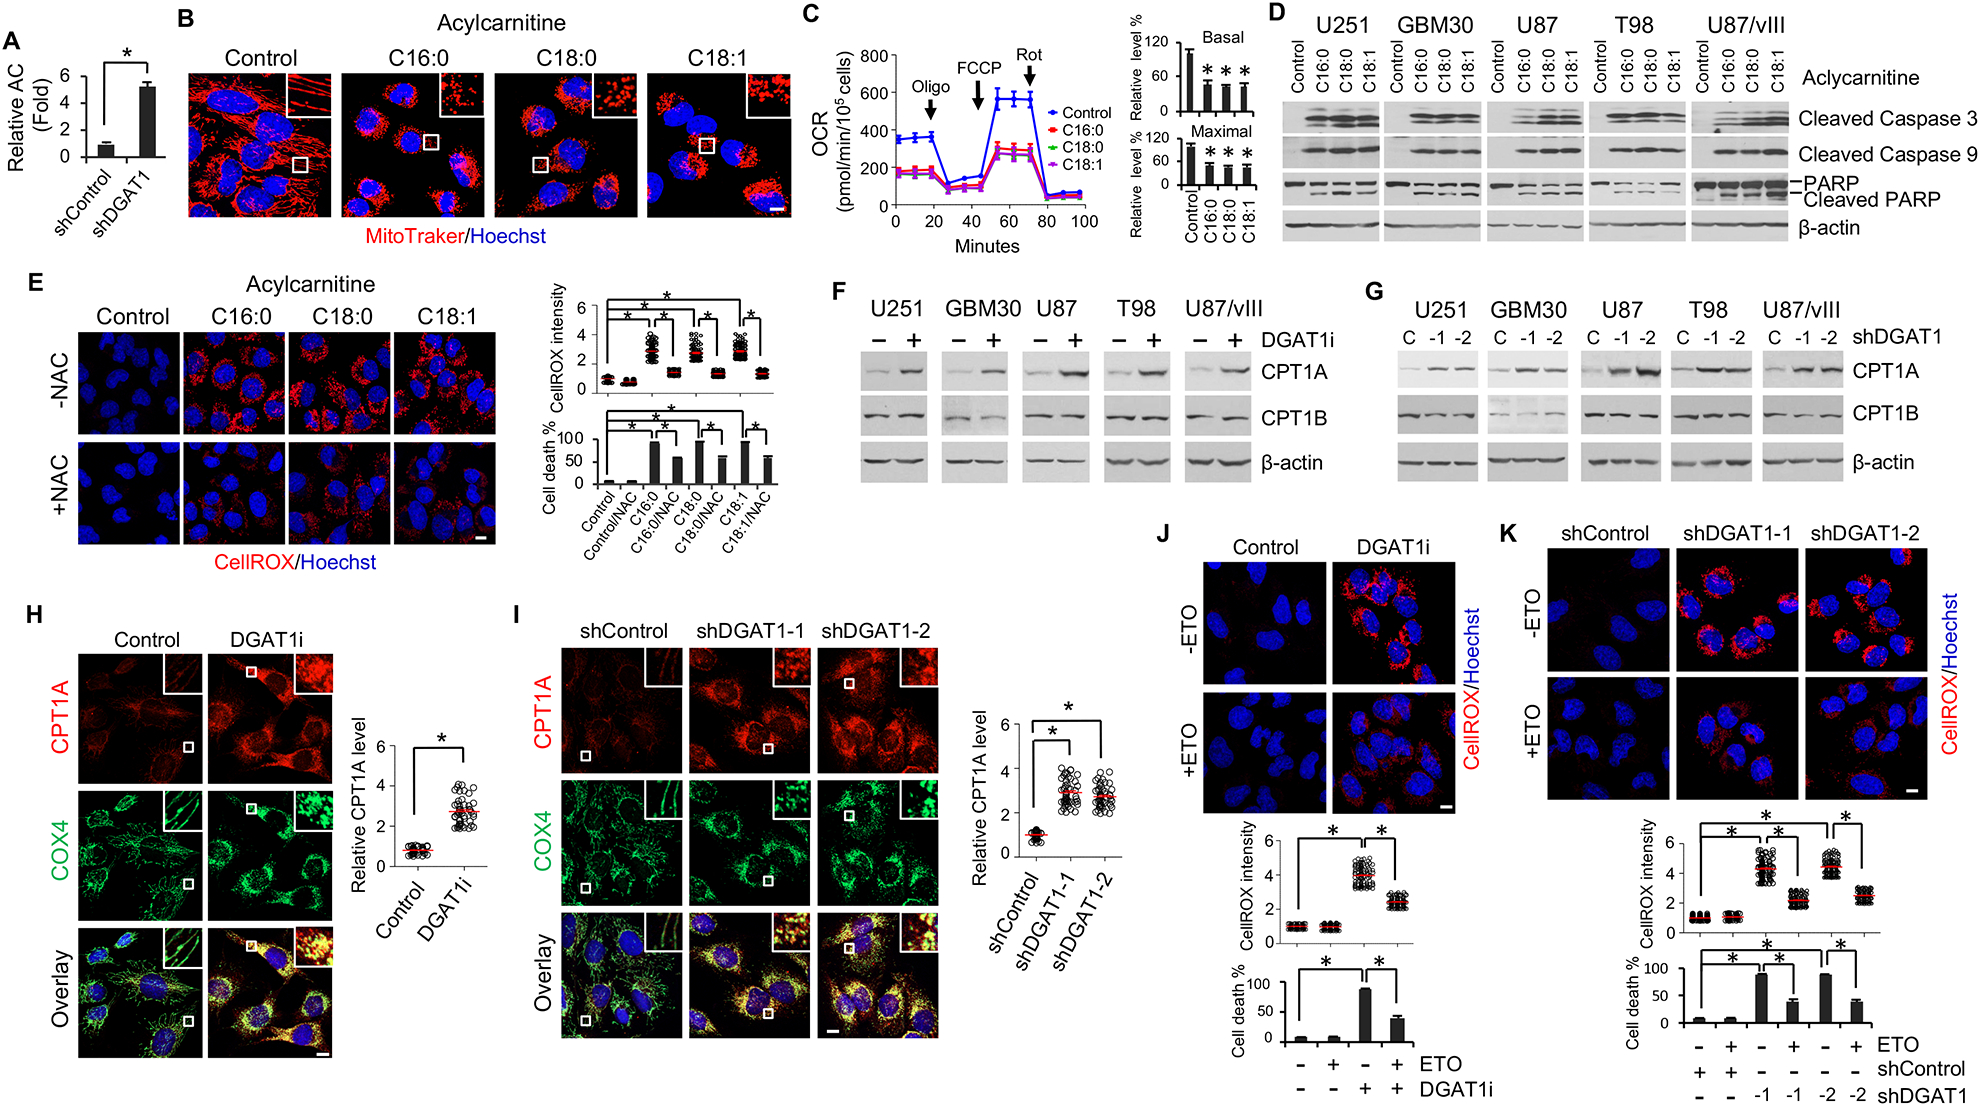
(A) Relative total acylcarnitine (AC) level in U251 cells with/without DGAT1 knockdown (mean ± SEM, n = 5). *P < 0.0001.
(B-D) Representative fluorescence imaging (n = 6 images in total) of mitochondria stained with MitoTracker Red (red) (B), OCR measurement (mean ± SD, n = 3) (C) or Western blot analysis (n = 3 blots in total) of apoptosis markers (D) in U251 cells treated with different acylcarnitines (20 μM) or vehicle (ethanol) as control for 24 hr. Nuclei were stained with Hoechst 33342 (blue). Scale bar, 10 μm. *P < 0.0001 as compared with control.
(E) Representative fluorescence imaging (n = 12 images in total) of ROS (left) by CellROX staining (red) and its quantification (right) (mean ± SEM, n = 100 cells) in U251 cells treated with acylcarnitines (20 μM) for 24 hr in the presence or absence of NAC (1 mM). Scale bar, 10 μm. Cell death was determined after 2 days of treatment (mean ± SD, n = 3). *P < 0.001.
(F-I) A representative Western blot (n = 3 blots in total) (F and G) or IF (n = 12 images in total)
(H and I) analysis of CPT1A expression levels in U251 cells upon pharmacological inhibition (A-922500, 20 μg/ml for 24 hr) or shRNA knockdown (48 hr) of DGAT1. Cytochrome c oxidase subunit 4 (COX4) was stained by IF (green) to show mitochondria (H and I). CPT1A level was quantified in more than 50 cells (mean ± SEM) (H and I). *P < 0.0001.
(J and K) Representative fluorescence imaging (n = 12 images in total) and quantification of ROS (mean ± SEM, n = 100 cells) in U251 cells treated with DGAT1 inhibitor A-922500 (20 μg/ml) for 24 hr (J) or shRNA for 48 hr (K) in the presence or absence of the CPT1 inhibitor etomoxir (ETO, 6 μM). Scale bar, 10 μm. *P < 0.0001. Cell death was quantified after 72 hr of inhibitor treatment (J) or 96 hr of shRNA knockdown (K) (mean ± SD, n = 3).
See also Figure S7.
We next examined whether inhibiting DGAT1 could affect CPT1 protein levels to facilitate the entry of excess FAs into mitochondria for their oxidation. By western blot analysis we found that genetic or pharmacological inhibition of DGAT1 strongly increased CPT1A protein levels, while the levels of its isoform, CPT1B, were unchanged (Figure 5F and 5G). Immunofluorescence imaging confirmed CPT1A elevation (red) upon DGAT1 inhibition (Figure 5H and 5I, upper panels) and its localization in the mitochondria, as determined by overlapping yellow fluorescence with the marker cytochrome c oxidase subunit 4 (COX4) (green) (Zeviani et al., 1987) (Figure 5H and 5I, lower panels). Consequently, the rate of FA β-oxidation was significantly increased in GBM cells upon DGAT1 inhibition with A-922500 (20 μg/ml, 24 hr) (Figure S7F). We then suppressed FA oxidation by inhibiting CPT1 activity with Etomoxir (Weis et al., 1994) and found that it reduced ROS and GBM cell death (Figure 5J and 5K), demonstrating that overactivation of FA oxidation could cause severe oxidative stress and cell damage.
Genetic inhibition of DGAT1 significantly suppresses tumor growth and prolongs the survival of GBM-bearing mice
Next, we examined the effects of genetic inhibition of DGAT1 and DGAT2 on tumor growth in GBM xenografts. We first used U87 cells that stably express luciferase (luc) and EGFRvIII, a constitutively active EGFR mutant, to generate a xenograft model (Cheng et al., 2015; Geng et al., 2016; Ru et al., 2016). After shRNA knockdown of DGAT1 or DGAT2 for 48 hr (Figure S2D), U87/EGFRvIII-luc cells (Figure S2G and S2H) were first implanted into mouse flanks. Genetic inhibition of DGAT1 resulted in dramatic suppression of tumor growth, while only very minor inhibitory effects were observed with DGAT2 knockdown as compared to the control group (Figure 6A and 6B). Moreover, no additional inhibitory effects on tumor growth were observed when both DGAT1 and DGAT2 were knocked down in comparison with DGAT1 inhibition alone (Figure 6A and 6B).
Figure 6. Genetic inhibition of DGAT1 significantly suppresses tumor growth and prolongs overall survival in GBM-bearing mice.
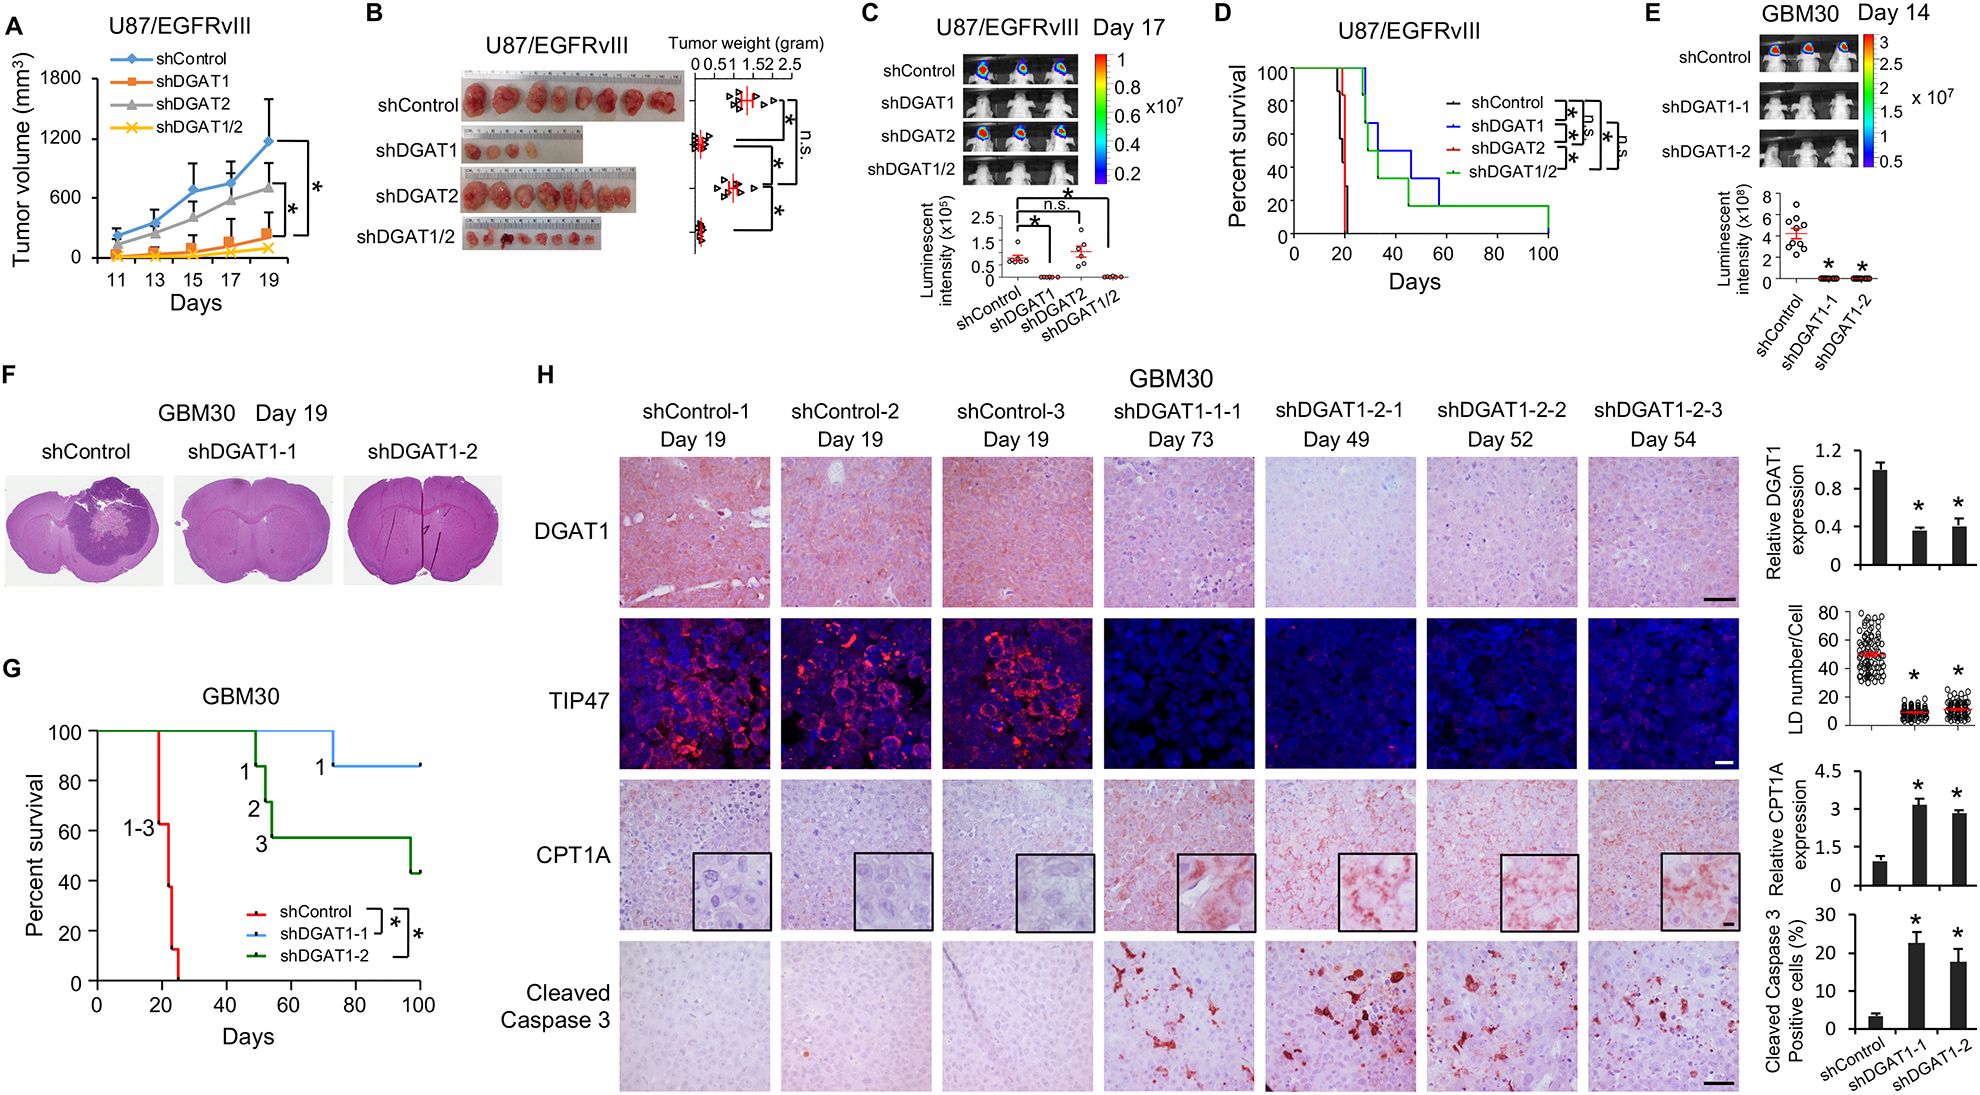
(A-D) The effects of knockdown of DGAT1 or DGAT2 in U87/EGFRvIII cells-derived subcutaneous (A and B) or intracranial (C and D) tumor models. Tumor growth in mouse brain was analyzed by bioluminescence imaging at day 17 post implantation (mean ± SEM, n = 7) (C). Mouse survival was assessed by Kaplan–Meier curves (D). *P < 0.0001.
(E-G) The effects of DGAT1 knockdown in primary GBM30-luciferase cells-derived intracranial mouse model. Tumor growth was analyzed by bioluminescence imaging at day 14 post implantation (mean ± SEM, n = 10) (E). Sections of mouse brain (n = 3) from day 19 post implantation were stained with H&E (F). Kaplan-Meier plot for analysis of mouse survival (n = 7)(G). The ‘1’, ‘2’ and ‘3’ in the panel G means the number of mice that reached to mortality stage and sacrificed for analysis in panel H. *P < 0.001.
(H) Representative imaging (n = 5 in total images) of IHC of DGAT1, CPT1A and cleaved Caspase 3 or IF of LDs via staining TIP47 in tumor tissues from the mice indicated in panel G and sacrificed at indicated days. Five separate areas from each tumor were quantified (mean ± SEM). Scale bars, 40 μm for IHC, 10 μm for IF. *P < 0.01
See also Figure S8.
We next implanted these knockdown cells (48 hr shRNA infection) in mouse brains and monitored tumor growth by bioluminescence imaging. The data showed that the control group developed large brain tumors at day 17 after implantation, while no tumor growth was detected by bioluminescence imaging in the DGAT1 knockdown group (Figure 6C). In contrast, knockdown of DGAT2 failed to inhibit tumor growth in mouse brains (Figure 6C). Consequently, inhibition of DGAT1, but not DGAT2, significantly improved GBM-bearing mouse overall survival, and no additive effects were observed by knocking down both genes (Figure 6D).
We then used a doxycycline (Dox)-inducible shRNA system to confirm the effects of genetic inhibition of DGAT1 on tumor growth. We first established stable doxycycline-inducible shDGAT1 cell line in U87/EGFRvIII cells (U87/EGFRvIII Dox-shDGAT1). In vitro analysis showed that addition of Dox dramatically reduced DGAT1 protein expression and LD formation and markedly inhibited cell proliferation after 4–7 days treatment in U87/EGFRvIII Dox-shDGAT1 cells as compared with Dox-shControl cells (Figure S8A–S8C). We then implanted these Dox-shRNA inducible cells into mouse flanks. The data showed that feeding mice with Dox-containing diet dramatically inhibited tumor growth in inducible shDGAT1 group compared with regular diet without Dox (Figure S8D and S8E). In contrast, there was no difference in shControl group between Dox and regular diet (Figure S8D and S8E).
We also examined the effects of inhibition of DGAT1 in a primary GBM30-derived orthotopic xenograft model (Geng et al., 2016; Ru et al., 2016). After shRNA knockdown of DGAT1 for 48 hr, GBM30-luc cells (Figure S2G and S2H) were implanted into mice brains. Bioluminescence imaging taken at day 14 showed that DGAT1 inhibition markedly suppressed tumor growth compared with the control group (Figure 6E). The mice were sacrificed on day 19 after implantation and the brains were sectioned to examine tumor size by H&E staining. Gross imaging showed that the tumor occupied almost half of the brain in the control group, while no tumor lesion was observed in the DGAT1 knockdown group at day 19 (Figure 6F). As a result, knockdown of DGAT1 greatly prolonged the survival of GBM30-bearing mice (Figure 6G).
We further analyzed DGAT1 expression, LD formation, CPT1A protein level and apoptosis markers in the tumor tissues from the brains of GBM30-luc xenografts, which were isolated from mice when they reached the mortality stage (Figures 6G and S8F). IHC staining showed that DGAT1 was significantly downregulated in the shRNA knockdown groups compared with control tumor (Figure 6H, top panels), and LDs were markedly reduced, as assessed by IF staining of TIP47 (Figure 6H). Moreover, similar with the in vitro assay (Figures 3L, 5G and 5I), CPT1A protein and cleaved caspase 3 were markedly elevated in tumor tissues from the DGAT1 knockdown groups (Figure 6H). Together, these data demonstrate that genetic inhibition of DGAT1 to block FA storage effectively suppresses tumor growth and induces apoptosis in GBM xenograft models.
Pharmacological inhibition of DGAT1 dramatically suppresses GBM tumor growth and induces tumor cell apoptosis
We next examined whether pharmacological inhibition of DGAT1 is effective in inhibiting GBM growth using U87/EGFRvIII and GBM30 xenograft models. We implanted tumor cells in mice flanks and started treatment with the DGAT1 inhibitor A-922500 (120 mg/kg/day) when tumor reached approximate 80 mm3. The data showed that the DGAT1 inhibitor significantly suppressed tumor growth in both xenograft models (Figure 7A), as further evidenced by the dramatic reduction in tumor weight (Figure 7B). Moreover, pharmacological inhibition of DGAT1 dramatically suppressed LD formation, as shown by TIP47 staining (Figure 7C), significantly increased CPT1A expression, and markedly elevated cleaved caspase 3 levels in tumor tissues (Figure 7C). Consistent with the in vitro analysis (Figures 4D and 5A), inhibition of DGAT1 significantly increased acylcarnitine levels in tumor tissues treated with A-922500 as compared with the vehicle treatment group (Figure S9A and S9B). Importantly, via H&E staining we did not observe any toxic effects in mouse liver, kidney and spleen upon DGAT1 inhibitor treatment (Figure S9C). The mice weight slightly decreased by about 8% after 13 days of treatment in comparison with the control group treated with vehicle (Figure S9D), which might be caused by inhibition of TG formation in fat tissues. Together, these data demonstrate that pharmacological inhibition of DGAT1 effectively suppresses GBM tumor growth, while it does not induce noticeable toxic effects in mice.
Figure 7. Pharmacological inhibition of DGAT1 dramatically suppresses GBM tumor growth and induces tumor cell apoptosis.

(A-C) The effects of DGAT1 inhibitor A-900225 (120 mg/kg/day, oral gavage) in U87/EGFRvIII- or GBM30-derived subcutaneous models (n = 6) (A and B). Tumor tissues were analyzed for LDs by IF (TIP47 staining), CPT1A, and cleaved Caspase 3 levels by IHC (representative imaging from 5 images in each staining) (C). Scale bars, 10 μm for IF, 40 μm for IHC. Quantification was performed by analyzing 5 separate areas in each tumor (mean ± SEM). *P < 0.01.
(D) Schematic model illustrating the function of DGAT1 in regulating lipid homeostasis and the cytotoxic effects resulting from its inhibition in GBM cells.
See also Figure S9.
Discussion
Lipid metabolism alterations are known to occur in various cancers (Cheng et al., 2018a; Cheng et al., 2018b; Currie et al., 2013a; Menendez and Lupu, 2007), but how tumor cells regulate lipid homoeostasis to prevent potential lipotoxicity have rarely been investigated. In the present study, we demonstrate that GBM activates the DGAT1-TG synthesis pathway to store excess FAs into LDs, thereby keeping the homeostasis of structural lipid synthesis and FA oxidation (Figure 7D). Inhibiting DGAT1 disrupts lipid homeostasis and results in excessive FAs shuttling into the mitochondria, leading to severe oxidative stress that kills GBM cells, demonstrating that targeting DGAT1 could be a very promising new approach for GBM therapy (Figure 7D).
Of note, our data show that inhibiting DGAT1 significantly upregulates the CPT1A protein, which can facilitate the entry of excess FAs into the mitochondria for oxidation, leading to a remarkable rise in ROS production. In turn, elevated ROS can damage the mitochondria and impair their oxidative capacity, resulting in the accumulation of large amounts of acylcarnitines and acetyl-CoA that further increase oxidative stress, thereby leading to cytochrome c release from the damaged mitochondria and triggering irreversible apoptotic cell death. In addition, our data also show that DGAT1 suppression significantly increases the levels of PC and PE, the major membrane structural phospholipids, as well as their metabolites, i.e., LPC and LPE, while it decreases the levels of other types of phospholipids, i.e., PI, PS, PG, LPI, LPS and LPG. Moreover, DGAT1 inhibition caused dramatic changes in the components of saturated and unsaturated fatty acids in different phospholipids and lysophospholipids, demonstrating that inhibiting the DGAT1-TG synthesis pathway results in FA redistribution into structural phospholipids and disruption of lipid homeostasis, which could contribute to the cell death induced by DGAT1 targeting. Furthermore, our data show that inhibition of DGAT1 triggers ER stress and increases ceramide levels. Although our data showed that mitochondrial damage and cytochrome c release are sufficient triggers to induce apoptotic cell death, we cannot exclude the contribution of increased ER stress and ceramides to cell death induced by DGAT1 inhibition. It is also possible that dysregulated lipid homeostasis and enhanced ER stress and ceramides work jointly to synergize with mitochondrial damage to kill GBM cells (Figure 7D).
Over the past two decades, the prognosis for GBM has remained very dismal, with an average survival of only 12–15 months, despite aggressive treatment (Wen and Reardon, 2016). One of the main reasons for this limited progress is a lack of full understanding of GBM biology. We previously uncovered that de novo FA synthesis is greatly increased in GBM to support its rapid growth (Cheng et al., 2015; Geng et al., 2016; Guo, 2016; Guo et al., 2013; Guo et al., 2014; Guo et al., 2009a; Guo et al., 2009b; Guo et al., 2011; Ru and Guo, 2017; Ru et al., 2016). We recently further identified that increased glucose in cancer cells activates sterol regulatory element-binding protein-1 (SREBP-1), a master transcriptional factor that controls de novo fatty acid synthesis (Cheng et al., 2018a; Cheng et al., 2018b), promoting the conversion of excess glucose into fatty acids (Cheng et al., 2015; Guo, 2016). It seems counterintuitive for cancer cells to keep synthesizing new FAs while storing large amounts of them into TGs and LDs. Nevertheless, we believe that synthesizing and storing excess FAs under rich nutrient conditions is a greatly advantageous means developed by malignant tumors. In the tumor microenvironment, nutrient levels are always fluctuating (Muir and Vander Heiden, 2018). When nutrient levels decrease, tumor cells could quickly utilize LDs to release free FAs for structural lipid synthesis and for energy production via elevation of FA oxidation, facilitating tumor cell survival under harsh conditions. This mechanism has the advantage to quickly boost malignant tumor growth. This concept is strongly supported by several recent studies that demonstrated that FA oxidation is important for GBM growth, showing that inhibition of FA oxidation significantly suppressed GBM growth (Duman et al., 2019; Lin et al., 2016). Nevertheless, even under low nutrient conditions such as glucose reduction, the homeostasis of FA metabolism needs to be maintained. Our data strongly suggest that although FA oxidation rate varies in the tumor microenvironment, overflow of FAs to mitochondria for oxidation remains very toxic for tumor cells, even under low glucose condition.
Targeting FA synthesis has been a steady focus in therapeutic development for cancer. However, as FA synthesis is also active in the liver, therapeutically targeting this process in individuals with cancer is limited. Thus, identifying the metabolic processes uniquely operating in GBM and other malignancies, while inactive in normal brain and other organs, is necessary to develop specific antitumor therapy. In fact, our findings showing that lipid homeostasis is sustained in GBM by storing excess FAs into TGs and LDs open up a new opportunity to target this deadly cancer. Based on our results, targeting DGAT1 to block FA storage will induce severe oxidative stress and disrupt lipid homeostasis in tumor cells, while sparing normal brain tissues where DGAT1 expression is very low. Moreover, both DGAT1 and DGAT2 are expressed in human liver and adipose tissues, two major sites synthesizing TGs in humans (Cases et al., 1998; Cases et al., 2001; Harris et al., 2011). Thus, when targeting DGAT1, DGAT2 could still maintain TG synthesis, thereby offsetting potential toxic effects. This concept is supported by a recent study that showed that inhibiting DGAT1 alone did not cause any noticeable toxic effects in mouse and adipocytes under physiological conditions, and that only ER stress was induced in adipocytes when lipolysis was strongly stimulated (Chitraju et al., 2017). Moreover, another recent study tested a DGAT1 inhibitor in cultured mouse embryo fibroblasts (MEFs) (Nguyen et al., 2017). The data showed that inhibition of DGAT1 did not cause any toxic effect in MEFs when cultured in normal medium, and only a minor reduction of the mitochondrial membrane potential was observed under severe nutrient-deprivation condition (serum/amino acid-free and low glucose) (Nguyen et al., 2017).
Interestingly, LDs are also formed in multiple other human cancers (Accioly et al., 2008; Geng et al., 2016; Geng and Guo, 2017; Qiu et al., 2015; Yue et al., 2014). Our data showed that DGAT1 and DGAT2 expression is similar in the liver cancer cell line HepG2, and inhibiting TG and LD formation to trigger lipotoxic effects in these cells required concurrent inhibition of both enzymes. A more recent study reported that inhibiting both DGAT1 and DGAT2 enzymes is required to suppress tumor growth in a renal cell carcinoma cell line A498-derived xenograft model (Ackerman et al., 2018). Therefore, studies are needed to determine in each cancer type whether targeting a single enzyme or both is needed to affect tumor growth. Importantly, targeting DGAT1 has been tested in multiple metabolic diseases in the clinic (Naik et al., 2014). Herein, our work provides a strong basis to translate DGAT1 inhibition to clinical testing in individuals with GBM and other cancers expressing high levels of DGAT1 and LDs.
Limitations of Study
The DGAT1 inhibitors commercially available have been developed for treating familial chylomicronemia syndrome or hypertriglyceridemia. No study has demonstrated that these inhibitors can effectively cross the blood-brain barrier (BBB). We tested DGAT1 inhibitor A-922500 in intracranial GBM models, but did not observe significant effects, suggesting it may not effectively cross the BBB, which limits its use in brain tumors. Thus, there is a need to identify a DGAT1 inhibitor capable of crossing the BBB in order to translate our findings to the clinic for GBM therapy. Another limitation of this study is that we have not identified the exact effects of specific lipid changes, particularly for structural lipids caused by DGAT1 inhibition, on GBM cells, which will be the focus of future investigation. Further, the kinetics of DGAT1 inhibition in the GBM model need to be tested to determine how effective the inhibitor acts over the course of tumor development as there may be a point of no return. Touching on this issue, future studies will be needed to identify the mechanism by which DGAT1 is upregulated in GBM, as that insight could lead to another avenue for effective therapy that avoids the need to inhibit DGAT1.
STAR METHODS
RESOURCE AVAILABILITY
Lead Contact
Further information and requests for resources and reagents should be directed and will be fulfilled by the Lead Contact, Deliang Guo (deliang.guo@osumc.edu).
Materials Availability
This study did not generate new unique reagents.
Data and Code Availability
This study did not generate/analyze [datasets/code].
EXPERIMENTAL MODEL AND SUBJECT DETAILS
Mice
Female athymic nude (NCr-nu/nu) mice with 6–8 weeks of age were obtained from OSU Target Validation Shared Resource to generate GBM xenograft models. Mice were housed 5 per cage in a conventional barrier facility on a 12-hour light/dark cycle at 22°C with free access to water and food. Mice health status was checked by following the protocols. All animal procedures were approved by the OSU Subcommittee on Research Animal Care.
Samples from Individuals with GBM
Tumor samples from individuals with GBM were obtained from the Department of Pathology at the OSU Medical Center. One half of each sample was snap-frozen in liquid nitrogen and stored at −80°C, and the second half was embedded in paraffin. The normal brain tissues were obtained from cerebral autopsy samples from non-cancer individuals. Neuro-pathology reports showed that the brain tissues were normal. The use of GBM and normal brain tissues was approved by the OSU Institutional Review Board.
Glioma Tissue Microarray
The Glioma tissue microarray (TMA) was from the University of Kentucky (UK). Institutional Review Board approval was obtained at UK prior to study initiation. The staining intensity of DGAT1 was graded as 0, 1+, 2+ or 3+ in tumor tissues. H-score was assigned using the following formula: H score = [1 × (%cells 1+) + 2 × (%cells 2+) + 3 × (%cells 3+)] × 100.
Cell Lines
Authenticated (short tandem repeat profiling) human GBM cell lines U251 from Sigma, T98 and U87 from American Type Culture Collection (ATCC) and the human liver cancer cell line HepG2 from ATCC were cultured in Dulbecco’s modified Eagle’s medium (DMEM) supplemented with 5% FBS. Authenticated GBM30, GBM83 and GBM169 are primary GBM patient-derived cell lines that were previously molecularly characterized and described (Mao et al., 2013; Uchida et al., 2013; Yoo et al., 2014). GBM30 and GBM83 are mesenchymal cells with a mutated EGFRvIII (constitutive EGFR mutation that lacks EGFR exons 2–7) and wild-type IDH (Mao et al., 2013; Uchida et al., 2013). GBM30, GBM83 and GBM169 were cultured in DMEM/F12 supplemented with B-27 serum-free supplements, heparin (2 mg/ml), EGF (50 ng/ml), and fibroblast growth factor (FGF, 50 ng/ml). U87/EGFRvIII-luc and GBM30-luc cells stably express luciferase and were previously described (Cheng et al., 2015; Ru et al., 2016). All cell lines were cultured in a humidified atmosphere of 5% CO2 at 37°C. U87/EGFRvIII was authenticated by testing EGFRvIII expression with Western blot. All cell lines were negative for mycoplasma contamination test.
METHOD DETAILS
Immunohistochemistry
Immunohistochemistry (IHC) was performed as previously described (Geng et al., 2016). Briefly, tissue sections were cut from paraffin blocks of biopsies. Tissue slides were placed in oven at 60°C for half an hour and then deparaffinized in xylene 3 times for 5 min each followed by dipping in graded alcohols (100%, 95%, 80% and 70%) 3 times for 2 min each. Slides were washed with distilled water (dH2O) 3 times for 5 min each and immersed in 3% hydrogen peroxide for 10 min followed by washing with dH2O. Slides were transferred into pre-heated 0.01M Citrate buffer (pH 6.0) in a steamer for 30 min, and then washed with dH2O and PBS after cooling. Slides were blocked with 3% BSA/PBS at room temperature for 1 hr and then incubated with primary antibody overnight at 4°C, followed by incubating with secondary antibody including Biotinylated Anti-rabbit IgG and Biotinylated Anti-mouse IgG at room temperature for 30 min. After incubation with avidin-biotin complex followed by washing 3 × 5 min with PBS and staining with NovaRed solution, slides were washed with tap water, counterstained with hematoxylin and dipped briefly in graded alcohols (70%, 80%, 95% and 100%) in xylene 2 times for 5 min each. Finally, slides were mounted and imaged.
Western Blots
Cells were lysed by RIPA buffer containing a protease inhibitor cocktail and phosphatase inhibitor. The proteins were separated by using 12% SDS-PAGE, and transferred onto an ECL nitrocellulose membrane. After blocking for 1.5 hr in 5% nonfat milk diluted by Tris-buffered saline containing 0.1% Tween 20, the membranes were incubated with various primary antibodies, followed by secondary antibodies conjugated to horseradish peroxidase. The immunoreactivity was revealed by use of an ECL kit.
Preparation of Cell Membrane Fractions
Cell membranes were isolated as previously described (Nohturfft et al., 1998). Briefly, cells were washed once with PBS and harvested by scraping. Cells were resuspended in a buffer containing 10 mM HEPES-KOH (pH 7.6), 10 mM KCl, 1.5 mM MgCl2, and 1 mM sodium EDTA, 1 mM sodium EGTA, 250 mM sucrose and a mixture of protease inhibitors, 5 μg/ml pepstatin A, 10 μg/ml leupeptin, 0.5 mM Phenylmethanesulfonyl fluoride (PMSF), 1 mM DTT (DL-Dithiothreitol), and 25 μg/ml ALLN (Calpain Inhibitor I) for 30 min on ice. Extracts were passed through a 22G × 1–1/2 inch needle 30 times and centrifuged at 890 g at 4°C for 5 min to remove nuclei. The supernatants were centrifuged at 20,000 g for 20 min at 4°C. For subsequent western blot analysis (for DGAT1 and PDIA1 protein), the pellet was dissolved in 0.1 ml of SDS lysis buffer (10 mM Tris-HCl pH 6.8, 100 mM NaCl, 1% (vol/vol) SDS, 1 mM sodium EDTA, and 1 mM sodium EGTA) and designated “membrane fraction”. The membrane fraction was incubated at 37°C for 30 min, and protein concentration was determined. One μl of bromophenol blue solution (100×) was added before the samples were subjected to SDS-PAGE.
Mitochondria and Cytosol Fractionation
The mitochondrial proteins were prepared using Qproteome Mitochondria Isolation Kit following the manufacturer’s instructions. Briefly, cells were harvested and washed with PBS, and resuspended with Lysis buffer and incubated at 4°C for 10 min. The cells were centrifuged at 1,000 g at 4°C for 10 min, and the supernatants were used as the cytosolic fractions. Pellets were resuspended in Disruption buffer and disrupted by using a 21G needle and a syringe. Following a centrifugation at 1,000 g at 4°C for 10 min, the supernatants were transferred to new tubes and centrifuged at 6,000 g at 4°C for 10 min. The pellets containing mitochondria were resuspended in Mitochondria storage buffer, and centrifuged at 6,000 g at 4°C for 20 min. Pellets were then resuspended in Mitochondria storage buffer and protein concentration was determined.
Cell Proliferation
A total of 0.5 to 2 × 10⁴ cells were seeded in 12-well plates. Cells were counted using a hemocytometer, and dead cells were assessed using trypan blue solution.
Quantitative Real-time PCR
Total RNA was isolated with TRIzol according to the manufacturer’s protocol, and cDNA was synthesized with iScript™ cDNA Synthesis Kit. Quantitative real-time PCR was performed with iQ™ SYBR® Green Supermix using the Applied Biosystems (ABI) 7900HT Real-Time PCR System. The expression was normalized to the 36B4 housekeeping gene and calculated with the comparative method (2−ΔΔCt). The primers are listed in Table S1.
Lentiviral Transduction
Mission pLKO.1-puro lentivirus vector containing shRNA (shDGAT1–1, shDGAT1–2, shDGAT2–1, shDGAT2–2), the non-mammalian shRNA control were purchased from Sigma. The shRNA vector and packing plasmids psPAX2 and the envelope plasmid pMD2.G were transfected into 293FT cells using the polyethylenimine. Supernatants were harvested at 48 hr and 72 hr and concentrated using the Lenti-X Concentrator. The virus titer was quantified by real time PCR by using qPCR Lentivirus Titration Kit. The lentiviral transduction was performed according to Sigma’s MISSION protocol with polybrene (8 μg/ml). GBM cells (U251, U87, T98, U87/EGFRvIII, GBM30, GBM83 and GBM169) and liver cancer cells HepG2 were infected with the same multiplicity of infection (MOI) of shControl, shDGAT1 or shDGAT2 lentivirus.
Mitochondrial Membrane Potential
After washing for 3 times with PBS, U251 cells were placed in FluoroBrite™ DMEM containing 5% FBS supplemented with Rhodamine 123 (0.05 μg/ml) for 30 min to determine mitochondrial membrane potential. After washing twice with PBS, cells were then incubated with Hoechst 33342 for 30 min before confocal imaging. More than 100 cells were analyzed and the fluorescence was quantified by the Image J software.
Hematoxylin and Eosin Staining
Paraffin tissue sections were deparaffinized in xylene and rehydrated in degrading ethanol dilutions (100%, 95% and 70% ethanol). After washing with dH2O, slides were stained with hematoxylin and eosin (H&E) solution in sequence, followed by washing with dH2O. Then, slides were dehydrated in degraded ethanol and immersed in xylene, followed by mounting in Permount.
Lipid Droplet Staining and Quantification
For live cells, lipid droplets were stained with BODIPY 493/503 (0.5 μM) for 30 min and visualized by confocal microscopy (Carl Zeiss LSM510 Meta or LSM800, 63x/1.4 NA oil). More than 30 cells were analyzed and LD numbers were quantified with the Image J software (NIH) in a 3D stack, as previously described (Geng et al., 2016). Lipid droplets were identified in patient and xenograft tumor tissues using immunofluorescence and an antibody against TIP47. After antigen retrieval, sections were incubated with the TIP47 antibody, followed by incubation with an appropriate secondary antibody, and slides were then mounted, imaged, and LD counted by using ImageJ.
Thin Layer Chromatography
Thin layer chromatography (TLC) was performed as previously described (Guo et al., 2009a). Total lipid extracts were obtained by suspending cells or tissues in 2 ml PBS containing the protease inhibitor 0.1 mM PMSF and adding 4 ml chloroform/methanol (2:1 vol/vol) with 0.01% butylated hydroxytoluene. The solutions were vortexed and centrifuged at 1500 g for 5 min. The organic phase was collected, and 2.5 ml chloroform was added to the residual aqueous phase for additional lipid extraction, and the solution was vortexed and centrifuged at 1500 g for 5 min. The organic phases were then pooled, and dried with nitrogen. TLC was performed by spotting the total lipid extract dissolved in chloroform onto a 5–10 cm EMD TLC Silica Gel plates, and developed with hexane/diethyl ether/acetic acid (80:20:2, vol/vol/vol). Lipids were visualized with iodine vapor prior to imaging (Guo et al., 2009a; Watson, 2006).
Lipidomics Analysis
Cultured cells were collected from plates using trypsin, then centrifuged at 500 g for 5 min. Cell pellets were homogenized on ice with 0.3 ml of 0.1x PBS in 1.5 ml RNase-free pellet pestle tube (Kimble Chase) using Kontes microtube pellet pestle rods (Kimble Chase). The fresh-frozen GBM tumor tissues were homogenized with 0.1x PBS at 6500 rpm, 0°C in 2 ml cryogenic vials using Cryolys Evolution homogenizer (Precellys® Evolution). The protein concentration of cell or tissue homogenates was quantified using the Pierce™ BCA protein assay kit. Bovine serum albumin was used as standard. An adequate amount of each homogenate (equivalent to 0.4–1.0 mg protein) was transferred into a disposable glass culture test tube. The same lipid internal standard mixture for quantitation of lipids was added prior to lipid extraction. Lipid extraction was performed using a modified Bligh and Dyer procedure, as described previously (Wang and Han, 2014). Lipid extracts were resuspended into 200 μl of chloroform/methanol (1:1, vol/vol) per mg protein, and flushed with nitrogen, capped, and stored at −20 °C till lipid analysis.
Acyl-CoA species including short chain fatty acyl-CoAs were extracted using a modified approach as previously described (Wang et al., 2018). Briefly, cells were collected and homogenized with Tissue-Tearor with 450 μl of chloroform/methanol (1:2, vol:vol) in an ice bath and ethyl alcohol for 2 min. Then, 150 μl of 17:0 acyl CoA (pmol/mg protein) in deionized H2O served as internal standard and equal volume (150 μl) of chloroform was added. The cells were continually homogenized for 2 min and then incubated in an ice bath and ethyl alcohol for 10 min, with occasional vortex. The aqueous phases were collected after centrifugation at 2000 g for 10 min. Homogenization and incubation were repeated and aqueous phases collected, followed by evaporation of the collected aqueous phases under nitrogen stream. The dried acyl-CoA was resuspended in 100 μl of Methanol/H2O (1:1, vol/vol) and analyzed by mass spectrometry.
For shotgun lipidomics, lipid extracts were further diluted to a final concentration of ~500 fmol/μl, and the mass spectrometric analysis was performed on a QqQ mass spectrometer (Thermo Scientific TSQ Altis) and high-resolution, accurate-mass mass spectrometer (Thermo Scientific Q Exactive) equipped with automated nanospray device (TriVersa NanoMate), as previously described (Han et al., 2008). Identification and quantification of the lipids were performed using a lipid analysis software (Wang et al., 2016; Yang et al., 2009). Data were normalized per mg protein. Reproducibility by analyzing a prepared sample by Multidimensional mass spectrometry-based shotgun lipidomics (MDMS-SL) is approximately 95%, and precision is approximately 90%, largely due to variations in determining protein content for normalizing lipid levels (Han, 2016; Han et al., 2008).
Reactive Oxygen Species Detection
The cell-permeant CellROX Deep Red dye is non-fluorescent in its reduced state, produces bright near-infrared fluorescence upon oxidation by reactive oxygen species (ROS), and has been used to detect oxidative stress in cells. After washing cells 3 times with PBS, cells were placed into FluoroBrite™ DMEM containing 5% FBS supplemented with 0.5 μM CellROX Deep Red for ROS detection or co-stained with MitoTracker Green for 30 min. After washing twice with PBS, cells were then incubated with Hoechst33342 for 30 min before confocal imaging. More than 100 cells were analyzed and fluorescence was quantified by the Image J software.
Seahorse Analysis
The Seahorse XFe 24 Extracellular Flux Bioanalyzer (Agilent) was used to measure oxygen consumption rate (OCR) and extracellular acidification rate (ECAR) according to the manufacturer’s protocol. After treatment with the DGAT1 inhibitor A-922500 (20 μg/ml for 24 hr) or shRNA infection (48 hr), cells were placed into fresh DMEM medium containing 10 mM glucose, 2 mM L-glutamine, and 1 mM sodium pyruvate and incubated for 1 hr. Three metabolic inhibitors were sequentially loaded into each well, i.e., oligomycin (Oligo, 1 μM), followed by carbonyl cyanide 4-trifluoromethoxy-phenylhydrazone (FCCP) (2 μM), followed by rotenone (Rot, 2 μM).
Transmission Electronic Microscopy
Cells were fixed for 30 min in 2.5% glutaraldehyde in 0.1 M phosphate buffer, pH 7.4 containing 0.1 M sucrose, and post-fixed in 1% osmium tetroxide/phosphate buffer for 30 min at room temperature. The cells were stained en-bloc with 1% uranyl acetate for 30 min, followed by dehydration in graded ethanol series 50%, 30%, 85%, 95%, 100%, 100%. The cells were finally embedded in Eponate 12 resin. Sections (70 nm) were produced on a Leica EM UC6 ultramicrotome and stained with 2% uranyl acetate and Reynold’s lead citrate. Transmission electronic microscopy (TEM) was performed on a FEI Tecnai G2 Spirit BioTWIN TEM at 80 kV.
Images were captured using an AMT camera. These experiments were performed at the OSU Microscopy Core Facility.
Inducible shRNA Knockdown
To construct the doxycycline-inducible shRNA plasmids, the shRNA oligo for shDGAT1–1 (TRCN0000236207) and the non-mammalian shRNA control (SHC002) were cloned into the pLKO-Tet-On vector (Addgene) according to the manufacturer’s instruction. The synthesized shRNA oligos are in Table S2. Control or DGAT1 shRNA oligonucleotides were mixed and heated to 95°C for 5 min and gradually cooled to room temperature in a beaker. The annealed oligos are ligated into the AgeI/EcoRI enzymes digested pLKO-Tet-On plasmid. The inducible shRNA lentivirus was produced following to the Lentiviral Transduction Section. U87/EGFRvIII cells were infected with inducible shControl or shDGAT1 lentivirus and selected with puromycin for 14 days in medium supplemented with 5% tet-free FBS to establish stable expressing cell line. The cells were cultured with or without doxycycline (5 μM) for 4–7 days for in vitro analysis.
Gene Knockout by CRISPR-Cas9
Lentivirus lentiCRISPR-v2 mediated knockout plasmids were purchased from Genscript. The lentiCRISPR-V2 empty vector was used as a control. Two guide RNAs for DGAT1 were used and their sequences are as following. sgDGAT1–1: GCCAGCTATAGGGATCCTTC, sgDGAT1–2: TGAGGTTCTCCAGAAATAAC. The lentivirus was produced following the Lentiviral Transduction section. The DGAT1 or control CRISPR lentivirus were transduced into U87/EGFRvIII cells and selected with puromycin for 4–5 days for analysis.
Fatty Acid Oxidation
The fatty acid β-oxidation was measured by the Fatty Acid Oxidation (FAO) Kit following the manual (Kwong et al., 2019). Briefly, GBM30 cells were seeded in Geltrex coated 6 cm dishes for one day, or U251 cells were seeded in 10 cm dishes for one day, and then treated with vehicle or A-922500 20 μg/ml in fresh medium for 24 hr. Cells were washed twice with cold PBS, and collected in PBS. Around 1.5 × 10⁶ cells were centrifuged at 200 g for 5 mins, and the pellets were suspended in 70 μl 1x lysis buffer, sit on ice for 5mins, followed by centrifuge at 12,000 rpm for 5 min. The supernatants were transferred to new tubes, and 10 ul of each was added in 96-well plate, mix with 50 μl blank solution or 50 μl reaction solution, and incubate at 37°C (no CO2) for 2 hr. 50 μl of 3% fresh made Acetic acid solution was added into each well to stop the reaction, measure at OD492.
GBM Xenograft Mouse Models
Xenograft models were generated using female athymic nude (NCr-nu/nu) mice (6–8 weeks of age obtained from OSU Target Validation Shared Resource). U87/EGFRvIII (1 × 10⁶) cells infected with shDGAT1-, shDGAT2- or scramble shRNA-expressing lentivirus for 48 hr were suspended in 100 μl PBS with 50% matrigel and implanted into mouse flanks to generate subcutaneous model. The mice were randomly divided into 4 groups before cell implantation. For inducible subcutaneous xenograft models, U87/EGFRvIII doxycycline-inducible shRNA cells (1 × 10⁶) were suspended in 100 μl PBS with 50% matrigel and injected into the flank of nude mice. Doxycycline diet (Envigo, 625 mg/kg) was given at day 3 after implantation. For the intracranial xenograft model, U87/EGFRvIII-luc (1 × 10⁵) or GBM30-luc (1 × 10⁵) cells infected with shDGAT1-, shDGAT2- or scramble shRNA-expressing lentivirus for 48 hr were suspended in 5 μl PBS and implanted into mice brains. Mice were observed until they became moribund, at which point they were sacrificed. For drug treatment, U87/EGFRvIII (1 × 10⁶ cells) or GBM30 cells (4 × 10⁶) were suspended in 100 μl PBS with 50% matrigel and implanted in mouse flanks. DGAT1 inhibitor A-922500 (120 mg/kg/day, oral gavage) was formulated with 1% Tween80 in PBS and administrated to mice by oral gavage when tumor size reached approximately 80 mm3. For all the animal experiments, the mice were randomly divided into different groups after implantation for Doxycycline diet or drug treatment.
Mouse Bioluminescence Imaging
Mice implanted with GBM cells expressing luciferase were injected intraperitoneally with a Luciferin solution (15 mg/mL in PBS, dose of 150 mg/kg) by an intraperitoneal route. The bioluminescence images were acquired using the IVIS Lumina system and analyzed by the Living Image software. Imaging experiments were conducted at the OSU Small Animal Imaging Core.
QUANTIFICATION AND STATISTICAL ANALYSIS
For cell proliferation, and quantification of LDs and TGs, mitochondrial length and loss of cristae, quantification of ROS and TMA, and OCR, data were analyzed by unpaired Student’s t-test or one-way ANOVA. Gene expression of DGAT1 and DGAT2 in TCGA GBM cohort was compared by paired Student’s t-test. Kaplan-Meier plot was used for patient and mice overall survival and the difference in survivals was tested by log-rank test. The mice were assigned to groups randomly. Tumor volume and weight were analyzed by one-way ANOVA. Multiplicity for each experiment was adjusted by the Holm’s procedure to control for type I error rate at 0.05. Data analysis was performed using SAS 9.4 (SAS, Inc; Cary, NC) or Prism 7 statistical software. Sample size used was based on the results from our previous studies (Cheng et al., 2015; Geng et al., 2016; Ru et al., 2016). All samples were included in the analysis.
Supplementary Material
KEY RESOURCES TABLE
| REAGENT or RESOURCE | SOURCE | IDENTIFIER |
|---|---|---|
| Antibodies | ||
| Cleaved Caspase 3 (Asp175), WB, dil:1/500; IF, dil: 1/50 | Cell Signaling Technology | Cat#9661; RRID: AB_2341188 |
| Cleaved Caspase 9 (Asp330) (Human Specific), WB, dil:1/1,000 | Cell Signaling Technology | Cat#9501; RRID: AB_331424 |
| BiP (C50B12), WB, dil:1/1,000 | Cell Signaling Technology | Cat#3177; RRID: AB_2119845 |
| CHOP (L63F7), WB, dil:1/1,000 | Cell Signaling Technology | Cat#2895; RRID: AB_2089254 |
| Rabbit Anti-PARP Monoclonal Antibody, WB, dil:1/1,000 | Cell Signaling Technology | clone 46D11, Cat#9532; RRID: AB_659884 |
| COX IV (3E11) Rabbit mAb antibody, WB, dil:1/30,000; IF, dil: 1/200 | Cell Signaling Technology | Cat#4850; RRID: AB_2085424 |
| Mouse Anti-β-Actin Monoclonal Antibody, WB, dil:1/50,000 | Sigma-Aldrich | clone AC-15, Cat#A1978; RRID: AB_476692 |
| CPT1A antibody [8F6AE9], WB, dil:1/10,000; IHC, dil: 1/200 | Abcam | Cat#ab128568; RRID: AB_11141632 |
| CPT1B antibody, WB, dil:1/1,000 | Abcam | Cat#ab104662; RRID: AB_10712608 |
| DGAT1 (H-255) antibody, WB, dil:1/1,000; IHC, 1/50 | Santa Cruz Biotechnology | Cat#sc-32861; RRID: AB_2090798 |
| PDIA1 (H-17) antibody, WB, dil:1/1,000 | Santa Cruz Biotechnology | Cat#sc-30932; RRID: AB_2156594 |
| Cytochrome c antibody, WB, dil:1/1,000 | BD Biosciences | clone 7H8.2C12, Cat#556433; RRID: AB_396417 |
| Anti-Perilipin 3/TIP47 antibody, IF, dil:1/200 | Abcam | Cat#ab47638 |
| Anti-mouse IgG, HRP-linked Antibody, WB, dil:1/1,000 – 5,000 | Cell Signaling Technology | Cat#7076; RRID: AB_330924 |
| Anti-rabbit IgG, HRP-linked Antibody, WB dil:1/1,000 – 5,000 | Cell Signaling Technology | Cat#7074; RRID: AB_2099233 |
| Goat anti-Rabbit IgG (H+L) Highly Cross-Adsorbed Secondary Antibody, Alexa Fluor 568, IF dil: 1/500 | Thermo Fisher Scientific | Cat#A-11036, RRID: AB_143011 |
| Goat anti-Mouse IgG (H+L) Cross-Adsorbed Secondary Antibody, Alexa Fluor 568, IF, dil: 1/500 | Thermo Fisher Scientific | Cat#A-11004; RRID: AB_2534072 |
| Goat anti-Rabbit IgG (H+L) Highly Cross-Adsorbed Secondary Antibody, Alexa Fluor 488, IF, dil: 1/500 | Thermo Fisher Scientific | Cat#A-11034; RRID: AB_2576217 |
| Horse Anti-Mouse IgG Antibody (H+L), Biotinylated, IHC dil:1/500 | Vector Laboratories | Cat#BA-2000, RRID: AB_2313581 |
| Horse Anti-Rabbit IgG Antibody (H+L), Biotinylated, IHC dil:1/500 | Vector Laboratories | Cat#BA-1100, RRID: AB_2336201 |
| Biological Samples | ||
| Human GBM TMA | Dr. Craig Horbinski, Northwestern University (previously at University of Kentucky) | https://www.feinberg.northwestern.edu/faculty-profiles/az/profile.html?xid=33419 |
| Human GBM patient samples | Department of Pathology at the OSU Medical Center | https://pathology.osu.edu/ |
| Chemicals, Peptides, and Recombinant Proteins | ||
| Paraformaldehyde | Sigma-Aldrich | Cat#P6148 |
| Glutaraldehyde solution | Sigma-Aldrich | Cat#G5882 |
| Puromycin dihydrochloride | Sigma-Aldrich | Cat#P8833 |
| EGF, Epidermal Growth Factor human | Sigma-Aldrich | Cat#E9644 |
| Heparin sodium salt | Sigma-Aldrich | Cat#H3393 |
| Triton X-100 | Sigma-Aldrich | Cat#T8787 |
| Poly-L-lysine hydrobromide | Sigma-Aldrich | Cat#P5899 |
| Laminin | Sigma-Aldrich | Cat#L2020 |
| Stearoyl-L-carnitine (C18-Carnitine) | Sigma-Aldrich | Cat#61229 |
| Oligomycin A | Sigma-Aldrich | Cat#75351 |
| Carbonyl cyanide 4-(trifluoromethoxy)phenylhydrazone (FCCP) | Sigma-Aldrich | Cat#C2920 |
| Rotenone | Sigma-Aldrich | Cat#R8875 |
| N-Acetyl-L-cysteine | Sigma-Aldrich | Cat#A7250 |
| Pepstatin A | Sigma-Aldrich | Cat#P5318 |
| Leupeptin | Sigma-Aldrich | Cat#L2884 |
| Phenylmethanesulfonyl fluoride (PMSF) | Sigma-Aldrich | Cat#P7626 |
| DL-Dithiothreitol (DTT) | Sigma-Aldrich | Cat#43819 |
| Calpain Inhibitor I (ALLN) | Sigma-Aldrich | Cat#A6185 |
| Polybrene | Sigma-Aldrich | Cat#H9268 |
| Butylated hydroxytoluene | Sigma-Aldrich | Cat#W218405 |
| TLC Silica gel | Sigma-Aldrich | Cat#1168350001 |
| B-27™ Supplement (50X), minus vitamin A | Thermo Fisher Scientific | Cat#12587010 |
| TrypLE™ Express Enzyme (1X), no phenol red | Thermo Fisher Scientific | Cat#12604021 |
| MitoTracker™ Red FM | Thermo Fisher Scientific | Cat#M22425 |
| Geltrex™ LDEV-Free, hESC-Qualified, Reduced Growth Factor Basement Membrane Matrix | Thermo Fisher Scientific | Cat#A1413301 |
| MitoTracker™ Green FM | Thermo Fisher Scientific | Cat#M7514 |
| CellROX™ Deep Red | Thermo Fisher Scientific | Cat#C10422 |
| TRIzol™ Reagent | Thermo Fisher Scientific | Cat#15596018 |
| Rhodamine 123 | Thermo Fisher Scientific | Cat#R302 |
| BODIPY 493/503 | Thermo Fisher Scientific | Cat#D3922 |
| RIPA buffer | Fisher Scientific | Cat#NC9484499 |
| Recombinant Human FGF | R&D Systems | Cat#4114-TC-01M |
| Etomoxir | R&D Systems | Cat#4539 |
| DGAT1 inhibitor A9–22500 | MedChemExpress LLC | Cat#HY-10038 |
| DGAT2 inhibitor PF-06424439 | Sigma-Aldrich | Cat#PZ0233 |
| C16:0 carnintine | Avanti Polar Lipids | Cat#870851P-5mg |
| Stearoyl-L-carnitine | Sigma-Aldrich | Cat#61229 |
| C18:1(Δ9-cis) Carnitine | Avanti Polar Lipids | Cat#870852P-5mg |
| Palmitic acid | Sigma-Aldrich | Cat#P0500 |
| Stearic acid | Sigma-Aldrich | Cat#S4751 |
| Oleic acid | Sigma-Aldrich | Cat#O1383 |
| cOmplete™, Mini, EDTA-free Protease Inhibitor Cocktail | Roche | Cat#11836170001 |
| phosphatase inhibitor tablets | Roche | Cat#4906845001 |
| Nitrocellulose Membrane | Bio-rad | Cat#162–0112 |
| Amersham™ ECL™ Western Blotting Detection Reagents | GE Healthcare | Cat#RPN2106 |
| VECTASTAIN® ABC-HRP Kit, Peroxidase (Standard) | Vector Laboratories | Cat#PK-4000 |
| Vector® NovaRED® Substrate Kit, Peroxidase (HRP) | Vector Laboratories | Cat#SK-4800 |
| Hematoxylin | Vector Laboratories | Cat#H-3401 |
| iQ™ SYBR® Green Supermix | Bio-rad | Cat#170–8882 |
| polyethylenimine | Polysciences | Cat#23966 |
| Lenti-X Concentrator | Clontech | Cat#631232 |
| Tet System Approved FBS | Clontech | Cat#631106 |
| Doxorubicin hydrochloride | Sigma-Aldrich | Cat# D1515 |
| 4μ8C | Selleckchem | Cat#S7272 |
| GSK2656157 | Selleckchem | Cat#S7033 |
| Charcoal-stripped FBS premium | Thermo Fisher Scientific | MT35072CV |
| Luciferin | Perkin Elmer | Cat#122796 |
| Critical Commercial Assays | ||
| qPCR Lentivirus Titration(Titer) Kit | Applied Biological Materials | Cat#LV900 |
| Qproteome Mitochondria Isolation Kit | Qiagen | Cat#37612 |
| iScript™ cDNA Synthesis Kit | Bio-rad | Cat#170–8891 |
| Experimental Models: Cell Lines | ||
| Human GBM cell: U87 | ATCC | Cat#ATCC® HTB-14 |
| Human GBM cell: T98 | ATCC | Cat#ATCC® CRL-1690 |
| Human GBM cell: U-251 | Sigma-Aldrich | Cat#09063001 |
| Human hepatocellular carcinoma cell: HepG2 | ATCC | Cat#ATCC® HB-8065 |
| Human GBM cell: U87/EGFRvIII | A kind gift from Dr. Paul Mischel (UCSD) | N/A |
| Human GBM cell: U87/EGFRvIII-luc | Generated in Dr. Balveen Kaur’s lab at OSU (currently working at UTHealth) | N/A |
| Human GBM primary cell: GBM30 | Originally generated in Dr. Ichiro Nakano’s lab at OSU (currently working at UAB) | N/A |
| Human GBM primary cell: GBM30-luc | Generated in Dr. Balveen Kaur’s lab at OSU (currently working at UTHealth) | N/A |
| Human GBM primary cell: GBM83 | Originally generated in Dr. Ichiro Nakano’s lab at OSU (currently working at UAB) | N/A |
| Human GBM primary cell: GBM169 | Originally generated in Dr. Ichiro Nakano’s lab at OSU (currently working at UAB) | N/A |
| Experimental Models: Organisms/Strains | ||
| Athymic nude (NCr-nu/nu) mice | OSU Target Validation Shared Resource | https://u.osu.edu/ccclabs/shared-resources-and-cores/ |
| Oligonucleotides | ||
| Primers for DGAT1, DGAT2 and 36B4, see Table S1 | This paper | N/A |
| Oligonucleotides for constructing inducible shRNA plasmids, see Table S2 | This Paper | N/A |
| Recombinant DNA | ||
| pLKO-Tet-On vector | Wiederschain et al.,2009 | Addgene, Cat#21915 |
| control shRNA | Sigma-Aldrich | Cat#SHC002 |
| shDGAT1–1 | Sigma-Aldrich | Cat# TRCN0000236207 |
| shDGAT1–2 | Sigma-Aldrich | Cat# TRCN0000036151 |
| shDGAT2–1 | Sigma-Aldrich | Cat# TRCN0000005193 |
| shDGAT2–2 | Sigma-Aldrich | Cat# TRCN0000424717 |
| psPAX2 | Addgene | Cat#12260 |
| pMD2.G | Addgene | Cat#12259 |
| lentiCRISPR-v2 | Addgene | Cat#52961 |
| Software and Algorithms | ||
| ZEN 2 (blue edition) | Zeiss | https://www.zeiss.com/microscopy/us/downloads.html |
| AxioVision Rel. 4.8.2 | Zeiss | https://www.zeiss.com/microscopy/us/downloads.html |
| LSM version 4.2 | Zeiss | https://www.zeiss.com/microscopy/us/downloads.html |
| Sequence Detection System v2.4 | Applied Biosystems | https://www.thermofisher.com/order/catalog/product/4350490#/4350490 |
| Seahorse Wave Controller 2.6 | Agilent | https://www.agilent.com/ |
| SPOT 5.2 | SPOT IMAGING | http://www.spotimaging.com/software/ |
| GraphPad Prism 7 | GraphPad | https://www.graphpad.com/scientific-software/prism/ |
| Fiji, ImageJ | ImageJ | https://imagej.net/Downloads |
| ImageScope v11.1.2.760 | Aperio Technologies | https://www.leicabiosystems.com/digital-pathology/manage/aperio-imagescope/ |
| GlioVis | Robert L. Bowman and et al., 2017 | https://gliovis.shinyapps.io/GlioVis/ |
| SAS 9.4 | SAS | https://www.sas.com/en_us/software/sas9.html |
| Other | ||
| L-Glutamine | Thermo Fisher Scientific | Cat#25030081 |
| Sodium Pyruvate | Thermo Fisher Scientific | Cat#11360070 |
| Dulbecco’s modified Eagle’s medium | Corning | Cat#15–013-CV |
| DMEM (Dulbecco’s Modified Eagle’s Medium)/Hams F-12 50/50 Mix | Corning | Cat#90–090-PB |
| DMEM without Glucose, Glutamine, Sodium Pyruvate | Corning | Cat#17–207-CV |
| D-(+)-Glucose solution | Sigma-Aldrich | Cat#G8644–100ML |
| Doxycycline diets | ENVIGO | Cat#TD.01306 |
Context and Significance.
Tumor cells acquire abundant fats for rapid cell growth, but how they avoid toxicity from such loading is unknown. An answer to this question may allow leveraging of such insight to introduce a vulnerability to tumor cells and thus an effective strategy to treat cancer. Here, Cheng et al. report that glioblastoma (GBM), the most lethal brain tumor, stores excess fat in lipid droplets (LDs), thus preventing lipotoxicity. They find that inhibiting DGAT1, an enzyme involved in such storage, disrupts this process, leading to severe oxidative stress that kills GBM cells. These findings suggest a promising new therapeutic approach for GBM, but one that could be applied to other cancers that also rely on LD formation to avoid lipotoxicity.
Highlights.
A high level of DGAT1 is associated with poor survival in individuals with GBM
DGAT1 prevents lipotoxicity in GBM by promoting lipid droplet storage of fatty acids
Inhibiting DGAT1 promotes tumor cell death in GBM via oxidative stress
Targeting DGAT1 strongly suppresses GBM growth in vivo in a mouse model
Acknowledgments
This work was supported by NINDS and NCI grants R01NS104332, R01NS112935 and R01CA240726 to DG, R01CA227874 to DG/AC and American Cancer Society Research Scholar Grant RSG-14-228-01-CSM to DG. We also appreciate the support from OSUCCC-Pelotonia Idea grant and start-up funds to DG. We thank Dr. Martine Torres for her critical review and helpful comments of the manuscript.
Footnotes
Publisher's Disclaimer: This is a PDF file of an unedited manuscript that has been accepted for publication. As a service to our customers we are providing this early version of the manuscript. The manuscript will undergo copyediting, typesetting, and review of the resulting proof before it is published in its final form. Please note that during the production process errors may be discovered which could affect the content, and all legal disclaimers that apply to the journal pertain.
Declaration of Interests
The authors declare that there are no competing interests.
References
- Accioly MT, Pacheco P, Maya-Monteiro CM, Carrossini N, Robbs BK, Oliveira SS, Kaufmann C, Morgado-Diaz JA, Bozza PT, and Viola JP (2008). Lipid bodies are reservoirs of cyclooxygenase-2 and sites of prostaglandin-E2 synthesis in colon cancer cells. Cancer Res 68, 1732–1740. [DOI] [PubMed] [Google Scholar]
- Ackerman D, Tumanov S, Qiu B, Michalopoulou E, Spata M, Azzam A, Xie H, Simon MC, and Kamphorst JJ (2018). Triglycerides Promote Lipid Homeostasis during Hypoxic Stress by Balancing Fatty Acid Saturation. Cell Rep 24, 2596–2605 e2595. [DOI] [PMC free article] [PubMed] [Google Scholar]
- Aruoma OI, Halliwell B, Hoey BM, and Butler J (1989). The antioxidant action of N-acetylcysteine: its reaction with hydrogen peroxide, hydroxyl radical, superoxide, and hypochlorous acid. Free Radic Biol Med 6, 593–597. [DOI] [PubMed] [Google Scholar]
- Atkins C, Liu Q, Minthorn E, Zhang SY, Figueroa DJ, Moss K, Stanley TB, Sanders B, Goetz A, Gaul N, et al. (2013). Characterization of a novel PERK kinase inhibitor with antitumor and antiangiogenic activity. Cancer Res 73, 1993–2002. [DOI] [PubMed] [Google Scholar]
- Carracedo A, Cantley LC, and Pandolfi PP (2013). Cancer metabolism: fatty acid oxidation in the limelight. Nat Rev Cancer 13, 227–232. [DOI] [PMC free article] [PubMed] [Google Scholar]
- Cases S, Smith SJ, Zheng YW, Myers HM, Lear SR, Sande E, Novak S, Collins C, Welch CB, Lusis AJ, et al. (1998). Identification of a gene encoding an acyl CoA:diacylglycerol acyltransferase, a key enzyme in triacylglycerol synthesis. Proc Natl Acad Sci U S A 95, 13018–13023. [DOI] [PMC free article] [PubMed] [Google Scholar]
- Cases S, Stone SJ, Zhou P, Yen E, Tow B, Lardizabal KD, Voelker T, and Farese RV Jr. (2001). Cloning of DGAT2, a second mammalian diacylglycerol acyltransferase, and related family members. J Biol Chem 276, 38870–38876. [DOI] [PubMed] [Google Scholar]
- Cerami E, Gao J, Dogrusoz U, Gross BE, Sumer SO, Aksoy BA, Jacobsen A, Byrne CJ, Heuer ML, Larsson E, et al. (2012). The cBio cancer genomics portal: an open platform for exploring multidimensional cancer genomics data. Cancer Discov 2, 401–404. [DOI] [PMC free article] [PubMed] [Google Scholar]
- Cheng C, Geng F, Cheng X, and Guo D (2018a). Lipid metabolism reprogramming and its potential targets in cancer. Cancer Commun (Lond) 38, 27. [DOI] [PMC free article] [PubMed] [Google Scholar]
- Cheng C, Ru P, Geng F, Liu J, Yoo JY, Wu X, Cheng X, Euthine V, Hu P, Guo JY, et al. (2015). Glucose-Mediated N-glycosylation of SCAP Is Essential for SREBP-1 Activation and Tumor Growth. Cancer Cell 28, 569–581. [DOI] [PMC free article] [PubMed] [Google Scholar]
- Cheng X, Li J, and Guo D (2018b). SCAP/SREBPs are Central Players in Lipid Metabolism and Novel Metabolic Targets in Cancer Therapy. Curr Top Med Chem 18, 484–493. [DOI] [PMC free article] [PubMed] [Google Scholar]
- Chitraju C, Mejhert N, Haas JT, Diaz-Ramirez LG, Grueter CA, Imbriglio JE, Pinto S, Koliwad SK, Walther TC, and Farese RV Jr. (2017). Triglyceride Synthesis by DGAT1 Protects Adipocytes from Lipid-Induced ER Stress during Lipolysis. Cell Metab 26, 407–418 e403. [DOI] [PMC free article] [PubMed] [Google Scholar]
- Coleman RA, and Lee DP (2004). Enzymes of triacylglycerol synthesis and their regulation. Progress in lipid research 43, 134–176. [DOI] [PubMed] [Google Scholar]
- Coleman RA, and Mashek DG (2011). Mammalian triacylglycerol metabolism: synthesis, lipolysis, and signaling. Chem Rev 111, 6359–6386. [DOI] [PMC free article] [PubMed] [Google Scholar]
- Cross BC, Bond PJ, Sadowski PG, Jha BK, Zak J, Goodman JM, Silverman RH, Neubert TA, Baxendale IR, Ron D, et al. (2012). The molecular basis for selective inhibition of unconventional mRNA splicing by an IRE1-binding small molecule. Proc Natl Acad Sci U S A 109, E869–878. [DOI] [PMC free article] [PubMed] [Google Scholar]
- Currie E, Schulze A, Zechner R, Walther TC, and Farese RV Jr. (2013a). Cellular Fatty Acid Metabolism and Cancer. Cell metabolism. [DOI] [PMC free article] [PubMed] [Google Scholar]
- Currie E, Schulze A, Zechner R, Walther TC, and Farese RV Jr. (2013b). Cellular fatty acid metabolism and cancer. Cell Metab 18, 153–161. [DOI] [PMC free article] [PubMed] [Google Scholar]
- Cvrljevic AN, Akhavan D, Wu M, Martinello P, Furnari FB, Johnston AJ, Guo D, Pike L, Cavenee WK, Scott AM, et al. (2011). Activation of Src induces mitochondrial localisation of de2–7EGFR (EGFRvIII) in glioma cells: implications for glucose metabolism. J Cell Sci 124, 2938–2950. [DOI] [PMC free article] [PubMed] [Google Scholar]
- Duman C, Yaqubi K, Hoffmann A, Acikgoz AA, Korshunov A, Bendszus M, Herold-Mende C, Liu HK, and Alfonso J (2019). Acyl-CoA-Binding Protein Drives Glioblastoma Tumorigenesis by Sustaining Fatty Acid Oxidation. Cell Metab 30, 274–289 e275. [DOI] [PubMed] [Google Scholar]
- Ertunc ME, and Hotamisligil GS (2016). Lipid signaling and lipotoxicity in metaflammation: indications for metabolic disease pathogenesis and treatment. J Lipid Res 57, 2099–2114. [DOI] [PMC free article] [PubMed] [Google Scholar]
- Futatsugi K, Kung DW, Orr ST, Cabral S, Hepworth D, Aspnes G, Bader S, Bian J, Boehm M, Carpino PA, et al. (2015). Discovery and Optimization of Imidazopyridine-Based Inhibitors of Diacylglycerol Acyltransferase 2 (DGAT2). Journal of medicinal chemistry 58, 7173–7185. [DOI] [PubMed] [Google Scholar]
- Gao J, Aksoy BA, Dogrusoz U, Dresdner G, Gross B, Sumer SO, Sun Y, Jacobsen A, Sinha R, Larsson E, et al. (2013). Integrative Analysis of Complex Cancer Genomics and Clinical Profiles Using the cBioPortal. Science Signaling 6, pl1–pl1. [DOI] [PMC free article] [PubMed] [Google Scholar]
- Geng F, Cheng X, Wu X, Yoo JY, Cheng C, Guo JY, Mo X, Ru P, Hurwitz B, Kim SH, et al. (2016). Inhibition of SOAT1 Suppresses Glioblastoma Growth via Blocking SREBP-1-Mediated Lipogenesis. Clin Cancer Res 22, 5337–5348. [DOI] [PMC free article] [PubMed] [Google Scholar]
- Geng F, and Guo D (2017). Lipid droplets, potential biomarker and metabolic target in glioblastoma. Intern Med Rev (Wash D C) 3. [DOI] [PMC free article] [PubMed] [Google Scholar]
- Guo D (2016). SCAP links glucose to lipid metabolism in cancer cells. Mol Cell Oncol 3. [DOI] [PMC free article] [PubMed] [Google Scholar]
- Guo D, Bell EH, and Chakravarti A (2013). Lipid metabolism emerges as a promising target for malignant glioma therapy. CNS Oncol 2, 289–299. [DOI] [PMC free article] [PubMed] [Google Scholar]
- Guo D, Bell EH, Mischel P, and Chakravarti A (2014). Targeting SREBP-1-driven lipid metabolism to treat cancer. Curr Pharm Des 20, 2619–2626. [DOI] [PMC free article] [PubMed] [Google Scholar]
- Guo D, Hildebrandt IJ, Prins RM, Soto H, Mazzotta MM, Dang J, Czernin J, Shyy JYJ, Watson AD, Phelps M, et al. (2009a). The AMPK agonist AICAR inhibits the growth of EGFRvIII-expressing glioblastomas by inhibiting lipogenesis. Proc Natl Acad Sci USA 106, 12932–12937. [DOI] [PMC free article] [PubMed] [Google Scholar]
- Guo D, Prins RM, Dang J, Kuga D, Iwanami A, Soto H, Lin KY, Huang TT, Akhavan D, Hock MB, et al. (2009b). EGFR signaling through an Akt-SREBP-1-dependent, rapamycin-resistant pathway sensitizes glioblastomas to antilipogenic therapy. Sci Signal 2, ra82. [DOI] [PMC free article] [PubMed] [Google Scholar]
- Guo D, Reinitz F, Youssef M, Hong C, Nathanson D, Akhavan D, Kuga D, Amzajerdi AN, Soto H, Zhu S, et al. (2011). An LXR agonist promotes glioblastoma cell death through inhibition of an EGFR/AKT/SREBP-1/LDLR-dependent pathway. Cancer Discov 1, 442–456. [DOI] [PMC free article] [PubMed] [Google Scholar]
- Han X (2016). Lipidomics: Comprehensive mass spectrometry of lipids. Hoboken, New Jersey: John Wiley & Sons, Inc. [Google Scholar]
- Han X, Yang K, and Gross RW (2008). Microfluidics-based electrospray ionization enhances the intrasource separation of lipid classes and extends identification of individual molecular species through multi-dimensional mass spectrometry: development of an automated high-throughput platform for shotgun lipidomics. Rapid communications in mass spectrometry : RCM 22, 2115–2124. [DOI] [PMC free article] [PubMed] [Google Scholar]
- Harris CA, Haas JT, Streeper RS, Stone SJ, Kumari M, Yang K, Han X, Brownell N, Gross RW, Zechner R, et al. (2011). DGAT enzymes are required for triacylglycerol synthesis and lipid droplets in adipocytes. J Lipid Res 52, 657–667. [DOI] [PMC free article] [PubMed] [Google Scholar]
- Herker E, Harris C, Hernandez C, Carpentier A, Kaehlcke K, Rosenberg AR, Farese RV Jr., and Ott M (2010). Efficient hepatitis C virus particle formation requires diacylglycerol acyltransferase-1. Nat Med 16, 1295–1298. [DOI] [PMC free article] [PubMed] [Google Scholar]
- King AJ, Segreti JA, Larson KJ, Souers AJ, Kym PR, Reilly RM, Collins CA, Voorbach MJ, Zhao G, Mittelstadt SW, et al. (2010). In vivo efficacy of acyl CoA: diacylglycerol acyltransferase (DGAT) 1 inhibition in rodent models of postprandial hyperlipidemia. Eur J Pharmacol 637, 155–161. [DOI] [PubMed] [Google Scholar]
- Krahmer N, Farese RV Jr., and Walther TC (2013). Balancing the fat: lipid droplets and human disease. EMBO molecular medicine 5, 973–983. [DOI] [PMC free article] [PubMed] [Google Scholar]
- Kwong SC, Jamil AHA, Rhodes A, Taib NA, and Chung I (2019). Metabolic role of fatty acid binding protein 7 in mediating triple-negative breast cancer cell death via PPAR-α signaling. J Lipid Res 60, 1807–1817. [DOI] [PMC free article] [PubMed] [Google Scholar]
- Lee AS (2005). The ER chaperone and signaling regulator GRP78/BiP as a monitor of endoplasmic reticulum stress. Methods (San Diego, Calif.) 35, 373–381. [DOI] [PubMed] [Google Scholar]
- Lin H, Patel S, Affleck VS, Wilson I, Turnbull DM, Joshi AR, Maxwell R, and Stoll EA (2016). Fatty acid oxidation is required for the respiration and proliferation of malignant glioma cells. Neuro-Oncology 19, 43–54. [DOI] [PMC free article] [PubMed] [Google Scholar]
- Listenberger LL, Han X, Lewis SE, Cases S, Farese RV Jr., Ory DS, and Schaffer JE (2003). Triglyceride accumulation protects against fatty acid-induced lipotoxicity. Proc Natl Acad Sci U S A 100, 3077–3082. [DOI] [PMC free article] [PubMed] [Google Scholar]
- Liu L, Ulbrich J, Muller J, Wustefeld T, Aeberhard L, Kress TR, Muthalagu N, Rycak L, Rudalska R, Moll R, et al. (2012). Deregulated MYC expression induces dependence upon AMPK-related kinase 5. Nature 483, 608–612. [DOI] [PubMed] [Google Scholar]
- Londhe P, Yu PY, Ijiri Y, Ladner KJ, Fenger JM, London C, Houghton PJ, and Guttridge DC (2018). Classical NF-κB Metabolically Reprograms Sarcoma Cells Through Regulation of Hexokinase 2. Frontiers in Oncology 8, 104. [DOI] [PMC free article] [PubMed] [Google Scholar]
- Mao P, Joshi K, Li J, Kim SH, Li P, Santana-Santos L, Luthra S, Chandran UR, Benos PV, Smith L, et al. (2013). Mesenchymal glioma stem cells are maintained by activated glycolytic metabolism involving aldehyde dehydrogenase 1A3. Proc Natl Acad Sci U S A 110, 8644–8649. [DOI] [PMC free article] [PubMed] [Google Scholar]
- Menendez JA, and Lupu R (2007). Fatty acid synthase and the lipogenic phenotype in cancer pathogenesis. Nat Rev Cancer 7, 763–777. [DOI] [PubMed] [Google Scholar]
- Muir A, and Vander Heiden MG (2018). The nutrient environment affects therapy. Science 360, 962–963. [DOI] [PMC free article] [PubMed] [Google Scholar]
- Naik R, Obiang-Obounou BW, Kim M, Choi Y, Lee HS, and Lee K (2014). Therapeutic strategies for metabolic diseases: Small-molecule diacylglycerol acyltransferase (DGAT) inhibitors. ChemMedChem 9, 2410–2424. [DOI] [PubMed] [Google Scholar]
- Nguyen TB, Louie SM, Daniele JR, Tran Q, Dillin A, Zoncu R, Nomura DK, and Olzmann JA (2017). DGAT1-Dependent Lipid Droplet Biogenesis Protects Mitochondrial Function during Starvation-Induced Autophagy. Dev Cell 42, 9–21 e25. [DOI] [PMC free article] [PubMed] [Google Scholar]
- Nishitoh H (2012). CHOP is a multifunctional transcription factor in the ER stress response. Journal of biochemistry 151, 217–219. [DOI] [PubMed] [Google Scholar]
- Nohturfft A, Brown MS, and Goldstein JL (1998). Topology of SREBP cleavage-activating protein, a polytopic membrane protein with a sterol-sensing domain. J Biol Chem 273, 17243–17250. [DOI] [PubMed] [Google Scholar]
- Qiu B, Ackerman D, Sanchez DJ, Li B, Ochocki JD, Grazioli A, Bobrovnikova-Marjon E, Diehl JA, Keith B, and Simon MC (2015). HIF2alpha-Dependent Lipid Storage Promotes Endoplasmic Reticulum Homeostasis in Clear-Cell Renal Cell Carcinoma. Cancer Discov 5, 652–667. [DOI] [PMC free article] [PubMed] [Google Scholar]
- Qu Q, Zeng F, Liu X, Wang QJ, and Deng F (2016). Fatty acid oxidation and carnitine palmitoyltransferase I: emerging therapeutic targets in cancer. Cell Death Dis 7, e2226. [DOI] [PMC free article] [PubMed] [Google Scholar]
- Ru P, and Guo D (2017). microRNA-29 mediates a novel negative feedback loop to regulate SCAP/SREBP-1 and lipid metabolism. RNA Dis 4. [DOI] [PMC free article] [PubMed] [Google Scholar]
- Ru P, Hu P, Geng F, Mo X, Cheng C, Yoo JY, Cheng X, Wu X, Guo JY, Nakano I, et al. (2016). Feedback Loop Regulation of SCAP/SREBP-1 by miR-29 Modulates EGFR Signaling-Driven Glioblastoma Growth. Cell Rep 16, 1527–1535. [DOI] [PMC free article] [PubMed] [Google Scholar]
- Schreurs M, Kuipers F, and van der Leij FR (2010). Regulatory enzymes of mitochondrial beta-oxidation as targets for treatment of the metabolic syndrome. Obesity reviews : an official journal of the International Association for the Study of Obesity 11, 380–388. [DOI] [PubMed] [Google Scholar]
- Uchida H, Marzulli M, Nakano K, Goins WF, Chan J, Hong CS, Mazzacurati L, Yoo JY, Haseley A, Nakashima H, et al. (2013). Effective treatment of an orthotopic xenograft model of human glioblastoma using an EGFR-retargeted oncolytic herpes simplex virus. Molecular therapy : the journal of the American Society of Gene Therapy 21, 561–569. [DOI] [PMC free article] [PubMed] [Google Scholar]
- Walther TC, and Farese RV Jr. (2012). Lipid droplets and cellular lipid metabolism. Annu Rev Biochem 81, 687–714. [DOI] [PMC free article] [PubMed] [Google Scholar]
- Wang C, Palavicini JP, and Han X (2018). Lipidomics Profiling of Myelin. Methods in molecular biology (Clifton, N.J.) 1791, 37–50. [DOI] [PubMed] [Google Scholar]
- Wang M, and Han X (2014). Multidimensional mass spectrometry-based shotgun lipidomics. Methods in molecular biology (Clifton, N.J.) 1198, 203–220. [DOI] [PMC free article] [PubMed] [Google Scholar]
- Wang M, Wang C, Han RH, and Han X (2016). Novel advances in shotgun lipidomics for biology and medicine. Progress in lipid research 61, 83–108. [DOI] [PMC free article] [PubMed] [Google Scholar]
- Watson AD (2006). Thematic review series: systems biology approaches to metabolic and cardiovascular disorders. Lipidomics: a global approach to lipid analysis in biological systems. J Lipid Res 47, 2101–2111. [DOI] [PubMed] [Google Scholar]
- Weis BC, Cowan AT, Brown N, Foster DW, and McGarry JD (1994). Use of a selective inhibitor of liver carnitine palmitoyltransferase I (CPT I) allows quantification of its contribution to total CPT I activity in rat heart. Evidence that the dominant cardiac CPT I isoform is identical to the skeletal muscle enzyme. J Biol Chem 269, 26443–26448. [PubMed] [Google Scholar]
- Wen PY, and Reardon DA (2016). Neuro-oncology in 2015: Progress in glioma diagnosis, classification and treatment. Nat Rev Neurol 12, 69–70. [DOI] [PubMed] [Google Scholar]
- Yang K, Cheng H, Gross RW, and Han X (2009). Automated lipid identification and quantification by multidimensional mass spectrometry-based shotgun lipidomics. Analytical chemistry 81, 4356–4368. [DOI] [PMC free article] [PubMed] [Google Scholar]
- Yen CL, Stone SJ, Koliwad S, Harris C, and Farese RV Jr. (2008). Thematic review series: glycerolipids. DGAT enzymes and triacylglycerol biosynthesis. J Lipid Res 49, 2283–2301. [DOI] [PMC free article] [PubMed] [Google Scholar]
- Yoo JY, Hurwitz BS, Bolyard C, Yu JG, Zhang J, Selvendiran K, Rath KS, He S, Bailey Z, Eaves D, et al. (2014). Bortezomib-induced unfolded protein response increases oncolytic HSV-1 replication resulting in synergistic antitumor effects. Clin Cancer Res 20, 3787–3798. [DOI] [PMC free article] [PubMed] [Google Scholar]
- Yue S, Li J, Lee SY, Lee HJ, Shao T, Song B, Cheng L, Masterson TA, Liu X, Ratliff TL, et al. (2014). Cholesteryl ester accumulation induced by PTEN loss and PI3K/AKT activation underlies human prostate cancer aggressiveness. Cell Metab 19, 393–406. [DOI] [PMC free article] [PubMed] [Google Scholar]
- Zeviani M, Nakagawa M, Herbert J, Lomax MI, Grossman LI, Sherbany AA, Miranda AF, DiMauro S, and Schon EA (1987). Isolation of a cDNA clone encoding subunit IV of human cytochrome c oxidase. Gene 55, 205–217. [DOI] [PubMed] [Google Scholar]
- Zhao G, Souers AJ, Voorbach M, Falls HD, Droz B, Brodjian S, Lau YY, Iyengar RR, Gao J, Judd AS, et al. (2008). Validation of diacyl glycerolacyltransferase I as a novel target for the treatment of obesity and dyslipidemia using a potent and selective small molecule inhibitor. Journal of medicinal chemistry 51, 380–383. [DOI] [PubMed] [Google Scholar]
Associated Data
This section collects any data citations, data availability statements, or supplementary materials included in this article.
Supplementary Materials
Data Availability Statement
This study did not generate/analyze [datasets/code].