

Abstract
AKB48 and its fluorinated derivative 5F-AKB48 are synthetic cannabinoids (SCs) which have caused hospitalizations and deaths in human users. Abuse of SCs is dangerous because users may mistake them for natural cannabis, which is generally considered to be unlikely to elicit adverse effects. The present studies were designed to investigate the in vitro oxidative metabolism of 5F-AKB48 by human microsomal fractions from different organs and sexes as well as recombinant human cytochrome P450s (P450s). Mass spectrometry data tentatively provides evidence for the existence of mono-, di-, and trihydroxylated metabolites in a successive metabolism. Experiments utilizing P450s revealed that the most active enzymes (CYP2D6, CYP2J2, CYP3A4, and CYP3A5) effectively produced mono- and dihydroxylated metabolites, while CYP3A4/5 also produced significant amounts of the trihydroxylated metabolite. Moreover, although the affinity and potency of Phase I metabolite 4OH-5F-AKB48 is reduced when compared to that of the parent drug, this metabolite nevertheless retains similar high affinity for CB1 receptors, and greater efficacy for G protein activation, when compared to THC. Finally, 5F-AKB48 produced time- and dose-dependent cannabimimetic effects in mice which were more potent, but shorter acting, than those of Δ9-THC, and were attenuated by prior treatment with the CB1 antagonist rimonabant. Based on our data, we hypothesize that while many cases of toxicity result from genetic mutations, which can lead to a decrease or even absence of activity for Phase I drug-metabolizing enzymes, other P450s could potentially increase their role in the metabolism of these SCs. Because many metabolites of SCs remain biologically active, they could contribute to the deleterious effects of these substances.
Keywords: Synthetic Cannabinoids, Metabolism, P450 Polymorphism, Cannabinoid Receptors, Adverse Effects, MS, HPLC
Introduction
Cannabinoid receptors (CBRs) are G protein-coupled receptors ubiquitously expressed in the CNS, and involved in numerous physiological and psychological functions including appetite, immunity, mood, and pain sensitivity (Ford et al., 2017, Zawilska and Wojcieszark, 2014, Lynch and Ware, 2015). Interestingly, activation of CBRs by exogenous synthetic cannabinoid ligands (SCs) can elicit dramatically different responses than those evoked by endocannabinoids and phytocannabinoids like Δ9-tetrahydrocannabinol (Δ9-THC). While phytocannabinoids and endocannabinoids are quickly deactivated during metabolism and do not produce active metabolites, SCs produce numerous biologically active metabolites, which can continue to displace other ligands, and then bind to and activate the CBRs, often for prolonged periods. The increased potency of SCs (relative to endocannabinoids and Δ9-THC) results in persistent receptor binding and activation, which can downregulate and desensitize CBRs. Downregulation and desensitization play a role in drug tolerance and withdrawal upon discontinuation. Most notably, and unlike Δ9-THC, abuse of SCs can induce numerous adverse effects such as vomiting, seizures, bleeding, tachycardia, and even death (Schneir and Baumbacher, 2012; Brents et al., 2013; Srisung et al., 2015; Tai et al., 2015; Hutchison et al., 2018; Vucinic et al., 2018; Basavarajappa and Subbanna, 2019; Wilson et al., 2019),
As such, abuse of SCs is a growing concern in the medical and scientific communities due to the unknown pharmacological and toxicological effects of these drugs. Produced in clandestine labs, these cannabimimetic compounds bind to and activate the same CBRs that the classical psychoactive phytocannabinoid Δ9-THC does. Unlike Δ9-THC and other drugs of abuse, SCs undergo extensive metabolism, making them difficult to detect in standard laboratory tests, which perhaps further increases recreational experimentation with their use (Chimalakonda et al., 2011). Due to their propensity of abuse and lack of medicinal value, many SCs have been classified as Schedule I substances under the Controlled Substances Act. In attempts to bypass these regulations, newer compounds have emerged with similar chemical backbones to previously controlled drugs, but containing numerous modifications and additional functional groups. These new substances may have dramatically different biological effects from those of their parent drugs, and are often chemically distinct enough that analog laws do not obviously apply, necessitating new legislation to curtail their availability (Schneir and Baumbacher, 2012; Vucinic et al., 2018; Basavarajappa and Subbanna, 2019).
Common alterations of third generation SCs include the addition of a large adamantyl cage to the indole or indazole cores, or the replacement of a napthyl ring with an adamantyl cage such as with the present compound of interest N-(1-adamantyl)-1-pentyl-1 H -indazole-3-carboxamide (AKB48, also known as APINACA) (Gandhi et al., 2013; Holm et al., 2015a; Vikingsson et al., 2015). Fourth generation SCs are often simply third generation drugs that have been halogenated on their alkyl chains (Mardal et al., 2018). For example, the present compound of interest N-(adamantan-1-yl)-1-(5-fluoropentyl)-1H-indazole-3-carboxamide (5F-AKB48, also known as 5F-APINACA), is an analog of AKB48 that is fluorinated on its pentyl chain. These structural modifications altered the pharmacological properties of these SCs resulting in stronger, more potent effects, perhaps because the addition of the adamantyl cage, which slows metabolism, prolongs the half-life and gives rise to multiple biologically active metabolites (Gandhi et al., 2013; Vikingsson et al., 2015). As the alkyl chains common to SCs are frequently attached to an indole or indazole core in the molecule, fluorinating these chains increases the pharmacological activity of the molecule, and, subsequently, their toxic effects (Schneir and Baumbacher, 2012; Vucinic et al., 2018; Basavarajappa and Subbanna, 2019).
In Phase I metabolism, cytochrome P450 enzymes (P450s), a type of heme containing monoxygenase, are responsible for approximately 75% of all xenobiotic metabolisms along with the biotransformation of various steroids and hormones (Volak et al., 2008; Holm et al., 2015b). This type of metabolism is also called functionalization, as it involves the addition of functional groups to the substrate, which increases the compounds’ polarity and hydrophilicity. This functionalization also prepares the compound for conjugative, or Phase II metabolism, where even more polar modifications are made, such as the addition of glucose or sulfates. These glucuronidation or sulfation reactions result in a more hydrophilic molecule that various transporters can then excrete from the body (Volak et al., 2008; Chimalakonda et al., 2011; Sobolevsky et al., 2015; Presley et al., 2016).
In humans, 5F-AKB48 has been involved in both fatal and non-fatal toxicities, characterized by tachycardia, convulsions, agitation and hallucinations (Langford and Bolton, 2018, Abouchedid et al., 2016, 2017). A previous study found that 5F-AKB48 elicited dose-dependent cannabimimetic effects in CD-1 mice, which were more potent than those of Δ9-THC (Canazza et al., 2016). In rats, 5F-AKB48 elicited an increase in dopamine transmission within the nucleus accumbens shell (De Luca et al., 2016). This effect is often interpreted as a mechanism underlying abuse liability, although these studies did not determine whether CB1 receptors were involved. Previous studies demonstrated that metabolites of a range of structurally-diverse abused SCs retain biologically-relevant affinity for and efficacy at CB1 receptors (Brents et al., 2011, 2012; Hutchison et al., 2018; Wilson et al., 2019). However, the role of metabolism in cannabimimetic effects of 5F-AKB48 has not been previously assessed. Such studies are critically important in understanding the toxicity of this and related SCs, because genetic polymorphisms of P450 enzymes may result in the production of varying levels of biologically active metabolites in some individuals, perhaps offering a mechanistic explanation for the diverse clinical toxicities observed.
In this regard, previous studies have probed the metabolism of both AKB48 and its 5-fluoropentyl analogue, 5F-AKB48 (Uchiyama et al., 2013, Gandhi et al., 2013). Those studies mostly utilized human liver microsomes, hepatocytes, and some recombinant P450 enzymes, under different experimental conditions (Doerge et al., 2000; Gandhi et al., 2013; Vikingsson et al., 2015). Because there was a lack of consistency in previous methods and results, we were compelled to further characterize the enzymatic reactions involved in AKB48 and 5F-AKB48 metabolism with a large number of recombinant P450s and compare the data to literature findings. We have also assessed the affinity and efficacy of these compounds and some of their Phase I metabolites at CB1 receptors by performing competitive receptor binding and GTPγS assays. In vivo experiments comparing the cannabimimetic effects of 5F-AKB48 with those of Δ9-THC were performed in mice and the role of phase I metabolism in hypothermic effects of 5F-AKB48 was assessed using the broad spectrum CYP450 inhibitor 1-ABT. The present studies suggest that fluorination can alter the metabolism, pharmacodynamics, and/or effectiveness of SCs in vivo. Genetic polymorphisms of CYP3A5 and CYP2D6 could potentially increase the risk of toxicity in users. The effects observed from some SC users could be related to a genetic defect in P450 metabolism and results in adverse psychoactive and physiological effects including stroke, convulsions, and death (Schneir and Baumbacher, 2012; Holm et al., 2015a; Vucinic et al., 2018; Basavarajappa and Subbanna, 2019).
Materials and Methods
Materials
All chemicals used in this study were of at least reagent grade. AKB48 and 5F-ABK48 were obtained from the United States Drug Enforcement Administration and 4OH-5F-AKB48 was obtained from Cayman Chemical (Ann Arbor, MI). Δ9-THC was obtained from the NIDA Drug Supply Program (Bethesda, MD). Rimonabant was synthesized in the laboratory of Thomas E. Prisinzano, Ph.D., at the University of Kentucky, School of Pharmacy, Department of Medicinal Chemistry (Lexington, KY). GTPγS was purchased from EMD Chemical (Gibbstown, NJ). [3H]CP-55,940 (52.6 Ci/mmol) was acquired from PerkinElmer (Waltham, MA) and [35S]GTPγS (1250 Ci/mmol) was obtained from American Radiolabeled Chemicals (St. Louis, MO). All other reagents used were purchased from Thermofisher Scientific (Pittsburgh, PA). The NADPH regeneration system was purchased from Corning (Corning, NY). HLM (human liver microsomes), HIM (human intestinal microsomes), HKM (human kidney microsomes), genotyped HLM: CYP3A5*1*1, *1*3, *3*3, and CYP2D6*1*2, *17*28, *4*6, and recombinant P450s were purchased from Xenotech (Kansas City, KS). HBM (human brain microsomes) were purchased from BioreclamationIVT (Baltimore, MD).
Animals
Adult male C57BL/6 mice (Charles River Laboratory, Wilmington, MA) were housed three subjects per cage (15.2 x 25.4 x 12.7 cm3) in a temperature-controlled room at the University of Arkansas for Medical Sciences. Room conditions were maintained at an ambient temperature of 22 ± 2°C at 45–50% humidity. Lights were set to a 12-h light/dark cycle (lights on at 6:00 AM, CST). Animals were fed Lab Diet rodent chow (Laboratory Rodent Diet #5001, PMI Feeds, Inc., St. Louis, MO) and water ad libitum until immediately before testing, and all testing was performed during the inactive phase (8:00 AM to 4:00 PM).
All studies were performed in accordance with the Declaration of Helsinki and with the Guide for Care and Use of Laboratory Animals as adopted and promulgated by the National Institutes of Health. All animal protocols were approved by the Institutional Animal Care and Use Committee at the University of Arkansas for Medical Sciences, and all subjects were euthanized immediately after testing using methods consistent with American Veterinary Medical Association recommendations.
UHPLC and LC/MS Analysis
Chromatographic analyses via UHPLC were performed on a Water Acquity UHPLC system with a UV/Vis diode detector (Milford, MA) monitoring spectra at 300 nm, and 5 μl of each reaction was injected into an Acquity HPLC BEH C18 1.7 μM 2.1x50 mm column and monitored over a gradient for 9 min at 37°C. The mobile phases were 0.1% (v/v) acetic acid in water (A) and 100% methanol (B), and the flow rate was 0.5 ml/min with an elution gradient of 100% A (0-5 min), a linear gradient from 100% A to 50% A-50% B (5-6.2 min), and gradient to 75% A-25% B (6.2-8.7 min) before returning to 100% A (8.7-9 min). Retention times (RTs) of 5F-AKB48, monohydroxy 5F-AKB48 (5F-mono-OH), dihydroxy 5F-AKB48 (5F-di-OH), and trihydroxy 5F-AKB48 (5F-tri-OH) were 6.33 min, 5.00 min, and 4.64, and 4.23 min, respectively. Primary standards for all of the hydroxylated metabolites are not available; therefore, product concentrations were calculated using the external standard response for each substrate (Doerge et al., 2000; Gandhi et al., 2013).
Chromatographic analyses via LC/MS were performed via electrospray ionization and were used to interface the Acquity liquid chromatography system (Waters Corp., Milford, MA) to a Quattro Premier triple quadrupole mass spectrometer (Waters Corp.). Positive ions were generated using a cone voltage of 40 V. Product ions were generated using argon collision induced disassociation at a collision energy of 20 eV while maintaining a collision cell pressure of 1.2 x 10⁻³ torr. Detection was achieved using LC/MS scan from 300-600 m/z for parent ions and for fragmentation, a daughter scan was performed from 100-500 m/z (Gandhi et al., 2013).
Oxidative Metabolism of 5F-AKB48 Utilizing Various Human Microsomes
To determine the major metabolites produced via oxidative metabolism of 5F-AKB48, oxidation assays were conducted as described previously with slight modifications utilizing human microsomes from assorted tissues of 10 or 50 donor pools (HLM, HIM, HKM, and, HBM). Each reaction (final volume 30 μl contained the substrate (50 μM), potassium phosphate buffer (50 mM, pH 7.4), protein (1 μg/μl), and water. Reactions were started with the addition of a NADPH regeneration system (solution A: 20 mM NADP+, 60 mM glucose 6-phosphate, and 60 mM MgCl2; solution B: 100 U/ml glucose 6-phosphate dehydrogenase). Substrates were dissolved in methanol, and the final concentration of organic solvents in the reaction was less than 2%. Controls were included with each set of experiments (without incubation or NADPH). Reactions were incubated at 37°C for 60 min before being quenched with an equal volume of ice-cold ethanol. Reactions were centrifuged at 12,000g for 10 min, and the supernatants were transferred into HPLC vials for analysis. All reactions were performed in triplicate (Gandhi et al., 2013).
Sex Differences in the Oxidative Metabolism of 5F-AKB48
To determine any possible differences in metabolism caused by sex, 5F-AKB48 was incubated with HLM from both male and female pools. Reactions were incubated, quenched, and analyzed as described above. Reactions containing 5F-AKB48 (50 μM) and HLM (30 μg) were performed in triplicate, and controls were included with each set of experiments (without incubation or NADPH), and the results were compared to pooled HLM.
Oxidative Metabolism of 5F-AKB48 by Recombinant Human P450s
To determine which P450s are primarily responsible for the oxidative metabolism of 5F-AKB48, incubations were carried out using various recombinant human P450 enzymes (CYP1A2, -2A6, -2B6, -2C8, -2C19, -2D6, -2E1, -2J2, -3A4, and -3A5; 1 mg/ml). Reactions were performed as described above. Reactions were incubated at 37°C (0, 30, and 60 min). For the most active P450, additional assays were performed and incubated for shorter times (0, 5, 10, and 15 min).
Steady-state Kinetics Analysis of 5F-AKB48 by CYP2J2
The only P450 that produced one single product was CYP2J2 and steady-state kinetic analysis was carried out after the incubation conditions were optimized for time, substrate concentration, and protein concentration. Kinetic parameters were determined by incubating recombinant CYP2J2 (30 μg) in the presence of various concentrations of 5F-AKB48 (5–200 μM) for 10 min at 37°C. All reactions were performed within the linear range of metabolite formation with less than 5% of the substrate being consumed throughout the reaction.
Genetic Polymorphisms of CYP2D6 and CYP3A5 Affects the Oxidative Metabolism of 5F-AKB48
To investigate the role of genetic polymorphisms, 5F-AKB48 (50 μM) was incubated with genotyped HLM (30 μg) that possessed allelic variants of CYP2D6 and CYP3A5. These variants possessed high activity, CYP2D6*1*2 and CYP3A5*1*1, moderate activity, CYP2D6*17*29 and CYP3A5*1*1, or no activity, CYP2D6*4*6 and CYP3A5*3*3. Reactions were carried out as detailed above, and the reactions were incubated for the designated time points (0, 10, 20, 30, 45, 60, 90, and 120 min). Reactions, performed in triplicate, were incubated, quenched and analyzed as before. While CYP2J2 and CYP3A4 were also highly involved in the metabolism of 5F-AKB48, genotyped microsomes were not available for these enzymes.
Competition Receptor Binding
Increasing concentrations of Δ9-THC, 5F-AKB48 or 4OH-5F-AKB48 (0.01 nM – 10 μM) were incubated with 0.2 nM of the non-selective CB1/CB2 agonist [3H]CP-55,940 in a final volume of 1 mL of binding buffer (50 mM Tris, 0.05% bovine serum albumin, 5 mM of MgCl2, pH 7.4) as described previously (Brents et al., 2011). Each binding assay contained 50 μg of membrane protein prepared from whole brains harvested from male C57BL/6 mice. Reactions were incubated for 90 min at room temperature. Non-specific binding was defined as binding observed in the presence of 10 μM of the non-selective CB1/CB2 ligand WIN-55,212-2. Reactions were terminated by rapid vacuum filtration through Whatman GF/B glass fiber filters followed by three washes with ice-cold binding buffer. Filters were then immediately placed into scintillation vials with 4 ml of ScintiverseTM BD cocktail scintillation fluid (Fisher Scientific, Fair Lawn, NJ). Samples were incubated overnight in scintillation fluid, vortexed and bound reactivity determined by employing a liquid scintillation spectrophotometer (Tri Carb 2100 TR Liquid Scintillation Analyzer, Packard Instrument Company, Meriden, CT).
[35S]GTPγS Binding
All [35S]GTPγS assays were conducted as described previously (Brents et al., 2012) in buffer containing 20 mM HEPES, 100 mM NaCl, 10 mM MgCl2, 0.05% BSA, and 20 units/L of adenosine deaminase. Assays were performed in triplicate in a final volume of 1 ml with all reactions containing 0.1 nM [35S]GTPγS and Δ9-THC, 5F-AKB48 or 4OH-5F-AKB48 (0.1 nM – 10 μM) or drug vehicle, and 25 μg of membrane protein prepared from whole brains harvested from male C57BL/6 mice. Non-specific binding was defined by inclusion of 10 μM of non-radiolabeled GTPγS. Reactions were incubated at 30°C for 30 min and terminated by rapid vacuum filtration through Whatman GF/B glass fiber filters and followed by four 1 ml washes with ice-cold filtration buffer (20 mM HEPES, pH 7.4, 0.05% BSA). Filters were then immediately placed into scintillation vials with 4 ml of scintiverseTM BD cocktail scintillation fluid (Fisher Scientific, Fair Lawn, NJ). Samples were incubated overnight in scintillation fluid, vortexed and bound reactivity determined by employing a liquid scintillation spectrophotometer (Tri Carb 2100 TR Liquid Scintillation Analyzer, Packard Instrument Company, Meriden, CT).
Cannabinoid Tetrad
For each dose of each compound, one group of mice (n=8) were sequentially tested for hypothermia, antinociception and horizontal bar immobility (i.e., catalepsy). Hypothermia was measured using a rectal digital thermometer (model BAT-12, PhysiTemp, Clifton, NJ) equipped with a Ret-3 mouse probe (model 50314, Stoelting Co., Dale, IL). The lubricated probe was inserted approximately 2 cm into the rectum for approximately 6 sec prior to each recording. Antinociception was measured as tail flick latency using a water bath (Cole-Parmer StableTemp Digital Utility Water Bath, 2 or 5 L, 120V, 60 Hz, Vernon Hills, IL) filled with tap water and maintained at 50°C. The body of each subject was securely immobilized in the investigator’s hand while the tail was allowed to hang freely. The distal 5 cm of the tail was dipped into a bath containing 50°C water. The subject could remove its tail from the water at any point, and the amount of time the tails remained in the water was measured with a stopwatch. A maximal latency of 10 seconds was imposed to prevent tissue damage. Catalepsy was assessed using a horizontal bar apparatus, consisting of a cylindrical steel bar (0.5 cm in diameter) that was supported 4.0 cm above and horizontal to a Plexiglas platform, which was covered with a paper towel to provide better traction. To begin each test trial, a mouse was placed into a species-atypical position with its forelimbs on the horizontal bar and its hindlimbs on the platform, in such a way that the mouse assumed a rearing posture. Catalepsy was measured as the length of time each mouse maintained both forelimbs in an elevated position on the bar. Mice that remained immobile (with the exception of respiratory movements) were considered cataleptic. The maximum time allowed on the bar was 30 sec. In this manner, all three measures were sequentially obtained in this order, from each mouse used in these studies, at each timepoint. For locomotor studies, distinct subjects (n=8) were placed in clear acrylic chambers (43.2 x 43.2 x 29.8 cm3) fit within activity monitors (Med Associates Inc., St. Albans, VT) equipped with detectors sensitive to infrared light spaced 2.5 cm apart along two perpendicular walls. Mounted on the opposing walls and directed at the detectors were infrared light sources. One activity count was registered each time the subject interrupted a single light beam. White noise was present in the room throughout testing to mask extraneous sounds and ambient light was provided by overhead illumination of the laboratory room. Following injection and placement into the chambers, activity counts were totaled each 5 minutes over 180 min.
Radiotelemetry of Core Temperature
Surgical preparation and real-time data collection using biotelemetry probes were conducted as previously described (Gannon et al., 2016). In brief, the ventral surface of each subject was shaved and sterilized with iodine and alcohol swabs following anesthetization with inhaled isoflurane. A rostral-caudal cut approximately 1.5 cm in length was made with sterile skin scissors in order to access the intraperitoneal cavity. A cylindrical glass-encapsulated radiotelemetry probe (model ER-4000 E-Mitter; Mini Mitter Co., Inc., Bend, OR) was then inserted, and the incision was closed using 5-0 absorbable suture material on the muscle and surgical steel staples on the skin. Surgeries were carried out 7 days before initiation of each experiment, allowing time for incisions to heal. After surgery, all implanted mice were individually housed in 15.24 cm × 25.40 cm × 12.70 cm cages for the duration of all telemetry experiments. Implanted transmitters produced temperature-modulated signals that were sent to a receiver (model ER-4000 Receiver; Mini Mitter Co., Inc.) underneath each cage. Every 5 minutes, the computer collected data updates from the probes for core temperature readings (in degrees Celsius). After one day of baseline data collection, mice were injected with 100 mg/kg 1-ABT or its vehicle and then returned to the telemetry stage for 2 hours of data collection. All subjects then received 3.2 mg/kg 5F-AKB48, and core temperatures were recorded for 24 hours.
Data Analysis
Curve-fitting was conducted utilizing GraphPad Prism v6.0b (GraphPad Software, Inc.; San Diego, CA). Non-linear regression for one-site competition was used to determine the IC50 (half maximal inhibited concentration) values for competition receptor binding and EC50 (half maximal effective concentration) and Emax (maximal effective concentration) values for G protein activation studies. The Cheng-Prusoff equation (Cheng and Prusoff, 1973) was employed to convert the experimental IC50 values obtained from competition receptor binding experiments to Ki values (a quantitative measure of receptor affinity). All dissociation constants and measurements of potency were converted to pKi and pEC50 values by taking the negative log of each value so that parametric tests could be used for statistical comparisons. One-way ANOVA’s with Tukey’s HSD post-hoc test was used to compare pKi, pEC50 and Emax values for respective compounds. Endpoints for each component of cannabinoid tetrad were shown as mean values (±S.E.M.) for groups of subjects at each drug dose. For all analyses, P<0.05 was considered statistically significant, and were assessed by appropriate one-way or two-way repeated-measures analyses of variance (ANOVA). A post-hoc Bonferroni t-test was used for all pairwise comparisons. Dose–effect curves (DECs) for effects of interest were analyzed using standard linear regression techniques, from which ED50 values (50% effective dose for effects of interest) with 95% confidence limit (95%CL) values were calculated; only points on the linear part of the DECs were used. For locomotor activity studies, ED50 values were calculated based on % ratio from 0–100 minutes time point (at this time point, motor activity was negligible after vehicle injection). The effects of 1-ABT on hypothermia elicited by 5F-AKB48 were assessed using a paired t-test comparing the area under the curve in each drug group. Areas under the curve for the hypothermic effects of 5F-AKB48, with and without 1-ABT pretreatment, were calculated by plotting mean time-effect functions (without points or error bars), importing these figures into Adobe Photoshop (version 7), selecting the entire area where temperature dipped below 36°C with the magic wand tool (with the tolerance set at 50), and then determining the number of pixels present in the area using the histogram function (Wilson et al., 2019).
Statistical Analysis
Statistical analyses were calculated using the Analysis of Variants (ANOVA) model with triplicate datasets to determine the relevance of statistically significant differences between the conditions for the presented information. Kinetic parameters were estimated from fitted curves conducted by GraphPad Prism® v4.0b (GraphPad Software, Inc.; San Diego, CA). Kinetic curves were also analyzed as Eadie-Hofstee plots to support kinetic models and were reported as the mean ± standard error of triplicate experiments. Kinetic constants were obtained by fitting experimental data to kinetic models using the non-linear regression (Curve Fit) function by assessing the standard error, 95% confidence intervals, and R2 values for each model. The Michaelis-Menten equation, V = Vmax • [S]/ (Km + [S]), was used to calculate Km and Vmax values, where V was the velocity of the reaction, S was the substrate concentration, Km was the Michaelis-Menten constant, and Vmax was the maximum velocity (Diao et al., 2017).
Results
LC/MS Data
MS analyses were performed on reactions containing 50 μM 5F-AKB48 and HLM that were incubated for 90 min. These analyses were performed by scanning between 300-600 m/z and were used to confirm the existence of the primary metabolites and their structures. Six species that possessed hydroxyl groups were identified and this finding was consistent with previous studies (Gandhi et al., 2013; Vikingsson et al., 2015). The most abundant metabolite was a 5F-di-OH, followed by 5F-mono-OH derivative with the third metabolite being 5F-tri-OH. All hydroxyl groups were attached to the adamantyl cage, and the terminal fluorine on the pentyl chain was present. The other three species identified in this experiment were mono-, di-, and trihydroxylated, but they had all undergone oxidative defluorination on the pentyl terminus. The scheme of the hydroxylated metabolism and the structures of fluorinated hydroxylated products are shown in (Figure 1). Interestingly, in addition to the fluorinated compounds, we identified two metabolites (di-OH and tri-OH) where the fluorine group had been replaced with a hydroxyl group. The version of 5F-tri-OH possessing trihydroxylations on the adamantyl cage was only reported in our studies in incubations with HLM. Another derivative of 5F-tri-OH possessed two hydroxyl groups on the adamantyl cage and a monohydroxylation on the N-fluoropentylindazole moiety. This was reported in both urine samples and in HLM incubations, but both derivatives co-eluted and were therefore impossible to quantify separately (Figure 2 A & B; Table 1).
Figure 1. A Postulated Pathway for the Oxidative Metabolism of the Fluorinated Analog of AKB48: 5F-AKB48.
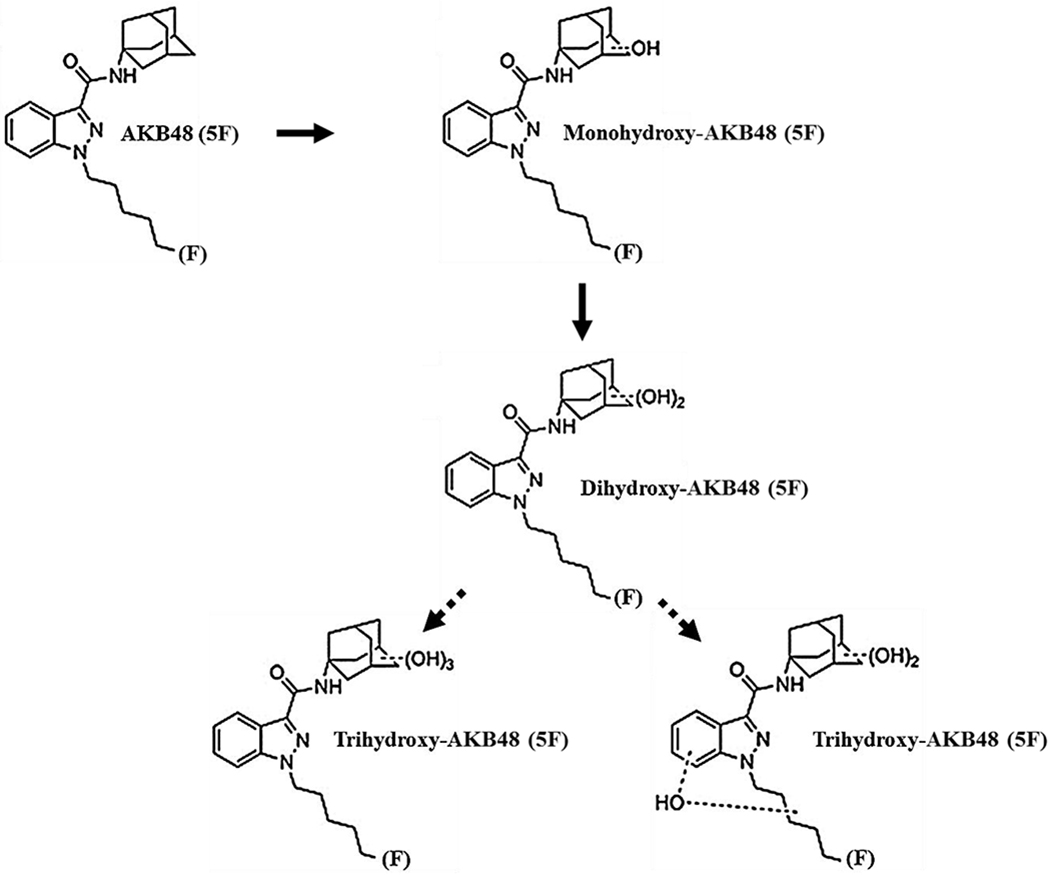
When AKB48, a 3rd generation SC, was oxidatively metabolized by P450s for 60 min, it produced a variety of metabolites, primarily di- and trihydroxylated ones in addition to monohydroxylated metabolites. The oxidative metabolism of 5F-AKB48, its fluorinated analogue, also appeared to be sequential resulting in abundant dihydroxylated metabolites and 2 forms of the trihydroxylated one when incubated with HLMs and decreasing amounts of 5F-mono-OH. According to the literature, the distribution of the hydroxyl groups was most abundant when located on both the adamantyl cage and the pentyl chain. Comparatively, our reactions contained more defluorinated metabolites, which surprisingly, were not found in reactions that had contained the nonfluorinated compound.
Figure 2.
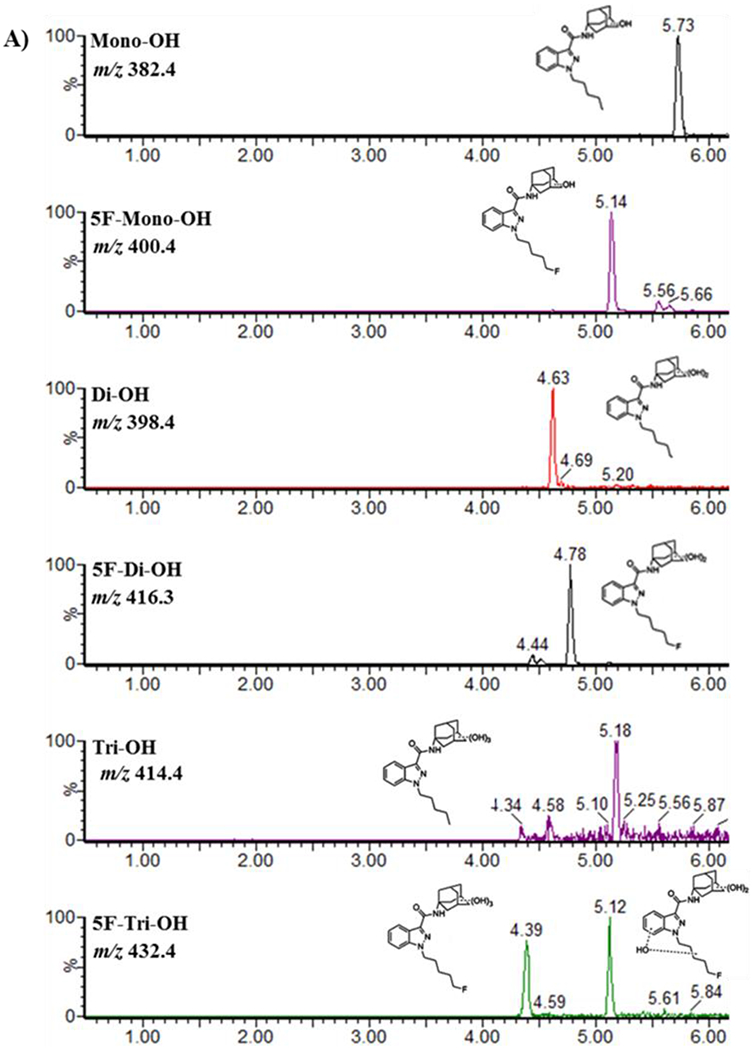
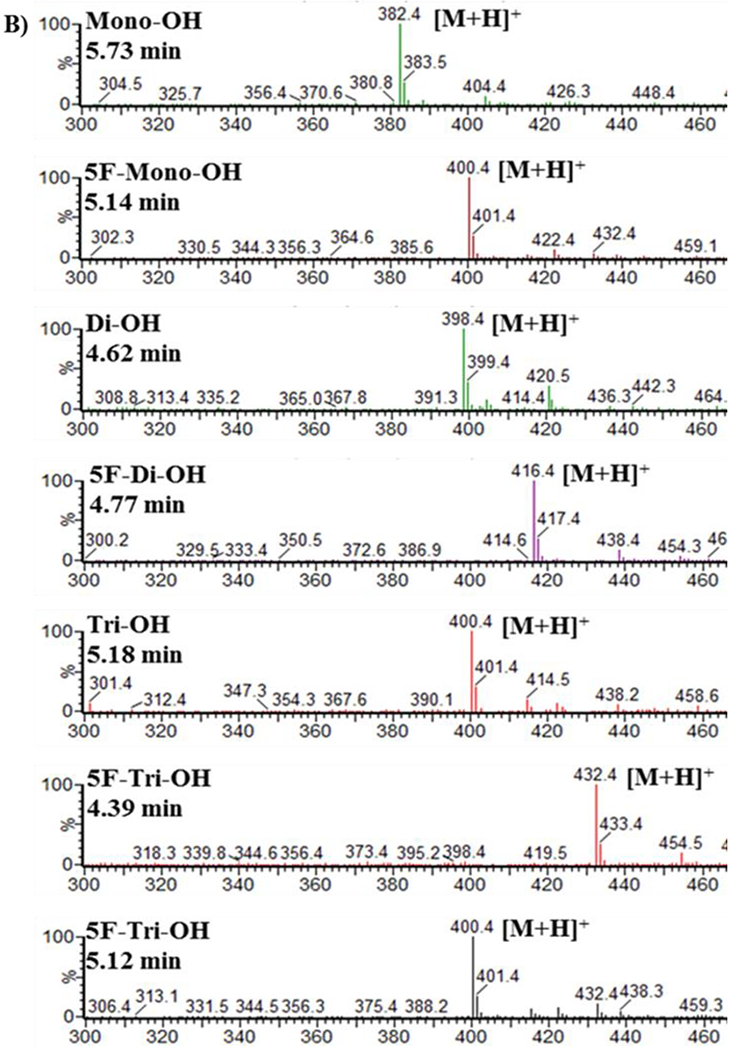
Sample chromatogram (A) and MS spectra (B) from a Quattro Premier triple quadrupole mass spectrometer of 5F-AKB48 and its primary metabolites after incubation with HLMs.
Table 1.
Fragment RT and m/z values for LC/MS.
| Species | Fragments | Retention Time (min) | Mass to Charge Ratio (m/z) |
|---|---|---|---|
| 5F-AKB48 | 6.70 | ||
| 5F-Mono-OH | (2) | 5.14 | 400.4 |
| 1 | |||
| 2 | |||
| 5F-Di-OH | (4) | 4.83 | 416.4 |
| 1 | 233.1 | ||
| 2 | 167.0 | ||
| 3 | 149.1 | ||
| 4 | 131.0 | ||
| 5F-Tri-OH | (3) | 4.14 | 432.4 |
| 1 | 248.9 | ||
| 2 | 167.1 | ||
| 3 | 149.0 | ||
| (3) | 4.46 | 432.4 | |
| 1 | 250.3 | ||
| 2 | 233.1 | ||
| 3 | 182.1 | ||
| Mono-OH | (1) | 5.72 | 382.4 |
| 1 | 135.0 | ||
| Di-OH | (2) | 4.63 | 398.4 |
| 1 | 151.1 | ||
| 2 | 133.0 | ||
| Tri-OH | (5) | 4.20 | 414.4 |
| 1 | 248.0 | ||
| 2 | 230.0 | ||
| 3 | 167.0 | ||
| 4 | 149.0 | ||
| 5 | 131.0 |
The peaks from extracted ion chromatograms were used to obtain MS spectra (Figure 2 A & B) and provided the retention times and mass-to-charge ratios for the hydroxylated metabolites of 5F-AKB48 (Table 1). The detailed fragmentation of each individual compound is presented in supplemental figures. The hydroxyl group in 5F-mono-OH, m/z 400.4 RT 5.14 min, was found on the adamantyl cage. The first fragment, m/z 151, likely formed through simple inductive cleavage, and the other fragment, m/z 133, was formed through the subsequent loss of water, showed that the hydroxyl group was not on the pentyl chain like mono-OH but on the adamantyl cage. The fragments of 5F-di-OH, m/z 416.4 RT 4.83 min, had m/z 233.1, 167.0, 149.1, and 131.0. The first fragment, m/z 233.1, was formed through simple inductive cleavage, and the remaining fragments were formed through losing water from both hydroxyl groups. This indicated that no hydroxyl groups were on the pentyl chain but were on the adamantyl cage. There were two possibilities for 5F-tri-OH, m/z 432.4 RT 4.14 min and 4.46 min. The first possibility had fragments at m/z 248.9, 167.1, and 149.0. The fragment at m/z 248.9 was formed through simple inductive cleavage and showed that one hydroxyl group was on the pentyl chain. The fragment at m/z 167.1 was also formed through simple inductive cleavage, and the one at m/z 149.0 was formed through the subsequent loss of water from the m/z 167.1 fragment, which showed that the other 2-hydroxyl groups were found on the adamantyl cage. The other possibility had fragments of m/z 250.3, 233.1, and 182.1. The m/z 250.3 fragment was formed through simple inductive cleavage, and subsequently, the loss of NH3 formed m/z 233.1, which showed that there were not any hydroxyl groups on the pentyl chain. The fragment at m/z 182.1 was formed from the neutral loss by radical fragmentation of the formed double bond (Figure 2 A & B; Table 1) (Gandhi et al., 2013; Vikingsson et al., 2015).
The hydroxyl group of mono-OH, m/z 382.4 RT 5.72 min, was found to be on the pentyl chain; simple inductive cleavage resulted in an m/z 135 and indicated that the pentyl chain was the location of the hydroxyl group di-OH, m/z 398.4 RT 4.63 min, had two fragments, m/z 151.1 and 133.0. The fragment at m/z 151.1 was formed through simple inductive cleavage, and the subsequent loss of water yielded a fragment at m/z 133.0, which indicated the presence of one hydroxyl group on its pentyl chain. Tri-OH was dihydroxylated on the adamantyl cage and monohydroxylated on the pentyl chain. The parent mass, m/z 414.4 RT 4.20 min, had products ions of m/z 248.0, 230.0, 167.0, 149.0, and 131.0. The first fragment, m/z 248, was formed through simple inductive cleavage; loss of water changed the ratio to m/z 230. The other fragment began with 2 hydroxyl groups, m/z 167, was also formed through simple inductive cleavage, and by losing water via the 2 hydroxyl groups, yielded the fragments m/z 149.0, and m/z 131.0 (Figure 2 A & B; Table 1) in agreement with data presented by (Gandhi et al., 2013; Vikingsson et al., 2015).
Multiple Microsomes Show Evidence of Oxidative Metabolism of 5F-AKB48
Reactions were incubated with HLM and analyzed by LC/MS or UHPLC UV/Vis and have shown that 5F-AKB48 underwent mostly hydroxylation. Furthermore, the analysis confirmed that the primary metabolites were 5F-mono-OH, 5F-di-OH, and 5F-tri-OH derivatives with retention time of 6.33 min, 5.00 min, 4.64 min, and 4.23 min, respectively as it was reported previously (Gandhi et al., 2013; Vikingsson et al., 2015). Reactions favored metabolites possessing a hydroxyl group on both the adamantyl cage and the pentyl chain. The control reactions, lacking the essential cofactor NADPH, formed one species that had undergone oxidative defluorination and hydroxylation of the terminus of the pentyl chain. This compound was not further analyzed. Defluorination of these metabolites only occurred in reactions containing HLM in agreement with the data presented in the literature (Gandhi et al., 2013; Sobolevsky et al., 2015; Vikingsson et al., 2015; Presley et al., 2016). There were two versions of the trihydroxylated metabolites; however, due to their co-elution, they could not be separated, so these two versions were added together for analysis (Figure 2 A & B).
Figure 3 shows specific activity of hydroxylated metabolites analyzed by MS. In panel A, amounts of defluorinated compounds were reported, while panel B shows specific activities of fluorinated oxidative metabolites (Figure 3 A & B; Table 1). Standard, mixed gender HLM produced the highest amount of mono-, di-, and trihydroxylated metabolites of 5F-AKB48 (Figure 3 B; Table 1). Microsomes from the intestine also showed a significant amount of activity towards the SC, producing noticeable amounts of the mono- and dihydroxylated metabolites. However, they did not produce any 5F-tri-OH, and HKM generated only a small amount of 5F-mono-OH (Figure 3; Table 1). HBM, under experimental conditions, did not show any activity toward 5F-AKB48.
Figure 3. Oxidative Metabolism of 5F-AKB48 by Assorted Tissues in Human Microsomes and the Difference between the Sexes.
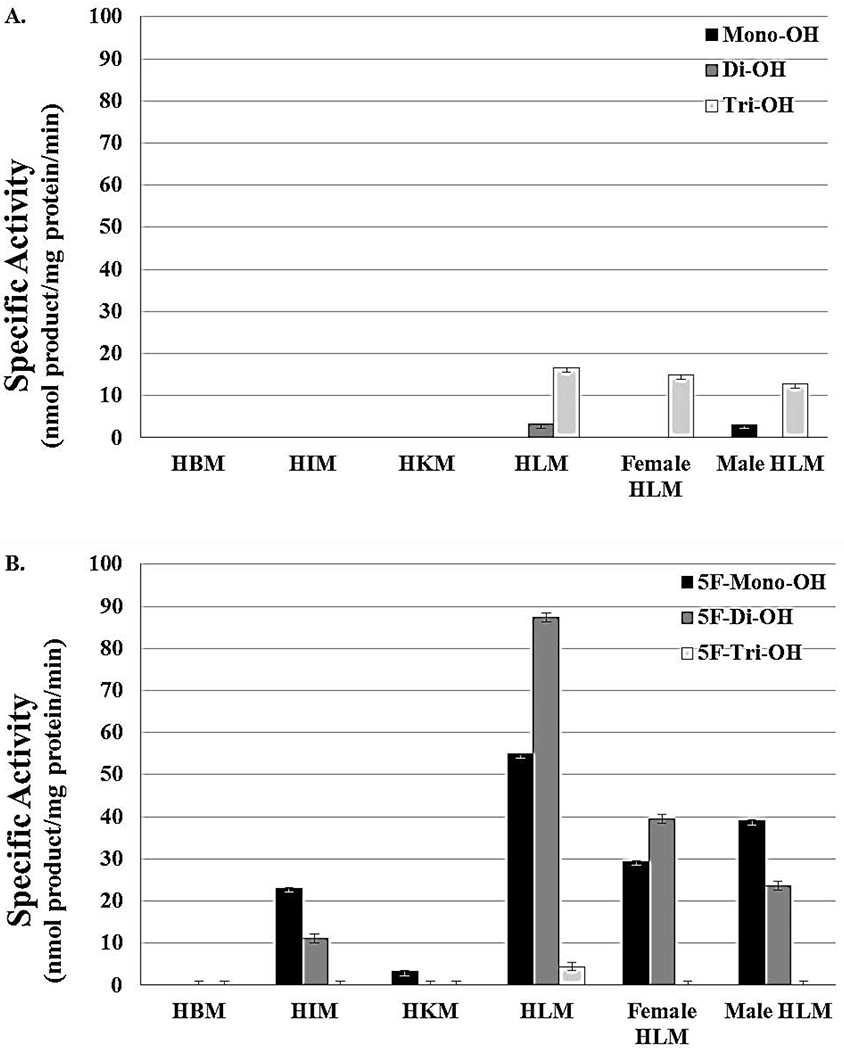
A comparison of the specific activity of microsomes from various tissues as well as the different sexes after the oxidative metabolism of 5F-AKB48. The primary site of oxidative metabolism was the liver, as expected, although the intestines do play a significant role in the metabolism of this SC. The brain does not appear to exhibit any metabolic activity towards 5F-AKB48, and the kidneys showed only a small amount of 5F-mono-OH. While men and women express comparable amounts of these enzymes, the metabolic profiles are different. In fact, only the nonfluorinated version of the trihydroxylated metabolite was found. Women predominantly formed 5F-di-OH at a level comparable to men’s 5F-Mono-OH. The activities for women were less for the 5F-mono-OH and then the 5F-Tri-OH. For men, activities decreased for the 5F-di-OH and then the 5F-Tri-OH. Reactions were done for at least 3 replications +/− SD that was normalized for protein activity, and results were analyzed by ANOVA.
The comparison of the specific activity between female and male HLM showed that in both cases only F-mono and dihydroxylated compounds were produced (Figure 3 B). The amounts of different fluorinated compounds were small with di-OH being the most produced compound in the female HLM and mono-OH producing the most in male HLM. As seen in the literature, monohydroxylated metabolites formed significant amounts in incubations with shorter times. However, after reactions had incubated for 30 min or more, the quantities of 5F-di-OH and 5F-tri-OH began to increase in such a fashion to suggest that the compound was having hydroxyl groups added in a sequential fashion. Dihydroxylated metabolites, in the literature as well as these assays, were always the most prominent metabolites followed by the trihydroxylated ones. While expression levels of P450s or their tissue distributions do not differ greatly between the sexes, there are numerous examples of differences in drug metabolism between males and females including usage, metabolite profiles, quantity of metabolites, and susceptibility to toxic and adverse effects.
Oxidative Metabolism of 5F-AKB48 by Recombinant Human P450s
To identify which human P450 are involved in the metabolism of 5F-AKB48 and its significance, 50 μM of the SC was incubated with 11 bactosome-expressed recombinant human P450s (1 mg/ml). The incubations were carried out for 1 hour and the resulting metabolites were quantified, normalized using the external standard response, and their specific activities (nmol product/mg protein/min) are shown in Figure 4. Of the screened isoforms, CYP1A2, -2A6, -2B6, -2C8, -2C9, and -2C19 all showed negligible amounts of activity in the biosynthesis of 5F-mono-OH and none towards 5F-di-OH or 5F-tri-OH. CYP2E1 did not produce any detectable metabolites. CYP2D6 showed notable amounts of activity towards 5F-mono-OH, (590.41 ± 7.07 nmol product/mg protein/min); however, only a negligible amount of activity for 5F-di-OH was observed, (22.36 ± 0.47 nmol product/mg protein/min), respectively. Incubations with CYP2J2 produced both mono- and dihydroxylated metabolites, but no trihydroxylated ones; however, the activity was approximately 2 times the amount for 5F-mono-OH as 5F-di-OH, (1679.41 ± 1.34 and 735.43 ± 1.62 nmol product/mg protein/min), respectively, unlike the other protein sources.
Figure 4. Oxidative Metabolism of 5F-AKB48 by Recombinant Human P450s Primarily Results in the Formation of 3 Hydroxylated Metabolites: 5F-mono-OH, 5F-di-OH, and 5F-tri-OH.
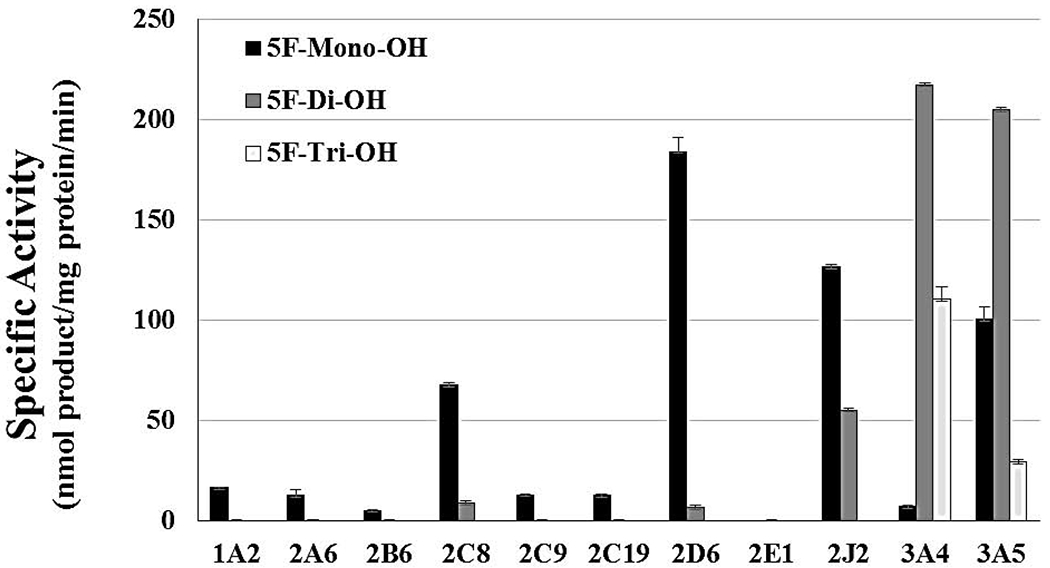
CYP2D6, -2J2, - 3A4, and -3A5 exhibited the highest amount of activity towards 5F-AKB48, especially 5F-di-OH. CYP3A4/5 seem to be primarily responsible for its oxidative metabolism, showing the highest values of the specific activity. CYP1A2, -2A6, -2B6, -2C9, and -2C19 all showed negligible activity towards 5F-mono-OH and none towards the formation of 5F-di-OH, while CYP2E1 did not produce any detectable metabolites. CYP2D6 showed notable activity towards the formation of monohydroxylated metabolites. However, only a negligible amount of 5F-di-OH was observed. Incubations with CYP2J2 produced approximately 2 times the amount of 5F-Mono-OH as 5F-di-OH. Reactions incubated for less than 30 min showed mostly 5F-mono-OH whereas reactions that were allowed to incubate for more than 30 min favored the formation of 5F-di-OH and 5F-tri-OH where products appeared to favor placement on both the adamantyl cage and the pentyl chain. Reactions were performed for at least 3 replications +/− SD that was normalized for protein activity, and results were analyzed by ANOVA.
The highest activities in the biosynthesis of hydroxylated metabolites of 5F-AKB48 were observed for human CYP3A4 and CYP3A5. CYP3A4 biosynthesized mostly 5F-di-OH, (648.78 ± 5.41 nmol product/mg protein/min) and 5F-tri-OH, (328.79 ± 6.07 nmol product/mg protein/min). On the other hand, CYP3A5 exhibited two-fold the activity for 5F-Di-OH as 5F-mono-OH, (1975.32 ± 5.52) and (967.78 ± 6.25 nmol product/mg protein/min) respectively, and it also showed activity in the formation of 5F-tri-OH, (285.92 ± 0.75 nmol product/mg protein/min). Previously published studies (Holm et al., 2015a) reported the same observation with the nonfluorinated analog AKB48 in their experiments with the two P450s. CYP3A4/5 appear to be the enzymes that are primarily responsible for the oxidative metabolism of 5-AKB48.
We attempted several approaches to determine the kinetics for some of the P450 such as CYP2D6, -2J2, and -3A4 (data not shown). In those experiments, 5F-AKB48 was incubated for various time intervals (0, 5, 10, and 15 min). CYP3A4, as expected, exhibited the highest activity towards 5F-di-OH. Since multiple products were produced, the data was inconsistent and is not reported here. CYP2D6 only showed activity exclusively in the formation of 5-mono-OH towards 5F-mono-OH, and it did so at a very gradual rate. At 15 min, there was only about (40 nmol product/mg protein/min).
As the enzymatic reactions proceeded, increasing time appeared to correlate with an increasing number of hydroxyl groups being added to the compound. Reactions under 30 min typically resulted in a majority of 5F-mono-OH, but as time increased beyond 30 min, the levels of first 5F-di-OH and then 5F-tri-OH began to increase. Positioning of the hydroxyl group appeared to favor placement on both the adamantyl cage and the pentyl chain, which corresponded to what was found in the literature. However, a point of difference was that incubations from this study produced a higher amount of the defluorinated, hydroxylated metabolites than those observed in other studies.
Steady-state Kinetics Analysis with CYP2J2 for 5F-AKB48
Based on the results of this screening, we utilized CYP2J2 for further kinetics investigations to determine its steady-state parameters for oxidative metabolism. As commercial reference standards were unavailable, reactions were incubated for 10 min with CYP2J2, which provided only one peak. The kinetic constants for this enzyme were analyzed, and the kinetic profile followed classical Michaelis-Menten kinetics (data not shown). Analysis with CYP2J2 resulted in a Km approximately 15 nmoles/mg protein/min. This value indicated a more moderate affinity of the enzyme for the substrate, which was supported by its observed activity level and types of metabolites produced.
Oxidative Assays with the Genotype Microsomes of CYP3A5 and CYP2D6
In this series of experiments, genotype human microsomes of CYP3A5*1*1, *1*3, *3*3 were used in oxidative reactions of 5F-AKB48 (Figure 5 A, B, & C). In HLM containing the isoform of CYP3A5 with the highest activity, which was considered the normal level, the monohydroxylated metabolite did not appear until after 10 min of incubation. The amount of 5F-mono-OH rose and fell gently as time passed with values ranging from (0, 0, 812.31, 1021.93, 1606.63, 1302.56, to 1826.78 nmol product/mg protein). Additionally, the overall amount increased somewhat as the incubation progressed. The 5F-di-OH metabolite did not appear until the reaction had progressed to 20 min, and then the amount rose steeply, ranging from (0, 0, 766.60, 1406.23, 2163.82, to 2940.04 nmol product/mg protein). The 5F-tri-OH metabolites first appeared at the 0 min time point. Over the course of the assay, the amounts of these metabolites slowly increased, ranging from (1688.83, 1776.79, 1832.27, 1755.88, 1924.12, to 2115.27 nmol product/mg protein). This pattern suggests multiple possibilities. First, the trihydroxylation could occur simultaneously by the same enzyme or by other enzymes in close proximity to the parent compound. A second possibility is that this substrate still undergoes serial hydroxylation, but that it happens within seconds, which results in the formation of trihydroxylated metabolite without the standard mono- and dihydroxy ones. Overall, these reactions resulted in the largest amounts of 5F-Di-OH being produced in the latter parts of the time course, 45 and 60 min, and 5F-Tri-OH being the primarily produced enzyme till 5F-Di-OH overtook it at the 45 60 min mark.
Figure 5. Lack of Activity in Genetic Polymorphisms of CYP3A5 and CYP2D6 Could Potentially Increase the Risk of Toxicity in Users.
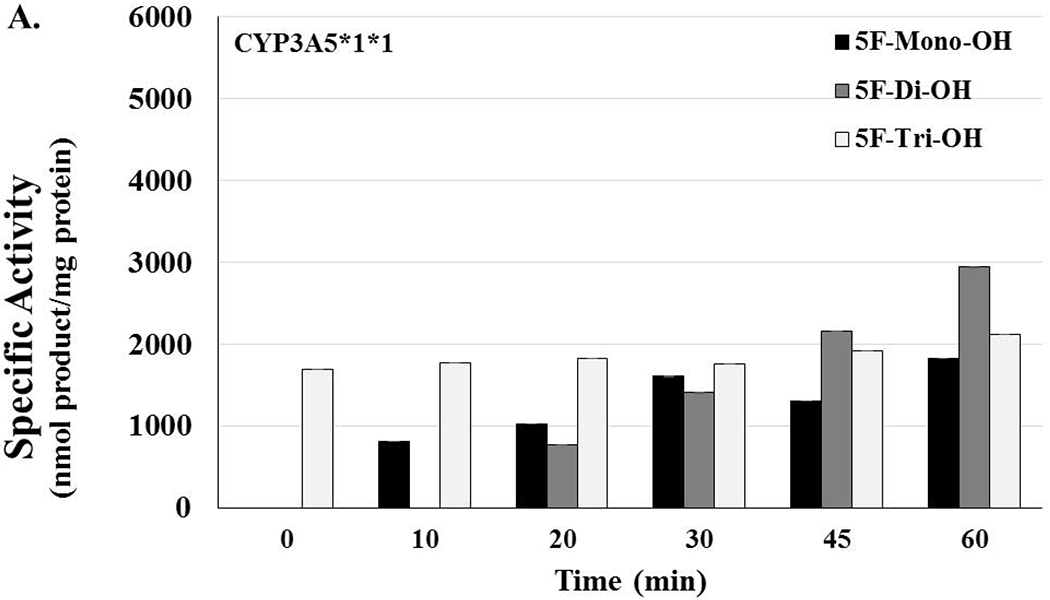
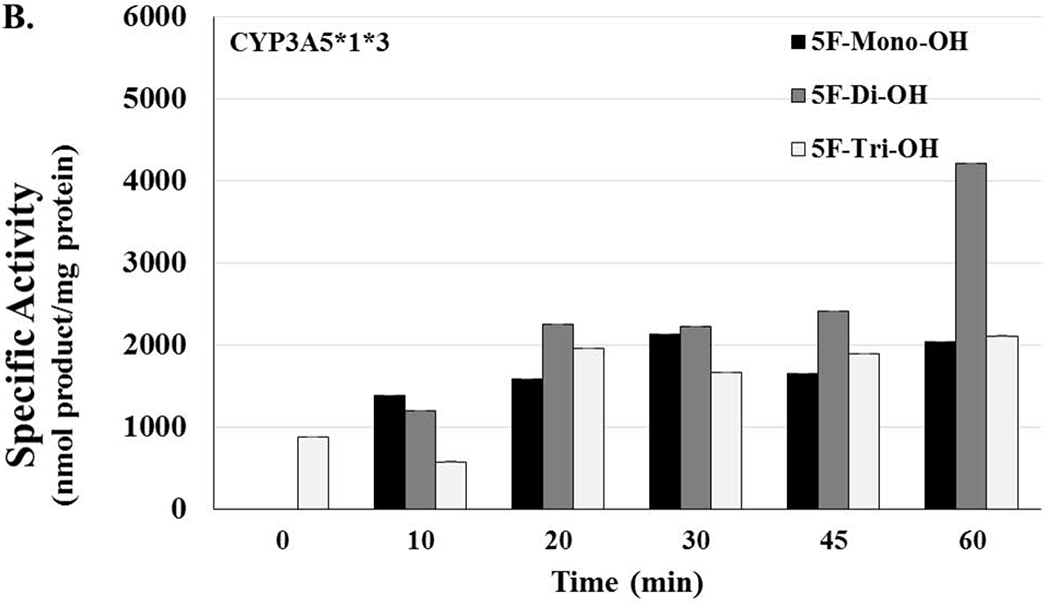
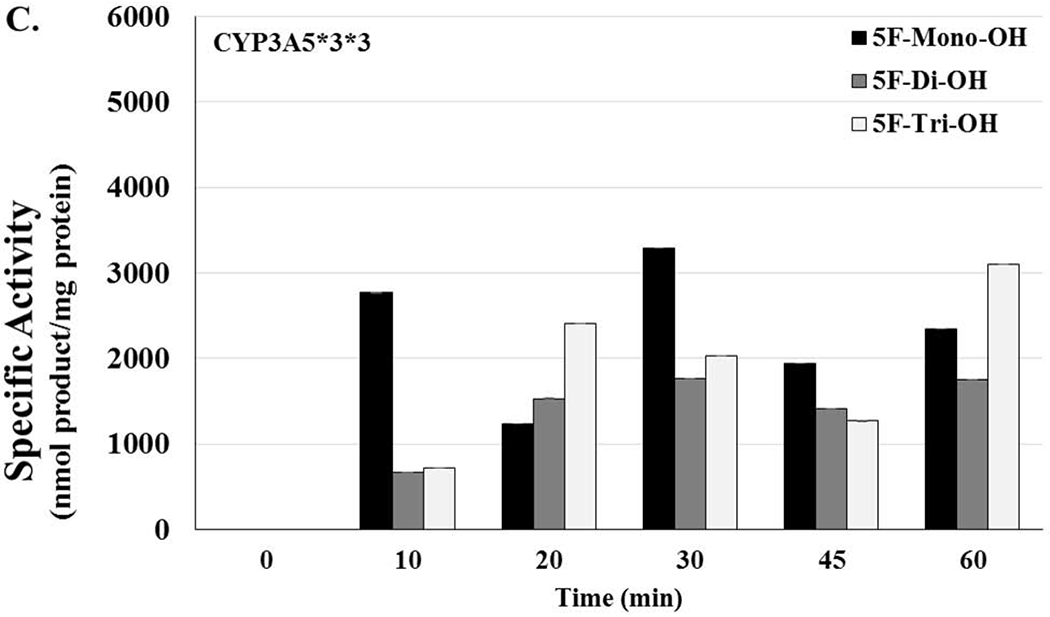
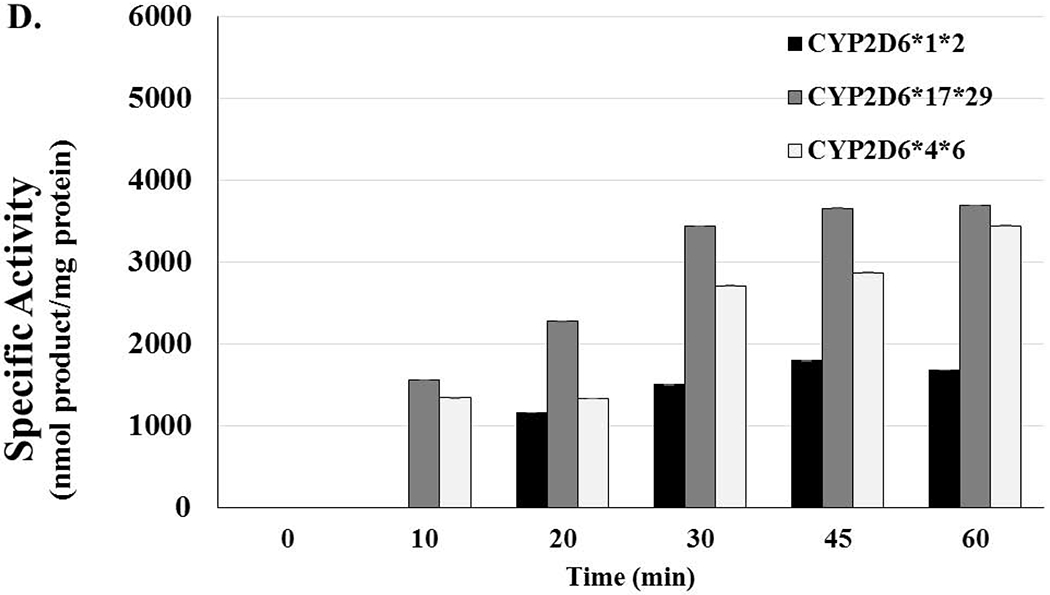
[A] CYP3A5*1*1 HLMs are considered to have high activity and represent what is considered to be the normal genotype. Activity levels related to 5F-mono-OH rose and fell as the time of the reactions increased; activity levels for 5F-di-OH significantly increased over the course of the assay, but the activity levels for 5f-Tri-OH activity levels barely increased over the course of the assay. [B] The reactions showing the activity levels related to the CYP3A5*1*3, an HLM with moderate activity. Activity levels related to 5F-mono-OH rose and fell more steeply than before; activity levels for 5F-di-OH increased even more, but the activity levels for 5f-Tri-OH activity levels increased slowly before plateauing off for the rest over the course of the assay. [C] The reactions showing the activity levels related to the CYP3A5*3*3, an HLM with no activity. Activity levels related to 5F-mono-OH rose and fell very steeply for the course of the assay; activity levels for 5F-di-OH rose and fell more moderately, but the activity levels for 5f-Tri-OH activity levels rose and fell significantly over the course of the assay. [D] The reactions showing the activity levels related to the CYP2D6*1*2 an HLM with high activity. Activity levels related to 5F-mono-OH rose and fell as the time of the reactions increased; activity levels for 5F-Di-OH significantly increased over the course of the assay, but the activity levels for 5f-Tri-OH activity levels barely increased over the course of the assay. The reactions showing the activity levels related to the CYP2D6*17*29, an HLM with moderate activity. Activity levels related to 5F-mono-OH rose and fell as the time of the reactions increased; activity levels for 5F-Di-OH significantly rose and fell over the course of the assay, but the activity levels for 5F-Tri-OH activity levels barely increased over the course of the assay. The reactions related to the CYP2D6*4*6 HLMs were characterized to have no activity. Activity levels related to 5F-mono-OH rose and fell slightly as the time of the reactions increased; activity levels for 5F-di-OH significantly increased over the course of the assay before leveling off, and the activity levels for 5F-Tri-OH increased steadily over the course of the assay. Reactions were performed for at least three replications +/− SD that was normalized for protein activity, and results were analyzed by ANOVA.
For HLMs containing the isoform of CYP3 A5 possessing the middle level of activity, the monohydroxylated metabolite again did not appear until after 10 min of incubation, and the amount of 5F-mono-OH rose and fell more as time passed with values ranging from 0, 1382.48, 1581.32, 2124.81, 1653.7, to 2039.57 nmol product/mg protein. Additionally, the overall amount increased somewhat as the incubation progressed. For HLMs possessing the highest activity, the 5F-Di-OH metabolite did not appear until the reaction had progressed to 20 min, and then the amount rose steeply, ranging from 0, 1199.86, 2250.87, 2227.31, 2405.12, to 4213.24 nmol product/mg protein. The 5F-Tri-OH metabolites first appeared at the 0 min time point; over the course of the assay, the amounts of these metabolites slowly increased, ranging from 874.24, 574.30, 1954.69, 1666.08, 1884.38, to 2108.38 nmol product/mg protein. The steepness found in these fluctuations grew more steeply as the activity level decreased from high to moderate. 5F-Tri-OH was produced inconsistently and it appeared at 0 min with a quick drop at 10 min. Just as quickly, it reached its highest level, but its level never really changed with any real significance again.
For the HLMs with an isoform that didn’t contain any activity for the CYP3 A5, the monohydroxylated metabolite again did not appear until after 10 min of incubation, and the amount of 5F-mono-OH rose and fell more as time passed with values ranging from 0, 2768.63, 1233.42, 3296.78, 1947.52, 2342.19 nmol product/mg protein. Additionally, the overall amount increased somewhat as the incubation progressed. For HLMs possessing the highest activity, the 5F-di-OH metabolite did not appear until the reaction had progressed to 20 min, and then, the amount rose steeply, ranging from 0, 665.34, 1532.09, 1762.77, 1411.03, 1753.480583 nmol product/mg protein. The 5F-Tri-OH metabolites first appeared at the 0 min time point. Over the course of the assay, the amounts of these metabolites slowly increased.. The 5F-mono-OH increased with a range off 0. 720.10, 2411.69, 2030.11, 1268.27, to 3099.384583 nmol product/mg protein. The 5F-dio-OH showed 0, 665.34, 1532.09, 1762.77, 1411.04, to 1753.48 nmol product/mg protein whereas the 5F-Tri-OH had a span of 0, 720.099, 2411.69, 2030.11, 1268.27 to 3099.38 nmol product/mg protein. The 5F-mono-OH rose and fell much more steeply while the 5F-di-OH had a more moderate pattern. The trihydroxylated metabolite was more in the middle this time.
Unlike CYP3A5, the polymorphisms of CYP2D6 only produced 5F-mono-OH, and as with the high and middle activity for CYP3A5, there were no metabolites produced during the first 10 min of the incubation (Figure 5 D). In fact, 5F-mono-OH was not visible until the 20 min mark for the isoform with the highest activity. The isoforms with middle and no activity began producing the monohydroxylated metabolite at the 10 min mark, the amount of the metabolite produced increased as the time increased, and then eventually levelled off. Genetic polymorphisms in drug-metabolizing enzymes like CYP2D6 and CYP3A5 allowed for the analysis of genotyped microsomes (CYP2D6*1*2, *17*29, *4*6 or CYP3A5*1*1, n*3, *3*3) that exhibited high (normal), medium, or no levels of activity, respectively. Genetic polymorphisms in these enzymes allowed for investigations into how the different levels of activity, which are found in various cultures or races, affected the oxidative metabolism of 5F-AKB48. We observed that CYP2D6 is producing twice as much 5F-mono-OH as CYP3A5, less than 1/100th of 5F-di-OH and 25 times less, or no, 5F-tri-OH when compared to CYP3A5. Unlike the genetic polymorphisms of CYP2C9 that played a large role in the oxidative metabolism of the first generation SC JWH-018, loss of activity for these two P450s did not result in an as large of a decrease in metabolite production as was expected, possibly due to other enzymes like CYP3A4 making up the difference. While, the various activity levels for these enzymes were found to have produced differing amounts of each metabolite. There was not much difference between the activity levels of each enzyme towards the various metabolites as time progressed.
CB1 Receptor Affinity: Competition Receptor Binding
Saturation binding with the CB1/CB2 cannabinoid receptor radioligand [3H]CP-55,940 in our laboratory has previously demonstrated that mouse brain homogenates contain a CB1R density of 2.44 ± 0.15 pmole/mg protein, to which [3H]CP-55,940 binds with an affinity (Kd) of 0.37 ± 0.07 nM (Brents et al., 2011). Δ9-THC (filled circles), 5F-AKB48 (filled squares) or 40H-5F-AKB48 (filled triangles) produce concentration-dependent and complete displacement of [3H]CP-55,940 from CB1 receptors expressed in mouse brain with apparent affinities (Ki) of 14.2 nM (pKi = 7.847 +/− 0.12; N=3), 0.68 nM (pKi = 9.177 +/− 0.062; N=3) and 19.4 nM (pKi = 7.718 +/− 0.053; N=3), respectively (Figure 6A). Based on these values, Δ9-THC, 5F-AKB48 and 40H-5F-AKB48 all bind to CB1 receptors with high affinity in the nM range, with a rank order of affinity of 5F-AKB48 >> Δ9-THC = 4OH-5F-AKB48 (P<0.05). Importantly, although the affinity of the Phase I metabolite of 5F-AKB48 (4OH-5F-AKB40) is reduced by approximately 29-fold when compared to that of the parent drug, this metabolite nevertheless retains significantly high CB1 receptor affinity, comparable to that of Δ9-THC.
Figure 6: Comparison of affinity and activity of cannabinoids Δ9-THC, 5F-AKB48 and 4OH-5F-AKB48.
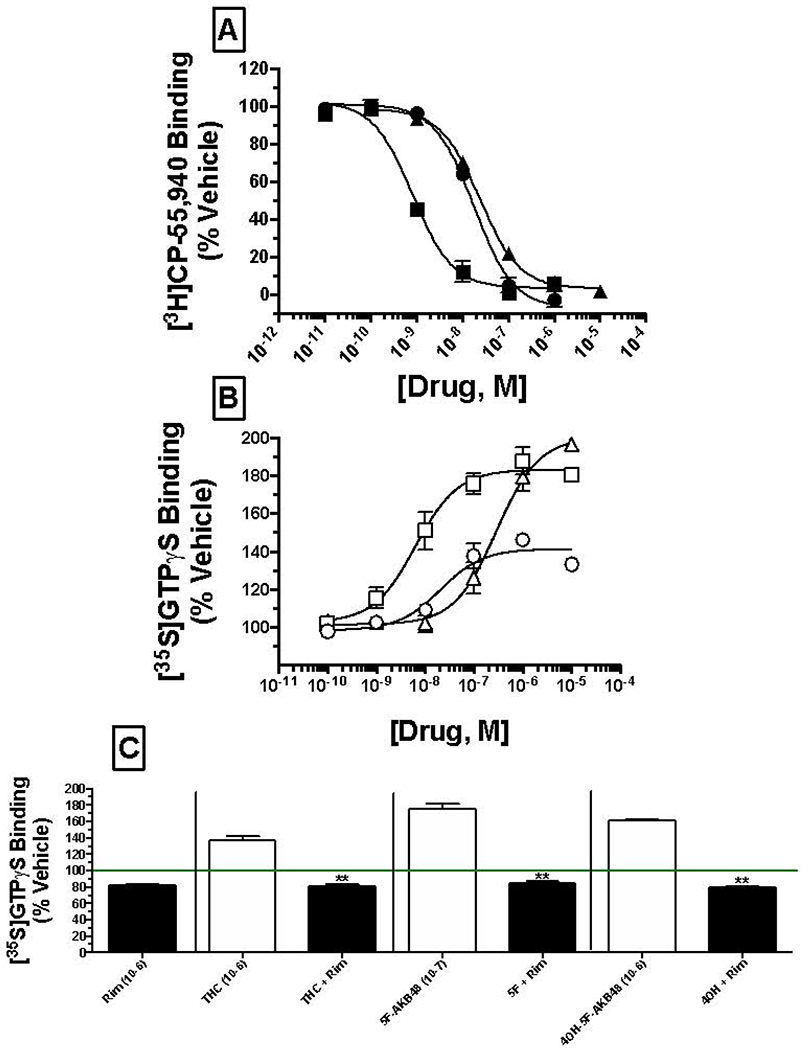
[A] Competition receptor binding in mouse brain membranes (50 μg) to compare CB1 receptor affinity of SCs was examined. Increasing concentrations of Δ9-THC (filled circles), 5F-AKB48 (filled squares) or 4OH-5F-AKB48 (filled triangles) (0.01 nM – 10 μM) were incubated with 0.2 nM of the non-selective CB1/CB2 agonist [3H]CP-55,940. Data points presented are the mean ± SEM of [3H]CP-55,940 binding in the presence of test compounds. The Cheng-Prusoff equation (Cheng and Prusoff, 1973) was used to convert the experimental IC50 values obtained from competition receptor binding experiments to Ki values, a quantitative measure of receptor affinity. [B] Quantification of intrinsic activity of SCs at CB1 receptors by examining modulation of G protein activity. Membranes (25 μg) prepared from mouse brains were incubated in the presence of 0.1 nM [35S]GTPγS with increasing concentrations (10−10 to 10−5M) of Δ9-THC (open circles), 5F-AKB48 (open squares) and 4OH-5F-AKB48 (open triangles). Data points presented are the mean ± SEM of basal G protein activity in the presence of test compounds. [C] Specificity of CB1 receptor G protein activation by SCs. A single 1 μM concentration of each compound was incubated in the absence (open bars) or presence (filled bars) of a receptor saturating concentration of the selective CB1 receptor antagonist/inverse agonist rimonabant (100 nM). Bars are presented are the mean ± SEM of basal G protein activity in the presence of test compounds.
Intrinsic Activity: CB1 receptor-induced G protein activation
CB1 receptors are G protein coupled receptors that produce intracellular effects via interaction with the Gi/Go-subtype of G proteins (Dalton et al., 2009). Upon binding to CB1 receptors, agonists produce activation of G proteins that can be quantified in membrane preparations by measuring increases in agonist-induced binding of [35S]GTPγS, a nonhydrolyzable GTP analogue (Harrison and Traynor, 2003). Agonists increase, inverse agonists decrease, and neutral antagonists have no effect on [35S]GTPγS binding. To measure intrinsic activity of Δ9-THC (open circles), 5F-AKB48 (open squares) or 40H-5F-AKB48 (open triangles), increasing concentrations (0.1 nM – 10 μM) of each compound to increase [35S]GTPγS binding via CB1 receptor activation in mouse brain membranes were examined (Figure 6B). As anticipated, the partial CB1 receptor agonist Δ9-THC maximally (Emax) increased [35S]GTPγS binding approximately 142.2 +/− 2.2% with a potency (EC50) of 24.5 nM (pEC50= 7.672 +/− 0.158; N=3) in mouse membranes. In contrast, the full CB1 receptor synthetic cannabinoid agonist 5F-AKB48 increased [35S]GTPγS binding with significantly (P<0.05) greater efficacy (Emax= 181.8 +/− 5.5%; N=3) and potency 7.7 nM (pEC50 = 8.205 +/− 0.194; N=3) when compared to Δ9-THC. Most importantly, although with reduced potency 334 nM (pEC50= 6.534 +/− 0.165; N=3), the 40H-metabolite of 5F-AKB48 not only retained activity, but also activated G proteins with greater efficacy (Emax = 201 +/− 3.0%; N=3) when compared to that produced by the parent compound 5F-AKB48 (P<0.05).
To confirm agonists activated G proteins via specific interaction with CB1 receptors, a single 1 μM concentration of each compound was incubated in the absence (open bars) or presence (filled bars) of the selective CB1 receptor antagonist/inverse agonist rimonabant (100 nM) (Figure 6C). As expected of a CB1 receptor agonist, co-incubation in mouse brain membranes of Δ9-THC, 5F-AKB48 and 4OH-5F-AKB48 with rimonabant resulted in complete reversal (P<0.05) of G protein activation produced by each compound.
Cannabinoid Tetrad
Hypothermic effects
Following injection with the cannabinoid vehicle, mice exhibited rectal temperatures within the species-typical physiological range (Figure 8, grey region in all panels.) Upon administration of Δ9-THC, dose- and time-dependent hypothermic effects were observed (Figure 8A). The highest tested dose of Δ9-THC (32 mg/kg) reduced rectal temperature approximately 4° below the physiological range, and hypothermic effects were still apparent 6 hours after drug administration (Figure 8A, filled triangles). Importantly, prior injection of the CB1 receptor antagonist rimonabant completely blocked hypothermic effects of 32 mg/kg Δ9-THC (Figure 8B), as all rectal temperatures recorded remained within the physiological range. Similarly, 5F-AKB48 also elicited dose- and time-dependent hypothermic effects in mice (Figure 8C). Similar to 32 mg/kg Δ9-THC, the highest tested dose of 5F-AKB48 (3.2 mg/kg) reduced rectal temperature approximately 4° below the physiological range, but these hypothermic effects completely resolved by 4 hours after drug administration (Figure 8C, filled triangles). Importantly, prior injection of the CB1 receptor antagonist rimonabant completely blocked hypothermic effects of 3.2 mg/kg 5F-AKB48 (Figure 8D), as all rectal temperatures recorded remained within the physiological range. Thus, the hypothermic effects of 5F-AKB48 were more potent than those of Δ9-THC, but the duration of hypothermic action was shorter.
Figure 8. Cannabinoid tetrad in mice: Hypothermia.
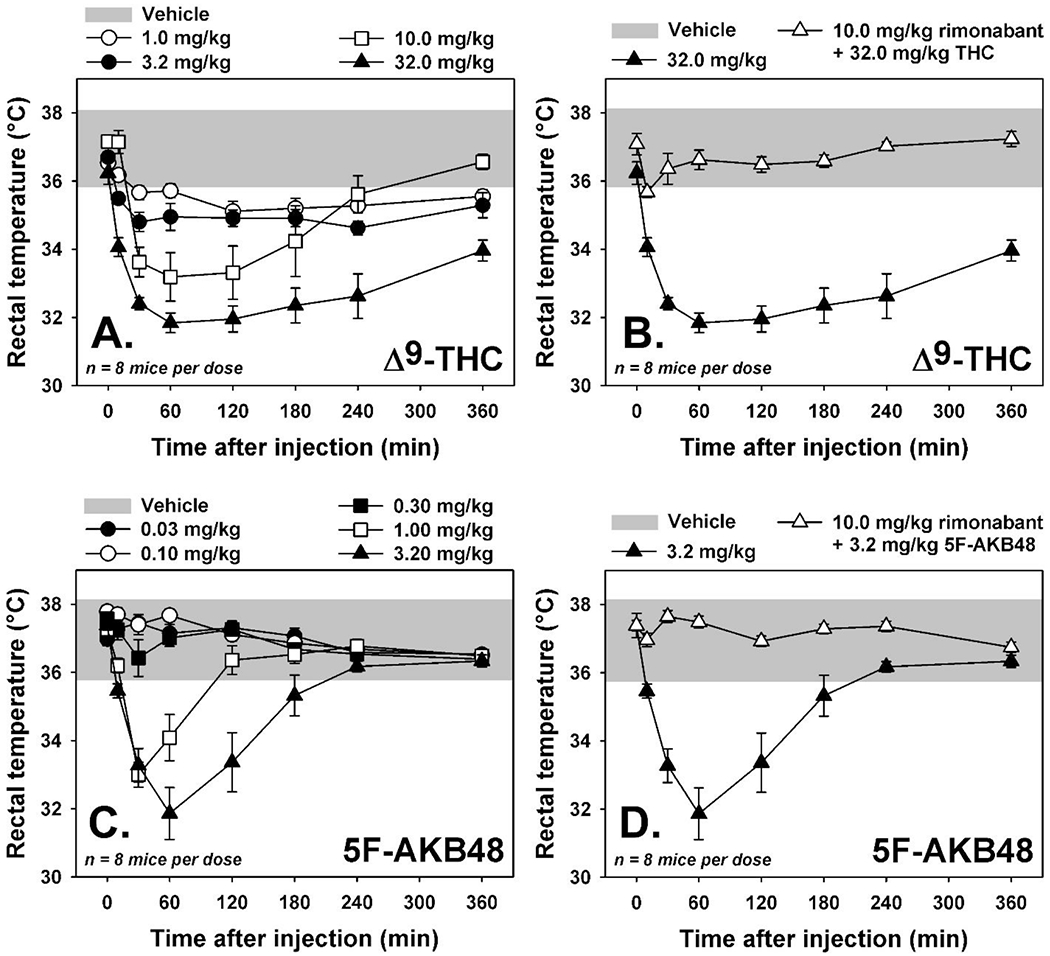
[A] Time-effect curves for THC (1.0—32 mg/kg, i.p., n=8) on rectal temperature. [B] Effects of rimonabant (10.0 mg/kg, i.p.) on hypothermic doses of THC (32.0 mg/kg, i.p.). [C] Time-effect curves for 5F-AKB48 (0.032—3.2 mg/kg, i.p., n=8) on rectal temperature. [D] Effects of rimonabant (10.0 mg/kg, i.p.) on hypothermic doses of 5F-AKB48 (3.2 mg/kg, i.p.). Shaded region represents the range of temperatures observed following an injection of vehicle (0.9% saline containing 5% ethanol and 5% emulphor). Vertical lines represent S.E.M. unless the S.E.M. is smaller than the size of the symbol. Abscissae: time after injection, in minutes. Ordinates: rectal temperature, in °C.
Antinociceptive effects
Injection with the cannabinoid vehicle resulted in short tail withdrawal latencies (3 to 4 sec) from 50° water at all time points (Figure 9A and C, grey squares.) Following administration of Δ9-THC, dose- and time-dependent antinociceptive effects were observed (Figure 9A). The highest tested dose of Δ9-THC (32 mg/kg) increased tail withdrawal latencies to approximately 90% of the maximum by 30 min post-injection, and antinociceptive effects were still apparent 6 hours after drug administration (Figure 9 A, filled triangles). Importantly, prior injection of the CB1 receptor antagonist rimonabant completely blocked antinociceptive effects of 32 mg/kg Δ9-THC (Figure 9B), as all tail withdrawal latencies recorded remained within the 3-4 sec range observed following vehicle administration. Similarly, 5F-AKB48 also elicited dose- and time-dependent antinociceptive effects in mice (Figure 9C). The highest tested dose of 5F-AKB48 (3.2 mg/kg) increased tail withdrawal latencies to approximately 90% of the maximum by 15 min post-injection, and these effects were still apparent by 6 hours after drug administration (Figure 9C, filled triangles). Importantly, prior injection of the CB1 receptor antagonist rimonabant completely blocked antinociceptive effects of 3.2 mg/kg 5F-AKB48 (Figure 9D), as all tail withdrawal latencies recorded remained within the 3-4 sec range observed following vehicle administration. Thus, the antinociceptive effects of 5F-AKB48 were more potent than those of Δ9-THC, the maximal magnitude of effect was comparable, and the duration of antinociceptive action was at least 6 hours.
Figure 9. Cannabinoid tetrad in mice: Antinociception.
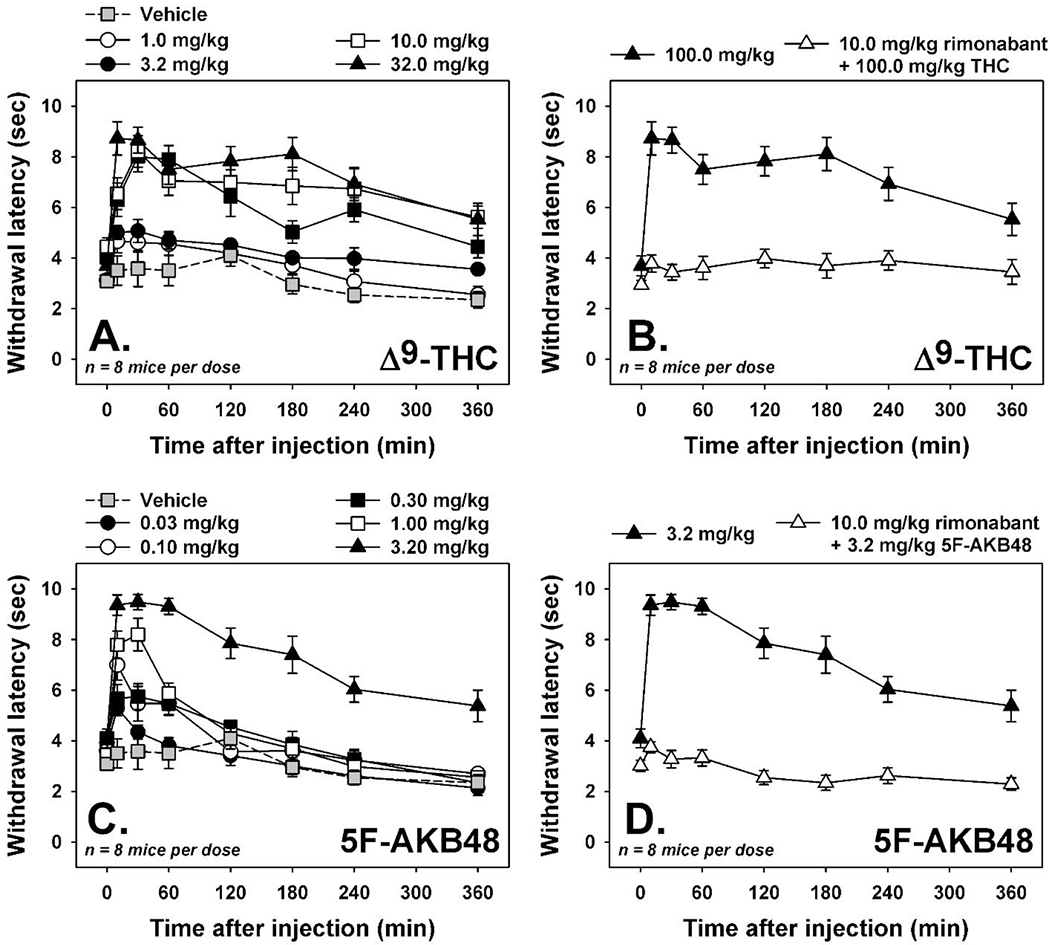
[A] Time-effect curves for THC (1.0—32 mg/kg, i.p., n=8) on tail withdrawal latency from 50°C water. [B] Effects of rimonabant (10.0 mg/kg, i.p.) on antinociceptive doses of THC (32.0 mg/kg, i.p.). [C] Time-effect curves for 5F-AKB48 (0.032—3.2 mg/kg, i.p., n=8) on tail withdrawal latency from 50°C water. [D] Effects of rimonabant (10.0 mg/kg, i.p.) on antinociceptive doses of 5F-AKB48 (3.2 mg/kg, i.p.). Gray squares represent tail withdrawal latencies observed following an injection of vehicle (0.9% saline containing 5% ethanol and 5% emulphor). Vertical lines represent S.E.M. unless the S.E.M. is smaller than the size of the symbol. Abscissae: time after injection, in minutes. Ordinates: tail withdrawal latency, in sec.
Cataleptic effects
Injection with the cannabinoid vehicle elicited no measurable catalepsy at any time point (Figure 10A and C, grey squares.) Following administration of Δ9-THC, dose- and time-dependent cataleptic effects were observed (Figure 10A). The highest tested dose of Δ9-THC (32 mg/kg) increased horizontal bar latencies to approximately the 30 sec maximum by 15 min post-injection, and pronounced cataleptic effects were still apparent 6 hours after drug administration (Figure 10A, filled triangles). Importantly, prior injection of the CB1 receptor antagonist rimonabant completely blocked cataleptic effects of 32 mg/kg Δ9-THC, as all horizontal bar latencies recorded approximated the 0 sec measure observed following vehicle administration (Figure 10B). Similarly, 5F-AKB48 also elicited dose- and time-dependent cataleptic effects in mice (Figure 10C). The highest tested dose of 5F-AKB48 (3.2 mg/kg) increased horizontal bar latencies by 15 min post-injection, although the 30 sec cut-off was never reached at any time point. These effects largely resolved by 3 hours after drug administration (Figure 10C, filled triangles). Importantly, prior injection of the CB1 receptor antagonist rimonabant completely blocked cataleptic effects of 3.2 mg/kg 5F-AKB48 (Figure 10D), as all horizontal bar latencies recorded approximated the 0 sec measure observed following vehicle administration. Thus, the cataleptic effects of 5F-AKB48 were more potent than those of Δ9-THC, the maximal magnitude of effect was comparable, and the duration of cataleptic actions was shorter.
Figure 10. Cannabinoid tetrad in mice: Catalepsy.
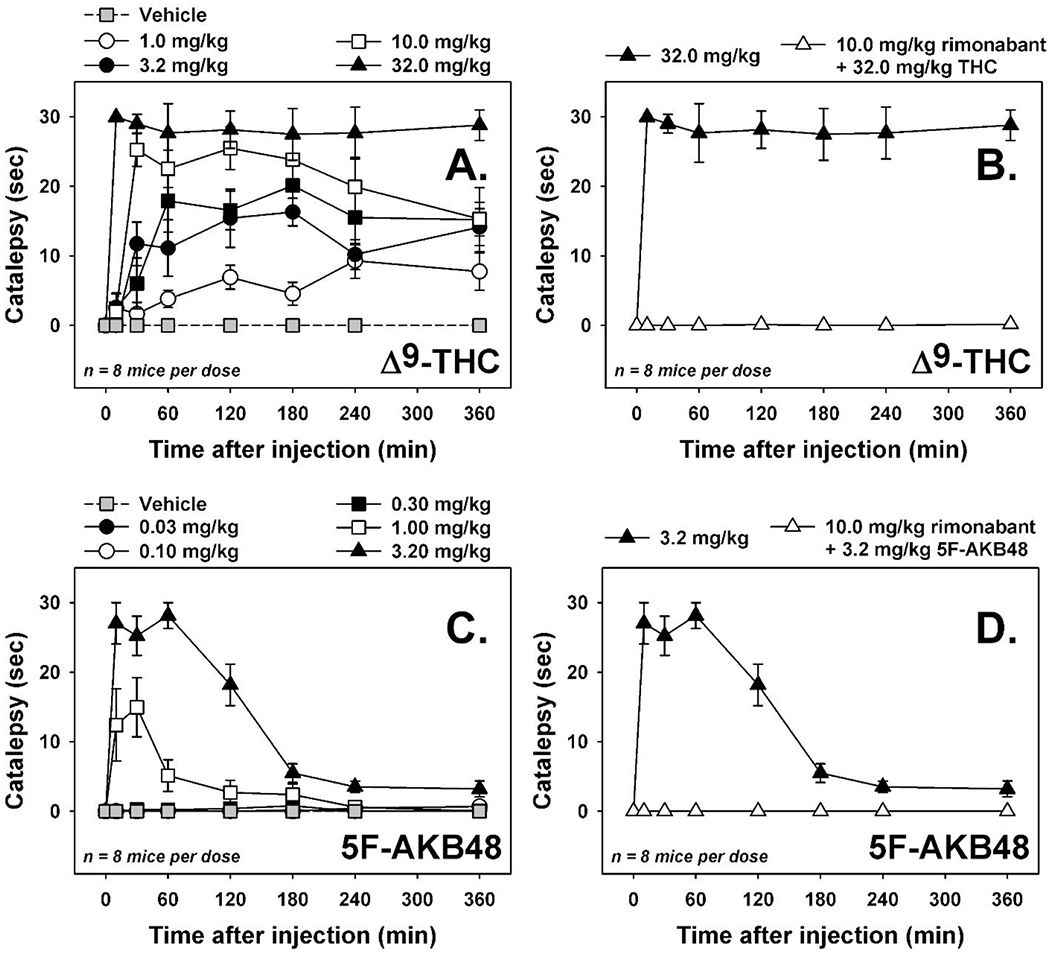
[A] Time-effect curves for THC (1.0—32 mg/kg, i.p., n=8) on horizontal bar catalepsy. [B] Effects of rimonabant (10.0 mg/kg, i.p.) on cataleptic doses of THC (32.0 mg/kg, i.p.). [C] Time-effect curves for 5F-AKB48 (0.032—3.2 mg/kg, i.p., n=8) on horizontal bar catalepsy. [D] Effects of rimonabant (10.0 mg/kg, i.p.) on cataleptic doses of 5F-AKB48 (3.2 mg/kg, i.p.). Gray squares represent horizontal bar latencies observed following an injection of vehicle (0.9% saline containing 5% ethanol and 5% emulphor). Vertical lines represent S.E.M. unless the S.E.M. is smaller than the size of the symbol. Abscissae: time after injection, in minutes. Ordinates: horizontal bar catalepsy, in sec.
Locomotor effects
Injection with the cannabinoid vehicle and placement into the locomotor activity arenas elicited exploratory activity which declined over approximately 100 min. Summing all activity counts over this period provides the baseline comparison activity for all drug trials (Figure 11, grey square.) Following administration of Δ9-THC (Figure 11, filled triangles), dose-dependent locomotor suppressant effects were observed, with the highest tested dose of Δ9-THC (32 mg/kg) decreasing locomotor activity approximately 5-fold below the vehicle control condition. Importantly, prior injection of the CB1 receptor antagonist rimonabant partially attenuated the hypolocomotor effects of 32 mg/kg Δ9-THC (Figure 11, open triangle.) Similarly, 5F-AKB48 also elicited dose-dependent locomotor effects in mice (Figure 11, filled circles), with the highest tested dose of 5F-AKB48 (3.2 mg/kg) decreasing locomotor activity approximately 5-fold below the vehicle control condition. Importantly, prior injection of the CB1 receptor antagonist rimonabant partially attenuated the hypolocomotor effects of 3.2 mg/kg 5F-AKB48 (Figure 11, open circle.) Thus, the locomotor effects of 5F-AKB48 were similar in magnitude to those of Δ9-THC, but were more potent.
Figure 11. Cannabinoid tetrad in mice: Locomotor activity.
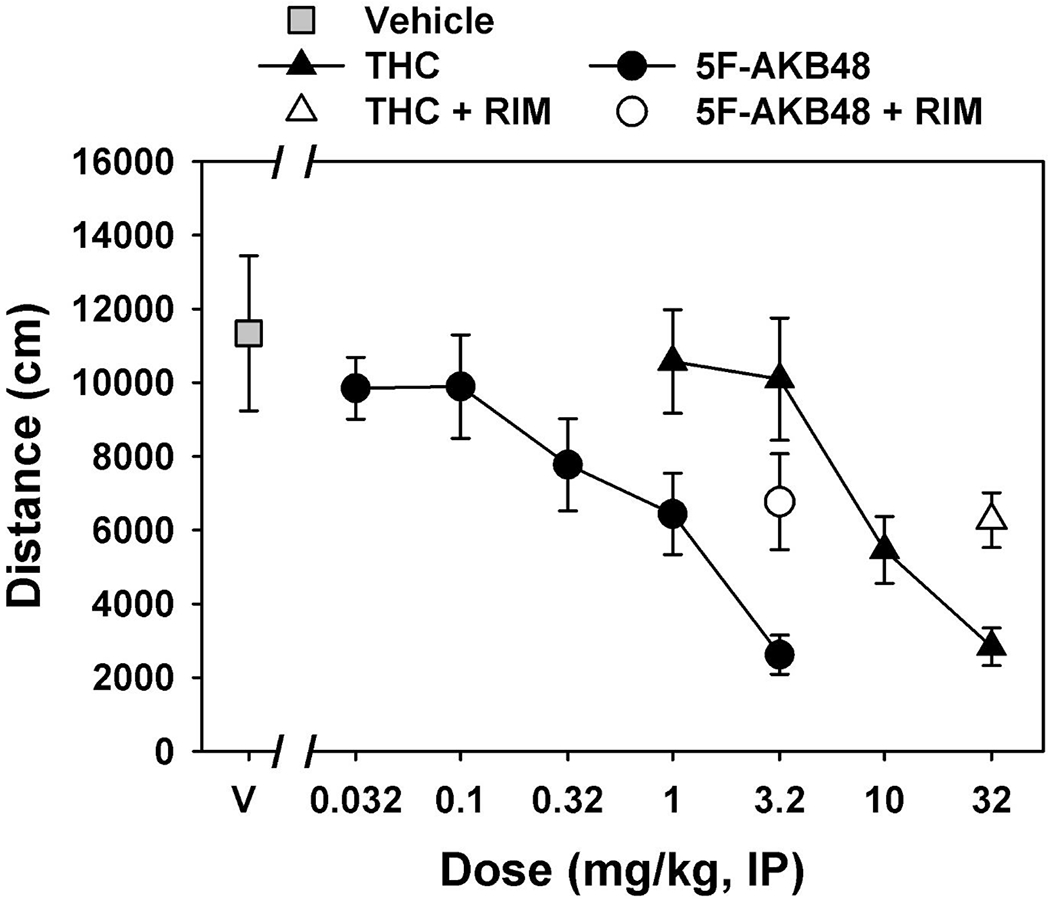
Dose-effect curves for THC (1.0—32 mg/kg, i.p., n=8, filled triangles) and 5F-AKB48 (0.032—3.2 mg/kg, i.p., n=8, filled circles) on locomotor activity summed over 3 hours, and effects of rimonabant (10.0 mg/kg, i.p.) on locomotor suppressant doses of THC (32.0 mg/kg, i.p., open triangle) or 5F-AKB48 (3.2 mg/kg, i.p., open circle). Gray square represents mean total distance traveled following an injection of vehicle (0.9% saline containing 5% ethanol and 5% emulphor). Vertical lines represent S.E.M. unless the S.E.M. is smaller than the size of the symbol. Abscissa: dose of drug, in mg/kg and plotted on a log scale. Ordinate: mean total distance traveled in 3 hours, in cm.
Radiotelemetry of core temperature
During the 24-hour baseline temperature assessment, mice exhibited core temperatures within the species-typical physiological range across the circadian cycle (Figure 12, grey region.) Following administration of 100 mg/kg of the phase I inhibitor 1-ABT or its vehicle, no systematic changes in temperature were observed. As expected from the previous tetrad studies involving rectal temperature, administration of 3.2 mg/kg 5F-AKB48 elicited a rapid and dramatic hypothermic effect in both groups of mice. For vehicle-treated mice administered 3.2 mg/kg 5F-AKB48, the minimum core temperature recorded was approximately 7° below the physiological range, and these hypothermic effects completely resolved by 4 hours after drug administration (Figure 12, filled circles.) In contrast, mice previously administered 1-ABT exhibited more dramatic hypothermia when treated with 3.2 mg/kg 5F-AKB48 (Figure 12, open circles). In these animals, the minimum core temperature recorded was still approximately 7° below the physiological range, but the duration of hypothermic action was extended to at least 12 hours after drug administration. The area under the curve for hypothermic effects of 5F-AKB48 in mice treated with 1-ABT was approximately 5-fold greater than that observed in vehicle mice, and these two areas were significantly different from one another (t=−8.214, df=4, P<0.05).
Figure 12. Role of Phase I metabolism in hypothermic effects of 5F-AKB48.
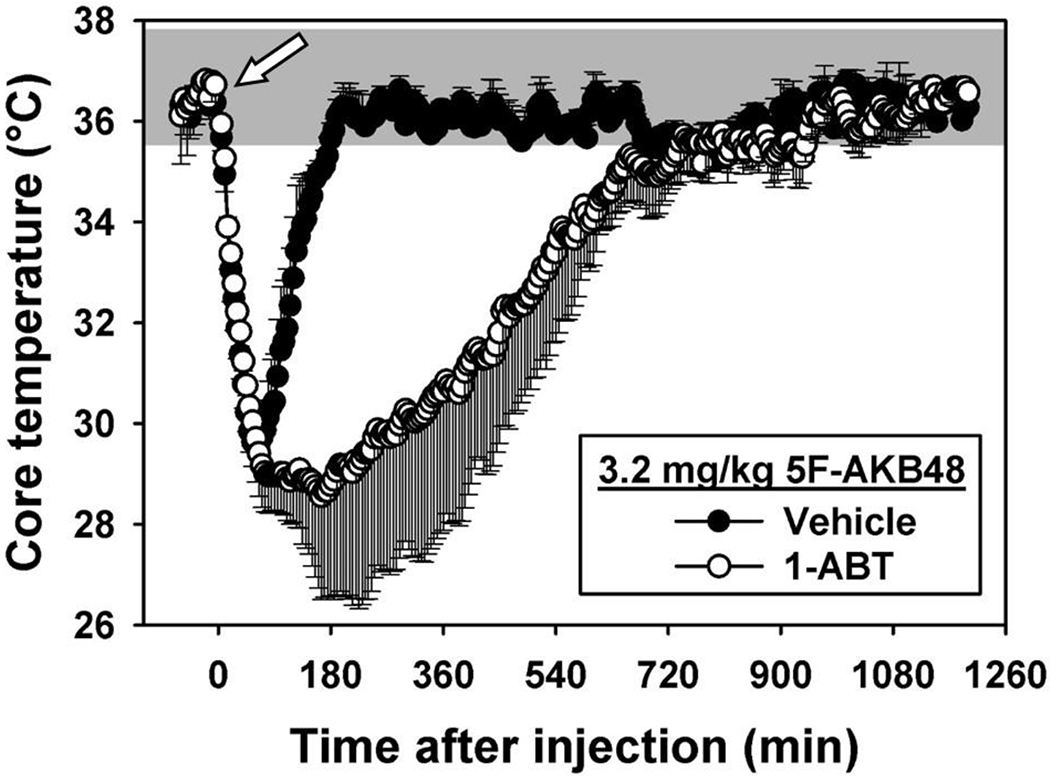
Time-effect curves for mice treated with vehicle (n=5, filled circles) or 100 mg/kg 1-ABT (n=5, open circles), then injected with 3.2 mg/kg 5F-AKB48 (arrow indicates time of injection.) Shaded region represents the range of temperatures observed following an injection of vehicle (0.9% saline containing 5% ethanol and 5% emulphor). Vertical lines represent S.E.M. unless the S.E.M. is smaller than the size of the symbol. Abscissa: time after injection, in minutes. Ordinate: rectal temperature, in °C.
Discussion
The significant increase in the number of newly designed SCs and their resulting cases of toxicity presents a dire need for investigations into their pharmacological actions and metabolic fates (Vikingsson et al., 2015). SCs do not show up in standard drug tests, and the adverse effects that they cause can only be treated supportively since there are currently no selective CB1 antagonists approved for human use, or any other therapeutic interventions known to reverse these acute and chronic toxicities. Compared to first generation SCs, the newest generation of compounds are extensively modified by the addition of large, bulky groups and halogens. Those compounds are not easily metabolized or excreted and result in biologically active metabolites with increased toxicity. 5F-AKB48 is a fourth generation SC possessing a large adamantyl cage along with a fluorinated pentyl chain. Ingestion of this compound, along with its nonfluorinated analog, causes intense physiological effects across numerous domains. This compound has been linked to several cases of seizures, renal injuries, and myocardial infarctions along with the more expected adverse effects including nausea, vomiting, hallucinations, tachycardia, and psychosis (Ford et al. 2017, Schneir and Baumbacher, 2012, Vucinic et al., 2018, Basavarajappa and Subbanna, 2019, Srisung et al., 2015, Knights et al., 2013, Zawilska and Wojcieszak, 2014)
In this study, we carried out experiments on the metabolic transformation of the 5-fluoro analogue of AKB48, followed by investigations of its activity at the CB1 receptor in vitro and in vivo. Previous studies of the metabolites of 5F-AKB48 were initially conducted with authentic urine samples from several SC users, hepatocytes, and HLMs, along with analyses via LC/MS which resulted in the identification of a variety of oxidized and conjugated compounds (Doerge et al., 2000; Gandhi et al., 2013; Vikingsson et al., 2015). Specifically, those studies demonstrated that incubation with HLM resulted in primarily hydroxylated metabolites, and there was a preference for the placement of the hydroxyl groups on the adamantyl cage and pentyl chain (Gandhi et al., 2013; Holm et al., 2015b; Vikingsson et al., 2015). Previous studies (Holm et al., 2015b; Volak et al., 2008) identified approximately 16 oxidative metabolites including the successive addition of hydroxyl groups on the adamantyl cage and pentyl chain, alkylation of the pentyl chain, and oxidative defluorination. While the number and distribution of metabolites that formed varied between the various studies, hydroxylated metabolites were the most prominent (Figure 1) (Gandhi et al., 2013; Sobolevsky et al., 2015; Presley et al., 2016).
In this study, the preliminary experiments were conducted with HLM while a detailed MS analysis of metabolites was carried out according to previously published protocols. In general, our findings were in line with the analyses published previously. Additionally, there was a significant amount of defluorinatied oxidative products that were not observed previously by other investigators (Cruickshank et al., 1993; Sobolevsky et al., 2015; Presley et al., 2016).
Furthermore, as described in other studies, the oxidative metabolism of 5F-AKB48 appeared successive. Over the course of the incubation, the parent compound disappeared almost completely, also reactions that were stopped in the first 30 min showed a production of primarily 5F-mono-OH. Reactions that were continued for over 30 min produced a second, and then third, hydroxyl group resulting in 5F-di-OH and 5F-tri-OH, respectively. With the increase of di- and trihydroxylated metabolites, there was a corresponding decrease in the amount of 5F-mono-OH. Upon analysis of the chromatograms, peaks corresponding to it began to shrink while the peaks for 5F-di-OH and 5F-Tri-OH increased. However, reactions with shorter incubation periods (5, 10, and 15 min) also formed 5F-di-OH and/or 5F-tri-OH but the amounts of those metabolites were minuscule.
Enzymes that displayed the highest activity began transforming the dihydroxylated structure into other metabolites. The most common was a species that was trihydroxylated on the adamantyl cage or a species that was dihydroxylated on the adamantyl cage and monohydroxylated on the terminus of the pentyl chain. The additional hydroxyl group resulted in what was believed to be 2 endpoints in the oxidative metabolism of 5F-AKB48 as urine analysis only reported small percentages of glucuronidation for these metabolites (Gandhi et al., 2013; Holm et al., 2015b; Vikingsson et al., 2015). In addition to the complex metabolic pathways of this SC, the fact that multiple metabolites are formed by the same enzyme, as well as other enzymes, necessitates the consideration of product inhibition (Gandhi et al., 2013). This competitive inhibition could be due to the products of the reaction competing for the active sites of the enzyme, not destroying the function of the enzyme, but it still resulting in the overall slowing of the clearance of the SC (Holm et al., 2015a). While data from these urine samples was interesting, it was less reliable due to the possible drug interactions with other substances present in the body and the uncertainty of the conditions under which the SC was ingested. All studies comparing urine samples to HLM incubations note that there was a large discrepancy in metabolite production, hence, the focus on metabolites formed by HLMs (Gandhi et al., 2013; Holm et al., 2015b; Sobolevsky et al., 2015; Vikingsson et al., 2015; Presley et al., 2016). The formation of multiple metabolites occurring at multiple times indicates the very real possibility that there are multiple pathways involved in the metabolism of this SC. This is supported by the differing metabolic profiles for the various P450s. The lack of available metabolite standards precludes our ability to perform full kinetic analyses for all of the enzymes at this time, nevertheless future work is already underway to either elucidate rate equations for this process or develop an alternative method for their quantification.
In addition to the reactions with hepatic tissues, we also used human microsomes from a variety of different tissues such as the brain, intestines, and kidneys. Microsomes from the intestine showed a significant amount of activity towards the SC, producing noticeable amounts of the mono- and dihydroxylated metabolites. However, they did not produce any 5F-tri-OH, whereas HKM generated only a small amount of 5F-mono-OH (Figure 3; Table 1). While the liver and intestines are the primary sites of xenobiotic metabolism, the incidence of renal injuries accompanying episodes of select SC toxicity profiles necessitated a more thorough, organ specific investigation (Knights et al., 2013; Srisung et al., 2015). However, under experimental conditions used in our studies both HKM and HBM, did not show any activity toward 5F-AKB48.
Since there was no data on sex-specific metabolism, those studies were also included in this work and demonstrated that similarly as with HLMs, 5F-mono-OH, 5F-di-OH, and 5F-tri-OH were the primary hydroxylated metabolites (Gandhi et al., 2013; Knights et al., 2013; Srisung et al., 2015; Vikingsson et al., 2015). In our reactions with sex specific HLMs, it was found that while the sexes produced the same metabolites they differed in their amounts.
All above reactions were performed akin to those in the literature. Likewise, it was believed that while 5F-Tri-OH could be an endpoint in the oxidative metabolism of 5F-AKB48, both the mono- and dihydroxylated metabolites could be further metabolized by glucuronidation and subsequently be expelled from the body (Chimalakonda et al., 2011; Gandhi et al., 2013; Vikingsson et al., 2015).
To further elucidate the metabolic pathway used to detoxify and excrete 5F-AKB48, recombinant human P450s were incubated with 5F-AKB48 to identify the specific isoforms involved in the production of the oxidated metabolites. These incubations resulted in a very different metabolic profile as compared to classical cannabinoids. CYP3A4/5 showed the highest activities towards 5F-AKB48, rapidly metabolizing it through a series of hydroxylations to produce mono-, di-, and trihydroxylated metabolites. Other P450s, including CYP2C8, -2D6, and -2J2, were also involved in the SCs’ metabolism, but they produced smaller quantities of the mono- and dihydroxyl ated metabolites and none of the trihydroxylated ones. The differing metabolic profiles illuminated some of the ways that these enzymes interacted with the SC. For example, the large amount of 5F-di-OH produced by CYP3 A4/5 in a very brief time period suggested that the enzyme added 2 hydroxyl groups at the same time. On the other hand, 5F-mono-OH was produced in much smaller amounts that disappeared over the course of the incubation while 5F-di-OH and 5F-Tri-OH increased. The decrease in the monohydroxylated metabolite with the concurrent increase in di- and trihydroxylated metabolites supports the idea of successive metabolism. This pattern suggests that the double hydroxylation was the major form of biotransformation for CYP3A4/5, which was followed by the less-frequent successive addition of hydroxyl groups. As C YP2J2 did not possess the same biotransformative capacity towards 5F-AKB48, it did not produce 5F-di-OH in the same way. Instead, it steadily hydroxylated 5F-AKB48 into 5F-mono-OH, whereas 5F-di-OH appeared only after a significant amount of time had passed. CYP2J2 and CYP3 A4 do share many of the same substrates, but CYP2J2’s binding sites are more specific. On the other hand, CYP2D6 was not shown to be a major player in the oxidative metabolism of 5F-AKB48 as it gave no evidence of the formation of a second or third type of metabolite (Holm et al., 2015a; Sobolevsky et al., 2015; Presley et al., 2016). These results were, in fact, similar to those found in the literature for AKB48 (Gandhi et al., 2013; Holm et al., 2015a).
Reactions with HLMs possessing genetic polymorphisms of CYP2D6 and CYP3 A5 suggest that the loss of activity exhibited by these polymorphisms could be rescued by other enzymes taking on larger roles in the oxidative metabolism of the substrate, an occurrence known as enzymatic shuffling. Analyses of the reactions performed with the variants of CYP2D6 and CYP3A5 suggested that the lack of activity exhibited by some variants could undergo enzymatic shuffling. Alternatively, other P450s, in the oxidative metabolism of this substrate, could compensate for their activity. To determine whether genetic polymorphisms of the two enzymes CYP2D6 and CYP3A5 affect its metabolic profile, we incubated genotyped HLMs for activity levels of high/normal, medium, and none in conditions as described above. Highly polymorphic enzymes CYP2D6 and CYP3A5 produced significant levels of the metabolites, although CYP2D6 only produced monohydroxy 5F-AKB48. The lack of activity of these isoforms appears to be somewhat compensated for by other P450s, however, it does take longer to metabolize the SC. While it plays a much smaller role in its metabolism, CYP2D6 produces approximately the same quantities of metabolites after 30 min.
Since CYP2J2 was the only enzyme that produced only 5F-mono-OH during the first 10 min, a steady-state kinetics analyses were performed (Sobolevsky et al., 2015; Presley et al., 2016). The moderate affinity indicated by kinetic analysis of CYP2J2 suggests a possible reason for the medium levels of 5F-mono-OH that appear as well as the lack of other metabolites. This could potentially increase the risk of toxicity in users.
The rate of deletion of the parent compound would be expected to slow in a linear fashion as the reaction continued. Consequently, since P450s can bind to multiple structures at the same time, as well as hydroxylate the same structure repeatedly, these reactions can result in a multitude of potential substrates that must now share the activity of the P450s with the parent compound, 5F-AKB48. The metabolism of this SC, and others like it, presented numerous problems for analysis. First, there was no clear, direct metabolic pathway; many transformations can be applied to the structure, including hydroxylation, carboxylation, hydrolysis, and the addition of ketone groups. Additionally, these biotransformations may occur at multiple locations.
The in vitro data reported here indicate that although the affinity and potency of the phase I metabolite of 5F-AKB48 (4OH-5F-AKB48) is reduced when compared to that of the parent drug, this metabolite nevertheless retains similar high CB1 receptor affinity, and higher efficacy for G protein activation, when compared to THC. The CB1 receptor affinity and potency for G protein activation of 5F-AKB48 and 4OH-5F-AKB48 demonstrated here are similar to that recently reported by Gamage et al. (2019). These observations suggest that potential gender and genetic differences in oxidative metabolism of 5F-AKB48 might lead to accumulation of potent and efficacious metabolites that retain high affinity for CB1 receptors, potentially contributing to enhanced toxicity commonly observed with use of this abused synthetic cannabinoid. Accumulation of active metabolites with parent drugs might lead to not only additive, but also potential synergistic toxic effects, as has been demonstrated following co-administration of SCs in animals (Brents et al., 2013)(Ossato et al., 2016). Such additive and/or synergistic effects do not occur following marijuana use, that contains only a single psychoactive compound THC and a second natural constituent known as cannabidiol, that appears to blunt adverse effects produced by THC (Todd and Arnold, 2016).
In vivo experiments indicated that 5F-AKB48 elicited cannabimimetic effects in adult male C57BL/6 mice, and that while 5F-AKB48 was more potent than Δ9-THC, it was also shorter-acting. Because previous studies have demonstrated that addition of a fluorinated pentyl chain and adamantyl cage can slow metabolism (Gandhi et al., 2013; Vikingsson et al., 2015), we expected that administration of use 5F-AKB48 may result in a buildup of potentially active metabolites and therefore a longer duration of biological action. However, this was not observed in any of the tetrad measures here employed. Nevertheless, 5F-AKB48 elicited hypothermia, decreased spontaneous locomotor activity, induced antinociception and produced catalepsy at smaller doses than required to observe these effects with the classical cannabinoid THC. At present it is unclear why the duration of action for 5F-AKB48 was relatively short in the mouse. It may be the case that different oxidative enzymes are involved in its metabolism than those involved in the metabolism of classical cannabinoids. Species differences may also account for this short duration of effect, and in humans – particularly those with genetic polymorphisms resulting in decreased enzymatic activity leaving increased levels of the parent compound and decreasing the amount of the compound cleared from the body (Brents et al., 2013; Tai et al., 2015; Hutchison et al., 2018; Wilson et al., 2019) – duration may be significantly longer.
Future studies will investigate further metabolism and clearance of the compound which could work to determine the roles of Phase II metabolic processes and transporter activity leading to excretion (Volak et al., 2008). The toxic effects of SC, including 5F-AKB48, can be utilized for beneficial purposes. For example, it is anticipated that this information can be of use in various types of cancer treatments and other pharmacological and clinical settings. The deleterious effects observed for some K2 users could be related to a genetic defect in P450 metabolism, which results in adverse psychoactive and physiological effects including stroke, convulsions, and death. Differences in sex could also put users at risk (Schneir and Baumbacher, 2012). These studies suggest that fluorination could alter the metabolism, pharmacogenetics, and/or effectiveness of SCs resulting in an increased risk of toxicity (Brents et al., 2013; Tai et al., 2015; Hutchison et al., 2018; Wilson et al., 2019).
Figure 7.
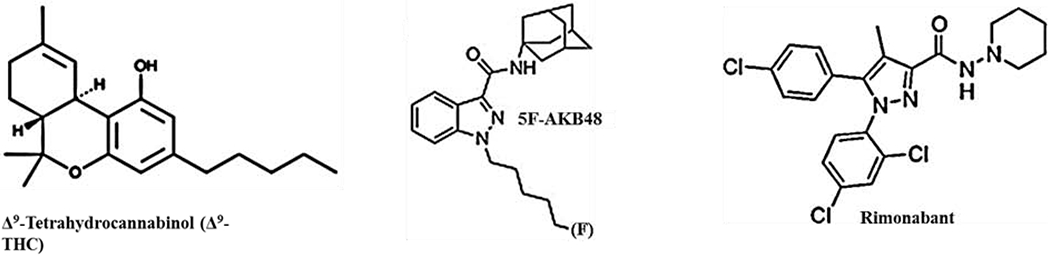
Chemical Structures for Δ9THC, 5F-AKB48, and Rimonabant.
Table 2.
Recombinant Human P450s by Metabolite.
| Recombinant P450 Enzymes | |||||||||||||
|---|---|---|---|---|---|---|---|---|---|---|---|---|---|
| Parent | Metabolites | 1A2 | 2A6 | 2B6 | 2C8 | 2C9 | 2C18 | 2C19 | 2D6 | 2E1 | 2J2 | 3A4 | 3A5 |
| AKB48 | NT | — | NT | NT | |||||||||
| Monohydroxy | + | + | + | + | + | + | + | + | |||||
| Dihydroxy | + | + | + | ||||||||||
| Trihydroxy | + | ||||||||||||
| 5F-AKB48 | NT | — | |||||||||||
| Monohydroxy | + | + | + | + | + | + | + | + | + | + | |||
| Dihydroxy | + | + | + | + | + | ||||||||
| Trihydroxy | + | + | |||||||||||
Acknowledgments
Funding
This work was supported by NIH Grant # P20 GM103429 from the IDeA Networks of Biomedical Research Excellence (INBRE) Program of the National Institute of General Medical Sciences (NIGMS), the National Institute of Health and National Institute for Drug Addiction [NIH/NIDA DA039143], and DEA/FDA HHSF223201610079C.
Financial Support: [DOD-W8IXWH1110795, NIH/NIDA DA039143 to ARP, PLP, WF, LJ, and JM]
Footnotes
Publisher's Disclaimer: This is a PDF file of an unedited manuscript that has been accepted for publication. As a service to our customers we are providing this early version of the manuscript. The manuscript will undergo copyediting, typesetting, and review of the resulting proof before it is published in its final form. Please note that during the production process errors may be discovered which could affect the content, and all legal disclaimers that apply to the journal pertain.
Conflict of Interest
The authors declare no conflict of interest.
References
- Abouchedid R, Ho JH, Hudson S, Dines A, Archer JRH, Wood DM and Dargan PI (2016). “Acute Toxicity Associated with Use of 5F-Derivations of Synthetic Cannabinoid Receptor Agonists with Analytical Confirmation.” J Med Toxicol 12(4): 396–401. [DOI] [PMC free article] [PubMed] [Google Scholar]
- Abouchedid R, Hudson S, Thurtle N, Yamamoto T, Ho JH, Bailey G, Wood M, Sadones N, Stove CP, Dines A, Archer JRH, Wood DM and Dargan PI (2017). “Analytical confirmation of synthetic cannabinoids in a cohort of 179 presentations with acute recreational drug toxicity to an Emergency Department in London, UK in the first half of 2015.” Clin Toxicol (Phila) 55(5): 338–345. [DOI] [PubMed] [Google Scholar]
- Basavarajappa BS and Subbanna S (2019). “Potential Mechanisms Underlying the Deleterious Effects of Synthetic Cannabinoids Found in Spice/K2 Products.” Brain Sci 9(1):pii:E14. [DOI] [PMC free article] [PubMed] [Google Scholar]
- Brents LK, Reichard EE, Zimmerman SM, Moran JH, Fantegrossi WE and Prather PL (2011). “Phase I hydroxylated metabolites of the K2 synthetic cannabinoid JWH-018 retain in vitro and in vivo cannabinoid 1 receptor affinity and activity.” PLoS One 6(7): e21917. [DOI] [PMC free article] [PubMed] [Google Scholar]
- Brents LK, Gallus-Zawada A, Radominska-Pandya A, Vasiljevik T, Prisinzano TE, Fantegrossi WE, Moran JH and Prather PL (2012). “Monohydroxylated metabolites of the K2 synthetic cannabinoid JWH-073 retain intermediate to high cannabinoid 1 receptor (CB1R) affinity and exhibit neutral antagonist to partial agonist activity.” Biochem Pharmacol 83(7): 952–961. [DOI] [PMC free article] [PubMed] [Google Scholar]
- Brents LK, Zimmerman SM , Saffell AR, Prather PL and Fantegrossi WE (2013). “Differential drug-drug interactions of the synthetic Cannabinoids JWH-018 and JWH-073: implications for drug abuse liability and pain therapy.” J Pharmacol Exp Ther 346(3):350–361. [DOI] [PMC free article] [PubMed] [Google Scholar]
- Canazza I, Ossato A, Trapella C, Fantinati A, De Luca MA, Margiani G, Vincenzi F, Rimondo C, Di Rosa F, Gregori A, Varani K, Borea PA, Serpelloni G and Marti M (2016). “Effect of the novel synthetic cannabinoids AKB48 and 5F-AKB48 on “tetrad”, sensorimotor, neurological and neurochemical responses in mice. In vitro and in vivo pharmacological studies.” Psychopharmacology (Berl) 233(21-22): 3685–3709. [DOI] [PubMed] [Google Scholar]
- Cheng Y and Prusoff WH (1973). “Relationship between the inhibition constant (Kl) and the concentration of inhibitor which causes 50 per cent inhibition (150) of an enzymatic reaction.” Biochem Pharmacol 22(23): 3099–3108. [DOI] [PubMed] [Google Scholar]
- Chimalakonda KC, Bratton SM, Le VH, Yiew KH, Dineva A, Moran CL, James LP, Moran JH and Radominska-Pandya A (2011). “Conjugation of synthetic cannabinoids JWH-018 and JWH-073, metabolites by human UDP-glucuronosyltransferases.” Drug Metab Dispos 39(10):l961–1976. [DOI] [PMC free article] [PubMed] [Google Scholar]
- Cruickshank D, Sansom LN, Veronese ME, Mojarrabi B, McManus ME and Zhu X (1993). “cDNA expression studies of rat liver aryl sulphotransferase.” Biochem Biophys Res Commun 191(1):295–301. [DOI] [PubMed] [Google Scholar]
- Dalton GD, Bass CE, Van Horn CG and Howlett AC (2009). “Signal transduction via cannabinoid receptors.” CNS Neurol Disord Drug Targets 8(6): 422–431. [DOI] [PMC free article] [PubMed] [Google Scholar]
- De Luca MA, Castelli MP, Loi B, Porcu A, Martorelli M, Miliano C, Kellett K, Davidson C, Stair JL, Schifano F and Di Chiara G (2016). “Native CB1 receptor affinity, intrinsic activity and accumbens shell dopamine stimulant properties of third generation SPICE/K2 cannabinoids: BB-22, 5F-PB-22, 5F-AKB-48 and STS-135.” Neuropharmacology 105: 630–638. [DOI] [PubMed] [Google Scholar]
- Diao X, Carlier J, Zhu M and Huestis MA (2017). “Human Hepatocyte Metabolism of Novel Synthetic Cannabinoids MN-18 and Its 5-Fluoro Analog 5F-MN-18.” Clin Chem 63(11): 1753–1763. [DOI] [PubMed] [Google Scholar]
- Doerge DR, Chang HC, Churchwell MI and Holder CL (2000). “Analysis of soy isoflavone conjugation in vitro and in human blood using liquid chromatography-mass spectrometry.” Drug Metab Dispos 28(3):298–307. [PubMed] [Google Scholar]
- Ford BM, Tai S, Fantegrossi WE and Prather PL (2017). “Synthetic Pot: Not Your Grandfather’s Marijuana.” Trends Pharmacol Sci 38(3): 257–276. [DOI] [PMC free article] [PubMed] [Google Scholar]
- Gandhi AS, Zhu M, Pang S, Wohlfarth A, Scheidweiler KB, Liu HF and Huestis MA (2013). “First characterization of AKB-48 metabolism, a novel synthetic cannabinoid, using human hepatocytes and high-resolution mass spectrometry.” AAPS J 15(4): 1091–1098. [DOI] [PMC free article] [PubMed] [Google Scholar]
- Gannon BM, Williamson A, Suzuki M, Rice KC and Fantegrossi WE (2016). “Stereoselective Effects of Abused “Bath Salt” Constituent 3,4-Methylenedioxypyrovalerone in Mice: Drug Discrimination, Locomotor Activity, and Thermoregulation.” J Pharmacol Exp Ther 356(3): 615–623. [DOI] [PMC free article] [PubMed] [Google Scholar]
- Harrison C and Traynor JR (2003). “The [35S]GTPγS binding assay: approaches and applications in pharmacology.” Life Sci 74(4): 489–508. [DOI] [PubMed] [Google Scholar]
- Holm NB, Nielsen LM and Linnet K (2015a). “CYP3A4 Mediates Oxidative Metabolism of the Synthetic Cannabinoid AKB-48.”AAPS J 17(5): 1237–1245. [DOI] [PMC free article] [PubMed] [Google Scholar]
- Holm NB, Pedersen AJ, Dalsgaard PW and Linnet K (2015b). “Metabolites of 5F-AKB-48, a synthetic cannabinoid receptor agonist, identified in human urine and liver microsomal preparations using liquid chromatography high-resolution mass spectrometry.” Drug Test Anal 7(3): 199–206. [DOI] [PubMed] [Google Scholar]
- Hutchison RD , Ford BM, Franks LN, Wilson CD, Yarbrough AL, Fujiwara R, Su MK, Fernandez D, James LP, Moran JH, Patton AL, Fantegrossi WE, Radominska-Pandya A and Prather PL (2018). “Atypical Pharmacodynamic Properties and Metabolic Profile of the Abused Synthetic Cannabinoid AB-PINACA: Potential Contribution to Pronounced Adverse Effects Relative to Delta(9)-THC.” Front Pharmacol 9:1084. [DOI] [PMC free article] [PubMed] [Google Scholar]
- Gamage TF, Farquhar CE, McKinnie RJ, Kevin RC, McGregor IS, Trudell ML, Wiley JL, & Thomas BF (2019). “Synthetic Cannabinoid Hydroxypentyl Metabolites Retain Efficacy at Human Cannabinoid Receptors.” J Pharmacol Exp Ther. 368(3):414–422. [DOI] [PMC free article] [PubMed] [Google Scholar]
- Knights KM, Rowland A and Miners JO (2013). “Renal drug metabolism in humans: the potential for drug-endobiotic interactions involving cytochrome P450 (CYP) and UDP-glucuronosyltransferase (UGT).” Br J Clin Pharmacol 76(4):587–602. [DOI] [PMC free article] [PubMed] [Google Scholar]
- Langford AM and Bolton JR (2018). “Synthetic cannabinoids: Variety is definitely not the spice of life.” J Forensic Leg Med 59: 36–38. [DOI] [PubMed] [Google Scholar]
- Lynch ME and Ware MA (2015). “Cannabinoids for the Treatment of Chronic Non-Cancer Pain: An Updated Systematic Review of Randomized Controlled Trials.” J Neuroimmune Pharmacol 10(2): 293–301. [DOI] [PubMed] [Google Scholar]
- Mardal M, Dalsgaard PW, Qi B, Mollerup CB, Annaert P and Linnet K (2018). “Metabolism of the synthetic cannabinoids AMB-CHMICA and 5C-AKB48 in pooled human hepatocytes and rat hepatocytes analyzed by UHPLC-(IMS)-HR-MS(E)” J Chromatogr B Analyt Technol Biomed Life Sci 1083:189–197. [DOI] [PubMed] [Google Scholar]
- Ossato A, Canazza I, Trapella C, Vincenzi F, De Luca MA, Rimondo C, Varani K, Borea PA, Serpelloni G and Mardal M (2016). “Effect of JWH-250, JWH-073 and their interaction on “tetrad”, sensorimotor, neurological and neurochemical responses in mice.” Prog Neuropsychopharmacol Biol Psychiatry 67:31–50. [DOI] [PubMed] [Google Scholar]
- Presley BC, Gurney SM, Scott KS, Kacinko SL and Logan BK (2016). “Metabolism and toxicological analysis of synthetic cannabinoids in biological fluids and tissues.” Forensic Sci Rev 28(2): 103–169. [PubMed] [Google Scholar]
- Schneir AB and Baumbacher T (2012). “Convulsions associated with the use of a synthetic cannabinoid product.” J Med Toxicol 8(l):62–64. [DOI] [PMC free article] [PubMed] [Google Scholar]
- Sobolevsky T, Prasolov I and Rodchenkov G (2015). “Study on the phase I metabolism of novel synthetic cannabinoids, APICA and its fluorinated analogue.” Drug Test Anal 7(2): 131–142. [DOI] [PubMed] [Google Scholar]
- Srisung W, Jamal F and Prabhakar S (2015). “Synthetic cannabinoids and acute kidney injury.” Proc (Bayl Univ Med Cent) 28(4):475–477. [DOI] [PMC free article] [PubMed] [Google Scholar]
- Tai S, Hyatt WS, Gu C, Franks LN, Vasiljevik T, Brents LK, Prather PL and Fantegrossi WE (2015). “Repeated administration of phytocannabinoid Delta(9)-THC or synthetic cannabinoids JWH-018 and JWH-073 induces tolerance to hypothermia but not locomotor suppression in mice, and reduces CB1 receptor expression and function in a brain region-specific manner.” Pharmacol Res 102:22–32. [DOI] [PMC free article] [PubMed] [Google Scholar]
- Todd SM and Arnold JC JC. (2016). “Neural correlates of interactions between cannabidiol and Δ(9) -tetrahydrocannabinol in mice: implications for medical cannabis.” Br J Pharmacol 173(1):53–65. [DOI] [PMC free article] [PubMed] [Google Scholar]
- Uchiyama N, Kawamura M, Kikura-Hanajiri R and Goda Y (2013). “URB-754: a new class of designer drug and 12 synthetic cannabinoids detected in illegal products.” Forensic Sci Int 227(1-3): 21–32. [DOI] [PubMed] [Google Scholar]
- Vikingsson S, Josefsson M and Green H (2015). “Identification of AKB-48 and 5F-AKB-48 Metabolites in Authentic Human Urine Samples Using Human Liver Microsomes and Time of Flight Mass Spectrometry.” J Anal Toxicol 39(6):426–435. [DOI] [PubMed] [Google Scholar]
- Volak LP, Ghirmai S, Cashman JR and Court MH (2008) “Curcuminoids inhibit multiple human cytochromes P450, UDP-glucuronosyltransferase, and sulfotransferase enzymes, whereas piperine is a relatively selective CYP3 A4 inhibitor.” Drug Metab Dispos 36(8): 1594–1605. [DOI] [PMC free article] [PubMed] [Google Scholar]
- Vucinic S, Kilibarda V, Dordevic S, Dordevic D, Perkovic-Vukcevic N, Vukovic-Ercegovic G, Antonijevic B, Curcic M, Antonijevic E, & Brajkovic G (2018). “Clinical and analytical experience of the National Poison Control Centre with synthetic cannabinoids.” Arh Hig Rada Toksikol, 69(2), 178–185 [DOI] [PubMed] [Google Scholar]
- Wilson CD, Tai S, Ewing L, Crane J, Lockhart T, Fujiwara R, Radominska-Pandya A and Fantegrossi WE (2019). “Convulsant Effects of Abused Synthetic Cannabinoids JWH-018 and 5F-AB-PINACA Are Mediated by Agonist Actions at CB1 Receptors in Mice.” J Pharmacol Exp Ther 368(2):146–156. [DOI] [PMC free article] [PubMed] [Google Scholar]
- Zawilska JB and Wojcieszak J (2014). “Spice/K2 drugs—more than innocent substitutes for marijuana.” Int J Neuropsychopharmacol 17(3): 509–525. [DOI] [PubMed] [Google Scholar]