Abstract
Understanding interactions between immune cells and their targets is an important step on the path to fully characterizing the immune system, and in doing so, learning how it combats disease. Many studies of these interactions have a narrow focus, often looking only at a binary result of whether or not a specific treatment was successful or only focusing on the interactions between two individual cells. Therefore, in an effort to more comprehensively study multicellular interactions among immune cells and their targets, we used in vitro longitudinal time-lapse imaging and developed an automated cell cluster analysis tool, or macro, to investigate the formation of cell clusters. In particular, we investigated the behavior of cancer-specific CD8+ and CD4+ T cells on how they interact around their targets, cancer cells and antigen-presenting cells. The macro that we established allowed us to examine those large-scale clustering behaviors taking place between those four cell types. Thus, we were able to distinguish directed immune cell clustering from random cell movement. Furthermore, this macro can be generalized to be applicable to systems consisting of any number of differently labeled species and can be used to track clustering behaviors and compare them to randomized simulations.
Keywords: Cell cluster analysis, Immune cell interactions, Macro, Cancer
1. Introduction
Some experiments involving immune cell interactions focus on at-large analysis of cell populations, such as those surrounding a tumor in vivo. Such experiments involve injecting one or more types of T cells into a tumor-bearing mouse, measuring the volume of the tumor over time and determining which key populations are present. This type of experiment gives a binary result: whether a treatment worked or not. While insightful in determining efficacy of treatments and understanding the relative compositions of cell populations between effective or ineffective treatments, it falls short of characterizing interactions between individual cell types.
Other studies have focused on cell clustering behaviors. It has been shown that multiple cell types present in suspensions of dissociated retina cells histotypically re-aggregate in clusters in vitro [1]. In the initial phase of this process, “random” clustering of cells took place without definable organization, followed by histotypic sorting of polarized cells, and finally differentiation of the clusters. Specific clusters are also formed by the numerous different cell types present in dissociated mouse spleens in vitro, which can re-aggregate into functional groups. This functional re-aggregation provided the experimental basis for the discovery of the antigen-presenting cell (APC), referred to as the “A cell” and eventually named the dendritic cell (DC) [2]. These cells play a central role in the induction of immune responses of lymphocytes in vitro [3], and are involved in cell clusters and interactions among multiple different types, i.e., with CD4+ and CD8+ T lymphocytes. Such interactions also likely play a central part in vivo in the traditional role of CD4+ T cells during the induction and effector phases [4, 5] of adoptively transferred (intravenously infused) lymphocytes that combat cancer or infections. At least four cell types are involved: CD4+ T cells, CD8+ T cells, APCs and cancer cells. While the phenotypes of the transferred lymphocytes effective upon adoptive transfer can be carefully defined, their necessary interactions with each other and with the APC and the targeted cancer cell remain unclear. Therefore, there is a need for an in vitro model that mirrors some of the effects in vivo that can quantify interactions between the critical cell types objectively.
Interactions between immune and cancer cells can be studied through tracking of cell movements. The migration of individual T lymphocytes can be tracked and quantified in experiments in vitro using known physical microscope parameters. It has been shown that T cells change directions frequently in their locomotion, and thus require short time intervals (~60 s) between image captures for accurate tracking of movements [6]. Other cell tracking experiments have analyzed T cell migration and interaction with APCs, and found that CD4+ T cells form “long-lived (>15 h) associations,” which often involve the formation of immunological synapses, with antigen-bearing APCs before activation [7]. While these synapses are stable junctions between two cells, there are also motile junctions, known as kinapses, involving ongoing T cell movement, which are interconvertible between synapses [8]. These junctions can, but do not always, form as a result of adhesion; however, they are required for T cell activation [9]. T cell locomotion has also been studied in the investigation of killing of virus-infected cells, where CD8+ T cells have been shown to cooperate with one another for killing by forming kinapses with the target [10]. Despite these findings, this type of study is limited because it requires a high rate of sampling and a narrow focus on small numbers of cells, which makes it difficult to quantify high numbers of interactions between multiple cell types purely by tracking individual cells, especially when contacts are transitory. Furthermore, the conceptual focus of these types of studies has been concentrated on dual interaction analyses, and thus ignored potential interactions in the tumor microenvironment with its diversity of cell types and niches.
What is missing from the aforementioned experiments is an approach that objectively detects and quantifies interactions between multiple cell types, with a focus on clusters rather than individual cells. It is known that for an effective immune response in vitro, cell clustering is required [3], and that multiple cells need to interact with each other [11]. Through our experiments, we found that this clustering effect could be measured and compared to a simulation of cells that have no affinity for one another, in order to make a direct assessment of the cells’ inclination to cluster. In order to analyze the immune cell clusters between T cells, cancer cells, and APCs, we used the UV-induced cancer cell line 6132A [12] as the cancer model, together with 6132A cancer-specific CD8+ T cells [12], 6132A cancer-specific CD4+ T cells [13] and CD11b+ cells, all uniquely fluorescently labeled. We then designed a computer program to search for clusters of cells containing more than one color. Using this computer program, or macro, we were able to examine the clustering behavior of immune cells around their targets and quantify the differences between immune cells and randomly simulated cells. By basing the analysis objective on the cluster rather than on individual cells, we were able to more efficiently quantify complex multi-cell-type interactions.
2. Materials and Methods
2.1. Mice
Mice were bred and maintained in a specific pathogen-free barrier facility at The University of Chicago according to Institutional Animal Care and Use Committee (IACUC) guidelines. C3H/HeN mice were obtained from Envigo (Huntingdon, Cambridgeshire, United Kingdom). C3H CD8−/− (C3H.129S2-Cd8atm1Mak) mice were generated in house by crossing C3H/HeN mice with C57BL/6 CD8−/− (B6.129S2-Cd8atm1Mak) mice for 20 generations. C3H CD4−/−(C3H.129S2-Cd4atm1Mak) mice were generated in house by crossing C3H/HeN mice with C57BL/6 CD4−/− (B6.129S2-Cd4atm1Mak) mice for 20 generations. C57BL/6 CD8−/− (B6.129S2-Cd8atm1Mak) and C57BL/6 CD4−/− (B6.129S2-Cd4atm1Mak) mice were purchased from the Jackson Laboratory (Bar Harbor, ME, USA). Mice were 8 – 12 weeks old when spleens were removed.
2.2. Cells
The 6132A cancer cell line originated in our laboratory from a tumor induced in 4 – 5-month-old C3H/HeN mice, which was generated by shaving their backs and exposing them three times a week to UV-light [14]. 6132A-Cerulean was generated by retroviral transduction using pMFG-Cerulean [15]. Phoenix-ampho cells [16] were transfected by calcium phosphate precipitation. Repeated rounds of transduction of 6132A with viral supernatants followed by fluorescence-based cell sorting (FACS Aria II, BD Biosciences, San Jose, CA, USA) derived the highly cerulean fluorescence expressing cell line. Cancer and Phoenix-ampho cells were maintained in DMEM supplemented with 10% FBS (Gemini Bio-Products). All cell lines were shortly passaged after thawing of the initial frozen stock to generate master cell banks. Working batches were passaged no longer than 4 – 6 weeks and authenticated by cellular morphology.
2.3. Isolation of CD11b+cells
Spleen cells were removed from normal C3H/HeN mice, red blood cells were lysed with TRIS ammonium chloride and CD11b+ cells were enriched by magnetic cell sorting (Miltenyi Biotec, Bergisch Gladbach, Germany) as described [17]. The latter were used as an APC source and stained with 1 μg/mL DiD (Thermo Fisher Scientific, Waltham, MA, USA), a far-red dye for 30 min at 37°C.
2.4. Plasmids
Previously published 6132A cancer-specific CD8+ T cell clones (anti-6132A-A1, [12]) and cancer-specific CD4+ T cell clones (anti-mRPL9, [13]) were used for TCR gene isolation. TCRs were determined by 5’-RACE-PCR following manufacturer’s instructions (Thermo Fisher Scientific, Waltham, MA, USA) and were integrated into pMP71-PRE as described [18] (pMP71-anti-6132A-A1, -anti-mRPL9). For selection of TCR-positive T cells, pMP71-anti-mRPL9-IRES-GFP or pMP71-anti-6132A-A1-IRES-mCherry were generated [19]. In brief, pMP71-TCR plasmids were digested with EcoRI (NEB, Ipswich, MA, USA) and NotI (NEB), followed by incubation with Klenow (NEB) to create TCR blunt end fragments. The pMP71-IRES-GFP or pMP71-IRES-mCherry vectors were digested with PmlI (NEB) followed by dephosphorylation with CLIP (NEB). TCR fragments and opened pMP71-IRES-GFP or pMP71-IRES-mCherry vector were ligated to generate color-linked TCR expression vectors pMP71-anti-A1-IRES-mCherry and pMP71-anti-mL9-IRES-GFP.
2.5. TCR gene transfer
TCR gene transfer was conducted as previously described [17]. Plat-E packaging cells were transfected with pMP71-anti-6132A-A1-IRES-mCherry or pMP71-anti-mRPL9-IRES-GFP by calcium phosphate precipitation. 42 h after transfection, virus supernatant was harvested, filtered through a 0.45 μm syringe filter (Thermo Fisher Scientific, Waltham, MA, USA) and used for transduction. Spleens were isolated from C3H CD8−/− or C3H CD4−/− mice, and erythrocytes were lysed with TRIS ammonium chloride. Cells were incubated in Roswell Park Memorial Institute medium (RPMI 1640 (Corning Life Sciences, Tewksbury, MA, USA) + 10% FBS (Gemini Bio-Products, West Sacramento, CA, USA), 2 mM L-glutamine, 50 μM 2-mercaptoethanol, 1 mM sodium pyruvate, 0.1 mM non-essential amino acids, 100 U/mL penicillin, 100 μg/mL streptomycin and 50 μg/mL gentamycin (all Thermo Fisher Scientific, Waltham, MA, USA) supplemented with 40 U/mL recombinant human IL-2 (Peprotech, Rocky Hill, NJ, USA) and the cell suspension was transferred into a 24-Well plate (Greiner Bio-One, Kremsmünster, Austria) coated with 1.4 μg/mL α-CD3 (University of Chicago, Frank W. Fitch Monoclonal Antibody Facility, Clone 145–2C11.1) and 0.2 μg/mL α-CD28 (Biolegend, San Diego, CA, USA, Clone 37.51) at a concentration of 2.5 × 10⁶ cells/mL. On the first day after spleen removal, corresponding virus supernatant with 4 μg/mL protamine sulfate (Millipore Sigma, St. Louis, MO, USA) was added and cells were spinoculated (800 × g, 90 min, 32 °C). On the second day a 12-Well plate (Greiner Bio-One) was coated with RetroNectin (12.5 μg/mL, TaKaRa, Otsu, Japan) and centrifuged with virus supernatant (3000 × g, 90 min, 4 °C). Afterwards 5 × 10⁶ either CD8+ T cells in medium containing 50 ng/mL recombinant human IL-15 (Peprotech) or same amounts of CD4+ T cells in medium with 40 U/mL IL-2, were transferred to the coated 12-well plate and followed by spinoculation (800 × g, 30 min, 32 °C). TCR-transduced CD8+ T cells were used after 12 days for in vitro imaging, while TCR-transduced CD4+ T cells were used after 4 days, respectively.
2.6. Imaging
6132A cancer cells and CD11b+ cells were cultured overnight in a 35 mm glass-bottom dish (MatTek, Ashland, MA, USA), containing 2.5 mL culture medium, consisting of RPMI 1640 w/o riboflavin (US Biological, Salem, MA, USA) with 10 % FBS (Gemini Bio-Products, West Sacramento, CA, USA), 2 mM glutamine, 50 μM 2-mercaptoethanol, 1 mM sodium pyruvate, 0.1 mM non-essential amino acids, 100 U/mL penicillin, 100 μg/mL streptomycin and 50 μg/mL gentamycin (all purchased from Invitrogen, Carlsbad, CA, USA). The dish was then transferred under the microscope the following morning. Imaging was performed with an Olympus VivaView incubator-based, epifluorescence microscope (Olympus Corporation of the Americas, Center Valley, PA, USA) and run by MetaMorph software (Molecular Devices LLC, Sunnyvale, CA, USA). Incubator settings were kept at 37 °C and 5 % CO2. Upon placing the dish under the microscope, positions with appropriate numbers of cancer cells (between 3 and 10) were recorded, and 500 μL T cells resuspended in the same culture medium were added afterwards. The montage was set up to proceed from left to right, top to bottom for eight rows and eight columns (8 × 8, Fig. S1). This sequence of images corresponds to Fiji’s built-in montage feature. Each 8 × 8 montage time-point took 25 minutes to image. Following this, four 2 × 2 montages were chosen (433 × 330 μm), equally spaced from one another, from within the 8 × 8 montage. The 2 × 2 montages were imaged one at a time every 90 seconds for 5.5 hours, with the 8 × 8 montage recorded in between (Fig. S1). An infrared differential interference contrast (DIC) channel and 4 color channels were used (CFP, Cy5, GFP, RFP). The CFP channel used excitation at 436/20 (center/bandpass; nm) with a 480/40 filter to capture the Cerulean emission at 458 nm (Fig. 1A). The Cy5 channel used a 700/75 filter, with excitation at 620/60, to capture the DiD, which emits at 665 nm (Fig. 1B). The GFP channel used excitation at 470–495 nm with a 515/25 filter to capture the EGFP emission at 510 nm (Fig 1C). The RFP channel used excitation at 530–550 nm with a 593/46 filter to capture the mCherry emission at 610 nm (Fig. 1D).
Fig. 1. Example of the distribution of the four cell types as seen through the microscope.
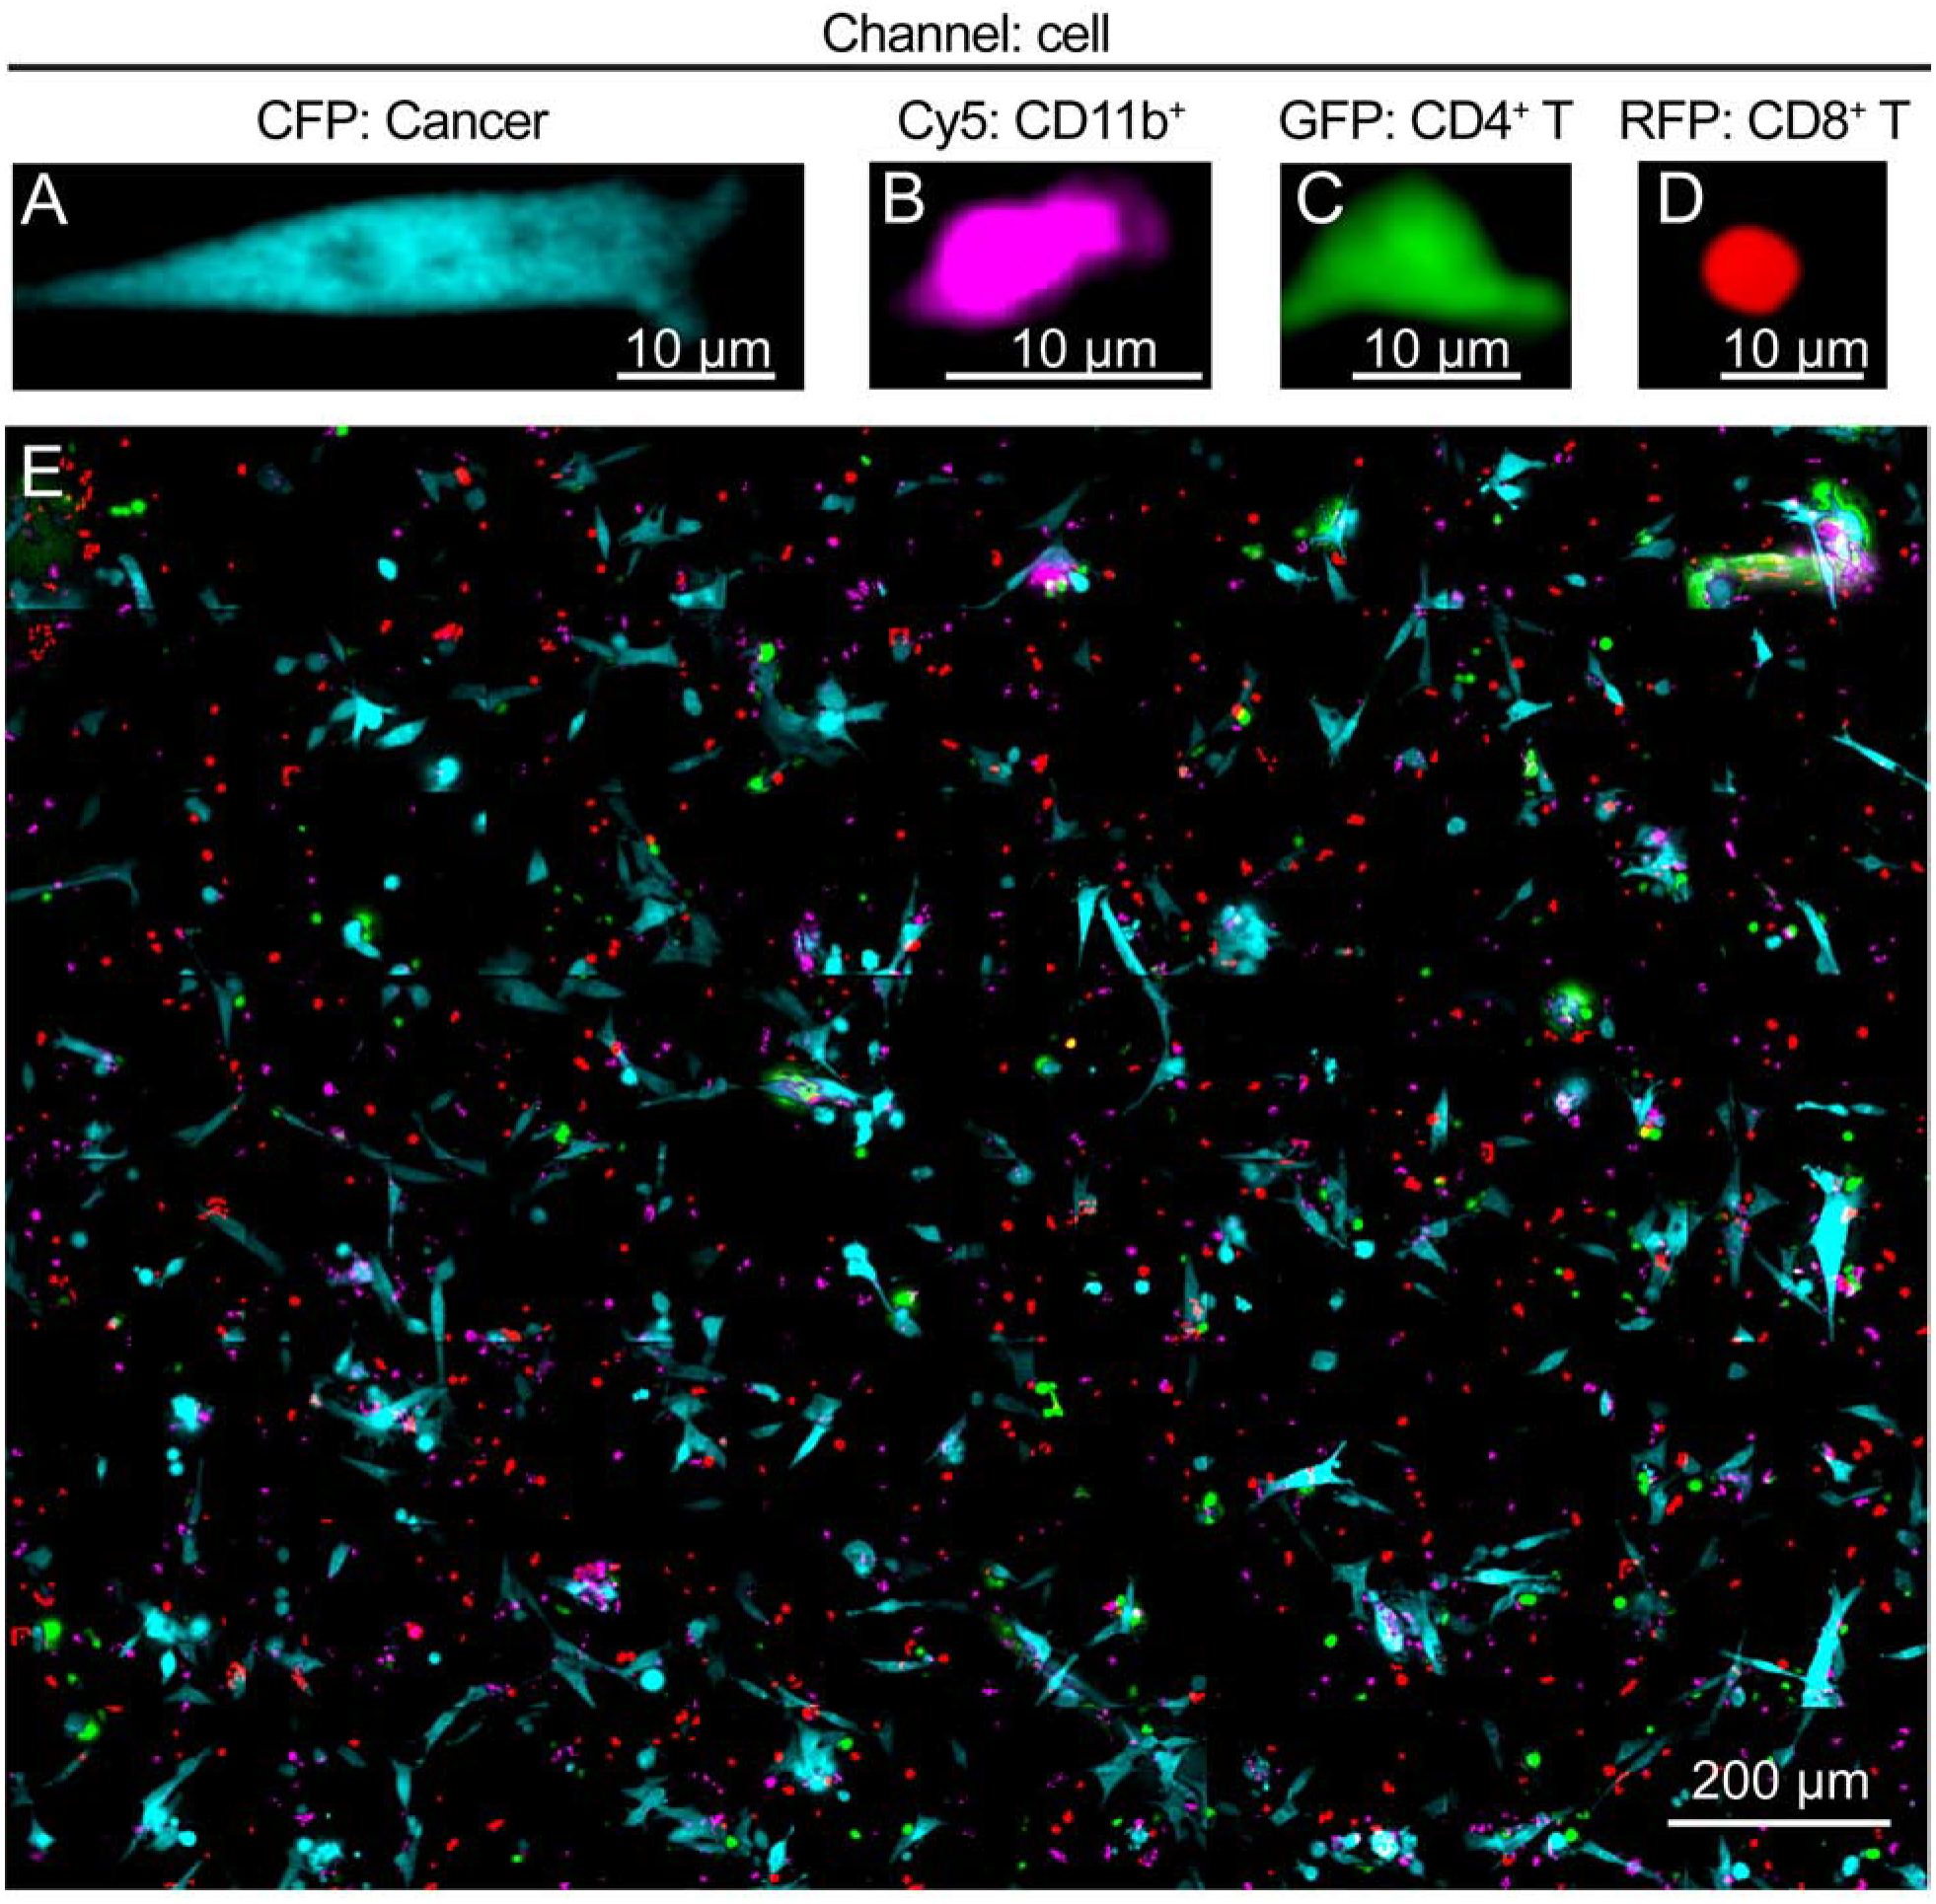
(A – D) Examples of images of the four cell types are shown: (A) 6132A cerulean positive cancer cells (blue), (B) DiD stained CD11b+ cells (magenta) isolated from spleen of C3H/HeN mice together, (C) 6132A-specific, TCR-transduced CD4+ T cells (GFP, green) and (D) 6132A-specific, TCR-transduced CD8+ T cells (mCherry, red). (E) shows an example of the even distribution of the four cell types throughout the entire area of an 8 × 8 montage. This 8 × 8 image is used to ensure that the four 2 × 2 time-lapsed positions are representative of the broader area of the 8 × 8 montage. See Materials and Methods for details.
2.7. Image Analysis
Images were analyzed using the Fiji distribution of ImageJ [20], and were gathered in sets of adjacent acquisition tiles, at multiple “z” planes (initially), where z position relates to the focus of the microscope, and sorted by color channel, x-y position, z-position and time point in separated files and analyzed using Fiji software [20]. The first step to the analysis involved processing the raw image data to decrease background noise and to remove bright outliers (e.g., large debris) from the background. Subsequently, the separate images were merged together into montages to display the whole imaged area. Each dataset was analyzed twice, once with “watershed” and once without. “Watershed” refers to a watershed segmentation algorithm that automatically separates objects in an image based on treating pixel intensity values as topography, and thus segments images according to the local minima between adjacent peaks.
2.7.1. Simulation
The simulation was based upon the cells in the real channels of each experiment. For each channel to be simulated, average cell counts, and sizes were tabulated for each cell. These data are summarized in Table S1 and were used to draw corresponding ovals in each of the channels of the desired dimensions using random number generators, such that each cell was placed randomly, and then moved randomly based on empirical data. Note that CD4+ T cells and CD8+ T cells appear to have different sizes due to differences in fluorescence of their fluorescent proteins, and that these discrepancies were mimicked in the simulation for best accuracy. The standard deviation of the velocity was calculated by tracking 10 cells of each type over 100 time points (sometimes fewer if the cells disappeared) for a total of 800–1000 measurements of step size between frames. The resulting distribution was highly concentrated at 0, with a long tail extending towards high values. In order to approximate this distribution, the data points were duplicated, and the second copy was multiplied by negative 1. This made the distribution appear much closer to a Gaussian distribution. Thus, the average velocity was 0, and the standard deviation could be calculated with its center at 0 and used in the simulation. The simulation macro decomposed the standard deviation into x and y by multiplying by the square root of 2. This value was then multiplied by a Gaussian-distributed random number with standard deviation of 1, centered at 0, such that the simulated cells were given a positive or negative movement in x and y, and had approximately the same velocity distribution as the real cells. These x and y movement values were then added to the prior (x, y) coordinates of the cell.
The simulation utilizes periodic boundary conditions, wherein each cell that leaves the bounds of the simulation is replaced by a cell entering on the other side of the montage. This approximation is typical in particle simulations and relies on assuming relatively constant density of particles and the approximation of the imaged area to be very small compared to the total area. Each 2 × 2 field of view is 1.431 × 10⁻⁷ m2 (433.31 μm × 330.14 μm). The total area covered by cells is 1.539 × 10⁻⁵ m2 ((7 mm)2 * π). Thus, each 2 × 2 area corresponds to 0.09293 % of the total dish, or approximately 1/1076 of the dish, validating the approximation that the dish’s total area was much larger than the imaged area, allowing for the usage of periodic boundary conditions.
Each simulation was repeated five times and run through the cluster macro. The average count of each cluster type at each time point was averaged and graphed as an analog to the real data.
2.8. Graphical Analysis
Spline fits were conducted using RStudio’s ggplot2 package [21–23]. The default settings for geom_spline were used for all plots: mapping = NULL, data = NULL, stat = “spline”, position = “identity”, na.rm = FALSE, show.legend = NA, inherit.aes = TRUE, weight = NULL, df = NULL, spar = NULL, cv = FALSE, all.knots = FALSE, nknots = stats::.nknots.smspl, df.offset = 0, penalty = 1, control.spar = list(), tol = NULL.
2.9. Statistical Analysis
Statistical analysis was performed with RStudio [22]. Students t-tests were used to determine significant differences between means of cluster counts over 220 time points per position. P-values were then determined from the test statistic. Each test used data from two positions, with watershed-applied and watershed-absent data, such that the degree of freedom was 3 each time.
3. Results
3.1. In vitro time-lapse imaging reveals local four cell type cluster formation.
We started out by recording an 8 × 8 adjacent acquisition tile montage every 6 hours for 24 hours. We expected that a large number of cells would be involved in cell cluster formation, surrounding many cancer cells at once, and that clusters would be visible on a macroscopic scale throughout the entire 8 × 8 montage for the first 24 hours. Surprisingly, we found that cells were evenly distributed and seemed to not associate with each other (Fig. 1). Therefore, we proceeded with an 8 × 8 montage setup that surrounded various 2 × 2 positions (Fig. S1), which were imaged much more frequently to capture shorter-term cell clustering behavior. We relied upon these 2 × 2 subsample montages in order to capture a reasonably wide area without sacrificing the short-term imaging intervals necessary for analyzing the unexpectedly fast-moving cells. Each 2 × 2 position was switched to another within the 8 × 8 boundary every six hours, so as to minimize any phototoxic effects that light exposure might have on the cells, and multiple positions were recorded. The 8 × 8 montages were used as a checkup method to ensure that each 2 × 2 position was representative of the larger environment. When examining initial images from the 2 × 2 montage, we saw that cancer cells were rather evenly distributed and appeared to come into contact with up to three cells of other types, but with no obvious agglomeration that was evident to the naked eye (Fig. 2). This lack of aggregation suggested that a more sophisticated cluster analysis tool would be necessary to quantify clustering patterns.
Fig. 2. Four cell type cluster formation is not efficiently detectable by eye, even in a 2 × 2 montage.
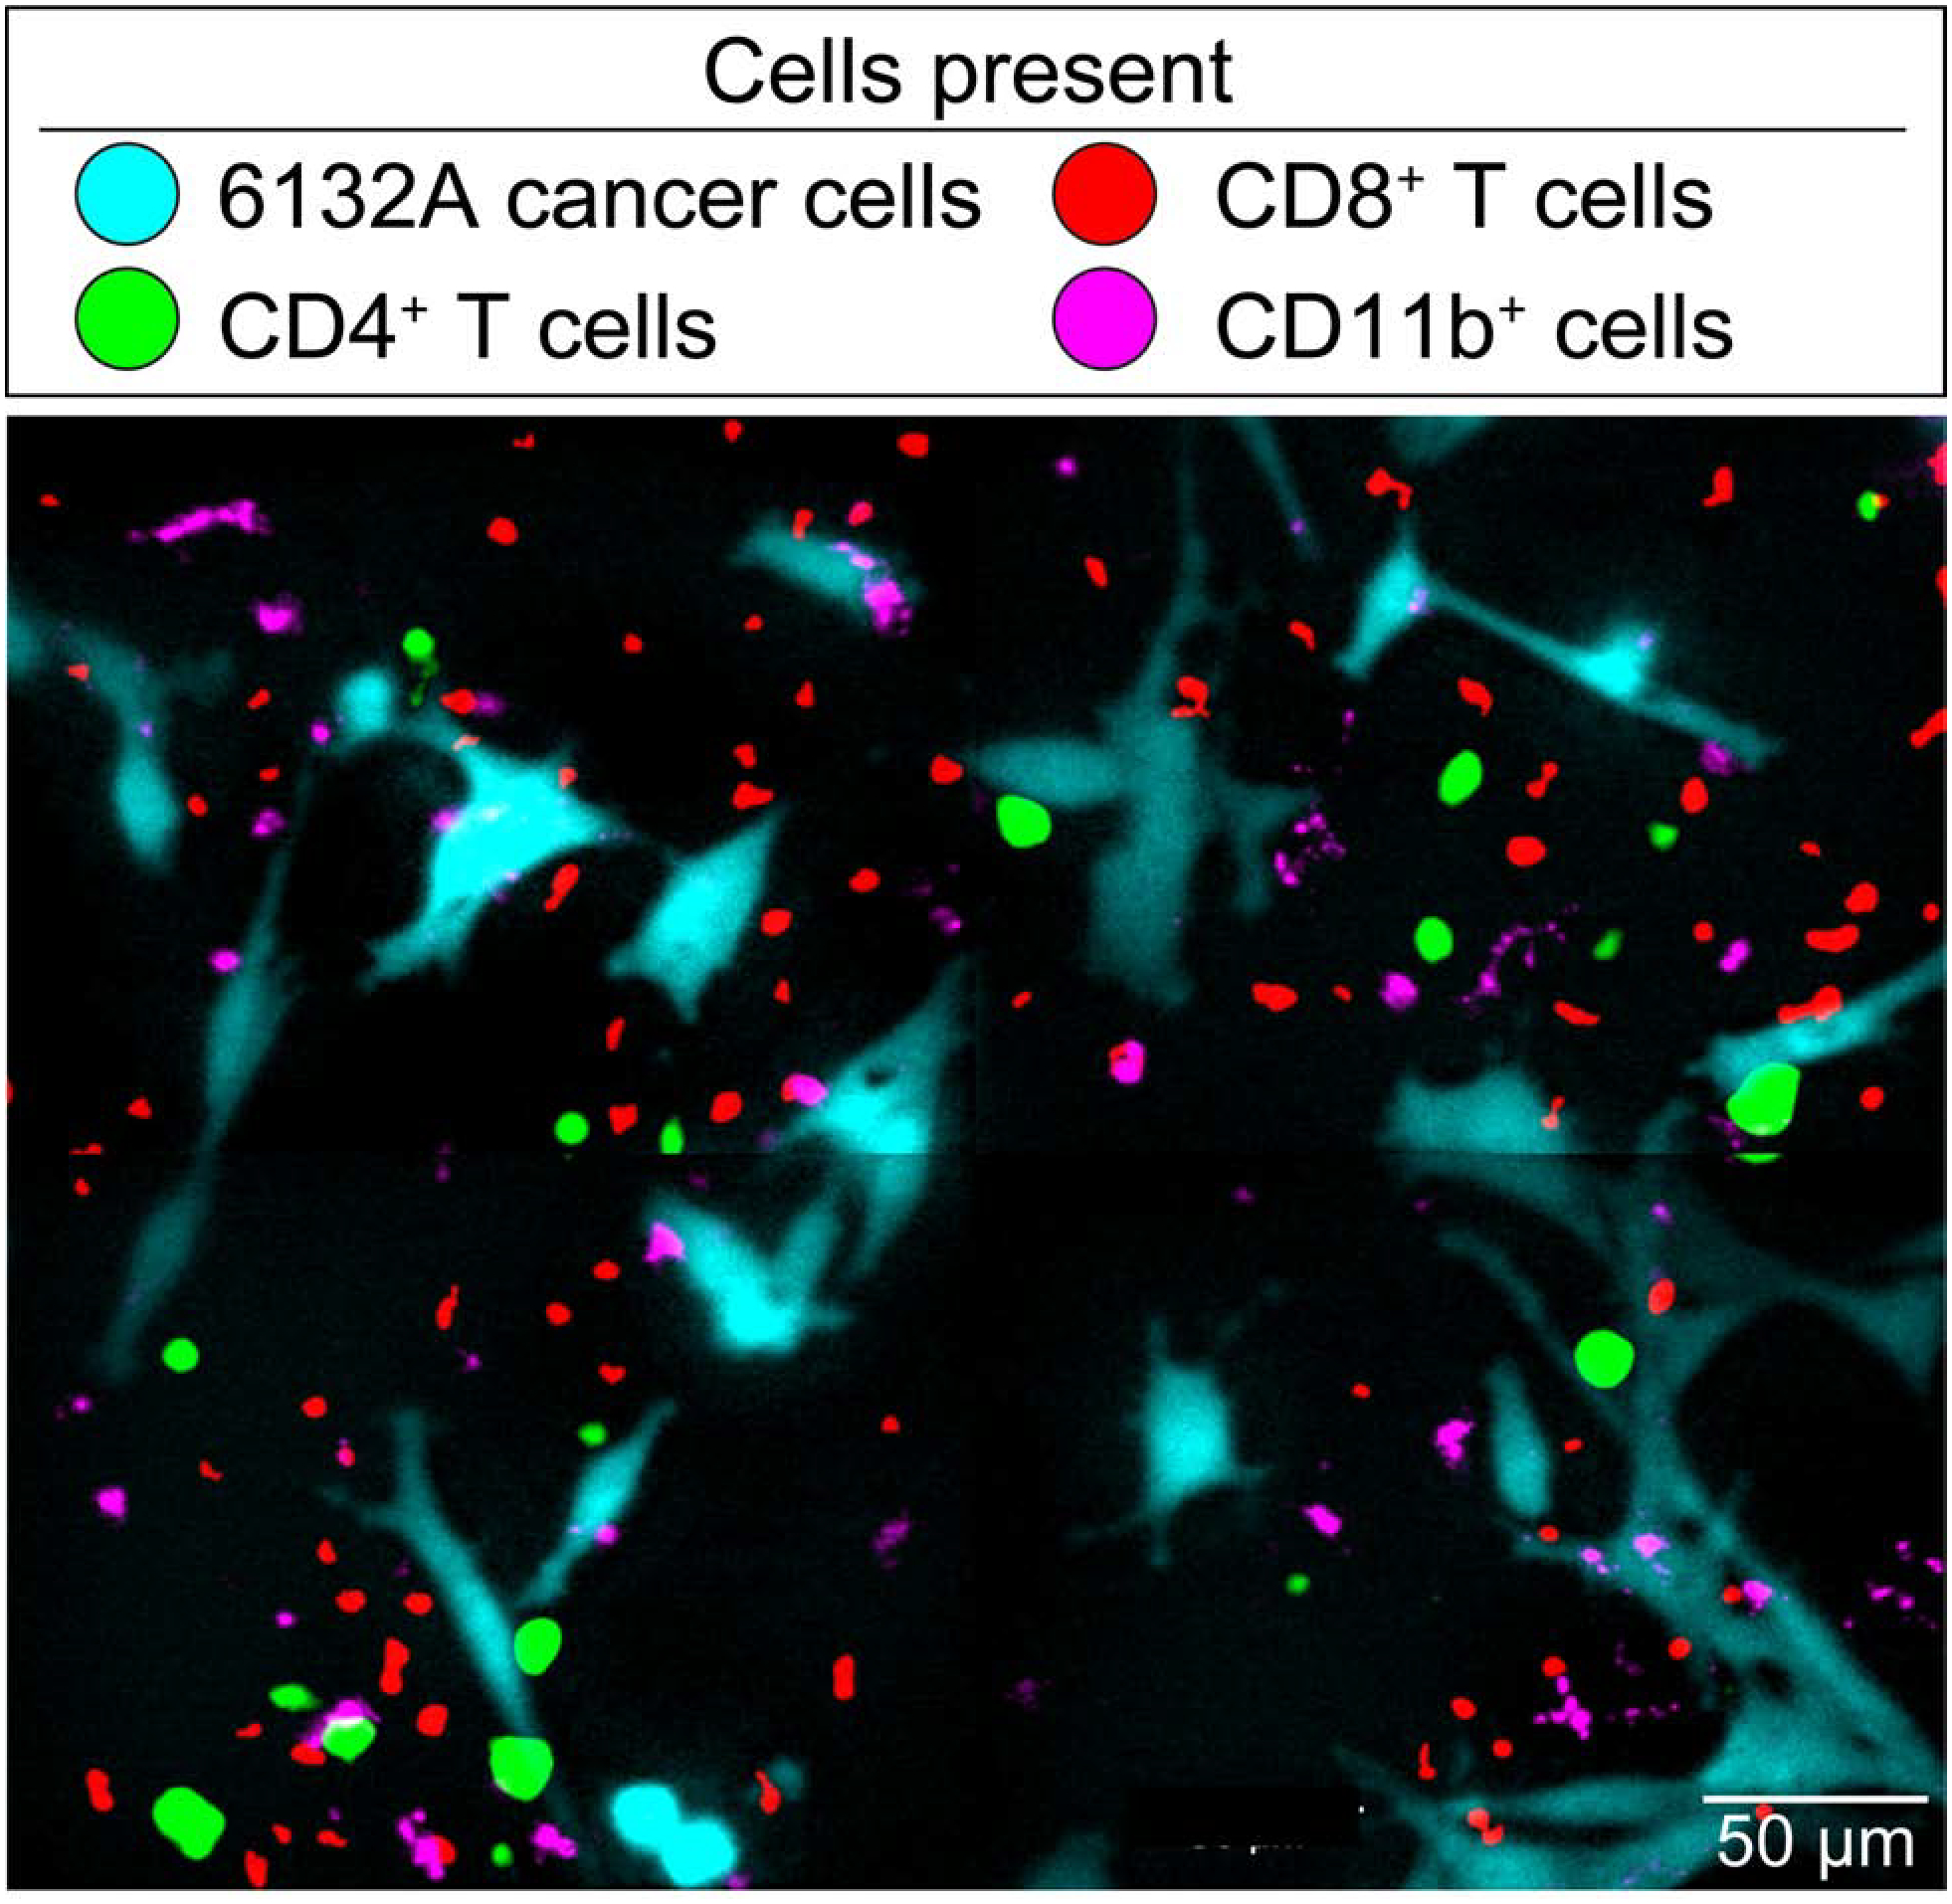
Representative 2 × 2 montage using time-lapse Olympus VivaView microscopy. The image shows 6132A cerulean-positive cancer cells (blue) with DiD-stained CD11b+ cells (magenta) together with 6132A-specific, TCR-transduced CD8+ T cells (mCherry, red) and 6132A-specific, TCR-transduced CD4+ T cells (GFP, green). See Materials and Methods for details.
3.2. Automated cell cluster analysis detects multi-cell associations around cancer cells.
We wanted to understand whether these clusters were occurring randomly due to the density of the cells, or whether the clusters occurred due to the cells’ own proclivity to cluster with one another around or on cancer cells. To quantify the interactions that occurred around the cancer cells, we used Fiji, an open-source platform for biological-image analysis [20], to develop a computer algorithm, or macro, to automatically find and classify cell clusters. This macro consists of seven steps, operates on one time point at a time, and requires preprocessed image data without background to avoid miscounts (Fig. 3). In Step 1, brightness/contrast levels are manually chosen based on the first montaged image and used to determine a signal threshold for reference and consistency throughout all time points. In Step 2, the macro then displays a binary mask, or black and white image, of the cancer cell channel, and records the size, location, and shape of each cell. It then creates binary masks of the other channels and compares the locations of cells in each of these channels to the cancer cell channel, annotating (Step 3) which cancer cells overlap with which other channels. This process can be visualized as an overlay of the cancer channel, (CFP channel) with other channels, such as GFP (Fig. 3). The macro selects the cancer cells that have more than 10 contiguous pixels overlapping with cells from other channels, an arbitrary threshold chosen to correspond to 0.26 μm2, which corresponds to approximately 1% of an average T cell’s area. This adjustable threshold minimizes inclusion of trivial contacts (a “touch”). Given a non-trivial contact, the macro records the target cancer cell as having an overlap, and repeats this process for each cancer cell and channel. This procedure iterates for every channel, but always considers cancer cells as the prerequisite for cluster determination, such that only overlaps between the CFP channel with each of the other channels are analyzed (Step 4). The macro then creates a “mask output”, which represents the overlaps between CFP and one of the other channels, for each channel (CFP-GFP, CFP-RFP, and CFP-Cy5).
Fig. 3. Computational steps involved in the cell cluster-finding macro.
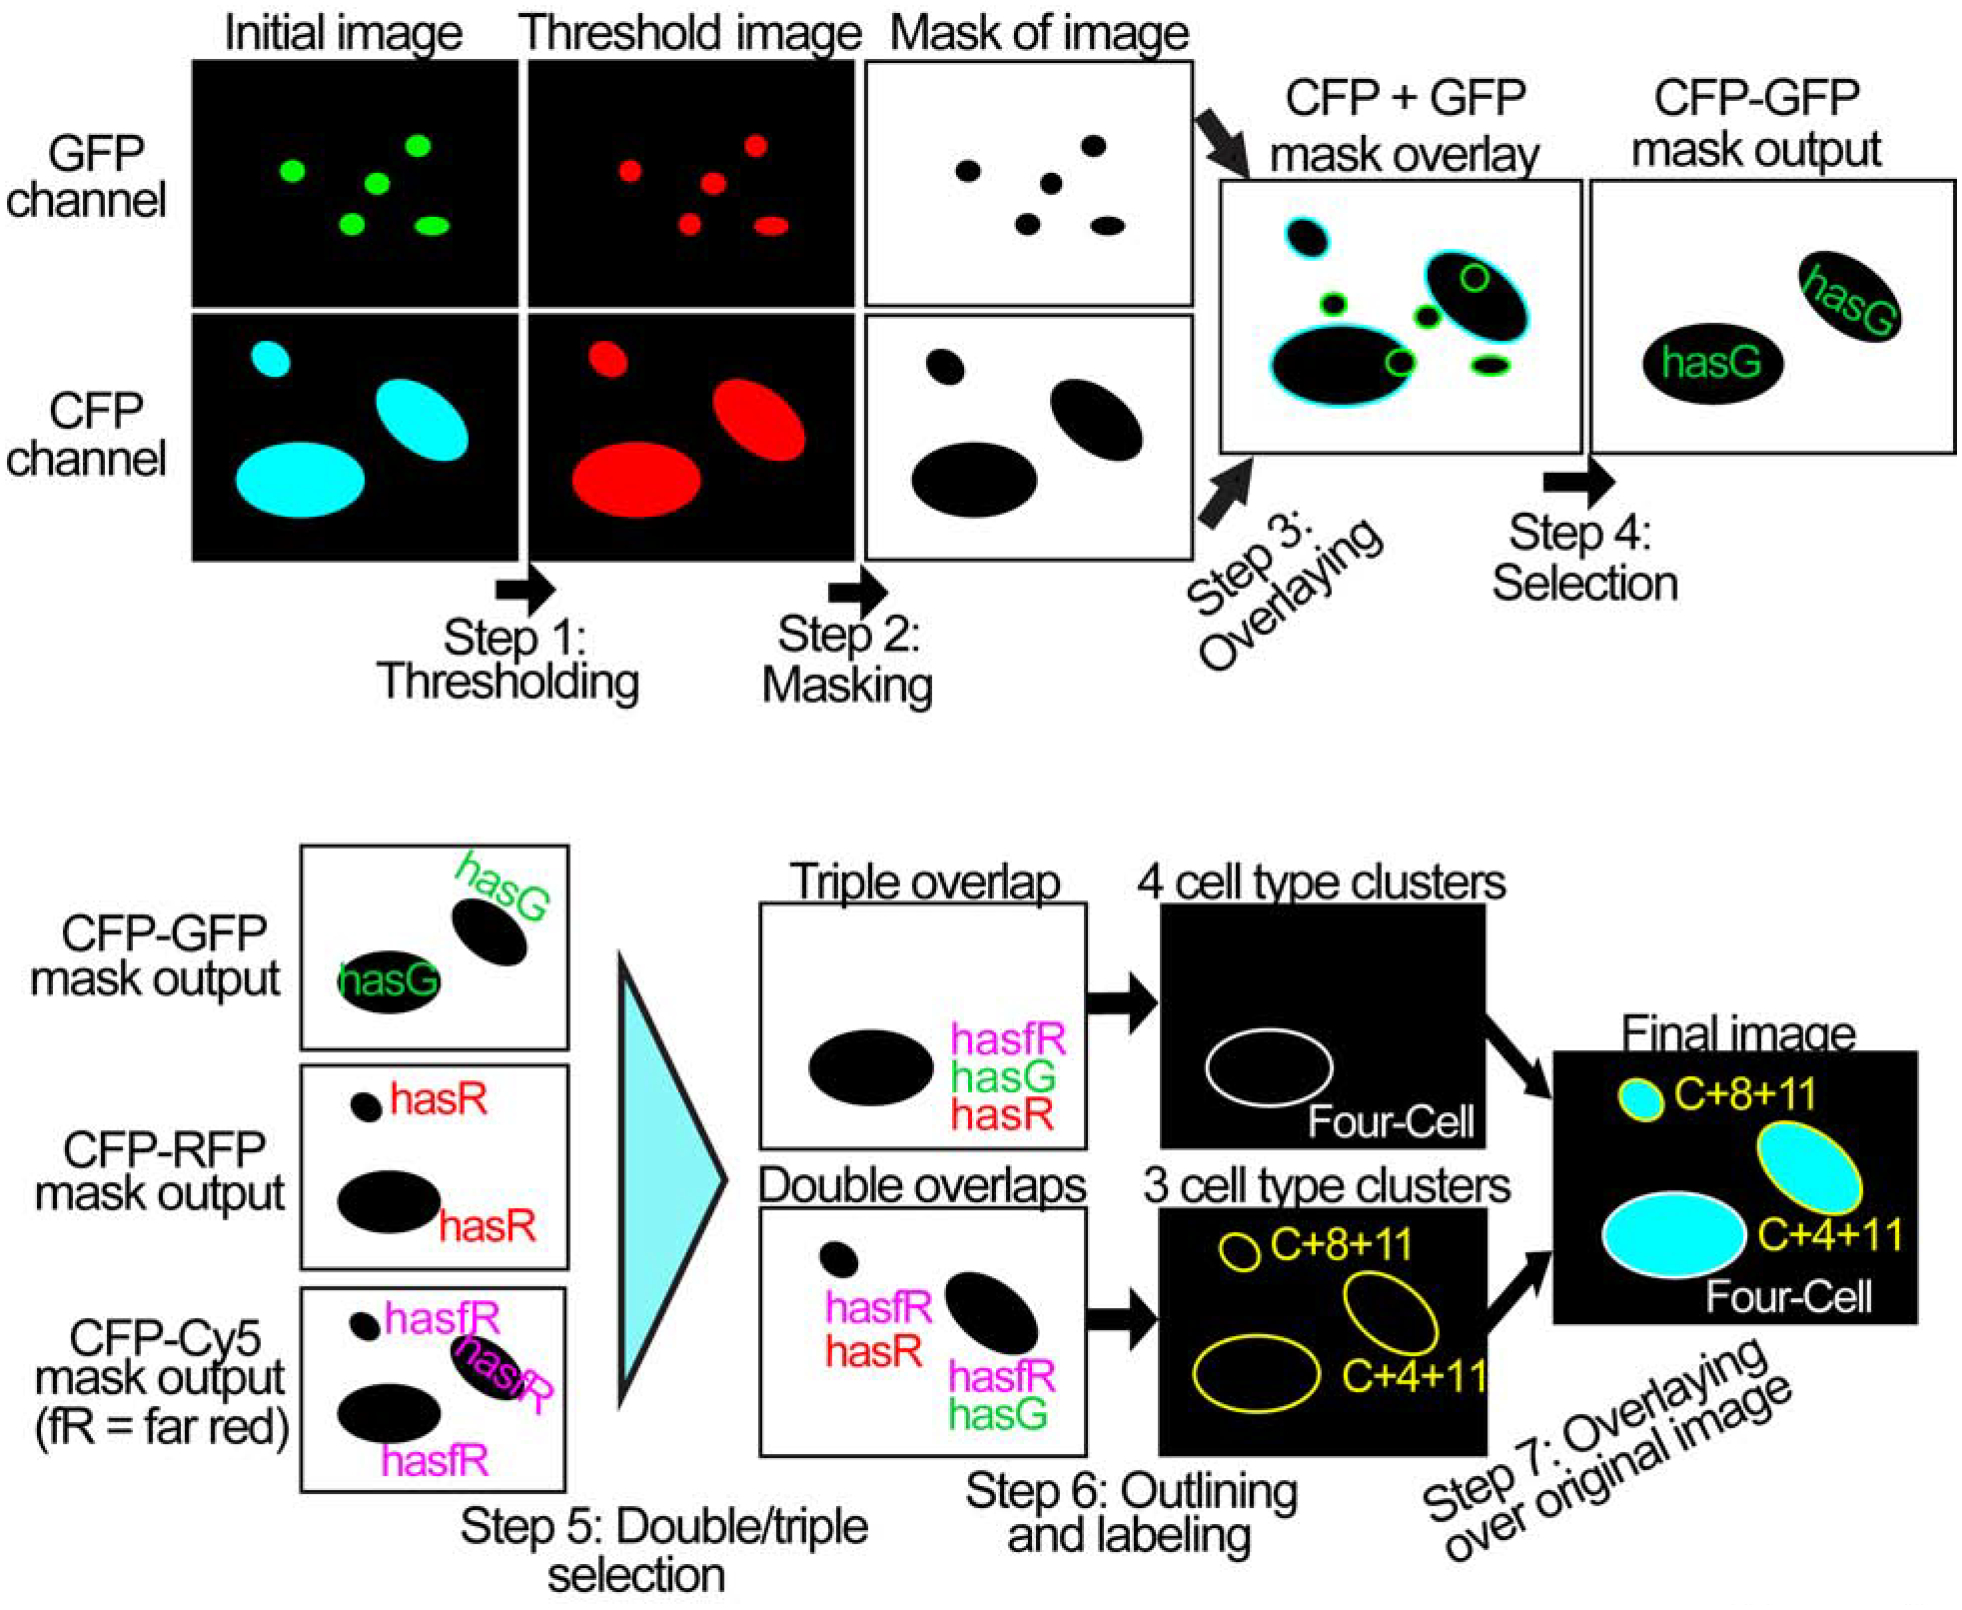
In the first row, the macro begins with background-subtraction, thresholding the image, and creating a binary mask, followed by combining mask overlays of different channels and selecting pairwise overlaps with cancer cells. After this, the overlap of cancer cells with the GFP channels is marked as “hasG” and repeated for the other channels accordingly to form the “mask output.” In the next row, the various “mask outputs” from the GFP, RFP, and Cy5 channels are combined via Boolean “AND” operations, which distinguish each cancer cell by which other cells are present at overlapping spatial coordinates. This is used to form double and triple overlaps, which correspond to different cluster types. The clusters are combined with the original cancer cell image to create a final image output with labels and outlines. These images are representations for easier understanding, and do not correspond directly to actual images produced by the software.
The macro then uses Fiji’s “AND” image calculator to perform a series of Boolean “AND” operations for each cell in each of the “mask outputs” (Fig. 3, Step 5). This works by determining whether each cell in a given “mask output” matches up with the corresponding cell in the other “mask outputs.” The macro then selects cancer cells with overlaps that occur doubly or triply, before outlining and labeling these accordingly (Fig. 3, Steps 5 to 6) in the output stack. If the CFP channel overlaps with all other channels (GFP, RFP, Cy5) the macro outputs a white “Four-Cell” cluster label next to the cancer cell, outlined in white (Fig. 3, Step 7), and also records the occurrence in a numerical output. This marker indicates that the cancer cell overlaps with CD11b+ cells, CD4+ and CD8+ T cells. An overlap of CFP with RFP and GFP is marked as a “C+4+8” cluster, showing that cancer cells interact with CD4+ and CD8+ T cells. The “C+4+11” cluster represents an overlap of cancer cells with CD11b+ cells and CD4+ T cells (here CFP overlap with Cy5 and GFP). Likewise, the “C+8+11” cluster shows overlapping cancer cells with CD11b+ cells and CD8+ T cells (CFP with Cy5 and RFP). In addition, the macro outputs information about the number of cancer cells, the number of overlaps of each of the other cell types, as well as the counts of each cell cluster at every time point. The final image output contains all time points and seven channels: the four different color cell channels, an infrared DIC channel, a sixth channel of white four-cell type cluster outlines and corresponding “Four-Cell” labels, and a seventh channel containing the three categories of three-cell type clusters with yellow outlines and labels (Fig. 3, Step 7). This display facilitates visual verification of cell detections, cluster classifications, and of accuracy of event scoring. The overlaps of cancer cells with only one other cell type are not marked in the final output, but are counted.
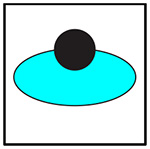
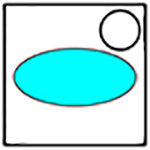
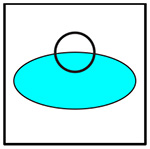
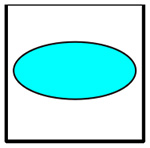
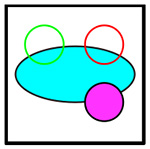
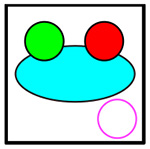
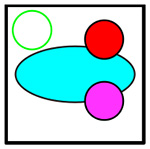
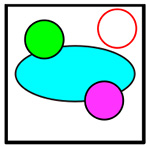
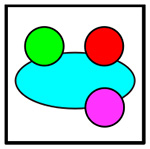
In order to concisely represent each of the clusters and show which cells are present in each imaging dish, a logo schematic was developed, in which the cyan-colored cancer cell forms the basis of each cluster. In Table 1, a black circle is used to represent any given immune cell. The filled in circle indicates that the cell is present in both the dish and the cluster. The empty circle not overlapping the cancer cell represents a cell that is present in the dish but is absent from the cluster. The empty circle overlapping the cancer cell represents a cell that is present in the dish, and possibly part of a cluster, but is ignored for the analysis. If a cell’s color is not present in the logo, that means that cell is not present in the dish being imaged. All of the studied cluster types are summarized in Table 2. Each studied cluster’s logo, code, cells involved, and cluster macro outline type are displayed.
Table 1:
Key to understanding cluster logos.
| Logo | Cell in cluster |
|---|---|
 |
Yes |
 |
No |
 |
Ignored |
Table 2:
Cluster types recognized by the automated cluster-finding macro.
| Logo | Code | Cells Involved | Outline |
|---|---|---|---|
 |
C | 6132A Cancer | None |
 |
C+11 | Cancer, CD11b+ | None |
 |
C+4+8 | Cancer, CD4+ T, CD8+ T | Yellow |
 |
C+8+11 | Cancer, CD8+ T, CD11b+ | Yellow |
 |
C+4+11 | Cancer, CD4+ T, CD11b+ | Yellow |
 |
Four-Cell | Cancer, CD4+ T, CD8+ T, CD11b+ | White |
For a non-diagrammatic, realistic view of the cluster macro outputs from the software, Fig. 4 shows the specific steps representing imaged cell data. In Step 1, the user-determined thresholding occurs. Steps 2–6 are then conducted in the back-end of the software, which eventually outputs the 3 and 4 cell-type cluster outlines. Finally, Step 7, the overlaying of these outlines over the initial image, is shown. Furthermore, representations of each of the important cell cluster types are shown in Fig. 5. When looking at these macro outputs, it is important to note that the classification of the cluster does not depend on the number of cells of a given type. In addition, two-cell interactions are counted regardless of whether they also can be classified as three or four-cell interactions, i.e. C+11 clusters pertain to any cluster composition in addition to those with just cancer and CD11b+ cells, e.g. “C+4+11”, “C+8+11”, and “Four-Cell” clusters (other two-cell clusters are counted in this same manner in Fig. S3). These nuances are also outlined in Table 1 and Table 2. Through this sequence of steps, the automated cell cluster-finding macro can detect cell associations around cancer cells.
Fig. 4. Image-processing using the established cell cluster-finding macro.
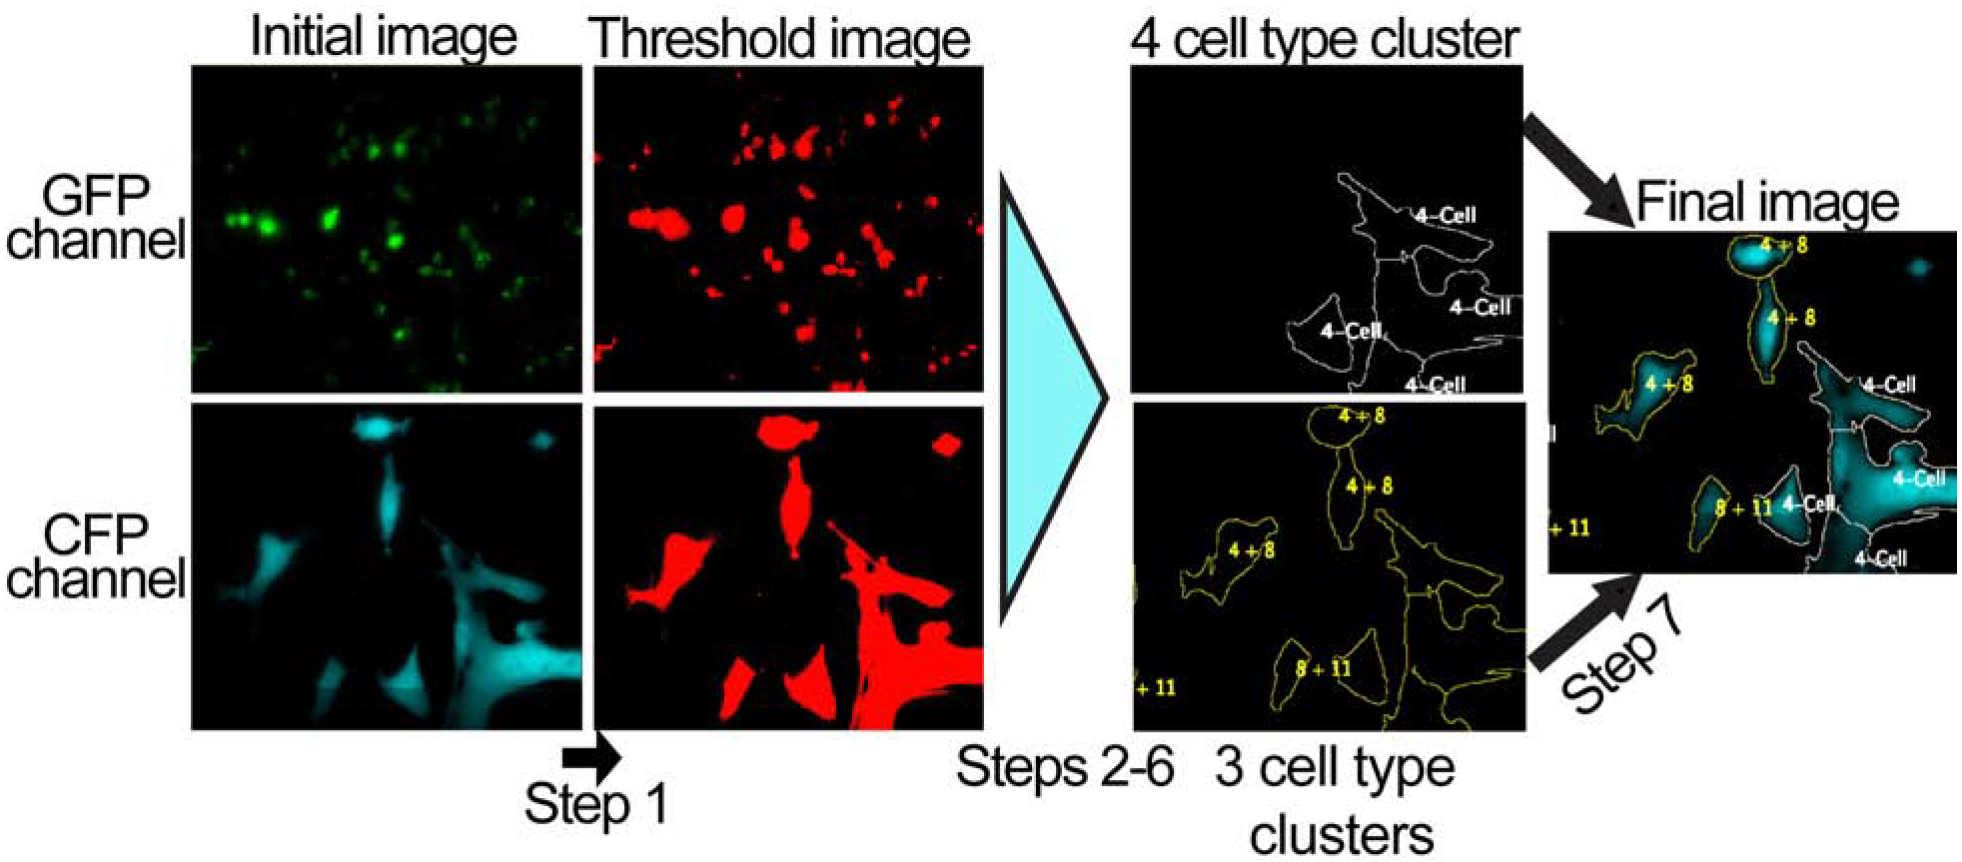
An example with imaged data files of Step 1 from Fig. 3 is shown, along with before and after images of Step 7. The other diagrammed steps from Fig. 3 occur in the background and are not represented on the computer screen.
Fig. 5. Examples of cell clusters detected by the macro.
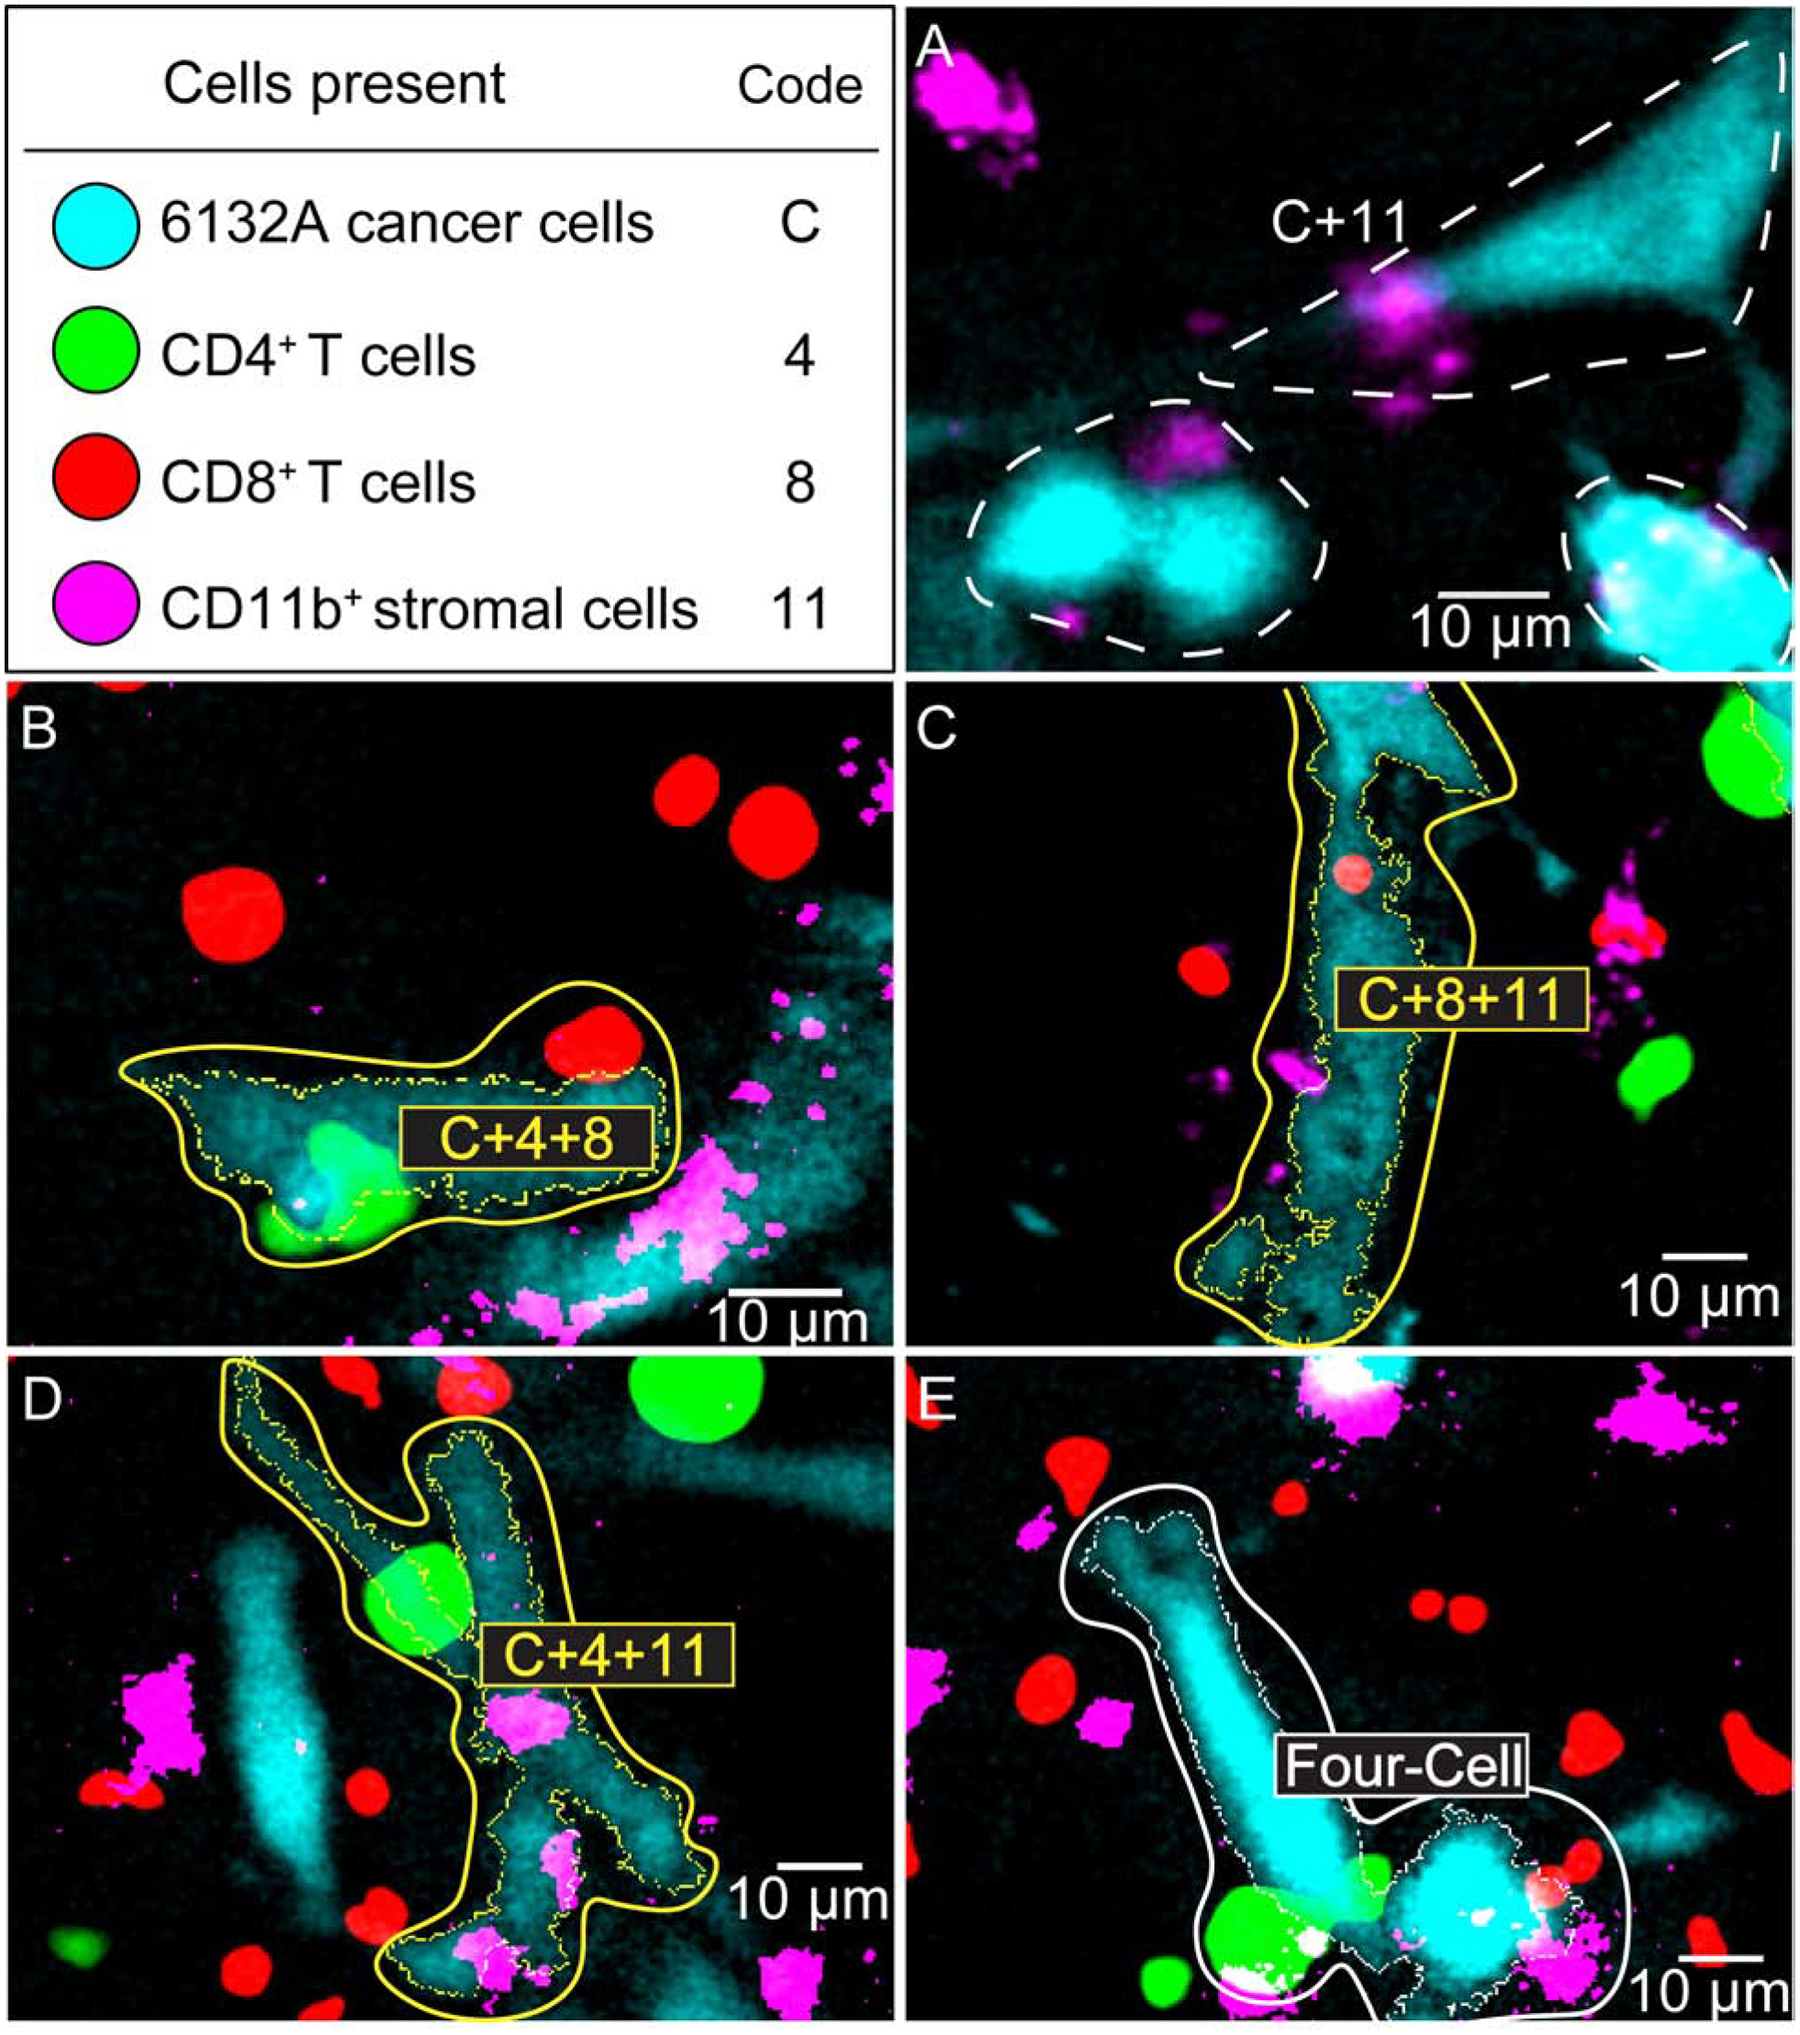
(A) The C+11 clusters are automatically counted by the macro but not labeled or outlined. They have therefore been manually encircled (dashed line) and labeled. Note that any other cluster that contains cancer and CD11b+ is also a C+11 cluster. (B – E) Examples of clusters that are automatically counted, outlined, and labeled by the macro, which only outlines the target cell of the cluster. The immune cells detected by the macro as part of the cluster are manually encircled to highlight the entire cluster. The labels have also been enhanced for legibility. (B) A “C+4+8” cluster. (C) A “C+8+11” cluster. (D) A “C+4+11” cluster. (E) A “Four-Cell” cluster. See Materials and Methods for details.
3.3. Automated cell cluster-finding macro identifies directed immune cluster formation.
The established automated cluster-finding macro allowed us to analyze the dynamics of cell cluster formation and compare these dynamics to simulated situations. The Fiji simulation macro, outlined in Materials and Methods, utilized the cancer cell images from the in vitro experiments, but with simulated immune cells instead of the imaged immune cells. We compared two different in vitro situations to the Fiji simulations: a three cell type situation with cancer cells, CD11b+ cells and CD8+ T cells; and a four cell type situation with cancer cells, CD11b+ cells, CD4+ and CD8+ T cells. These comparisons allowed us to get a sense of the capacity of the cluster-finding macro to differentiate situations involving “biased” and “unbiased” cells, where the bias is the proclivity to appear in clusters versus random motion. Each Fiji simulation was repeated five times with the same average cell count as the corresponding in vitro experiment, and these repeated simulations were averaged in order to account for variability between simulations. When comparing real (in vitro) and simulated videos after clustering, it can be seen that it is difficult to visually discriminate real and simulated cell movement (Videos 1–8). However, it is still possible to use the cluster-finding macro to find significant statistical evidence of differences in cell clustering behavior.
Looking first at the three cell type situation, we can clearly see a difference in the number of CD11b+ cells in clusters, with the “C+11” clusters appearing in far greater numbers in the real experiment (Fig. 6A and B, upper panels). In order to account for difficulties in splitting apart cancer cells, we are presenting the same data in Fig. 6A and 6B, but with alternative analyses (without and with watershed, respectively. See Materials and Methods section 2.7). In Fig. 6A, touching cancer cells were counted as a single “cluster” by the macro, while in Fig. 6B the macro attempted to split apart distinct cancer cells through automated watershed segmentation. Applying watershed to the cancer cells seemed to have minimal effect in terms of trends or numbers of clusters, though the watershed data has slightly more variability between frames. This variability could be due to inconsistency in the watershed algorithm, which might split the same cell differently from frame to frame due to minor variations in brightness. Representative videos of each of these clustering approaches are shown for real (Videos 1–2) and simulated cells (Videos 3–4). The numbers of both “C+11” and “C+8+11” clusters in the real experiment show quite a bit of variability in terms of overall numbers and in the scale of their oscillations, while in the simulation they stay relatively constant for two positions (Fig. 6, lower panel), with some minor oscillations. These distinctions suggest that there are stark differences in clustering behavior between the real immune cells and the simulated cells, and the macro is able to quantify these differences. Furthermore, a t-test confirms that the difference in the means of each of these clusters in the real vs the simulation is indeed significant (Table 3).
Fig. 6. Comparison of cell cluster formation between real and simulated immune cells in three cell type culture.
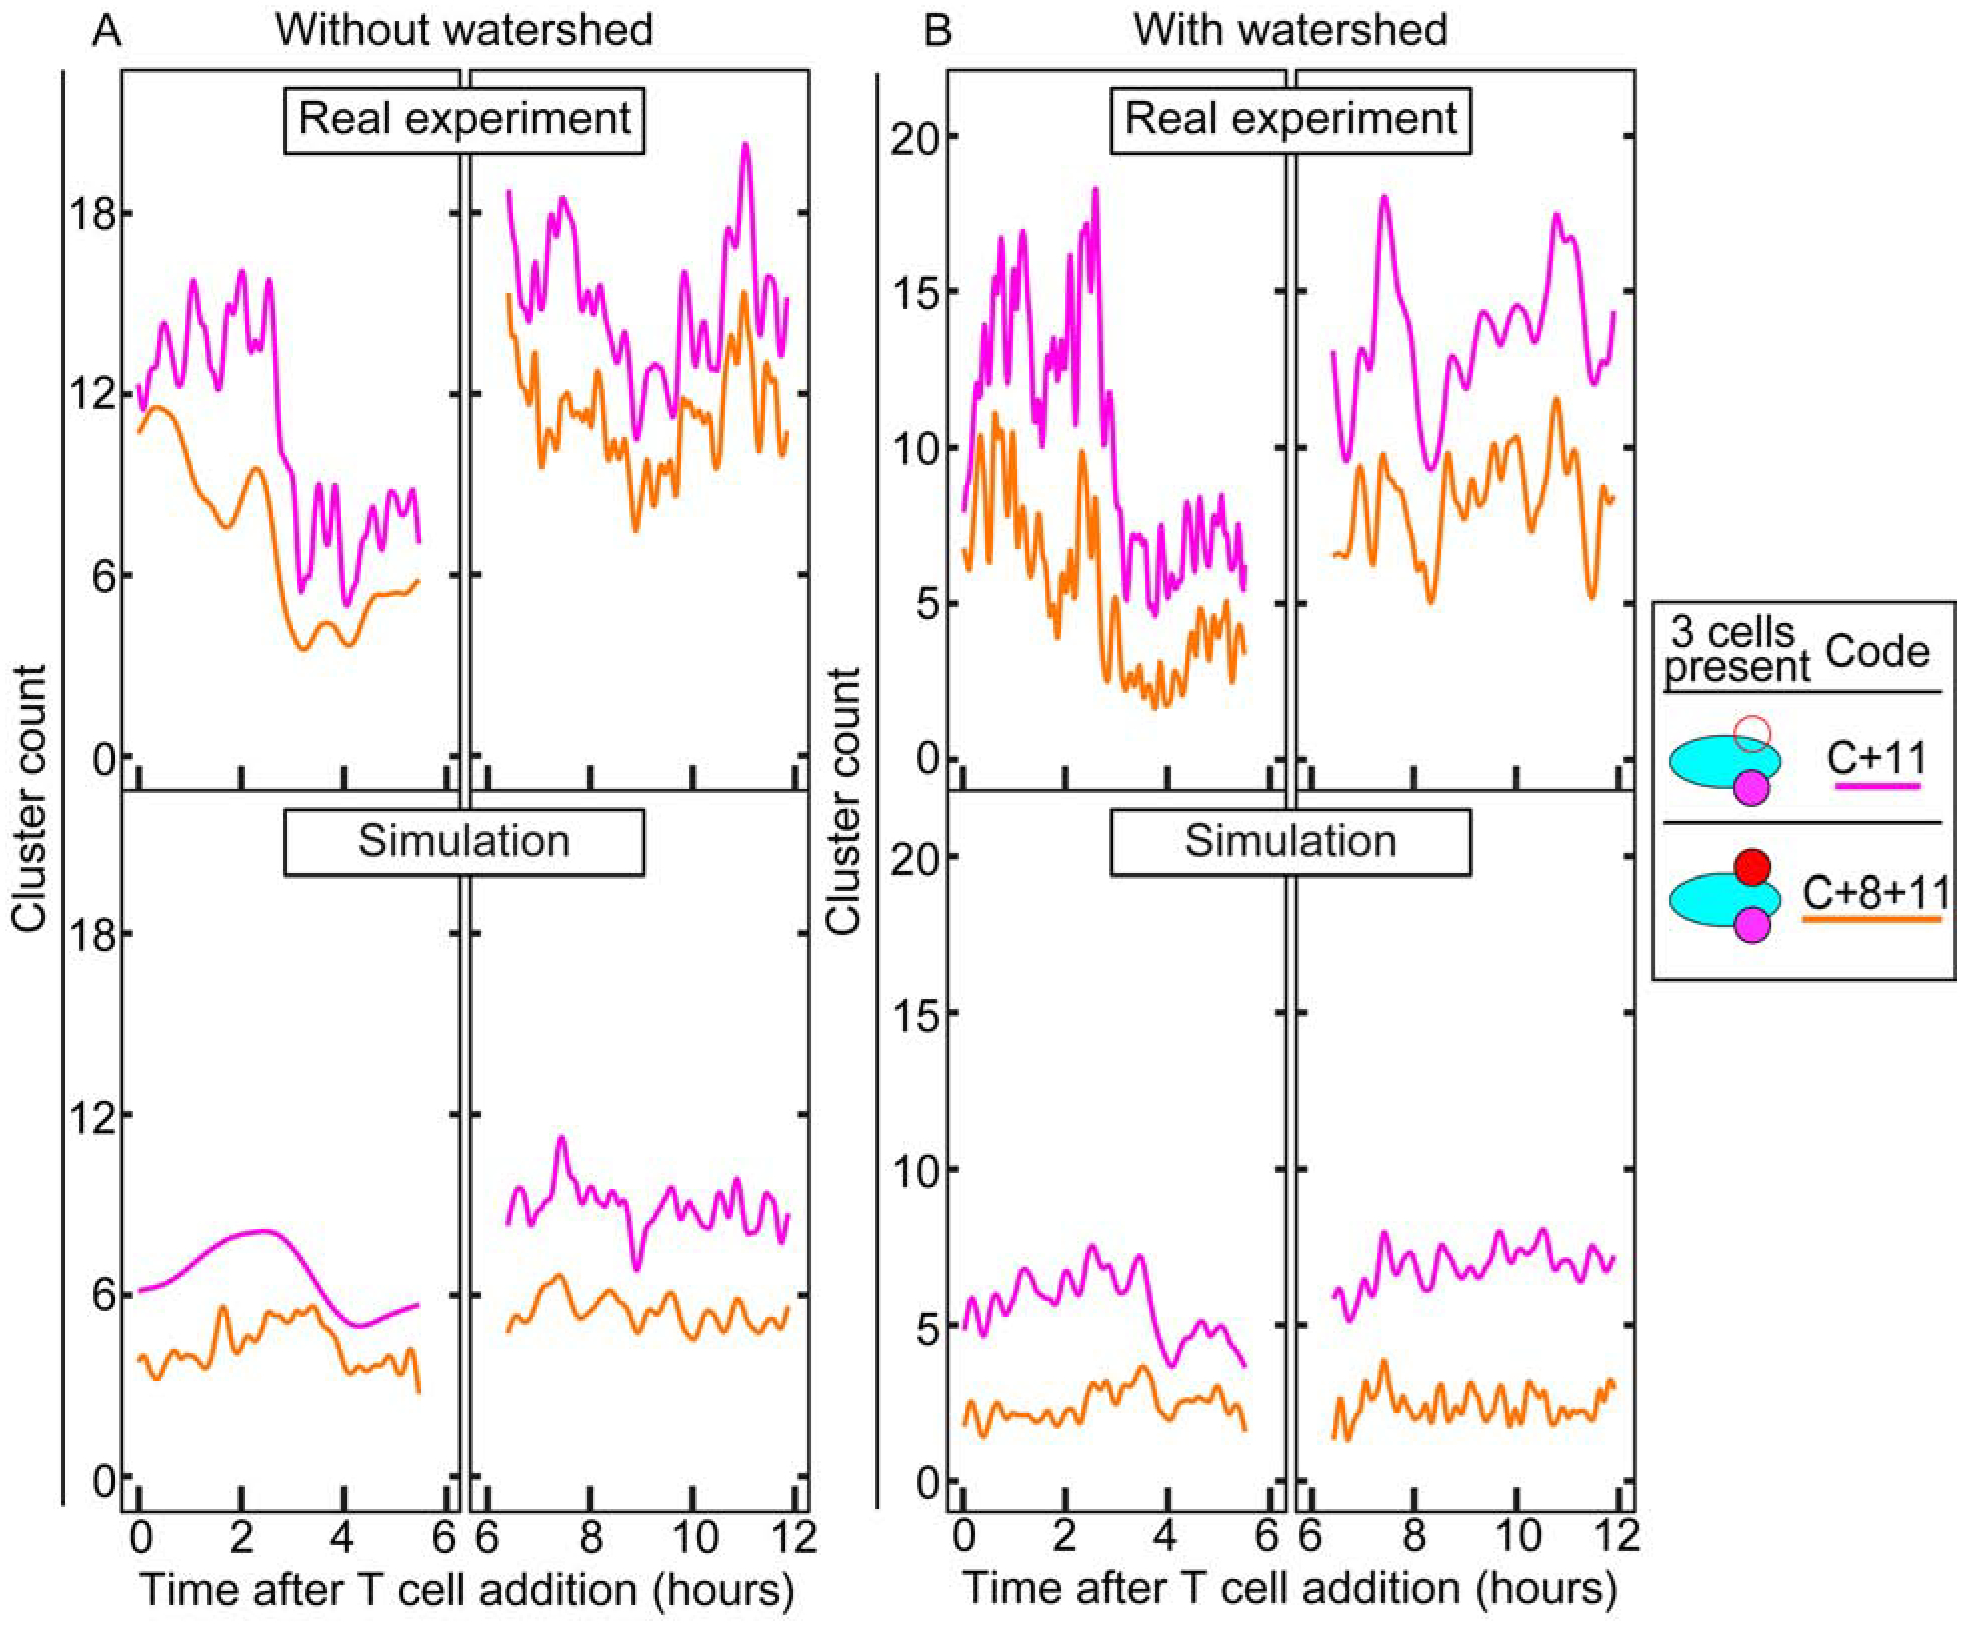
(A) The upper panel shows cell cluster analyses of the first 2 × 2 position from 0 – 6 h and the second 2 × 2 position from 6 – 12 h. The lower panel shows the simulation controls, using the real cancer cells with simulated immune cells. Statistical analysis shows significant differences between both measured cell clusters in the real and simulated experiments (Table 3). (B) Same data as A, but with watershed segmentation applied to automatically split touching cancer cells. The significant differences remain. See Materials and Methods for details.
Table 3:
Difference of means t statistic for cluster counts.
| Experiment | Cluster Type | Mean Count of Real (SE) | Mean Count of Simulation (SE) | t-statistic* | p-value | Significance |
|---|---|---|---|---|---|---|
| Three cell type | C+11 | 11.298 (2.096) | 6.388 (0.958) | 7.322 | 0.00526 | ** |
| C+8+11 | 7.185 (1.954) | 3.277 (1.049) | 4.651 | 0.0187 | * | |
| Four cell type | C+11 | 9.977 (1.909) | 4.930 (1.023) | 7.08 | 0.00579 | ** |
| C+4+8 | 1.153 (0.283) | 0.824 (0.097) | 2.507 | 0.0872 | ns | |
| C+4+11 | 1.123 (0.392) | 0.315 (0.084) | 3.981 | 0.0284 | * | |
| C+8+11 | 2.268 (0.877) | 1.734 (1.049) | 1.082 | 0.358 | ns | |
| Four-Cell | 1.975 (0.641) | 0.653 (0.381) | 7.946 | 0.00416 | ** | |
| With C, 4, 8 | 3.128 (0.419) | 1.477 (0.406) | 30.1 | 0.0000806 | *** | |
| With C, 4, 11 | 3.098 (0.615) | 0.969 (0.375) | 8.498 | 0.00342 | ** | |
| With C, 8, 11 | 4.243 (0.348) | 2.387 (0.591) | 4.167 | 0.0251 | * |
All t-tests conducted with d.f. of 3
Moving on to the four cell type situation, a more detailed look at the differences in clustering behavior is possible (Fig. 7). Like before, Fig. 7A shows the unsplit data, and Fig. 7B shows the watershed data, and Videos 5–8 show the cluster outlines from these. The most readily apparent differences are the cancer and CD11b+ cell clusters (“C+11”), which appear twice as frequently in the real data, and the Four-Cell clusters, which rise distinctly after 4 hours in the real experiment and remain constant in the simulation. This trend is present in both Fig. 7A and 7B, indicating that while the watershed has some effect on counts of clusters, the overall trends are similar. The “C+11” clusters in Fig. 7B seem to be higher in count, and more variable, than in Fig. 7A. This could be due to the high contact frequency of CD11b+ and cancer cells resulting in increased numbers of “C+11” clusters when the cancer cells are split apart. The difference between “C+11” and “Four-Cell” clusters’ means in the real experiment and in the simulations are each highly statistically significant (Table 3). The three types of “Three-Cell” clusters (“C+4+8”, “C+8+11”, and “C+4+11”) have means that are less significantly different between the real experiment and simulation.
Fig. 7. Comparison of cell cluster formation comparison between real and simulated immune cells in four cell type culture.
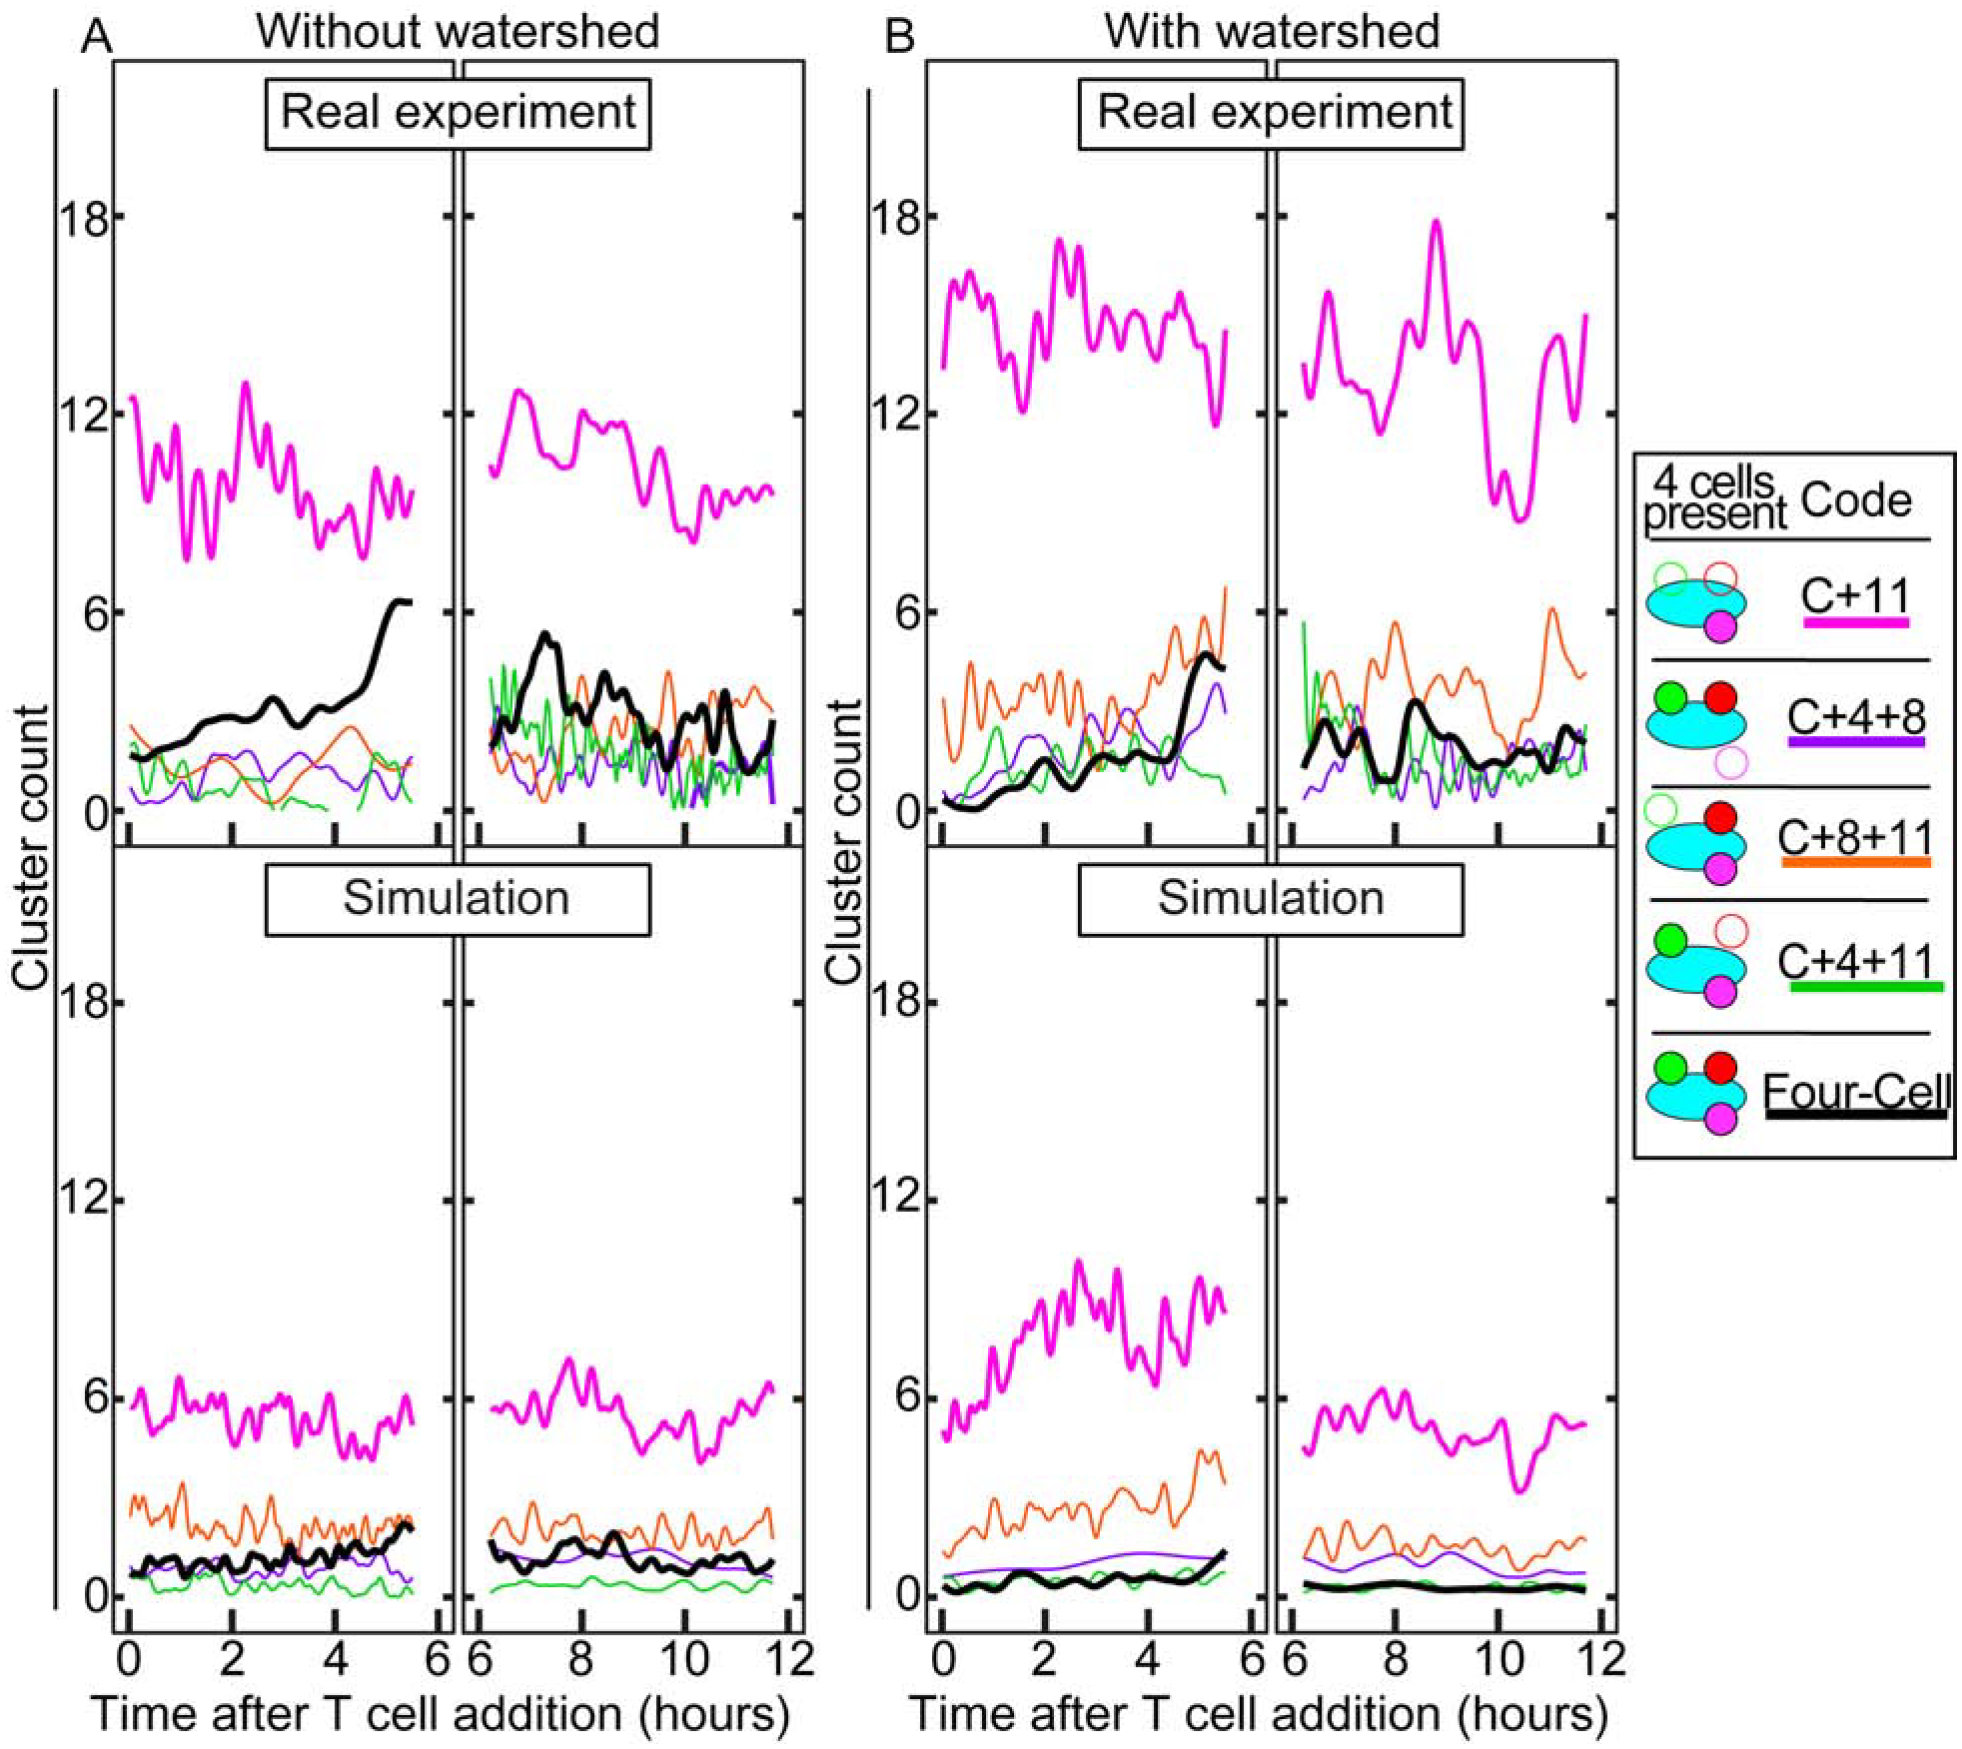
Analogous to Fig. 6, but with four cell types. (A – B) There are significant differences between “Four-Cell”, “C+4+11”, and “C+11” clusters between the experimental and simulated data, and insignificant differences among the other clusters (Table 3). The “Four-Cell” clusters line was enhanced for viewability. See Materials and Methods for details.
These less statistically significant results are likely because the immune cells seem highly prone to interact as “Four-Cell” clusters instead of as “Three-Cell” clusters. When a fourth cell type joins a “Three-Cell” cluster, its classification becomes “Four-Cell”. However, because the three-way interactions that take place in “Three-Cell” clusters are still important evidence of clustering behavior, it is necessary to determine whether they are, in fact, significantly different from randomly moving cells. Therefore, in order to count these instances of clusters that contain at least three specific cell types, regardless of the fourth cell type, it is necessary to add together the counts of the “Three-Cell” and “Four-Cell” clusters. When combining each of the “Three-Cell” cluster counts with the “Four-Cell” cluster counts, the data shows that the mean of each of the clusters is significantly different between the real and simulated data (Table 3). This high number of multi-cell clusters is much less common in the simulation than in the real experiment, because the probability of cancer cells having random encounters with two or three cell types at a time is lower than the probability of having random encounters with only one. However, given that we often see higher counts of “Four-Cell” clusters than “Three-Cell” clusters with real immune cells in vitro, it is likely that these cells are not randomly encountering one another, but are engaging with their target by design.
4. Discussion
The automated cluster-finding macro allows us to identify trends over long time periods that we would otherwise have difficulty seeing. It allows us to sort out differences between situations that look very similar to the naked eye, by revealing clusters in defined categories with significant biological meaning. It can easily be generalized and applied to any situation where clustering behavior is prevalent between differently colored elements. In our immunological application, we are able to gain an enhanced understanding of the interactions taking place between different cell types, including when different cells enter and exit clusters and how long different types of clusters are prominent. We were able to compare the dynamics across time, position, and experiment, by using a standardized and repeatable automated process. The macro we developed can be adapted and improved for a diversity of future studies of complex multi-cell-type interactions.
One limitation of using automated software to count and encircle cells is that it occasionally flags background noise or other disturbances in the image as a cell. Even with background subtraction techniques and selective thresholding, miscounts occur. To account for this problem, it is necessary to look at the relative counts/changes as opposed to the absolute counts, given that these problems will be systemic and not likely to vary as a function of time points. A second issue is the scoring of multiple touching cancer cells as a single unit. The shape of these cells is difficult to correctly split by watershed routines, resulting in under- and over-counting cells due to incorrect splitting of touching or of single cells, respectively. Over-splitting decreases the chance of detecting multi-cell-type clusters. Not splitting increases the cluster counts, across both groups of cancer cells and groups of single cancer cells. In addition, the probability of multi-cell-type clustering is far higher for non-split groups than for single cells simply because when the area of the target cell is larger, and results in high target-cell density situations, it would be more difficult to distinguish between simulations and experiments without splitting cells. It should be noted that cell cultures here contained only a single layer of cells, and that cells within tumors are mostly touching. For these reasons, we chose to show both approaches, with and without splitting, and used the same real cell data for our interaction simulations to account for single versus touching cancer cell detections.
In the beginning we used 3 × 3 montages, imaged with two z-positions every 5 minutes for 48 hours. Over this time, the level of light exposure was enough to destroy cancer cells and CD11b+ cells (Fig. S2). Cancer cells began to die in the center frame of the 3 × 3 within 6 hours due to frequent light exposure from surrounding frames (Video S1), and because two z positions were used. The wide illumination from the microscope could be to blame for the intense phototoxicity in the center and cytotoxic effects even outside of the imaged area, as the radius of the circular illumination is wider than the imaged field of view to ensure lack of dark corners in squared images. Because of the premature cancer cell death, we were unable to analyze clusters occurring around cancer cells. In order to account for this problem, we switched to our current method of imaging multiple 2 × 2 positions every 90 seconds for 6 hours at a time, with only one z-position. In addition, an 8 × 8 montage was imaged once every 6 hours for 24 hours. This 8 × 8 montage was the easiest point of comparison between experiments, to verify that all the different 2 × 2 sub-fields of view have similar outcomes. Furthermore, the 8 × 8 montage allowed us to see that phototoxicity was not having a noticeable effect on the survival of the cells, by comparing cancer cell fate in imaged areas to areas that were not imaged.
The phenomenon of cell clustering has been studied for over 50 years, but the initial methods relied on indirect measurements of cell responses and adherence at end-point [11]. Our methodology offers a significant improvement. Rather than an indirect measurement of the overall composition of a population of multiple cell-types, we are able to quantify individual clusters of cells and study their formation and disassociation dynamics, which presents a much more fine-tuned and sensitive analysis. In addition, the focus on live cell imaging has the benefit of capturing nuanced behaviors that might not show up in an experiment that only analyzes the end-point.
Because the immune system involves a great degree of cooperation between cell types, our approach can be generalized to include any combination of immune cells that might interact in a cluster, which presents other applications where this macro would be useful. We believe that the immune cell clusters involve immune synapses and kinapses [8], and by using the macro, it is possible to further investigate situations involving these interactions. Future experiments could be performed to determine differences between linear effects of adhesion and determine effects that might be enhanced by multi-cell type interaction. One possibility is that the CD4+ T cell would activate the CD8+ T cell, causing it to become more involved in clustering or changing its movement. This could be investigated, i.e. through the comparison of cancer and CD11b+ cell clusters with cancer-specific CD4+ and CD8+ T cells with clusters of CD4+ and/or CD8+ T cells which are not specific for cancer antigens. Through comparison of a given cell’s behavior in each situation, it would be possible to map out the effects that each cell has on another, that are not accounted for by simple cell-cell adhesion. A simulation could also be used to supplement these experiments, whereby a single cell type could be swapped out for a statistical comparison with a simulation, thus answering questions such as whether a non-cancer specific T cell behaves like a randomly-moving one. The study focus could also be switched to a different immunological topic, such as in the case of virology, where a virus infects a host cell, and the host cell is then destroyed by host immune cells [10]. Any cell or protein that can be distinctly labeled can be included in this type of analysis.
In certain situations, a single cell type may not be the only target of interest for clustering. A generalized version of this macro is suitable for this situation as well. The user can rearrange the channels such that any given cell type is the “target” and can run the macro iteratively, with each cell type as the target. The distinct combinations can be graphed in the same manner as we showed previously. For example, we decided to look at clusters based around CD4+ T cells in the four cell type experiment (Fig. S3, Video S2). We compared these clusters to analogous ones that had cancer cells as the target. We changed the code accordingly to account for the different channel as the target (i.e. “4+C” means a CD4+ T cell with a cancer cell overlap). This switch of target reveals new levels of complexity about the interactions; for instance, the counts of “4+C” can be compared to counts of “C+4” to give an indication of how many CD4+ T cells come into contact with each cancer cell cluster. Furthermore, looking at Video S2, it is easier to spot certain instances in which CD4+ T cells come into contact with CD8+ T cells or CD11b+ cells within a cancer cluster. This example shows that the macro can be generalized to be applicable to clusters with alternative targets as the basis, aside from just cancer cells, or even to situations with more than one target cell of interest.
The cell cluster-finding macro could also allow for new types of studies in developmental biology, where cellular imaging plays an important role. Studying cell to cell interactions and their intercellular signaling continues to be of pivotal importance and the cluster macro could be applied to situations in which multiple cell types are interacting at once, during developmental stages. For example, tracing oligodendrocyte development and migration involves keeping track of filopodium-like processes that are involved in local surveillance, which organize themselves based on contact with neighboring cells [24]. Through genetic fate mapping techniques and time-lapse imaging, the cell cluster macro could quantify how specific perturbations of oligodendrocyte progenitor cells would affect contact rate with neighboring cells and make it possible to measure how the rate of contacts between cells relates to their distribution. The cell cluster macro could be applied to similar situations involving dynamic population-level operations of a number of differently labeled cells, where the at-large behavior is of more interest than single cell to cell interactions. Another example is neural crest or notochord [25] morphogenesis in a developing zebrafish embryo, where certain differentially expressed proteins can be fluorescently labeled. When specific cells differentiate and express new proteins, such as Isl-1 [26], and Tfap2 [27], these labels can be used by the cluster macro to identify which cell types are present in certain clusters at various stages of development. The macro can also be used to identify migration patterns of these cells, with accurate timing for when they move from one type of cluster to another.
The cluster macro could also be applied to studies where tissue organization and mechanotransduction are of interest. Stem cell research, in particular, due to its inherent focus on multiple cell types and the cell-to-cell interactions that govern their behaviors, could be advanced by using a cell cluster-finding tool. For instance, in the mammary gland, where cell-to-cell interactions are mediated by cell adhesion molecules such as integrin heterodimers [28], it is possible to trace the lineage of stem cells as they clonally expand or differentiate during pregnancy [29, 30]. Using the cell cluster tool, and some modification to existing protocols to allow for time-lapse imaging, it would be possible to track the dynamic interactions between differently labeled stem and progenitor cells, perhaps with labels for integrins as well, that govern cell fate specification. This type of study could foreseeably be applied to any number of similar situations involving mechanotransduction, such as in collective invasion, wherein an entire group of cells moves from one location to another, while maintaining cell-to-cell adhesion [31, 32].
Rather than focusing on individual phenomena that might occur randomly, the cluster-finding macro instead finds persistent and quantifiable differences between biased and unbiased cells, where the bias refers to the cells’ tendency to adhere to other cells, including target cells. Given the ubiquity of cell to cell interactions involving multiple cell types, the cluster-finding macro could be applied to and advance various different research areas. Shifting the focus away from single cell contacts to at large spatial analysis allows for the possibility of finding significant differences in proclivity to interact over time among multiple cells.
Supplementary Material
Each shaded gray rectangle represents a single field of view measuring 216 × 165 μm. The eight rows and eight columns represent the 8 × 8 field of view montage (1733 × 1320 μm) that was imaged every 6 hours. The red rectangles indicate the 2 × 2 montages (433 × 330 μm) that were imaged every 90 seconds for 5.5 hours, in the order shown as indicated by the number in the upper left corner of each red rectangle.
(A – B) Cerulean expressing 6132A cancer cells and DiD labeled CD11b+ cells were imaged using time-lapse Olympus VivaView microscopy in a 3 × 3 montage every 5 minutes for 48 hrs. A 7 × 7 montage surrounding the time-lapsed 3 × 3 area, which is highlighted with a red rectangle, was imaged once before (A) and once after (B) time-lapse imaging, and shows disappearance of cells, indicating phototoxicity.
In vitro time-lapse imaging of four cell types: 6132A-cerluean cancer cells with DiD-stained CD11b+ cells, GFP+ CD4+ T cells and mCherry+ CD8+ T cells were added. Left panel: cluster analyses of the second 2 × 2 position (6 – 12 h) are shown, with cancer cells being the basis, or center, of each cluster. Right panel: cluster analyses of the second 2 × 2 position (6 – 12 h) are shown, with CD4+ T cells being the basis, or center, of each cluster. Clusters containing the same cells are graphed in the same color, while analogous but not identically constituted clusters are graphed in similar colors. See Materials and Methods for details.
In vitro time-lapse imaging of three cell types. 6132A-cerluean cancer cells were cultured overnight with DiD-stained CD11b+ cells. The next day, 2 × 2 field-of-view areas were selected, 6132A-specific mCherry+ CD8+ T cells were added, and a 2 × 2 area was imaged every 90 seconds for 5.5 hours. The first 2 × 2 position (0 – 6 h) is shown, after cluster-finding macro analysis. Outlines and automated labels indicate cluster detection, as described in Materials and Methods section 3.2. Note that single cancer cells that interact with one or fewer other cell types are not labeled or outlined, and lack of outline does not indicate lack of detection. See Materials and Methods for details.
In vitro time-lapse imaging of three cell types. Imaging protocol was identical to that of Video 1. 6132A-cerluean cancer cells with DiD-stained CD11b+ cells and 6132A-specific mCherry+ CD8+ T cells imaged every 90 seconds for 5.5 hours. Cancer cells were automatically split using watershed segmentation before cluster analysis. See Materials and Methods for details.
The same cancer cell images as in Video 1 were used (first 2 × 2 position shown, CFP channel duplicated, other channels simulated), and the immune cells were simulated as described in section 2.7. The cell cluster-finding macro was then applied. Shown is one representative video of the five repeated simulations. See Materials and Methods for details.
Analogous to Video 3, but with watershed segmentation applied before the cell cluster finding macro was run. See Materials and Methods for details.
In vitro time-lapse imaging of four cell types. 6132A-cerluean cancer cells with DiD-stained CD11b+ cells, 6132A-specific GFP+ CD4+ T cells and 6132A-specific mCherry+ CD8+ T cells. Imaged every 90 seconds for 5.5 hours. The second 2 × 2 position (6 – 12 h) is shown, after cluster-finding macro analysis. See Materials and Methods for details.
Imaging protocol was identical to that of Video 5. 6132A-cerluean cancer cells with DiD-stained CD11b+ cells, 6132A-specific GFP+ CD4+ T cells and 6132A-specific mCherry+ CD8+ T cells. Imaged every 90 seconds for 5.5 hours. Cancer cells were automatically split using watershed segmentation before cluster analysis. See Materials and Methods for details.
The same cancer cell images as in Video 5 were used (second 2 × 2 position shown, CFP channel duplicated, other channels simulated), and the immune cells were simulated. The cell cluster-finding macro was then applied. Shown is one representative video of the five repeated simulations. See Materials and Methods for details.
Analogous to Video 7, but with watershed segmentation applied before the cell cluster finding macro was run. See Materials and Methods for details.
In vitro time-lapse imaging of 6132A-cerluean cancer cells with DiD-stained CD11b+ cells. A 3 × 3 montage was imaged every 5 minutes for 49 hours, at two z positions.
In vitro time-lapse imaging of four cell types. 6132A-cerluean cancer cells (Ch 3) with DiD-stained CD11b+ cells (Ch 4), GFP+ CD4+ T cells (Ch 2) and mCherry+ CD8+ T cells (Ch 5). Labels drawn based on color channel, not cell. Cluster label conversions: “C2-3-4” = “4+C+11”, “C2-3-5” = “4+C+8”, “C2-4-5” = “4+8+11”, “Four-Cell” as is. Analogous to Video 5, but with CD4+ T cells as the basis, or center, of clusters for the cell cluster-finding macro. See Materials and Methods for details.
Highlights:
Automated analysis of multi-cell clusters
Quantifiable differences between directed and simulated cell clustering
Complex interactions between immune cells and their targets
Acknowledgements
This work was supported by National Institute of Health grants R01-CA37516 and R01-CA22677 to HS and The University of Chicago Cancer Center Grant CA-14599 to H.S. Imaging was performed at the University of Chicago Integrated Light Microscopy Facility. Many thanks to Shirley Bond for assistance with microscope maintenance and usage. We thank Jun Huang for help and suggestions with the overall direction of this project. We thank Theodore Karrison for help with statistical analysis. We also thank Vivien Zhang, Madeline Steiner and Karin Schreiber for their critical comments and valuable discussions.
Abbreviations:
- TCR
T cell receptor
- APC
Antigen-presenting cell
- DC
Dendritic cell
Footnotes
Publisher's Disclaimer: This is a PDF file of an unedited manuscript that has been accepted for publication. As a service to our customers we are providing this early version of the manuscript. The manuscript will undergo copyediting, typesetting, and review of the resulting proof before it is published in its final form. Please note that during the production process errors may be discovered which could affect the content, and all legal disclaimers that apply to the journal pertain.
Conflicts of interest
The authors have no conflicting financial interests.
Declaration of interests
The authors declare that they have no known competing financial interests or personal relationships that could have appeared to influence the work reported in this paper.
References
- [1].Sheffield JB, Moscona AA, Early stages in the reaggregation of embryonic chick neural retina cells, Exp Cell Res 57 (1969) 462–466. [DOI] [PubMed] [Google Scholar]
- [2].Rowley DA, Fitch FW, The road to the discovery of dendritic cells, a tribute to Ralph Steinman, Cell Immunol 273 (2012) 95–98. [DOI] [PubMed] [Google Scholar]
- [3].Mosier DE, Cell interactions in the primary immune response in vitro: a requirement for specific cell clusters, J Exp Med 129 (1969) 351–362. [DOI] [PMC free article] [PubMed] [Google Scholar]
- [4].Bos R, Sherman LA, CD4+ T-cell help in the tumor milieu is required for recruitment and cytolytic function of CD8+ T lymphocytes, Cancer Res 70 (2010) 8368–8377. [DOI] [PMC free article] [PubMed] [Google Scholar]
- [5].Schietinger A, Philip M, Liu RB, Schreiber K, Schreiber H, Bystander killing of cancer requires the cooperation of CD4(+) and CD8(+) T cells during the effector phase, J Exp Med 207 (2010) 2469–2477. [DOI] [PMC free article] [PubMed] [Google Scholar]
- [6].Friedl P, Noble PB, Zanker KS, Lymphocyte Locomotion in 3-Dimensional Collagen Gels - Comparison of 3 Quantitative Methods for Analyzing Cell Trajectories, J Immunol Methods 165 (1993) 157–165. [DOI] [PubMed] [Google Scholar]
- [7].Stoll S, Delon J, Brotz TM, Germain RN, Dynamic imaging of T cell-dendritic cell interactions in lymph nodes, Science 296 (2002) 1873–1876. [DOI] [PubMed] [Google Scholar]
- [8].Dustin ML, T-cell activation through immunological synapses and kinapses, Immunol Rev 221 (2008) 77–89. [DOI] [PubMed] [Google Scholar]
- [9].Dustin ML, Modular design of immunological synapses and kinapses, Cold Spring Harb Perspect Biol 1 (2009) a002873. [DOI] [PMC free article] [PubMed] [Google Scholar]
- [10].Halle S, Keyser KA, Stahl FR, Busche A, Marquardt A, Zheng X, Galla M, Heissmeyer V, Heller K, Boelter J, Wagner K, Bischoff Y, Martens R, Braun A, Werth K, Uvarovskii A, Kempf H, Meyer-Hermann M, Arens R, Kremer M, Sutter G, Messerle M, Forster R, In Vivo Killing Capacity of Cytotoxic T Cells Is Limited and Involves Dynamic Interactions and T Cell Cooperativity, Immunity 44 (2016) 233–245. [DOI] [PMC free article] [PubMed] [Google Scholar]
- [11].Mosier DE, Coppleson LW, A three-cell interaction required for the induction of the primary immune response in vitro, Proc Natl Acad Sci U S A 61 (1968) 542–547. [DOI] [PMC free article] [PubMed] [Google Scholar]
- [12].Ward PL, Koeppen H, Hurteau T, Schreiber H, Tumor-Antigens Defined by Cloned Immunological Probes Are Highly Polymorphic and Are Not Detected on Autologous Normal-Cells, J Exp Med 170 (1989) 217–232. [DOI] [PMC free article] [PubMed] [Google Scholar]
- [13].Monach PA, Meredith SC, Siegel CT, Schreiber H, A Unique Tumor-Antigen Produced by a Single Amino-Acid Substitution, Immunity 2 (1995) 45–59. [DOI] [PubMed] [Google Scholar]
- [14].Ward PL, Koeppen H, Hurteau T, Schreiber H, Tumor antigens defined by cloned immunological probes are highly polymorphic and are not detected on autologous normal cells, J Exp Med 170 (1989) 217–232. [DOI] [PMC free article] [PubMed] [Google Scholar]
- [15].Schietinger A, Arina A, Liu RB, Wells S, Huang J, Engels B, Bindokas V, Bartkowiak T, Lee D, Herrmann A, Piston DW, Pittet MJ, Lin PC, Zal T, Schreiber H, Longitudinal confocal microscopy imaging of solid tumor destruction following adoptive T cell transfer, Oncoimmunology 2 (2013) e26677. [DOI] [PMC free article] [PubMed] [Google Scholar]
- [16].Fujita T, Nolan GP, Ghosh S, Baltimore D, Independent modes of transcriptional activation by the p50 and p65 subunits of NF-kappa B, Genes Dev 6 (1992) 775–787. [DOI] [PubMed] [Google Scholar]
- [17].Schietinger A, Arina A, Liu RB, Wells S, Huang JH, Engels B, Bindokas V, Bartkowiak T, Lee D, Herrmann A, Piston DW, Pittet MJ, Lin PC, Zal T, Schreiber H, Longitudinal confocal microscopy imaging of solid tumor destruction following adoptive T cell transfer, Oncoimmunology 2 (2013). [DOI] [PMC free article] [PubMed] [Google Scholar]
- [18].Engels B, Noessner E, Frankenberger B, Blankenstein T, Schendel DJ, Uckert W, Redirecting human T lymphocytes toward renal cell carcinoma specificity by retroviral transfer of T cell receptor genes, Hum Gene Ther 16 (2005) 799–810. [DOI] [PubMed] [Google Scholar]
- [19].Textor A, Schmidt K, Kloetzel PM, Weissbrich B, Perez C, Charo J, Anders K, Sidney J, Sette A, Schumacher TN, Keller C, Busch DH, Seifert U, Blankenstein T, Preventing tumor escape by targeting a post-proteasomal trimming independent epitope, J Exp Med 213 (2016) 2333–2348. [DOI] [PMC free article] [PubMed] [Google Scholar]
- [20].Schindelin J, Arganda-Carreras I, Frise E, Kaynig V, Longair M, Pietzsch T, Preibisch S, Rueden C, Saalfeld S, Schmid B, Tinevez JY, White DJ, Hartenstein V, Eliceiri K, Tomancak P, Cardona A, Fiji: an open-source platform for biological-image analysis, Nat Methods 9 (2012) 676–682. [DOI] [PMC free article] [PubMed] [Google Scholar]
- [21].Wickham H, ggplot2: Elegant Graphics for Data Analysis, Springer-Verlag; New York: (2016). [Google Scholar]
- [22].RStudio Team, RStudio: Integrated Development for R, RStudio, Inc; (2016). [Google Scholar]
- [23].R Core Team, R: A language and environment for statistical computing, (2018). [Google Scholar]
- [24].Kirby BB, Takada N, Latimer AJ, Shin J, Carney TJ, Kelsh RN, Appel B, In vivo time-lapse imaging shows dynamic oligodendrocyte progenitor behavior during zebrafish development, Nat Neurosci 9 (2006) 1506–1511. [DOI] [PubMed] [Google Scholar]
- [25].Kimmel CB, Ballard WW, Kimmel SR, Ullmann B, Schilling TF, Stages of embryonic development of the zebrafish, Dev Dyn 203 (1995) 253–310. [DOI] [PubMed] [Google Scholar]
- [26].Korzh V, Edlund T, Thor S, Zebrafish primary neurons initiate expression of the LIM homeodomain protein Isl-1 at the end of gastrulation, Development 118 (1993) 417–425. [DOI] [PubMed] [Google Scholar]
- [27].Hoffman TL, Javier AL, Campeau SA, Knight RD, Schilling TF, Tfap2 transcription factors in zebrafish neural crest development and ectodermal evolution, J Exp Zool B Mol Dev Evol 308 (2007) 679–691. [DOI] [PubMed] [Google Scholar]
- [28].Isomursu A, Lerche M, Taskinen ME, Ivaska J, Peuhu E, Integrin signaling and mechanotransduction in regulation of somatic stem cells, Exp Cell Res 378 (2019) 217–225. [DOI] [PubMed] [Google Scholar]
- [29].Van Keymeulen A, Rocha AS, Ousset M, Beck B, Bouvencourt G, Rock J, Sharma N, Dekoninck S, Blanpain C, Distinct stem cells contribute to mammary gland development and maintenance, Nature 479 (2011) 189–193. [DOI] [PubMed] [Google Scholar]
- [30].Inman JL, Robertson C, Mott JD, Bissell MJ, Mammary gland development: cell fate specification, stem cells and the microenvironment, Development 142 (2015) 1028–1042. [DOI] [PubMed] [Google Scholar]
- [31].Wickstrom SA, Roca-Cusachs P, Special issue on “mechanotransduction in cell fate determination” - From molecular switches to organ-level regulation, Exp Cell Res 382 (2019) 111452. [DOI] [PubMed] [Google Scholar]
- [32].Khalil AA, de Rooij J, Cadherin mechanotransduction in leader-follower cell specification during collective migration, Exp Cell Res 376 (2019) 86–91. [DOI] [PubMed] [Google Scholar]
Associated Data
This section collects any data citations, data availability statements, or supplementary materials included in this article.
Supplementary Materials
Each shaded gray rectangle represents a single field of view measuring 216 × 165 μm. The eight rows and eight columns represent the 8 × 8 field of view montage (1733 × 1320 μm) that was imaged every 6 hours. The red rectangles indicate the 2 × 2 montages (433 × 330 μm) that were imaged every 90 seconds for 5.5 hours, in the order shown as indicated by the number in the upper left corner of each red rectangle.
(A – B) Cerulean expressing 6132A cancer cells and DiD labeled CD11b+ cells were imaged using time-lapse Olympus VivaView microscopy in a 3 × 3 montage every 5 minutes for 48 hrs. A 7 × 7 montage surrounding the time-lapsed 3 × 3 area, which is highlighted with a red rectangle, was imaged once before (A) and once after (B) time-lapse imaging, and shows disappearance of cells, indicating phototoxicity.
In vitro time-lapse imaging of four cell types: 6132A-cerluean cancer cells with DiD-stained CD11b+ cells, GFP+ CD4+ T cells and mCherry+ CD8+ T cells were added. Left panel: cluster analyses of the second 2 × 2 position (6 – 12 h) are shown, with cancer cells being the basis, or center, of each cluster. Right panel: cluster analyses of the second 2 × 2 position (6 – 12 h) are shown, with CD4+ T cells being the basis, or center, of each cluster. Clusters containing the same cells are graphed in the same color, while analogous but not identically constituted clusters are graphed in similar colors. See Materials and Methods for details.
In vitro time-lapse imaging of three cell types. 6132A-cerluean cancer cells were cultured overnight with DiD-stained CD11b+ cells. The next day, 2 × 2 field-of-view areas were selected, 6132A-specific mCherry+ CD8+ T cells were added, and a 2 × 2 area was imaged every 90 seconds for 5.5 hours. The first 2 × 2 position (0 – 6 h) is shown, after cluster-finding macro analysis. Outlines and automated labels indicate cluster detection, as described in Materials and Methods section 3.2. Note that single cancer cells that interact with one or fewer other cell types are not labeled or outlined, and lack of outline does not indicate lack of detection. See Materials and Methods for details.
In vitro time-lapse imaging of three cell types. Imaging protocol was identical to that of Video 1. 6132A-cerluean cancer cells with DiD-stained CD11b+ cells and 6132A-specific mCherry+ CD8+ T cells imaged every 90 seconds for 5.5 hours. Cancer cells were automatically split using watershed segmentation before cluster analysis. See Materials and Methods for details.
The same cancer cell images as in Video 1 were used (first 2 × 2 position shown, CFP channel duplicated, other channels simulated), and the immune cells were simulated as described in section 2.7. The cell cluster-finding macro was then applied. Shown is one representative video of the five repeated simulations. See Materials and Methods for details.
Analogous to Video 3, but with watershed segmentation applied before the cell cluster finding macro was run. See Materials and Methods for details.
In vitro time-lapse imaging of four cell types. 6132A-cerluean cancer cells with DiD-stained CD11b+ cells, 6132A-specific GFP+ CD4+ T cells and 6132A-specific mCherry+ CD8+ T cells. Imaged every 90 seconds for 5.5 hours. The second 2 × 2 position (6 – 12 h) is shown, after cluster-finding macro analysis. See Materials and Methods for details.
Imaging protocol was identical to that of Video 5. 6132A-cerluean cancer cells with DiD-stained CD11b+ cells, 6132A-specific GFP+ CD4+ T cells and 6132A-specific mCherry+ CD8+ T cells. Imaged every 90 seconds for 5.5 hours. Cancer cells were automatically split using watershed segmentation before cluster analysis. See Materials and Methods for details.
The same cancer cell images as in Video 5 were used (second 2 × 2 position shown, CFP channel duplicated, other channels simulated), and the immune cells were simulated. The cell cluster-finding macro was then applied. Shown is one representative video of the five repeated simulations. See Materials and Methods for details.
Analogous to Video 7, but with watershed segmentation applied before the cell cluster finding macro was run. See Materials and Methods for details.
In vitro time-lapse imaging of 6132A-cerluean cancer cells with DiD-stained CD11b+ cells. A 3 × 3 montage was imaged every 5 minutes for 49 hours, at two z positions.
In vitro time-lapse imaging of four cell types. 6132A-cerluean cancer cells (Ch 3) with DiD-stained CD11b+ cells (Ch 4), GFP+ CD4+ T cells (Ch 2) and mCherry+ CD8+ T cells (Ch 5). Labels drawn based on color channel, not cell. Cluster label conversions: “C2-3-4” = “4+C+11”, “C2-3-5” = “4+C+8”, “C2-4-5” = “4+8+11”, “Four-Cell” as is. Analogous to Video 5, but with CD4+ T cells as the basis, or center, of clusters for the cell cluster-finding macro. See Materials and Methods for details.


