

Abstract
Fragaria nilgerrensis is a wild diploid strawberry species endemic to east and southeast region in Asia and provides a rich source of genetic variations for strawberry improvement. Here, we present a chromosome‐scale assembly of F. nilgerrensis using single‐molecule real‐time (SMRT) Pacific Biosciences sequencing and chromosome conformation capture (Hi‐C) genome scaffolding. The genome assembly size was 270.3 Mb, with a contig N50 of ∼8.5 Mb. A total of 28 780 genes and 117.2 Mb of transposable elements were annotated for this genome. Next, detailed comparative genomics with the high‐quality F. vesca reference genome was conducted to obtain the difference among transposable elements, SNPs, Indels, and so on. The genome size of F. nilgerrensis was enhanced by around 50 Mb relatively to F. vesca, which is mainly due to expansion of transposable elements. In comparison with the F. vesca genome, we identified 4 561 825 SNPs, 846 301 Indels, 4243 inversions, 35 498 translocations and 10 099 relocations. We also found a marked expansion of genes involved in phenylpropanoid biosynthesis, starch and sucrose metabolism, cyanoamino acid metabolism, plant–pathogen interaction, brassinosteroid biosynthesis and plant hormone signal transduction in F. nilgerrensis, which may account for its specific phenotypes and considerable environmental adaptability. Interestingly, we found sequence variations in the upstream regulatory region of FnMYB10, a core transcriptional activator of anthocyanin biosynthesis, resulted in the low expression level of the FnMYB10 gene, which is likely responsible for white fruit phenotype of F. nilgerrensis. The high‐quality F. nilgerrensis genome will be a valuable resource for biological research and comparative genomics research.
Keywords: Fragaria nilgerrensis, PacBio SMRT, Hi‐C, transposable element, MYB10, promoter activity
Introduction
Strawberries are one of the most economically important berry fruits throughout the world. The main cultivated strawberry species, Fragaria × ananassa, is derived from a hybrid of two wild octoploid species, F. chiloensis and F. virginiana (Bolger et al., 2014; Darrow, 1966). Strawberry belongs to Rosaceae family of the genus Fragaria which appears to be closely related to Potentilla and Duchesnea (Harrison and Luby, 1997). Recent studies show that cultivated strawberry is formed through the incorporation of four diploid progenitor species and the four ancestors are F. iinumae, F. nipponica, F. viridis and F. vesca (Edger et al., 2019).
A total of 24 wild species of Fragaria have been identified (Folta and Davis, 2006; Staudt, 2009), including 12 diploids (2n = 2x = 14), 5 tetraploids (2n = 4x = 28), 1 pentaploid (2n = 5x = 35), 1 hexaploid (2n = 6x = 42), 3 octoploids (2n = 8x = 56) and 2 decaploid (2n = 10x = 70). The formation of higher‐polyploid wild species results from the interfertility between and within ploidy levels (Potter et al., 2000). These wild species are mainly distributed in Asia, Europe and America (Staudt, 1989, 1999). A number of valuable characteristics, such as cold tolerance, disease resistance, firm fruit, high aroma, different fruit colours and so on, exist in wild species of Fragaria that can be used for the cultivated strawberry (Darrow, 1966; Guo et al., 2017; Hancock, 1999; Luo et al., 2018). Strawberry breeders are focused on improving stress tolerance, fruit quality, productivity, disease resistance and developing new strawberry cultivars. Some desirable traits from lower ploidy species have been introduced into cultivated strawberry through pollinations via unreduced gametes or doubling the chromosome by colchicine treatment (Bors and Sullivan, 1998; Noguchi et al. 2002; Sangiacomo and Sullivan, 1994).
China has been considered as the crucial geographical distribution centre of wild strawberry resources in the world. Among 24 recognized Fragaria species, 13 wild species of Fragaria are distributed in China (Guo et al., 2017; Lei et al., 2017; Sargent et al., 2004; Staudt, 2009; Wang et al., 2017). Here, we assembled the diploid strawberry, F. nilgerrensis, which is from Yunnan, China. F. nilgerrensis is a self‐compatible and sympodial‐runnering (Staudt, 1989). F1 plants from F. nilgerrensis and F. vesca are all stunted and failed to flowering (Sargent et al., 2004). Multiple literatures also suggest that F. nilgerrensis is highly divergent from F. vesca (Liu et al., 2016; Njuguna et al., 2013; Potter et al., 2000; Qiao et al., 2016; Rousseau‐Gueutin et al. 2009).
The genotype and phenotype of F. nilgerrensis are quite different from F. vesca. The karyotype of F. nilgerrensis is composed of two pairs of 45S rDNA and one pair of 5S rDNA according to fluorescence in situ hybridization method, whereas F. vesca generally consists of 3 pairs of 45S and 1 pair of 5S (Nathewet et al., 2009; Rho et al., 2012). The karyotype formula of F. nilgerrensis is 8m + 6sm, while the karyotype formula of F. vesca is 10m + 4sm (Nathewet et al., 2009). F. nilgerrensis is robust and has heavy pubescence on all plant compared with F. vesca (Yarnell, 1928). The mature fruits of F. nilgerrensis typically have banana‐like and melon‐ or peach‐like aromas (Noguchi et al. 2002) and the scapes of F. nilgerrensis are short with respect to F. vesca (Yarnell, 1928). The leaves of F. nilgerrensis are leathery and thick, and the leaves of F. vesca often curl at edges. The petioles of F. nilgerrensis are thick and leathery, while the petioles of F. vesca are gracile. The calyx of F. nilgerrensis is clasping and the calyx of F. vesca is reflexed or spreading (Lei et al., 2017). The berries of F. nilgerrensis are subglobose and achenes are very small and extremely sunken, whereas the berries of F. vesca are long conic and achenes are red and raised (Lei et al., 2017). In addition, F. nilgerrensis has many important traits, such as waterlogging tolerance and leaf disease resistance (Guo et al., 2017). Despite F. nilgerrensis has many differences in many important traits compared with F. vesca, the reasons for the phenotype differences, resistance and utilization of F. nilgerrensis for genetic improvement of cultivated strawberry are still largely lacking. Thus, a finished and accurate reference genome of F. nilgerrensis will lay a solid foundation for understanding the genomic evolution of Fragaria and identifying functional genes for important traits. Here, we present a high‐quality reference genome of the F. nilgerrensis using a combination of sequencing technologies. We used this genome to conduct a comparative genomic analysis with the reported F. vesca genome. We also identified the key factor that is associated with the white fruit phenotype of F. nilgerrensis. This F. nilgerrensis genome assembly will provide a valuable resource for further molecular functional analyses of this species and comparative genomics research across Rosaceae family.
Results
Genome sequencing and assembly
Fragaria nilgerrensis used for sequencing is a self‐compatible, white fruit and sympodial‐runnering (Figure S1). A combination of Illumina short‐read sequencing from Illumina HiSeq, PacBio long‐read sequencing technology and high‐throughput chromosome conformation capture (Hi‐C) sequencing was used to assemble the F. nilgerrensis genome (Figure S2). Our sequencing of F. nilgerrensis resulted in coverage of ~ 76.77‐fold PacBio single‐molecule long reads (22.65 Gb with an average length of 10.96 kb), 66.48‐fold Illumina paired‐end short reads (19.62 Gb) and 55.88‐fold Hi‐C data (15.09 Gb). The genome assembly was conducted in a stepwise fashion (Zhang et al., 2019). Falcon and Canu (Koren et al., 2017) pipelines were used for the initial assembly of the PacBio sequencing data, yielding 389 contigs (N50 of ~8.50 Mb). To anchor the scaffolds to chromosomes, we performed Hi‐C libraries of F. nilgerrensis (Figure S3), generating 15.09 Gb Hi‐C pair‐end reads. HiC‐Pro software (Servant et al., 2015) was used for duplicate removal, sorting and quality assessment, and LACHESIS software (Hariharan and Toyama, 2004) was applied to obtain uniquely mapped valid reads for Hi‐C scaffolding. As a result, 264.6 Mb (97.89%) of the assembly was placed on seven chromosome groups. Next, gap filling for the Hi‐C assembled sequence data was conducted by the PBjelly pipeline (English et al., 2012). The final assembly contained 257 scaffolds and 430 contigs, with scaffold N50 value of 38.3 Mb and a contig N50 of 8.5 Mb, respectively. The total assembly size is 270.3 Mb with maximum scaffold and contig lengths of 50.64 and 20.71 Mb, respectively. Based on a k‐mer analysis (k = 19), we evaluated the genome with a heterozygosity of 0.1% and GC content of 39.22% (Figure S4).
Assessment of genome quality
To test the accuracy and completeness of the assembly, we combined three different methods: short‐read sequencing alignment, computational pipelines Benchmarking Universal Single‐Copy Orthologs (BUSCO) (Simão et al., 2015) and Core Eukaryotic Genes Mapping Approach (CEGMA) (Parra et al., 2007) assessment. BWA‐MEM pipeline was used for aligning Illumina paired‐end (PE) reads to our assembly and 97.08% Illumina paired‐end reads could properly mapped to PacBio‐based assembly genome with the correct orientation and estimated insert size (Table S1). We also used the BUSCO method based on a benchmark of 1440 conserved plant genes to assess the completeness of gene regions, of which 95% had complete gene coverage (including 5.28% duplicated ones), 2.22% were fragmented and 8.06 % were missing (Table S2). Moreover, the completeness of the assembly was investigated by searching for 458 core eukaryotic genes (CEGs). In total, 450 of 458 CEGs were completely present, indicating that fewer than 2% of the CEGs could not be detected, which confirms the high completeness of the assembly (Table S3). Finally, the whole‐genome alignment of F. nilgerrensis and F. vesca showed strong collinearity and consistency (Figure S5). Therefore, these results show that our genome assembly is of high quality and has high coverage, which provides an opportunity to comprehensive assess genome variations between F. nilgerrensis and F. vesca.
Genome annotation
We annotated the genome using the EVidenceModeler pipeline (Haas et al., 2008) incorporating ab initio predictions, homology‐based search and RNA‐Seq data (Figure S6–S7; Table S4), resulting in 28 780 protein‐coding genes in the F. nilgerrensis genome (Table 1). The numbers of annotated genes in F. nilgerrensis are close to genes in the F. vesca genome which has 28 588 genes (Table 1). In addition, we identified 1567 transcription factors in the F. nilgerrensis genome. Then, the predicted protein‐coding genes were annotated through blast with the nonredundant (NR), translation of EMBL nucleotide sequence database (TrEMBL), eukaryotic orthologous groups (KOG), Kyoto Encyclopedia of genes and genomes (KEGG) and gene ontology (GO) database and 96.01% of predicted protein‐coding genes could be annotated in these database (Table S5). In the GO analysis, 9890 (34.36 %), 9534 (33.13%) and 6395 (22.22 %) annotated protein‐coding genes were assigned to the GO slim terms biological process, molecular function and cellular component, respectively (Figure S8).
Table 1.
The comparison of genome assembly between Fragaria nilgerrensis and F. vesca (Hawaii‐4)
| Assembly feature | F. nilgerrensis | F. vesca (Hawaii‐4) |
|---|---|---|
| Total assembly size | 270.3 Mb | 220.4 Mb |
| Assembly % of genome | 97.91 | 99.8 |
| Repeats region % of assembly | 43.40 | 34.85 |
| Predicted gene models | 28 780 | 28 588 |
| Number of contigs | 430 | 61 |
| Contig N50 | 8.51 Mb | 7.9 Mb |
| Number of scaffolds | 257 | 31 |
| Scaffold N50 | 38.3 Mb | 36.1 Mb |
| Chr01 length/genes | 23.35 Mb/2443 | 24.25 Mb/3056 |
| Chr02 length/genes | 34.87 Mb/4019 | 29.35 Mb/4145 |
| Chr03 length/genes | 46.88 Mb/4527 | 38.32 Mb/4612 |
| Chr04 length/genes | 38.31 Mb/3820 | 33.91 Mb/3740 |
| Chr05 length/genes | 33.76 Mb/3793 | 29.43 Mb/3978 |
| Chr06 length/genes | 50.64 Mb/5505 | 39.8 Mb/5449 |
| Chr07 length/genes | 28.35 Mb/3384 | 24.23 Mb/3431 |
| Unanchored | 14.14 Mb/1289 | 1.07 Mb/177 |
The set of predicted noncoding genes included 302 ribosomal RNAs (rRNAs) belonging to four families, 495 transfer RNAs (rRNA) belonging to 22 families, 58 microRNAs (miRNAs) belonging to 20 families, 81 small nuclear RNA (snRNA) belonging to eight families and 369 small nucleolar RNA (snoRNA) belonging to two families (Table S6). We also identified 2451 pseudogenes in the F. nilgerrensis genome using the GeneWise software 7 (Birney and Durbin, 2000).
Evolution and gene family expansion/contraction analysis
To investigate the evolution of F. nilgerrensis, we compared the F. nilgerrensis to 13 other plant species. These species include 8 plants in the same Rosaceae order (F. vesca, Malus x domestica, Prunus avium, Prunus persica, Pyrus communis, Pyrus bretschneideri, Rosa chinensis and Rubus occidentalis), four plants in the same eudicots clade (Arabidopsis thaliana, Vitis vinifera, Solanum lycopersicum and Citrus sinensis), and Oryza sativa as the outgroup.
A high‐confidence phylogenetic tree of the 14 species was performed using genes extracted from 373 orthologs from single‐copy gene families (Figure 1a; Appendix S1). As expected, F. nilgerrensis and its close relatives in Rosaceae (F. vesca, M. domestica, P. avium, P. persica, P. communis, P. bretschneideri, R. chinensis and R. occidentalis) were clustered into one monophyletic group and F. nilgerrensis had closest relationship with F. vesca, R. chinensis and R. occidentalis (Figure 1a). This phylogenetic tree is mostly in broad consensus with the species relationships observed in previous report (Saint‐Oyant et al., 2018). It was estimated that F. nilgerrensis and F. vesca diverged from approximately 14.46 million years ago (Mya) (Figure 1a). In addition, the F. vesca and R. chinensis had diverged from around 43.27 Mya (Figure 1a), which is close to results as described previously (Saint‐Oyant et al., 2018). The proportion of single‐ and multiple‐copy genes of F. nilgerrensis was similar to the other species genomes apart from P. bretschneideri and P. communis, which had a lower proportion of single‐ and multiple‐copy genes (Figure 1b).
Figure 1.
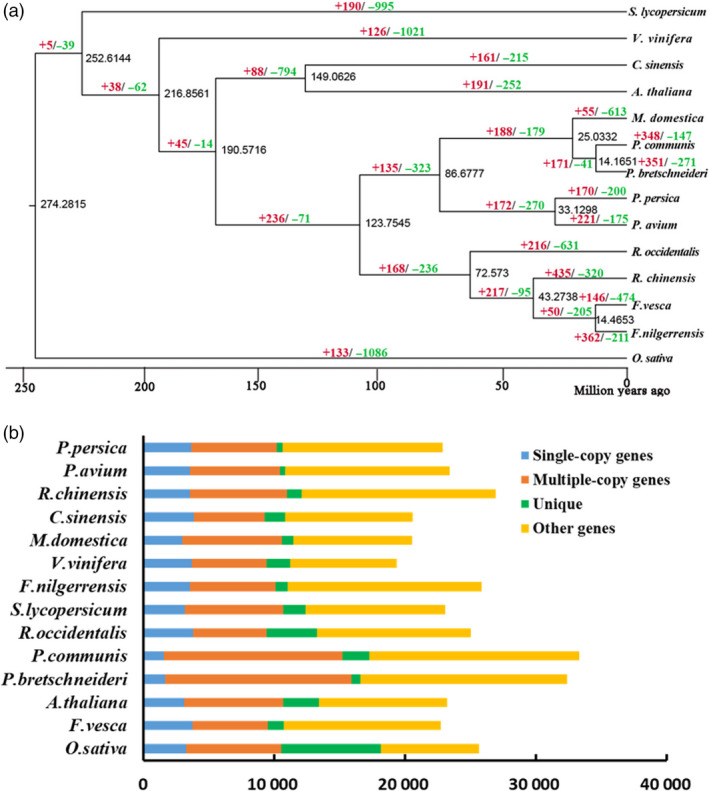
Gene family and genome evolution of Fragaria nilgerrensis. (a) The estimation of divergence time and expansion (red), contraction (green) of gene families in F. vesca, Malus × domestica, Prunus avium, Prunus persica, Pyrus Communis, Pyrus bretschneideri, Rosa chinensis, Rubus occidentalis, Arabidopsis thaliana, Vitis vinifera, Solanum lycopersicum, Citrus sinensis and Oryza sativa. A phylogenetic tree was performed based on 373 single‐copy orthologous genes using O. sativa as the outgroup. The numerical value beside each node is the estimated divergent time. (b) The distribution of single‐copy, multiple‐copy, unique and other orthologues in F. vesca, M. × domestica, P. avium, P. persica, P. communis, P. bretschneideri, R. chinensis, R. occidentalis, A. thaliana, V. vinifera, S. lycopersicum, C. sinensis and O. sativa.
4DTv (fourfold synonymous third‐codon transversion) values among F. nilgerrensis, F. vesca, P. avium, R. chinensis and R. occidentalis were calculated using the orthologous gene pairs among these species. No obvious peak could be seen in the F. nilgerrensis and F. vesca paralog curves, while P. avium, R. chinensis and R. occidentalis had distinct peaks (Figure 2a). We also analysed the substitution rate (Ks) values in F. nilgerrensis, F. vesca, P. avium, R. chinensis and R. occidentalis. The peak Ks value was smaller than 0.1 for orthologous gene pairs between F. nilgerrensis and F. vesca (Figure 2b). The 4DTv and Ks results suggest that F. nilgerrensis genome did not occur an additional species‐specific whole‐genome duplication.
Figure 2.
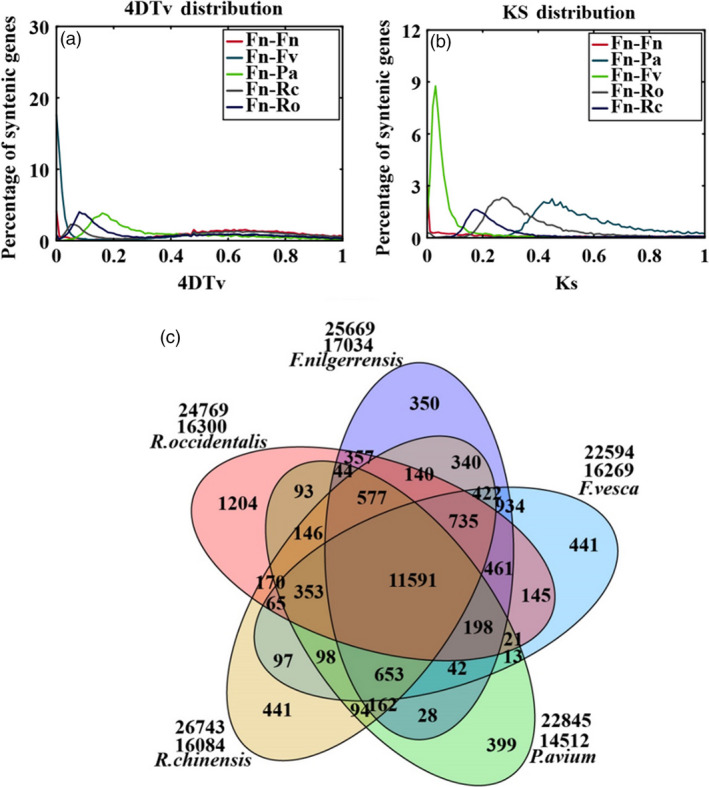
Comparative analysis and evolution events in the Fragaria nilgerrensis genome. (a) Genome duplication in F. nilgerrensis (Fn), F. vesca (Fv), P. avium (Pa), R. chinensis (Rc) and R. occidentali (Ro) genomes as revealed through 4DTv analyses. The percentages of the orthologous pairs (Fn vs Fv) between F. nilgerrensis (Fn) and F. vesca (Fv), the orthologous pairs (Fn vs Pa) between F. nilgerrensis (Fn) and P. avium (Pa), the orthologous pairs (Fn vs Rc) between F. nilgerrensis (Fn) and R. chinensis (Rc), the orthologous pairs (Fn vs Ro) between F. nilgerrensis (Fn) and R. occidentali (Ro), and paralogous gene pairs within the F. nilgerrensis (Fn vs Fn) genomes are plotted against their calculated 4DTv values; (b) distribution of synonymous substitution rates (Ks) for homologous gene groups. (c) Venn diagram represents the shared and unique gene families among F. nilgerrensis, F. vesca, Prunus avium, Rosa chinensis and Rubus occidentalis.
There were 362 and 211 gene families that expanded and contracted in the F. nilgerrensis genome, respectively, after divergence from F. vesca. Compared with F. vesca, the total numbers of significantly expanded families in F. nilgerrensis were much higher (362 for F. nilgerrensis compared with 146 for F. vesca), whereas the significantly contracted families in F. nilgerrensis (211) were less than those in F. vesca (474) (Figure 1a). We observed that 311 of the genes from expanded gene families were clustered in 38 KEGG pathways (Figure 3a). Among the expanded genes, genes involved in phenylpropanoid biosynthesis (42), starch and sucrose metabolism (33), and cyanoamino acid metabolism (24) represented the most abundant groups. In addition to the primary metabolic process, genes related to plant–pathogen interaction (14), brassinosteroid biosynthesis (11) and plant hormone signal transduction (10) also significantly expanded (Figure 3a; Appendix S2). A total of 195 genes in the contracted families were annotated to KEGG pathways. KEGG pathway analysis suggested that contracted gene families were mainly participated in endoplasmic reticulum (34), spliceosome (32) and endocytosis (32) (Figure 3b; Appendix S3). The functional classifications of genes involved in expanded and contracted gene families account for various traits of F. nilgerrensis, including its thick leaves, strong adaptability and disease resistance. Next, we compared the gene families among the five Rosaceae genomes (including F. vesca, R. chinensis, P. avium and R. occidentalis) and identified 17 034 gene families consisting of 25 669 genes in F. nilgerrensis. F. nilgerrensis shared the most gene families with the F. vesca and R. chinensis than P. avium and R. occidentalis. In addition, F. nilgerrensis, F. vesca, R. chinensis, P. avium and R. occidentalis had similar numbers of gene families, which further validates the accuracy and completeness of our gene predictions at the gene family level. Of these gene families, 11 591 were shared by all five genomes and 350 gene families, consisting of 1099 genes, were unique to F. nilgerrensis (Figure 2c). KEGG analysis showed the putative F. nilgerrensis‐specific genes were mainly involved in ribosome (25), plant–pathogen interaction (8), purine metabolism (6) and plant hormone signal transduction (6) (Figure 3c; Appendix S4).
Figure 3.
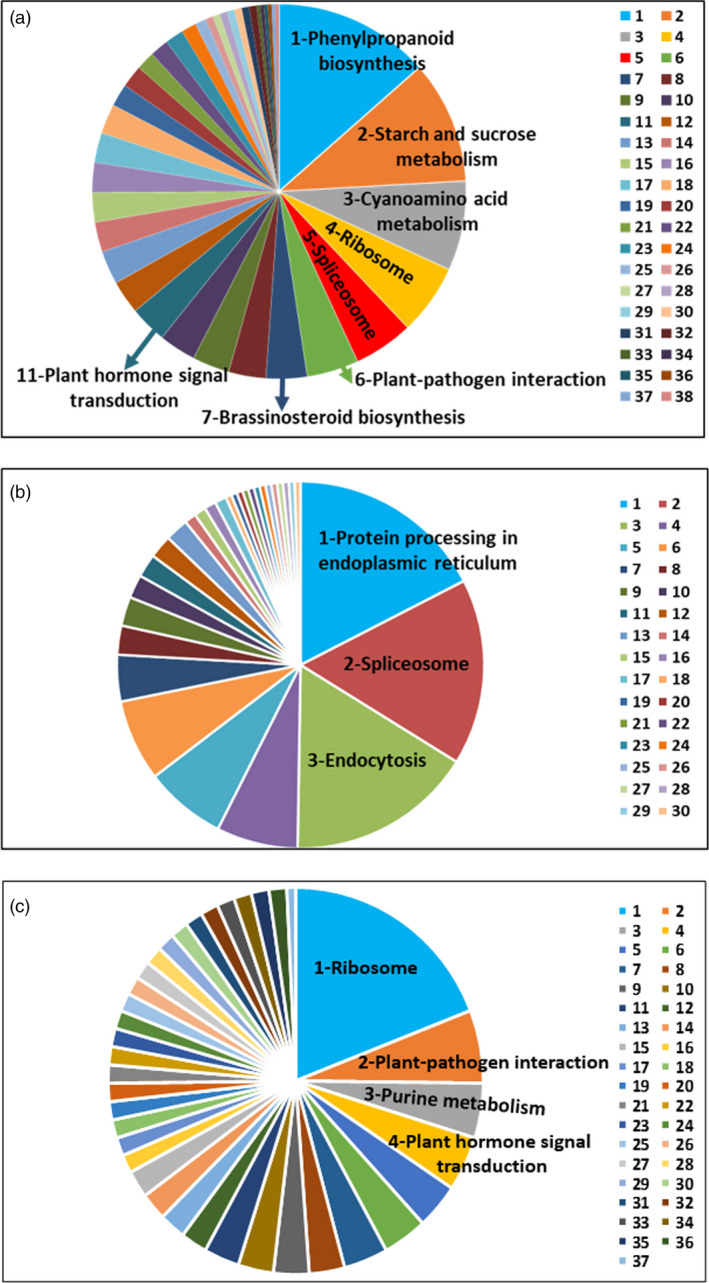
Functional classifications of expansion, contraction and unique genes in Fragaria nilgerrensis by KEGG. (a) Functional classification of expansion genes in F. nilgerrensis, 1. phenylpropanoid biosynthesis, 2. starch and sucrose metabolism, 3. cyanoamino acid metabolism, 4. ribosome, 5. spliceosome, 6. plant–pathogen interaction, 7. brassinosteroid biosynthesis, 8. galactose metabolism, 9. oxidative phosphorylation, 10. carbon metabolism, 11. plant hormone signal transduction, 12. pentose and glucuronate interconversions, 13. amino sugar and nucleotide sugar metabolism, 14. photosynthesis, 15. DNA replication, 16. nucleotide excision repair, 17. mismatch repair, 18. homologous recombination, 19. cysteine and methionine metabolism, 20. biosynthesis of amino acids, 21. pentose phosphate pathway, 22. glutathione metabolism, 23. sulphur metabolism, 24. RNA transport, 25. endocytosis, 26. purine metabolism, 27. pyrimidine metabolism, 28. inositol phosphate metabolism, 29. porphyrin and chlorophyll metabolism, 30. RNA polymerase, 31. phosphatidylinositol signalling system, 32. protein processing in endoplasmic reticulum, 33. glycine, serine and threonine metabolism, 34. monobactam biosynthesis, 35. lysine biosynthesis, 36. aminoacyl‐tRNA biosynthesis, 37. 2‐Oxocarboxylic acid metabolism, 38. ubiquitin mediated proteolysis;(b) Functional classification of contraction genes in F. nilgerrensis, 1. protein processing in endoplasmic reticulum, 2. spliceosome, 3. endocytosis, 4. pentose and glucuronate interconversions, 5. starch and sucrose metabolism, 6. linoleic acid metabolism, 7. alpha‐linolenic acid metabolism, 8. mRNA surveillance pathway, 9. plant hormone signal transduction, 10. tryptophan metabolism, 11. phenylpropanoid biosynthesis, 12. flavonoid biosynthesis, 13. stilbenoid, diarylheptanoid and gingerol biosynthesis, 14. steroid biosynthesis, 15. tyrosine metabolism, 16. isoquinoline alkaloid biosynthesis, 17. tropane, piperidine and pyridine alkaloid biosynthesis, 18. glycine, serine and threonine metabolism, 19. valine, leucine and isoleucine biosynthesis, 20. arginine and proline metabolism, 21. phenylalanine metabolism, 22. glutathione metabolism, 23. glycerophospholipid metabolism, 24. terpenoid backbone biosynthesis, 25. monoterpenoid biosynthesis, 26. carbon metabolism, 27. biosynthesis of amino acids, 28. ribosome biogenesis in eukaryotes, 29. protein export, 30. plant–pathogen interaction; (c) Functional classification of unique genes in F. nilgerrensis, 1. ribosome, 2. plant–pathogen interaction, 3. purine metabolism, 4. plant hormone signal transduction, 5. carbon metabolism, 6. ubiquitin mediated proteolysis, 7. phagosome, 8. citrate cycle, 9. pyrimidine metabolism, 10. RNA polymerase, 11. DNA replication, 12. glycolysis, 13. RNA transport, 14. SNARE interactions in vesicular transport, 15. endocytosis, 16. pentose and glucuronate interconversions, 17. oxidative phosphorylation, 18. photosynthesis, 19. lysine degradation, 20. tryptophan metabolism, 21. glutathione metabolism, 22. starch and sucrose metabolism, 23. brassinosteroid biosynthesis, 24. triterpenoid biosynthesis, 25. tropane, piperidine and pyridine alkaloid biosynthesis, 26. 2‐Oxocarboxylic acid metabolism, 27. biosynthesis of amino acids, 28. RNA degradation, 29. spliceosome, 30. proteasome, 31. nucleotide excision repair, 32. mismatch repair, 33. homologous recombination, 34. protein processing in endoplasmic reticulum, 35. peroxisome, 36. AGE‐RAGE signalling pathway in diabetic complications, 37. pentose phosphate pathway.
Repetitive sequences and transposable elements
To obtain a genome‐wide annotation of repetitive sequences of F. nilgerrensis, RepeatMasker package (Tarailo‐Graovac and Chen, 2009) was used to annotate repetitive sequence based on a combination of Repbase (Bao et al., 2015) and the de novo predicted repeats database (see Methods for details). In the F. nilgerrensis genome, transposable elements (TEs) represented 117.22 Mb (43.36% of the 270.3 Mb final assembly; Table 2). The most abundant repetitive sequences in this genome were retrotransposons or class I elements (48.68% of TE content, 21.11% of the sequenced genome), of which long terminal repeat retrotransposons (LTR‐RTs) accounted for 16.55 % of the genome assembly (Table 2). The numbers of Gypsy elements were more than Copia elements (Figure 4; Table 2). Non‐LTR retrotransposons long intersperced nuclear elements (LINEs) and potential short intersperced nuclear elements (SINEs) represented 3.15 % of the sequence genome (Table 2). DNA transposons, also called class II elements (DNA transposons and Helitrons), maked up 39.49 % of the TE content (17.12% of the genome assembly; Table 2).
Table 2.
The comparison of repetitive sequences between Fragaria nilgerrensis and F. vesca (Hawaii‐4)
| Type | F. nilgerrensis | F. vesca | ||||
|---|---|---|---|---|---|---|
| Number | Length (bp) | Rate (%) | Number | Length (bp) | Rate (%) | |
| ClassI | 77 778 | 57 063 567 | 21.11 | 78062 | 49 183 869 | 22.32 |
| ClassI/DIRS | 2172 | 1 968 677 | 0.73 | 1490 | 1 181 727 | 0.54 |
| ClassI/LINE | 19 088 | 8 315 089 | 3.08 | 12895 | 4 938 717 | 2.24 |
| ClassI/LTR | 353 | 265 376 | 0.10 | 382 | 292 959 | 0.13 |
| ClassI/LTR/Copia | 22 217 | 16 264 615 | 6.02 | 15433 | 12 945 703 | 5.87 |
| ClassI/LTR/Gypsy | 30 852 | 28 207 381 | 10.44 | 25009 | 21 674 646 | 9.84 |
| ClassI/PLE|LARD | 1620 | 1 242 370 | 0.46 | 20872 | 7 424 218 | 3.37 |
| ClassI/SINE | 863 | 195 484 | 0.07 | 1257 | 193 545 | 0.09 |
| ClassI/SINE|TRIM | 9 | 6858 | 0.00 | 0 | 0 | 0.00 |
| ClassI/TRIM | 422 | 514 143 | 0.19 | 598 | 418 479 | 0.19 |
| ClassI/Unknown | 182 | 95651 | 0.04 | 126 | 113 875 | 0.05 |
| ClassII | 73 218 | 46 284 298 | 17.12 | 42 842 | 22 754 418 | 10.33 |
| ClassII/Crypton | 1 | 36 | 0.00 | 2 | 152 | 0.00 |
| ClassII/Helitron | 7549 | 4 147 052 | 1.53 | 6401 | 2 833 166 | 1.29 |
| ClassII/MITE | 582 | 156 004 | 0.06 | 1834 | 439 172 | 0.20 |
| ClassII/Maverick | 171 | 133 086 | 0.05 | 332 | 135 320 | 0.06 |
| ClassII/TIR | 51 313 | 36 948 539 | 13.67 | 26 881 | 16 869 199 | 7.66 |
| ClassII/Unknown | 13 602 | 4 910 105 | 1.82 | 7392 | 2 477 409 | 1.12 |
| PotentialHostGene | 9641 | 4 062 514 | 1.50 | 1782 | 625 063 | 0.28 |
| SSR | 142 | 25707 | 0.01 | 150 | 140 915 | 0.06 |
| Unknown | 28 203 | 9 884 875 | 3.66 | 13 627 | 4 101 107 | 1.86 |
| Total | 160 779 | 117 216 089 | 43.36 | 122 836 | 76 805 372 | 34.85 |
Figure 4.
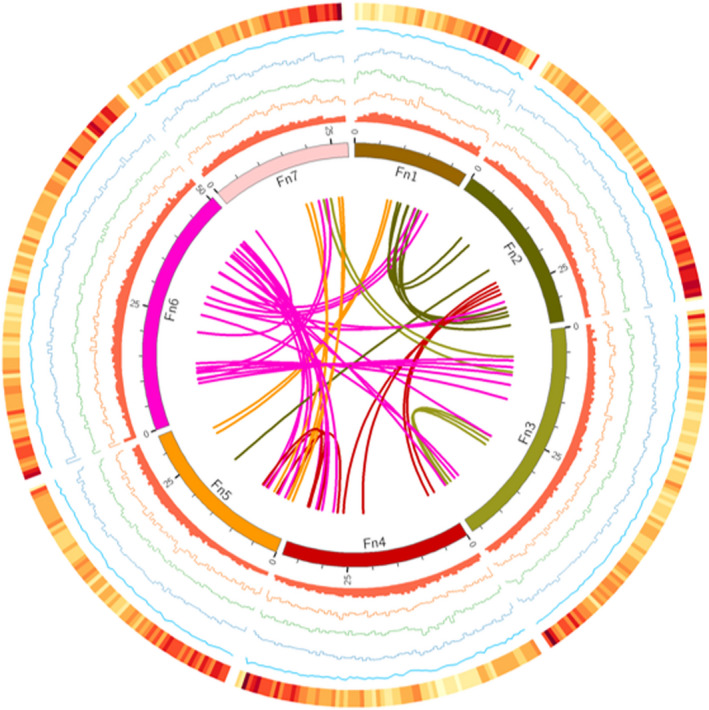
Genome landscape of Fragaria nilgerrensis. Elements are shown in the following scheme (from inner to outer). (i) Syntenic relationships among different chromosomes of F. nilgerrensis; (ii) distribution of repeats (window size, 100 kb); (iii) distribution of Copia elements (window size, 100 kb); (iv) distribution of Gpysy elements (window size, 100 kb); (v) distribution of TIR elements (window size, 100 kb); (vi) distribution of GC content (window size, 100 kb); (vii) gene density (window size, 100 kb).
Next, we analysed TE differences between F. nilgerrensis and F. vesca. Approximately 117.22 Mb and 76.81 Mb TEs were identified in the F. nilgerrensis and F. vesca genomes, respectively (Table 2). We found that retrotransposon elements accounted for the largest TEs genomic fraction in F. vesca (22.32%), similar to F. nilgerrensis (21.11%). More copies for class II elements or DNA transposons were found in F. nilgerrensis than F. vesca, especially in TIR (Figure 4; Table 2). TIR accounted for 13.67% of the genome assembly in F. nilgerrensis, whereas TIR represented 7.65 % of the genome assembly in F. vesca. This suggests that the difference in genome size between F. nilgerrensis and F. vesca is mainly due to an expansion of the TEs and the difference in the repeats content (~40 Mb) can account for 80.98 % of the increased genome size in F. nilgerrensis compared with F. vesca genome.
We also compared the distribution of TEs in 16 820 orthologous gene pairs between F. nilgerrensis and F. vesca. We found the numbers of TEs distributed in promoters and downstream regions of genes were similar between F. nilgerrensis and F. vesca. The number of TEs in intron regions of F. nilgerrensis was significantly larger than F. vesca (Figure 5a). Interestingly, TEs were also highly enriched in exon regions of genes in the F. nilgerrensis compared with the corresponding regions of F. vesca (Figure 5a).
Figure 5.
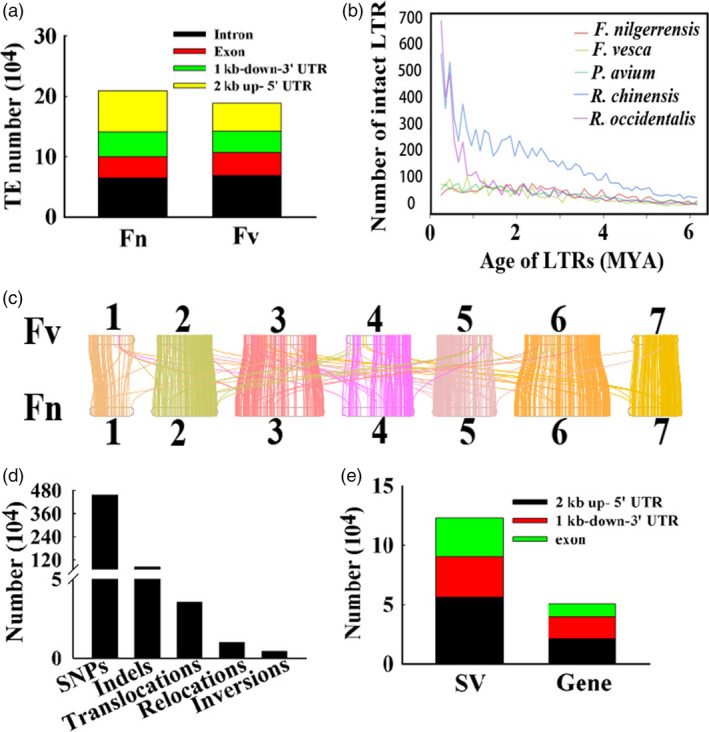
The comparison of Fragaria nilgerrensis and F. vesca genomes. (a) The distribution of transposable element (TE) in the exon, promoter (2kb up‐ 5' UTR) and downstream (1kb‐down‐3' UTR) regions of genes in the F. nilgerrensis and F. vesca genome. (b) Distribution of insertion ages of LTR retrotransposons. The x‐axis represents the estimated insertion age of the LTR retrotransposons. The y‐axis represents the number of intact LTR retrotransposons. (c) Syntenic blocks share between the F. nilgerrensis and F. vesca genomes. (d) The numbers of SNPs, Indels, inversions, translocations, relocations in F. nilgerrensis genome compared with F. vesca genome. (e) The distribution of structural variation (SV) in the exon, promoter (2kb up‐ 5' UTR) and downstream (1kb‐down‐3' UTR) regions of genes in the F. nilgerrensis genome.
Finally, we investigated insertion ages for LTR retrotransposons among F. nilgerrensis, F. vesca, R. chinensis, P. avium and R. occidentalis. The insertion ages of LTR retrotransposons displayed similar insertion profiles among the genomes of F. nilgerrensis, F. vesca and P. avium (Figure 5b). R. chinensis and R. occidentalis had more LTR retrotransposons than F. nilgerrensis and carried the largest number of LTR retrotransposons with insertion ages less than 0.2 Mya (Figure 5b), which might result from variable environmental conditions.
Genome comparison between F . nilgerrensis and F . vesca
Genetic variations, such as insertion and deletion polymorphisms are responsible for genetic diversity and phenotypic variations (Zhang et al., 2019). F. nilgerrensis has obvious phenotypic differences with respect to F. vesca, which made us comprehensive catalogues of genomic variations between these two species. Using a full‐genome alignment approach, we identified 403 syntenic blocks with 16 820 conserved genes covering 61.29% and 58.83% of the F. nilgerrensis and F. vesca genomes (Figure 5c), respectively. The large number of collinear blocks indicates good gene collinearity between the genomes of F. nilgerrensis and F. vesca (Figure 5c). We identified 4 561 825 SNPs in F. nilgerrensis genome compared with F. vesca genome and F. nilgerrensis genome had an average density of 16.9 SNPs per kilobase (Figure 5d). Among these SNPs, the G to A (15.18%), T to C (15.10%), A to G (15.07%) and C to T (15.17%) represented the most abundant groups (Table S7). Chromosome 6 had the highest number of SNPs (865 301), while chromosome 1 had the lowest number of SNPs (435 611; Table S8). In addition, we identified 846 301 Indels in F. nilgerrensis genome compared with F. vesca genome and F. nilgerrensis genome had an average density of 3.1 Indels per kilobase (Figure 5d). Chromosome 6 had the highest number of SNPs and Indels, whereas chromosome 1 had the lowest number of SNPs and Indels (Table S8–S9). The numbers of SNPs and Indels on chromosomes were consistent with the length of corresponding chromosome (Table 1; Table S8–S9). Additionally, we also identified 4243 inversions, 35 498 translocations and 10 099 relocations in F. nilgerrensis genome relatively to F. vesca genome (Figure 5d). Next, the distribution of structural variation (SV) in the exon, promoter (2kb up‐ 5' UTR) and downstream (1kb‐down‐3' UTR) regions of genes in the F. nilgerrensis genome was carried out. We found 32 930 SV in the exon regions of 10 946 genes, 56 146 SV in the promoter regions of 21 369 genes, and 33 886 SV in the downstream regions of 18 300 genes (Figure 5e). The great variations between F. nilgerrensis and F. vesca may provide some information for their phenotypic differences.
Lower expression of FnMYB10 may lead to white‐fruited F . nilgerrensis
The colour of strawberry mainly results from the accumulation of anthocyanin and the fruits of F. nilgerrensis are white. The mature red fruits of F. vesca (Ruegen) mainly accumulate cyanidin 3‐glucoside (Cy3G) and pelargonidin 3‐glucoside (Pg3G), while F. nilgerrensis only has very little accumulated cyanidin 3‐glucoside in its mature white fruits (Figure 6a; Figure S9). The anthocyanin content was dramatically reduced in F. nilgerrensis mature fruits compared with red fruits F. vesca. To identify candidate genes that might explain the loss‐of‐colour phenotype in white‐fruited F. nilgerrensis, we compared the expression of anthocyanin‐related genes in three developmental stages (green, turn and ripe stages) of white‐fruited F. nilgerrensis with red‐fruited F. vesca by qRT‐PCR to test whether gene expressions of some of anthocyanin‐related genes are blocked in F. nilgerrensis. We found transcript levels of most of anthocyanin biosynthesis pathway genes (Figure 6b), such as PAL1.2, C4H1, 4CL3, CHI, F3H and DFR, were significantly down‐regulated in three developmental stages in F. nilgerrensis compared with F. vesca (Figure 6c). Interestingly, we found MYB10, a key positive factor in regulating anthocyanin accumulation, was also dramatically reduced in three developmental stages in F. nilgerrensis relatively to F. vesca (Figure 6c). The lower expression of FnMYB10 may be responsible for the white fruit phenotype of F. nilgerrensis.
Figure 6.
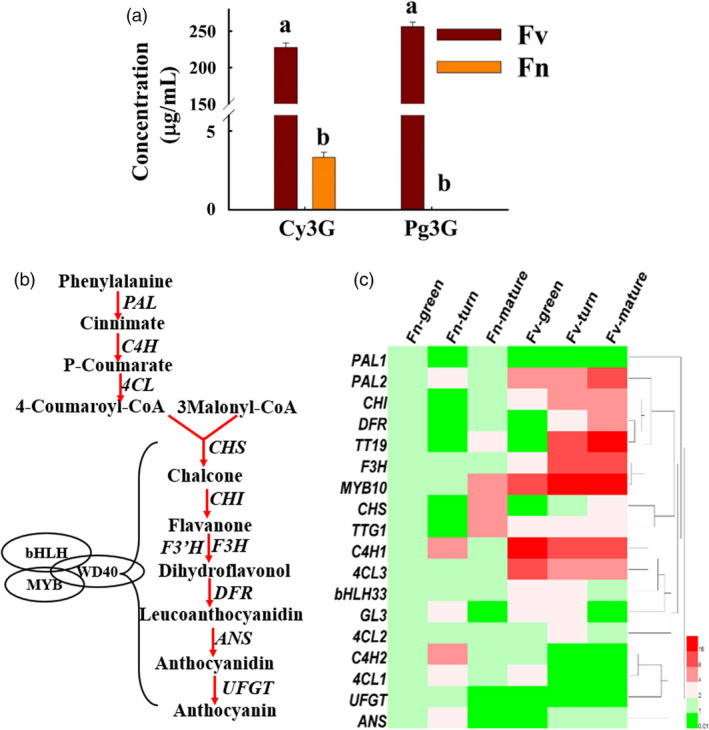
The anthocyanin content and anthocyanin‐related gene expression between Fragaria nilgerrensis (Fn) and F. vesca (Fv). (a) The anthocyanin content and compositions between the mature fruits of F. nilgerrensis (Fn) and F. vesca (Fv). (b) Simplified scheme of anthocyanin biosynthetic and regulatory pathway in plants. Biosynthetic genes are shown in right or left side of arrow and the transcription factors are shown in oval. PAL phenylalanine ammonia lyase, C4H cinnamate‐4‐hydroxylase, 4CL 4‐coumarate CoA ligase, CHS chalcone synthase, CHI chalcone isomerase, F3H flavanone 3‐hydroxylase, F3’H flavonoid 3’‐hydroxylase, DFR dihydroflavonol 4‐reductase, ANS anthocyanidin synthase, LDOX, leucoanthocyanidin dioxygenase, UFGT, UDP‐flavonoid glucosyl transferase. (c) The gene expression heatmap of anthocyanin‐related genes in three developmental stages (green, turn and ripe stages) of white‐fruited F. nilgerrensis (Fn) and red‐fruited F. vesca (Fv). Heml software is used for making gene expression heatmap.
We cloned and sequenced the coding regions of MYB10 from white‐fruited F. nilgerrensis (FnMYB10) and red‐fruited F. vesca (FvMYB10). FnMYB10 contains an open reading frame (ORF) of 702 bp that encodes a protein of 233 amino acids and the ORF of FvMYB10 is 708 bp which encodes a protein of 235 amino acids (Figure S10). Alignment of the amino acids of FnMYB10 and FvMYB10 displayed that there were two amino acid deletion and six amino acid differences with respect to FvMYB10 (Figure 7a; S10). The transcript level of FnMYB10 was significantly reduced in the white‐fruited F. nilgerrensis and the FnMYB10 amino acids did not result in frameshift and premature stop codon (Figure 7a; S10). Thus, we hypothesized that the mutation in the promoter region might lead to loss‐of‐colour phenotype in white‐fruited F. nilgerrensis. We first use genome sequence information to analyse the promoter of MYB10 and found they were some variations in the promoter between F. nilgerrensis and F. vesca. Next, we amplified the MYB10 promoter from F. nilgerrensis and F. vesca by PCR and the primer sets were shown in Table S10. The promoter sequences between the FnMYB10 and FvMYB10 showed that there were eight deletions and two insertions (nucleotide changes more than five were shown; Figure 7a; S11). We identified and predicted the missing cis‐acting elements in the promoter region of FnMYB10 through aligning to PLACE database (Higo et al., 1999) and found some missing cis‐acting elements in F. nilgerrensis were involved in sugar responses (Sun et al., 2003) and light regulation (Terzaghi and Cashmore, 1995). To investigate whether the promoter sequence differences in MYB10 affect MYB10 promoter activity, promoters from FnMYB10 and FvMYB10 were fused to luciferase gene (Figure 7b) and transformed into tobacco leaves. We investigated the luciferase activity of ProFnMYB10‐Luc and ProFvMYB10‐Luc in different tobacco leaves and different parts of the same tobacco leaf (Figure 7c). Interestingly, both of them showed the ProFvMYB10‐Luc exhibited significantly higher Luc activity than the ProFnMYB10‐Luc (Figure 7c,d). These results indicate that the variations at the upstream regulatory region of FnMYB10 reduce the promoter activity of the FnMYB10 gene and result in its lower expression, which may be responsible for its white fruit phenotype of F. nilgerrensis.
Figure 7.
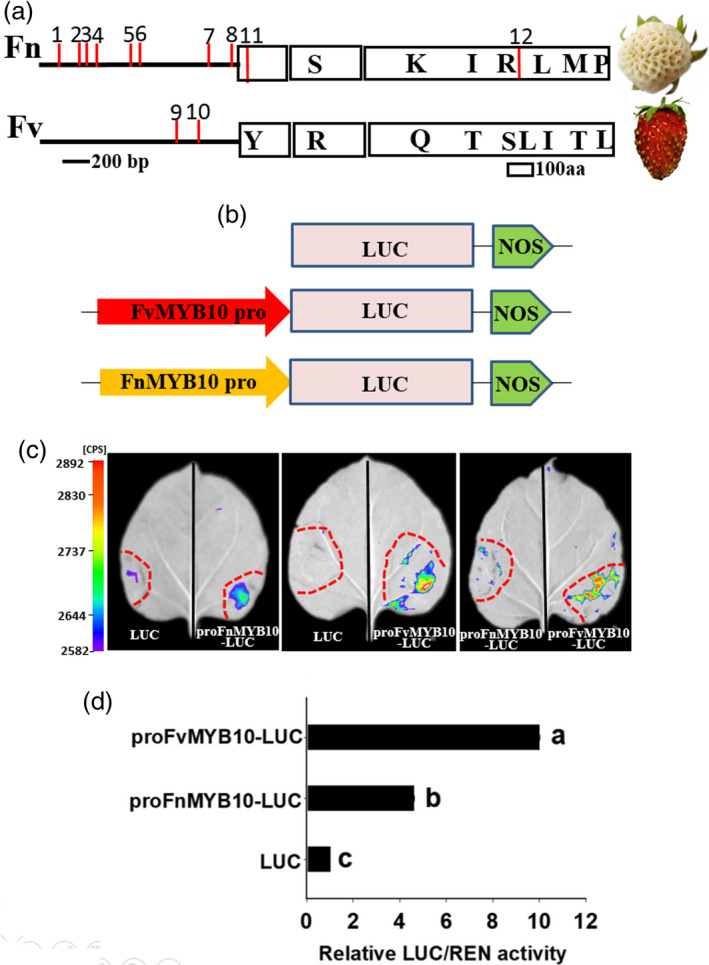
The comparison of sequences and transcription activity of MYB10 promoter between Fragaria nilgerrensis (Fn) and F. vesca (Fv). (a) The comparison of MYB10 promoter and protein between F. nilgerrensis (Fn) and F. vesca (Fv). Promoter and protein are shown as lines and boxes, respectively. Red lines (1–8) represent missing cis‐acting elements in the promoter of F. nilgerrensis compared with F. vesca. Red lines (9, 10) represent missing cis‐acting elements in the promoter of F. vesca compared with F. nilgerrensis. Red lines (11, 12) represent missing amino acids in F. nilgerrensis compared with F. vesca. Amino acids changes between F. nilgerrensis (Fn) and F. vesca (Fv) are shown in boxes. (b) Schematic diagrams of the Luc, ProFnMYB10‐Luc and ProFvMYB10‐Luc reporter constructs used for tobacco transient expression assay. (c) Luciferase activity assay. The Luc, ProFnMYB10‐Luc and ProFvMYB10‐Luc are transformed into Nicotiana benthamiana. (d) The comparison of luciferase activity. The transcriptional activity of these infiltrated tobacco leaves based on the ratio of LUC to REN is investigated by Dual Luciferase Reporter Gene assay kit. Different letters indicate significant differences (P < 0.05, based on Duncan’s multiple range test).
Discussion
There are 24 wild species of Fragaria with different ploidy have been identified (Folta and Davis, 2006; Hummer and Hancock, 2009; Staudt, 2009). These wild Fragaria species are a valuable resource for genetic evolution and comparative genomics research. Additionally, wild species of Fragaria have many important characteristics, which can be used for substantial improvements of the cultivated strawberry. However, the genome information of most of these wild Fragaria species is largely unavailable and it is difficult to obtain the important trait from wild species without the availability of high‐quality reference genome. The genome of F. vesca (Hawaii‐4) is assembled by Shulaev et al . (2011) using a combination of different short‐read technologies and the contig N50 length is only about 27 kb, which is incomplete and highly fragmented. Next, some studies re‐annotate F. vesca genome based on Illumina‐based (Darwish et al., 2015) and the mixture of Illumina‐ and SMRT‐based RNA‐seq transcriptome sequences (Li et al., 2017). Edger et al. (2017 yields a high‐quality reference genome of F. vesca with a contig N50 length of around 7.9 Mb based on a combination of single‐molecule sequencing and optical mapping, which dramatically improved the genome quality compared with the short‐read‐based draft genome of F. vesca. The genome sequences of three diploid wild species, F. iinumae, F. nipponica, F. nubicola, and one tetraploid wild species F. orientalis are obtained using Illumina and Roche 454 platforms (Hirakawa et al., 2014). These draft genomes are based on second‐generation sequencing technologies which are difficult to get the large repetitive sequences and lead to highly fragmented genome assemblies (Michael and VanBuren, 2015). Transcriptome sequences of four diploid wild species F. nilgerrensis, F. pentaphylla, F. mandshurica, F. viridis, and three tetraploid wild species F. corymbosa, F. moupinensis and F. tibetica are released by Qiao et al . (2016) for evolutionary patterns analysis, while the genome sequences of these wild species of Fragaria are not available. Here, we provide a high‐quality genome of diploid strawberry F. nilgerrensis using SMRT Pacific Biosciences sequencing and Hi‐C genome scaffolding. A high‐quality reference genome is critical for obtaining structural variants, linking phenotype–genotype associations, using for genome evolution and comparative genomics research and identifying gene controlling important traits (Schulz et al., 2013; Song et al., 2018; Zhang et al., 2019).
The genome size of F. nilgerrensis is 270.3 Mb. The flow cytometric analysis of F. nilgerrensis suggests that the estimated F. nilgerrensis genome size is 1C = 274±3.80 Mb (Chen et al., 2015), which is very close to our assembly size (270.3 Mb). The genome size of F. vesca V4 genome is 220.4 Mb which is 49.9 M smaller than F. nilgerrensis. The major reason is dramatic expansion of TEs in F. nilgerrensis, especially in ClassII/TIR, ClassI/LTR/Copia and ClassI/LTR/Gypsy (Table 2). Strong correlation between genome size and the proportion of TEs has been reported in many studies (Biemont, 2008; Huang et al., 2019; Tenaillon et al., 2011). The contig N50 size of F. nilgerrensis is ∼8.5 Mb which is larger than F. vesca V4 genome with an N50 length of∼7.9 Mb and less than model plants Arabidopsis with an N50 length of 12.3 Mb (Michael et al., 2018). The smaller genome size and sufficient genetic resources may account for the much larger contig N50 in Arabidopsis than F. nilgerrensis. We identified 28 780 genes in F. nilgerrensis and the numbers of genes of F. nilgerrensis are similar to F. vesca V4 genome. However, the predicted genes in F. nilgerrensis genome are significantly less than the results of Qiao et al (2016). They annotate 82537 genes in F. nilgerrensis based on RNA‐seq data and the reference genome of F. nilgerrensis is not available at that time, which may result in incorrect size genes, mis‐annotated intron/exon junctions and mis‐annotated transcripts (Darwish et al., 2015). This phenomenon also shows in woodland strawberry F. vesca (Edger et al. 2017; Shulaev et al., 2011). A total of 34 809 genes are identified in F. vesca V1 genome utilizing second‐generation sequencing technologies, while the numbers of genes are reduced to 28 588 in F. vesca V4 genome using single‐molecule real‐time sequencing. Therefore, a high‐quality genome is also invaluable for gene identification and annotation.
Phylogenetic analysis of the nuclear internal transcribed spacer region and chloroplast DNA sequences suggests that F. nilgerrensis, F. nipponica, F. daltoniana, F. pentaphylla and F. gracilis are in the some clade and F. nilgerrensis appears as a high divergence evolutionary unit within this clade (Potter et al., 2000). F. vesca, F. nubicola and the polyploid wild species are in other major clade (Potter et al., 2000). The cross compatibility of F. vesca to many Fragaria species is comparatively high (Hancock and Luby, 1993; Sargent et al., 2004), while F. nilgerrensis has a comparatively low compatibility to other Fragaria species (Hancock and Luby, 1993). Many studies also show that phylogenetic relationship between F. nilgerrensis and F. vesca is distant (Liu et al., 2016; Njuguna et al., 2013; Potter et al., 2000; Qiao et al., 2016; Rousseau‐Gueutin et al. 2009). We actually found many differences between F. nilgerrensis and F. vesca on TEs, SNPs, Indels and SVs. TEs can replicate and integrate into different positions of the genome in changing environment, which are important for genetic diversity, phenotypic variation and adaptation (Niu et al., 2019). The content and distributions of TEs were different between F. nilgerrensis and F. vesca. And F. nilgerrensis had more TEs than F. vesca and TEs were enriched in exon regions of genes in the F. nilgerrensis than the corresponding regions of F. vesca, suggesting that TEs could potentially contribute to the diversification of gene function in F. nilgerrensis (Casacuberta and Gonzalez, 2013; Chuong et al., 2017; Li et al., 2018). Genetic variations are an important factor for genetic diversity and phenotypic variations (Zhang et al., 2019). The variations between F. nilgerrensis and F. vesca may result in phenotype differences between these two species. The phenotypic variations between ‘Golden Delicious’ genome and ‘Hanfu’ genome also suggest that genome variations account for different phenotypes between these two apple cultivars (Daccord et al, 2017; Zhang et al, 2019). In addition, some literatures show that F. nilgerrensis shares more common features with tetraploid F. moupinensis (Darrow, 1966), hexaploid F. moschata (Chambers et al. 2013) and decaploid F. iturupensis (Liston et al., 2014). The availability of F. nilgerrensis genome may provide some information on the relationships among these species.
The distribution of F. nilgerrensis is in roadside, grassland and hillside areas in Yunnan, China (Figure S1) (Wang et al., 2017), and F. nilgerrensis has many traits to adapt to changing environments including leathery and thick leaves, waterlogging tolerance and resistance to leaf disease (Guo et al., 2017). Our results indicate that the significantly expanded families in F. nilgerrensis are mainly involved in phenylpropanoid biosynthesis, starch and sucrose metabolism, cyanoamino acid metabolism, plant–pathogen interaction, brassinosteroid biosynthesis, and plant hormone signal transduction compared with other species (Figure 3a). The expanded gene families in F. nilgerrensis may account for its phenotype and resistance to biotic/abiotic stress. Multiple studies have reported that the expanded families in different plants may contribute to these specific phenotype and abiotic and biotic stress tolerance, such as durian (Liu et al., 2019; Teh et al., 2017), wild barley (Liu et al., 2019) and wild pear (Dong et al., 2019). We also found 350 gene families (1099 genes) were unique to F. nilgerrensis compared with the other four Rosaceae species. F. nilgerrensis‐specific genes were enriched in pathways participated in ribosome, plant–pathogen interaction, purine metabolism and plant hormone signal transduction (Figure 3c). Specific genes related to development or defence responses are also reported in wild barley (Liu et al., 2019) and orchardgrass genome (Huang et al., 2019). The genotype‐specific genes are considered to be the existence of variable genomes (Amiri et al., 2003; Dong et al., 2019; Liu et al., 2019; Teh et al., 2017), and these genes may have significant roles in species‐specific biology and biological evolution (Xu et al., 2015). Therefore, the potential of using the wild Fragaria species in breeding and identification of genes for agronomically important traits is available (Bors and Sullivan, 1998).
Fruit colour is an important trait for many horticulture crops and strawberry mainly accumulates anthocyanin in fruits. In this study, we found MYB10 might be responsible for the white fruit phenotype of F. nilgerrensis. A recent study shows a premature stop codon in FaMYB10 in octoploid strawberry (Fragaria × ananassa Duch.) results in loss of red colour in white octoploid strawberry (Wang et al., 2019). However, the coding regions of FnMYB10 in F. nilgerrensis encoded functional proteins. Thus, the sequence variations in the upstream regulatory region of FnMYB10 are likely responsible for lower expression of FnMYB10. MYB10 is considered as the master regulator in controlling anthocyanin accumulation in apple (Ban et al., 2007; Chagne et al., 2007; El‐Sharkawy et al., 2015; Espley et al., 2009; Espley et al., 2007; Medina‐Puche et al., 2015), pear (Wang et al., 2013; Zhai et al., 2015) and strawberry (Lin‐Wang et al., 2014; Zhang et al., 2017). The pattern of anthocyanin accumulation in many horticulture crops arises from the sequence variations or methylation in the promoter region of MYB10 (Espley et al., 2009; Medina‐Puche et al., 2015; Wang et al., 2013). Here, we also found there were many sequence variations in the promoter region of F. nilgerrensis compared with FvMYB10 from red‐fruited F. vesca (Figure 7a; Figure S11). Among the sequence variations, we found two important cis‐acting elements involved in sugar responses (Sun et al., 2003) and light regulation (Terzaghi and Cashmore, 1995) were missing in F. nilgerrensis promoter region compared with F. vesca. Sucrose is a crucial signal in promoting anthocyanin accumulation and affecting fruit ripening in strawberry (Jia et al., 2013; Luo et al., 2019). Light can regulate anthocyanin biosynthesis through activation of FaMYB10 expression during strawberry fruit ripening (Kadomura‐Ishikawa et al., 2014). Therefore, the missing of these two important cis‐acting elements in MYB10 of F. nilgerrensis may affect the regulatory roles of sucrose and light in MYB10. Interestingly, the promoter from F. nilgerrensis and F. vesca showed different capacity in regulating luciferase gene expression and the luciferase activity of F. nilgerrensis promoter was significantly reduced compared with F. vesca (Figure 7c and d). Thus, the variations in the promoter of FnMYB10 resulted in lower gene expression of FnMYB10 to confer the loss‐of‐colour phenotypic change in F. nilgerrensis. These results will facilitate developing marker for fruit colour selection at an early stage and enrich the regulatory network of anthocyanin accumulation in strawberry.
Together, this genome of F. nilgerrensis will lay a solid foundation for conducting comparative genomics research, elucidating the relationships among different wild species of Fragaria, and identifying genes governing important agronomic traits.
Experimental procedures
Plant materials
The diploid Fragaria nilgerrensis (2n = 2x = 14) was used for genome sequencing. F. nilgerrensis was originally obtained from Zhongdian, Yunnan, China (altitude: 3321 m, 27°40′07″E, 99°43′17″N), and is maintained at Shenyang Agriculture University (123°33′58″E, 41°49′9″N; Shenyang). The fruit of F. nilgerrensis is white and the fruit of F. vesca accession ‘Ruegen’ is red. For the different ripening stages of F. nilgerrensis and F. vesca, fruits at 8 days (green stage), 24 days (turning stage) and 32 days (mature stage) after pollination were collected for qRT‐PCR analysis. In each ripening stage (8 days post‐anthesis, 24 days post‐anthesis and 32 days post‐anthesis), we profiled twenty fruits from twenty plants for qRT‐PCR. Mature fruits (32 days post‐anthesis) of F. nilgerrensis and F. vesca were used for testing the anthocyanin content and composition by HPLC.
Illumina short‐read sequencing
Genomic DNA of F. nilgerrensis was extracted from young leaf tissue using a DNAsecure Plant Kit (TIANGEN, Beijing, China). The DNA quality and concentration were tested by 1% agarose gel electrophoresis and Qubit 2.0 Fluorometer (Life Technologies, Carlsbad, CA, USA). The 220‐bp paired‐end (PE) libraries were constructed using the NEBNext® Ultra™ DNA Library Prep Kit and sequenced on the Illumina HiSeq X Ten platform at the Biomarker Technologies Corporation, Beijing. The raw Illumina sequencing reads were processed with Trimmomatic program version 0.33 (Bolger et al., 2014) and Cutadapt program version 1.13 (Martin, 2011) to remove adapters, leading and trailing ambiguous or low‐quality bases. Finally, 19.62‐Gb clean reads were used for the assembly evaluation and error correction of genome assembly.
Genome size and heterozygosity analysis
We estimated F. nilgerrensis genome size and heterozygosity based on k‐mer analysis. 19.62‐Gb high‐quality sequencing reads were used to generate a k‐mer (k = 19) depth distribution curve using ‘kmer freq stat’ software developed by Biomarker Technologies Corporation (Beijing, China). The genome size (GS) of F. nilgerrensis was estimated by the following formula: GS = k‐mer number/average k‐mer depth (Gao et al. 2018). The highest peak in the k‐mer distribution was at the k‐mer depth of 57, with a k‐mer number of 17 016 192 556 and the depth of k‐mer more than 115 was the repetitive sequences (Figure S4). The heterozygosity was estimated at ∼0.1 % based on the formula described by Liu et al . (2013).
PacBio SMRT sequencing and assembly
The SMRT Bell library was prepared using a DNA Template Prep Kit 1.0, and 20‐kb SMRTbell libraries were constructed. De novo assembly was carried out using Canu version 1.5 (Koren et al., 2017), with the parameters ‘genomeSize = 250000000, and ‘corOutCoverage = 50’ and Falcon version 0.3.0 (https://github.com/PacificBiosciences/FALCON) with the parameters ‘length_cutoff = 3000, length_cutoff_pr = 8000’, and other parameters ‘default’. Quickmerge (Chakraborty et al., 2016) was used for merging Canu and Falcon pipeline assemble results to produce a more contiguous assembly. Then, the Illumina data were aligned to the assembly contigs from Quickmerge pipeline using bwa mem v0.7.12 (Li, 2013). Finally, the draft assembly was corrected using Pilon version 1.22 (Walker et al., 2014).
Hi‐C assembly
To anchor scaffolds onto the chromosome, we constructed Hi‐C library by the Illumina HiSeq X Ten platform. The trimmed reads of the F. nilgerrensis genome were mapped to the assembly using BWA version 0.7.12 software (Li, 2013) with the parameters (bwa index ‐a bwtsw fasta; bwa aln ‐M 3 ‐O 11 ‐E 4 ‐t 2 fq1; bwa aln ‐M 3 ‐O 11 ‐E 4 ‐t 2 fq2). HiC‐Pro pipeline (Servant et al., 2015) was used for filtering low‐quality reads and quality assessment. The parameters of HiC‐Pro were mapped 2hic fragments.py ‐v ‐S ‐s 100 ‐l 1000 ‐a ‐f ‐r ‐o. LACHESIS (Hariharan and Toyama, 2004) was used for parsing and modelling location of genome sequence with the following parameters: cluster min re sites = 48; cluster max link density = 2, cluster noninformative ratio = 2, order min n res in trun = 14, order min n res in shreds = 15). Finally, PBjelly (English et al., 2012) was used for gap filling for LACHESIS‐based assembly to improve the accuracy and completeness of the genome assembly.
RNA sequencing
RNA was extracted from five tissues (young leaves, stems, flowers, mature fruits and roots) of the same plant used for RNA sequencing (RNA‐Seq) according to the Easy Spin RNA extraction kit (Sangon Biotech, Shanghai, China). The concentration of RNA sample was tested by a NanoDrop spectrophotometer (Thermo Fisher Scientific Inc., Waltham, MA, USA) and a Qubit 2.0 Fluorometer (Life Technologies). The integrity of RNA sample was tested via a Bioanalyzer 2100 (Agilent Technologies, Santa Clara, CA). One RNA library with an average insert size of 250–300 bp was produced using the NEBNext UltraTM RNA Library Prep Kit following descriptions by the manufacturer, Illumina (NEB, Beverly, MA, USA). Library quality was detected on the Agilent Bioanalyzer 2100 system. A combined library of young leaves, stems, flowers, mature fruits and roots was sequenced using the Illumina HiSeq X Ten platform (Illumina, San Diego, CA, USA).
Evaluation of assembly quality
The completeness and accuracy of the genome assembly were evaluated by CEGMA version 2.5 (Parra et al., 2007) and BUSCO version 3.0.2 (Simão et al., 2015). Transcripts from five different tissues and organs were mapped to the assembled genome with GMAP (Wu and Watanabe, 2005) to examine the quality of the genome assembly.
Annotation of repetitive sequences
A de novo repeat database was predicted based on RepeatScout version 1.0.5 (Price et al., 2005), MITE‐Hunter version 1.0 (Han and Wessler, 2010), LTR‐FINDER version 1.0.7 (Xu and Wang, 2007) and PILER version 1.0 (Edgar and Myers, 2005) with default parameters. The predicted repeats from the database were classified using PASTE version 1.0 with default parameters (Hoede et al., 2014). Then, the predicted repeats database combined with Repbase database version 19.06 (Bao et al., 2015) of repetitive DNA elements to a final repeat database. Finally, RepeatMasker program version 4.0.7 (Tarailo‐Graovac and Chen 2009) with the parameters (‐nolow ‐no is ‐norna ‐engine wublast ‐qq –frag 20 000) was used to identify repeat sequences through aligning them against the final repeat database.
Gene perdition and functional annotations
A combination of de novo gene prediction, homology‐based prediction, and RNA‐seq data was used for annotation of protein‐coding genes in the F. nilgerrensis genome. Genscan version 3.1 (Burge and Karlin, 1997), Augustus version 2.5.5 (Stanke and Waack, 2003), GlimmerHMM version 3.0.4 (Majoros et al., 2004), SNAP version 2006–07‐28 (Johnson et al., 2008) and GeneID version 1.4 (Blanco et al. 2007) were used for the de novo gene prediction with default parameters. Sequences of F. vesca, Arabidopsis thaliana, Oryza sativa and Malus × domestica were used for predicting homologous genes by GeMoMa version 1.3.1 (Keilwagen et al., 2016). The RNA‐seq data were aligned to the F. vesca reference genome (v1.0) using PASA v2.0.2 (Tang et al., 2015) under default parameters. All predictions by the three methods were combined using EVidenceModeler v1.1.1 (Haas et al., 2008) with default parameters to generate a consensus gene model. PASA pipeline was used for modifying the final gene models.
Gene functions were assigned based on the best match of the alignments against multiple functional databases through BLASTP (Camacho et al., 2009) (E‐value = 1e‐5), including the nonredundant protein (Nr) database, TrEMBL, KOG and KEGG (Kanehisa et al., 2016). InterProScan version 4.3 (Quevillon et al., 2005) was used to obtain domain information. Gene sequences were also aligned to the GO database (Consortium 2004) to perform functional annotation via Blast2GO (Conesa et al., 2005). In addition, predicted genes were conducted KOG functional enrichment analysis, KEGG pathway enrichment analysis (Kanehisa et al., 2016), and GO functional enrichment analysis.
Prediction of noncoding RNA and pseudogenes
miRNAs and rRNAs in the assembled F. nilgerrensis genome were identified by the INFERNAL software (Nawrocki and Eddy, 2013) against the Rfam 13.0 (Griffiths‐Jones et al. 2005) and miRBase database (Kozomara and Griffiths‐Jones, 2010). The tRNAs were predicted using tRNAscan‐SE version 1.3.1 (Lowe and Eddy, 1997) with the default parameters. The candidate homologous gene sequences were identified by GenBlastA v1.0.4 (She et al., 2009) to mask protein‐coding genes. Then, pseudogenes were predicted by GeneWise v2.4.1 (Birney and Durbin, 2000) with a premature stop premature stop and/or frameshift mutation in the coding region.
Gene family and phylogenetic analyses
OrthoMCL software version 2.0.9 (Li et al., 2003) was used for identifying gene families/clusters among the protein sequences of 13 genomes, including F. vesca, M. × domestica, Prunus avium, Prunus persica, Pyrus Communis, Pyrus bretschneideri, Rosa chinensis, Rubus occidentalis, A. thaliana, Vitis vinifera, Solanum lycopersicum, Citrus sinensis and O. sativa, as well as F. nilgerrensis. The parameters of OrthoMCL were as follows: Pep length 10, Stop coden 20, Percent‐MatchCutoff 50, EvalueExponentCutoff −5, Mcl 1.5 #1.2∼4.0. The gene family expansion and contraction analysis was performed using CAFE pipeline v3.1 (De Bie et al., 2006) with the parameters (lambda ‐l 0.002). Phylogenetic tree was constructed using PhyML v3.1 (Guindon et al. 2005) based on 373 single‐copy genes with the parameters (‐gapRatio 0.5 ‐badRatio 0.25 ‐model HKY85 ‐bootstrap 1000). MCMCtree program (Yang, 2007) was used to estimate divergence times with parameters (burn‐in = 10 000, sample‐frequency = 2, sample‐number = 100 000).
Comparative analysis of F . nilgerrensis and F . vesca genome
The degree of collinearity of F. nilgerrensis and F. vesca was detected using MUMmer version 3.23 software (Delcher et al. 2003). Firstly, we used the parameter ‘‐‐mum –p’. Next, we used the ‘delta‐filter ‐i 80 ‐l 20000’ to filter the alignment result. Finally, we used ‘mummerplot ‐‐png ‐p’ to plot the collinearity between F. nilgerrensis and F. vesca. SNPs and indels between F. nilgerrensis and F. vesca were analysed by MUMmer version 3.23. Firstly, we used the parameter ‘‐maxmatch ‐c 90 ‐l 40’ to align F. vesca and F. nilgerrensis. Then, we used the ‘delta‐filter −1’ parameter with the one‐to‐one alignment block option to filter the alignment results. We used ‘show‐snp’ to identify SNPs and Indels in the one‐to‐one alignment block (parameter ‐Clr TH). SV between F. nilgerrensis and F. vesca was examined by MUMmer version 3.23. We first extracted the alignment blocks of MUMmer version 3.23 with inversions and filtered the blocks with low similarity in the two flanks. The remaining inversion blocks was manually checked and the neighbouring blocks within 50 bp were integrated. Translocation refers to the situation when a DNA fragment occurs in different locations in the two genomes was tested by identifying noncollinear single‐copy homologous blocks (length> 100 bp; identity> 90%) between the F. nilgerrensis and F. vesca genomes. The distribution of SV in the exon, promoter and downstream regions of genes in the F. nilgerrensis genome was detected as described by Delcher et al. (2002) and Zhang et al. (2016a)
Quantitative real‐time PCR
Total RNA from different ripening stage fruits (more detailed descriptions were shown in Sample Collection) of F. nilgerrensis and F. vesca was extracted using the modified CTAB method as described by Zhang et al. (2017). cDNA was synthesized via a PrimeScriptTM RT reagent Kit (TaKaRa, Dalian, China) according to the manufacturer’s protocol. Quantitative real‐time RT‐PCR (qRT‐PCR) was carried out using UltraSYBR Mixture (CWBio, Beijing, China) with gene‐specific primers (Table S10). qRT‐PCR was conducted on the QuantStudioTM6Flex Real‐Time PCR System (Applied Biosystems) in a total volume of 10 μL containing 0.5 μL diluted cDNA, 0.2 μm gene‐specific primers, 3.5 μL ddH2O and 5 μL UltraSYBR Mixture. Thermal cycling conditions consisted of a first step of denaturation at 95°C for 10 min, followed by 40 cycles of denaturation for 15 s at 95°C and annealing/extension for 1 min at 60°C. The 2‐ΔΔCt method was used to calculate the relative mRNA levels. All data were normalized first with the level of the 26S internal transcript control and then with the expression of controls. Each sample was examined in triplicate with three biological replicates (Zhang et al., 2016b).
HPLC analysis
Mature fruits of F. nilgerrensis and F. vesca were harvested in February 2019 (more detailed descriptions were shown in Sample Collection). Then, the fruits were ground to a fine powder in liquid nitrogen. 0.2 g powdered sample was soaked in 2 mL methanol solution containing 1% (v/v) hydrochloric acid at 4°C under the dark condition for 48 h. Then, we centrifuged and collected the supernatant. The residues were re‐soaked with 2 mL methanol solution containing 1% hydrochloric acid and then combined the supernatants and added the supernatants to 5 mL.
Anthocyanins were isolated by the Agilent 1100 liquid chromatography equipped with a DAD diode array detector. Pelargonidin‐3‐glucoside and cyanidin‐3‐glucoside were purchased from Shanghai YuanyeBio‐technology Co., Ltd is Shanghai, China. The standards were dissolved in methanol and the concentrations of these standards were 100 μg/mL. The column was DIKMA ODS column (250 mm × 4.6 mm i.d, 5 µm, reverse phase C18 column). The detected wavelength was 520nm and the temperature for column was 25°C. The mobile phase was 1% trifluoroacetic acid water (solvent A) and acetonitrile (solvent B). The elution contained a gradient system over 52 min at a flow rate of 0.7 mL/min. Initial mobile phase composition was 100% B solvent and kept in 45 min, followed by a linear gradient to 45% B solvent in 47 min, and finally 100% B solvent in 52 min. Compositions were identified by comparing their retention times with standard times under the same conditions.
Dual luciferase reporter system
Promoter region of FnMYB10 and FvMYB10 were amplified from the F. nilgerrensis and F. vesca genomic DNA, respectively. Both of the fragments were digested with Xma I and BamH I, inserted into the pGreenII0800‐LUC vector as reporter plasmids (Hellens et al., 2005). These plasmids were introduced into Agrobacterium tumefaciens strain GV3101 by freeze‐thaw method. Agrobacterium strain GV3101 carrying the empty vector, plasmids ProFnMYB10‐LUC, and ProFvMYB10‐LUC was cultured to OD600 = 1.0 at 28°C, respectively. The cells were harvested and resuspended with medium (1 m MgCl2, 100 mm acetosyringone and 1 m MES, pH 5.6). Then, Agrobacterium was placed at room temperature without shaking for 2h, and infiltrated into 1‐month‐old Nicotiana benthamiana leaves. The infiltrated tobacco was placed in the dark for 24 h and then put them under the light for 48 h. We tested the luciferase signalling by a living fluorescence imager (Lb985, Berthold, Germany). The transcriptional activity of these infiltrated tobacco leaves based on the ratio of luciferase to Renilla (REN) was investigated by Dual Luciferase Reporter Gene assay kit (Beyotime, China). Six biological repeats were measured for each sample. The primers used for the LUC/REN activity analysis were listed in Table S10.
Conflict of interest
No conflicts of interest are declared.
Authors’ contributions
Junxiang Zhang and Zhihong Zhang designed the experiments. Yue Ma, Jiahong Wang and Shuang Yu collected plant materials. Junxiang Zhang, Yingying Lei, He Li, Yuexue Liu, Baotian Wang, Hongyan Dai conducted experiments and analysed data. Song Li conducted bioinformatic analysis. Junxiang Zhang, Yan Wang and Zhihong Zhang wrote and modified the manuscript. All authors in this study read and approved the manuscript.
Supporting information
Figure S1 Fragaria nilgerrensis used in this study which is from Yunnan, China.
Figure S2 Schematic workflow for the genome assembly of Fragaria nilgerrensis from Yunnan, China.
Figure S3 Mutogram between all chromosomes in the Fragaria nilgerrensis genome.
Figure S4 K‐mer frequency distribution curve (k‐mer=19) of Illumina short reads of the Fragaria nilgerrensis genome.
Figure S5 Gene collinearity between the Fragaria vesca and F. nilgerrensis genomes.
Figure S6 Schematic workflow for the gene annotation of the Fragaria nilgerrensis.
Figure S7 Venn diagram of gene annotation of the Fragaria nilgerrensis based ab initio gene prediction, homology‐based method and RNA‐seq.
Figure S8 Gene ontology categories of the annotated genes.
Figure S9 HPLC elution profile of anthocyanin accumulated in the mature fruit of Fragaria nilgerrensis (Fn) and F. vesca (Fv).
Figure S10 The alignment of MYB10 proteins from Fragaria nilgerrensis (Fn) and F. vesca (Fv) by DNASTAR software.
Figure S11 The alignment of MYB10 promoter sequences from Fragaria nilgerrensis (Fn) and F. vesca (Fv) by DNASTAR software.
Table S1 Genome completeness evaluation of Fragaria nilgerrensis based on Illumina sequencing reads.
Table S2 Genome completeness assessment of Fragaria nilgerrensis genome by BUSCO.
Table S3 Completeness analysis of Fragaria nilgerrensis genome based on CEG database.
Table S4 Gene prediction of Fragaria nilgerrensis based on Ab initio, Homology‐based and RNA‐seq method.
Table S5 Gene functional annotation of Fragaria nilgerrensis based on different databases.
Table S6 Noncoding RNA prediction of Fragaria nilgerrensis.
Table S7 The number and percentage of SNPs types in Fragaria nilgerrensis compared with F. vesca.
Table S8 The numbers of SNPs in different chromosome in Fragaria nilgerrensis compared with F. vesca.
Table S9 The numbers of Indels in different chromosome in Fragaria nilgerrensis compared with F. vesca.
Table S10 Primers used in this study.
Appendix S1 The sequences of 373 orthologs in 14 species used for analysing the phylogenetic relationships.
Appendix S1 The sequences of 373 orthologs in 14 species used for analysing the phylogenetic relationships.
Appendix S2 The information of expansion genes in F. nilgerrensis based on KEGG pathway classification in Figure 3a.
Appendix S3 The information of contraction genes in F. nilgerrensis based on KEGG pathway classification in Figure 3b.
Appendix S4 The information of unique genes in F. nilgerrensis based on KEGG pathway classification in Figure 3c.
Acknowledgements
We thank Yuepeng Han from Wuhan Botanical Garden of the Chinese Academy of Sciences for kindly providing pGreenII0800‐LUC vector. We also thank Chunqing Ou from Research Institute of Pomology, Chinese Academy of Agricultural Science for his help in depositing data on NCBI and Juan Wang from Beijing Academy of Forestry and Pomology Sciences for kindly providing pictures of F. nilgerrensis from Yunnan, China. This work was supported by the National Key Research and Development Program (2018YFD1000102), National Natural Science Foundation of China (31601730), China Postdoctoral Science Foundation (2017M611264) and the Key R&D and Technology Transfer Program (Z17‐0‐035).
Data availability statement
The whole‐genome sequence data reported in this paper have been deposited at DDBJ/ENA/GenBank under accession number WPAB00000000. The version described in this paper is WPAB01000000. The genome assembly and gene annotations have been deposited in the Genome Warehouse in National Genomics Data Center, Beijing Institute of Genomics (BIG), Chinese Academy of Sciences, under accession number GWHABKC00000000 that is publicly accessible at https://bigd.big.ac.cn/gwh.
References
- Amiri, H. , Davids, W. and Andersson, S.G. (2003) Birth and death of orphan genes in Rickettsia. Mol. Biol. Evol. 20, 1575–1587. [DOI] [PubMed] [Google Scholar]
- Ban, Y. , Honda, C. , Hatsuyama, Y. , Igarashi, M. , Bessho, H. and Moriguchi, T. (2007) Isolation and functional analysis of a MYB transcription factor gene that is a key regulator for the development of red coloration in apple skin. Plant Cell Physiol. 48, 958–970. [DOI] [PubMed] [Google Scholar]
- Bao, W. , Kojima, K.K. and Kohany, O. (2015) Repbase Update, a database of repetitive elements in eukaryotic genomes. Mobile DNA, 6, 11. [DOI] [PMC free article] [PubMed] [Google Scholar]
- Biemont, C. (2008) Genome size evolution: within‐species variation in genome size. Heredity, 101, 297–298. [DOI] [PubMed] [Google Scholar]
- Birney, E. and Durbin, R. (2000) Using GeneWise in the Drosophila annotation experiment. Genome Res. 10, 547–548. [DOI] [PMC free article] [PubMed] [Google Scholar]
- Blanco, E. , Parra, G. and Guigó, R. (2007) Using geneid to identify genes. Curr. Prot. Bioinform. 18, 4.3.1–4.3.28. [DOI] [PubMed] [Google Scholar]
- Bolger, A.M. , Lohse, M. and Usadel, B. (2014) Trimmomatic: a flexible trimmer for Illumina sequence data. Bioinformatics, 30, 2114–2120. [DOI] [PMC free article] [PubMed] [Google Scholar]
- Bors, B. and Sullivan, J. (1998) Interspecific crossability of nine diploid Fragaria species. HortScience, 33, 483b–483. [Google Scholar]
- Burge, C. and Karlin, S. (1997) Prediction of complete gene structures in human genomic DNA. J. Mol. Biol. 268, 78–94. [DOI] [PubMed] [Google Scholar]
- Camacho, C. , Coulouris, G. , Avagyan, V. , Ma, N. , Papadopoulos, J. , Bealer, K. and Madden, T.L. (2009) BLAST+: architecture and applications. BMC Bioinformatics, 10, 421. [DOI] [PMC free article] [PubMed] [Google Scholar]
- Casacuberta, E. and Gonzalez, J. (2013) The impact of transposable elements in environmental adaptation. Mol. Ecol. 22, 1503–1517. [DOI] [PubMed] [Google Scholar]
- Chagne, D. , Carlisle, C.M. , Blond, C. , Volz, R.K. , Whitworth, C.J. , Oraguzie, N.C. , Crowhurst, R.N. et al. (2007) Mapping a candidate gene (MdMYB10) for red flesh and foliage colour in apple. BMC Genom. 8, 212. [DOI] [PMC free article] [PubMed] [Google Scholar]
- Chakraborty, M. , Baldwin‐Brown, J.G. , Long, A.D. and Emerson, J.J. (2016) Contiguous and accurate de novo assembly of metazoan genomes with modest long read coverage. Nucleic Acids Res. 44, e147. [DOI] [PMC free article] [PubMed] [Google Scholar]
- Chambers, A. , Carle, S. , Njuguna, W. , Chamala, S. , Bassil, N. , Whitaker, V.M. , Barbazuk, W.B. and et al. (2013) A genome‐enabled, high‐throughput, and multiplexed fingerprinting platform for strawberry (Fragaria L.). Mol. Breeding, 31, 615–629. [Google Scholar]
- Chen, B. , Li, J.F. , Huo, H.Z. , Wan, C.Y. , Zhang, Z. , Qiao, Y.S. and Mi, L. (2015) Estimation of genome size in six wild strawberry species. J. Fruit Sci. 32, 51–56. [Google Scholar]
- Chuong, E.B. , Elde, N.C. and Feschotte, C. (2017) Regulatory activities of transposable elements: from conflicts to benefits. Nat. Rev. Genet. 18, 71–86. [DOI] [PMC free article] [PubMed] [Google Scholar]
- Conesa, A. , Götz, S. , García‐Gómez, J.M. , Terol, J. , Talón, M. and Robles, M. (2005) Blast2GO: a universal tool for annotation, visualization and analysis in functional genomics research. Bioinformatics, 21, 3674–3676. [DOI] [PubMed] [Google Scholar]
- Daccord, N. , Celton, J.M. , Linsmith, G. , Becker, C. , Choisne, N. , Schijlen, E. , van de Geest, H. et al. (2017) High‐quality de novo assembly of the apple genome and methylome dynamics of early fruit development. Nat. Genet. 49, 1099–1106. [DOI] [PubMed] [Google Scholar]
- Darrow, G. (1966) The Strawberry. History, Breeding and Physiology. New York: Holt Rinehart and Winston. [Google Scholar]
- Darwish, O. , Shahan, R. , Liu, Z. , Slovin, J.P. and Alkharouf, N.W. (2015) Re‐annotation of the woodland strawberry (Fragaria vesca) genome. BMC Genom. 16, 29. [DOI] [PMC free article] [PubMed] [Google Scholar]
- De Bie, T. , Cristianini, N. , Demuth, J.P. and Hahn, M.W. (2006) CAFE: a computational tool for the study of gene family evolution. Bioinformatics, 22, 1269–1271. [DOI] [PubMed] [Google Scholar]
- Delcher, A.L. , Phillippy, A. , Carlton, J. and Salzberg, S.L. (2002) Fast algorithms for large‐scale genome alignment and comparison. Nucleic Acids Res. 30, 2478–2483. [DOI] [PMC free article] [PubMed] [Google Scholar]
- Delcher, A.L. , Salzberg, S.L. and Phillippy, A.M. (2003) Using MUMmer to identify similar regions in large sequence sets. Curr. Protoc. Bioinform., 10–3. [DOI] [PubMed] [Google Scholar]
- Dong, X. , Wang, Z. , Tian, L. , Zhang, Y. , Qi, D. , Huo, H. , Xu, J. et al. (2019) De novo assembly of a wild pear (Pyrus betuleafolia) genome. Plant Biotechnol. J. 18, 581–595. [DOI] [PMC free article] [PubMed] [Google Scholar]
- Edgar, R.C. and Myers, E.W. (2005) PILER: identification and classification of genomic repeats. Bioinformatics, 21(suppl_1):152–158. [DOI] [PubMed] [Google Scholar]
- Edger, P.P. , VanBuren, R. , Colle, M. , Poorten, T.J. , Wai, C.M. , Niederhuth, C.E. , Alger, E.I. et al. (2017) Single‐molecule sequencing and optical mapping yields an improved genome of woodland strawberry (Fragaria vesca) with chromosome‐scale contiguity. Gigascience 7, gix124. [DOI] [PMC free article] [PubMed] [Google Scholar]
- Edger, P.P. , Poorten, T.J. , VanBuren, R. , Hardigan, M.A. , Colle, M. , McKain, M.R. , Smith, R.D. et al. (2019) Origin and evolution of the octoploid strawberry genome. Nat. Genet. 51, 541–547. [DOI] [PMC free article] [PubMed] [Google Scholar]
- El‐Sharkawy, I. , Liang, D. and Xu, K. (2015) Transcriptome analysis of an apple (Malus×domestica) yellow fruit somatic mutation identifies a gene network module highly associated with anthocyanin and epigenetic regulation. J. Exp. Bot. 66, 7359–7376. [DOI] [PMC free article] [PubMed] [Google Scholar]
- English, A.C. , Richards, S. , Han, Y. , Wang, M. , Vee, V. , Qu, J. , Qin, X. et al. (2012) Mind the gap: upgrading genomes with Pacific Biosciences RS long‐read sequencing technology. PLoS ONE, 7, e47768. [DOI] [PMC free article] [PubMed] [Google Scholar]
- Espley, R.V. , Hellens, R.P. , Putterill, J. , Stevenson, D.E. , Kutty‐Amma, S. and Allan, A.C. (2007) Red colouration in apple fruit is due to the activity of the MYB transcription factor, MdMYB10. Plant J. 49, 414–427. [DOI] [PMC free article] [PubMed] [Google Scholar]
- Espley, R.V. , Brendolise, C. , Chagné, D. , Kutty‐Amma, S. , Green, S. , Volz, R. , Putterill, J. et al. (2009) Multiple repeats of a promoter segment causes transcription factor autoregulation in red apples. Plant Cell, 21, 168–183. [DOI] [PMC free article] [PubMed] [Google Scholar]
- Folta, K.M. and Davis, T.M. (2006) Strawberry genes and genomics. Crit. Rev. Plant Sci. 25, 399–415. [Google Scholar]
- Gao, F. , Wang, X. , Li, X. , Xu, M. , Li, H. , Abla, M. , Sun, H. et al. (2018) Long‐read sequencing and de novo genome assembly of Ammopiptanthus nanus, a desert shrub. GigaScience, 7, giy074. [DOI] [PMC free article] [PubMed] [Google Scholar]
- Gene Ontology Consortium (2004) The Gene Ontology (GO) database and informatics resource. Nucleic Acids Res. 32, 258–261. [DOI] [PMC free article] [PubMed] [Google Scholar]
- Griffiths‐Jones, S. , Moxon, S. , Marshall, M. , Khanna, A. , Eddy, S.R. , andBateman, A. (2005) Rfam: annotating non‐coding RNAs in complete genomes. Nucleic Acids Res. 33(suppl_1), 121–124. [DOI] [PMC free article] [PubMed] [Google Scholar]
- Guindon, S. , Lethiec, F. , Duroux, P. and Gascuel, O. (2005) PHYML Online‐‐a web server for fast maximum likelihood‐based phylogenetic inference. Nucleic Acids Res. 33, 557–559. [DOI] [PMC free article] [PubMed] [Google Scholar]
- Guo, R. , Xue, L. , Luo, G. , Zhang, T. and Lei, J. (2017) Investigation and taxonomy of wild Fragaria resources in Tibet, China. Gen. Resour. Crop Evol. 65, 405–415. [Google Scholar]
- Haas, B.J. , Salzberg, S.L. , Zhu, W. , Pertea, M. , Allen, J.E. , Orvis, J. , White, O. et al. (2008) Automated eukaryotic gene structure annotation using EVidenceModeler and the Program to Assemble Spliced Alignments. Genome Biol. 9, R7. [DOI] [PMC free article] [PubMed] [Google Scholar]
- Han, Y. and Wessler, S.R. (2010) MITE‐Hunter: a program for discovering miniature inverted‐repeat transposable elements from genomic sequences. Nucleic Acids Res. 38, 199–199. [DOI] [PMC free article] [PubMed] [Google Scholar]
- Hancock, J. (1999) Strawberries. Cambridge, MA: CABI Pub University Press, 237. [Google Scholar]
- Hancock, J. and Luby, J. (1993) Genetic Resources at Our Doorstep: the wild strawberries. Bioscience, 43, 141–147. [Google Scholar]
- Hariharan, R. and Toyama, K. (2004) Project Lachesis: parsing and modeling location histories. International Conference on Geographic Information Science, Springer, Berlin, Heidelberg: 106–124. [Google Scholar]
- Harrison, R.E. and Luby, J.J. (1997) Chloroplast DNA restriction fragment variation among strawberry (Fragaria spp.) taxa. J. Am. Soc. Horticult. Sci. 122, 63–68. [Google Scholar]
- Hellens, R.P. , Allan, A.C. , Friel, E.N. , Bolitho, K. , Grafton, K. , Templeton, M.D. , Karunairetnam, S. et al. (2005) Transient expression vectors for functional genomics, quantification of promoter activity and RNA silencing in plants. Plant Methods, 1, 13. [DOI] [PMC free article] [PubMed] [Google Scholar]
- Higo, K. , Ugawa, Y. , Iwamoto, M. and Korenaga, T. (1999) Plant cis‐acting regulatory DNA elements (PLACE) database: 1999. Nucleic Acids Res. 27, 297–300. [DOI] [PMC free article] [PubMed] [Google Scholar]
- Hirakawa, H. , Shirasawa, K. , Kosugi, S. , Tashiro, K. , Nakayama, S. , Yamada, M. , Kohara, M. et al. (2014) Dissection of the octoploid strawberry genome by deep sequencing of the genomes of Fragaria species. DNA Res. 21, 169–181. [DOI] [PMC free article] [PubMed] [Google Scholar]
- Hoede, C. , Arnoux, S. , Moisset, M. , Chaumier, T. , Inizan, O. , Jamilloux, V. and Quesneville, H. (2014) PASTEC: an automatic transposable element classification tool. PLoS ONE, 9, e91929. [DOI] [PMC free article] [PubMed] [Google Scholar]
- Huang, L. , Feng, G. , Yan, H. , Zhang, Z. , Bushman, B.S. , Wang, J. , Bombarely, A. et al. (2019) Genome assembly provides insights into the genome evolution and flowering regulation of orchardgrass. Plant Biotechnol. J. 18, 373–388. [DOI] [PMC free article] [PubMed] [Google Scholar]
- Hummer, K.E. and Hancock, J. (2009) Strawberry Genomics: Botanical History, Cultivation, Traditional Breeding, and New Technologies. Genetics and Genomics of Rosaceae, pp. 413–435. New York, NY: Springer. [Google Scholar]
- Jia, H. , Wang, Y. , Sun, M. , Li, B. , Han, Y. , Zhao, Y. , Li, X. et al. (2013) Sucrose functions as a signal involved in the regulation of strawberry fruit development and ripening. New Phytol. 198, 453–465. [DOI] [PubMed] [Google Scholar]
- Johnson, A.D. , Handsaker, R.E. , Pulit, S.L. , Nizzari, M.M. , O'Donnell, C.J. and De Bakker, P.I. (2008) SNAP: a web‐based tool for identification and annotation of proxy SNPs using HapMap. Bioinformatics, 24, 2938–2939. [DOI] [PMC free article] [PubMed] [Google Scholar]
- Kadomura‐Ishikawa, Y. , Miyawaki, K. , Takahashi, A. , Masuda, T. and Noji, S. (2014) Light and abscisic acid independently regulated FaMYB10 in Fragaria× ananassa fruit. Planta, 241, 953–965. [DOI] [PubMed] [Google Scholar]
- Kanehisa, M. , Sato, Y. , Kawashima, M. , Furumichi, M. and Tanabe, M. (2016) KEGG as a reference resource for gene and protein annotation. Nucleic Acids Res. 44, 457–462. [DOI] [PMC free article] [PubMed] [Google Scholar]
- Keilwagen, J. , Wenk, M. , Erickson, J.L. , Schattat, M.H. , Grau, J. and Hartung, F. (2016) Using intron position conservation for homology‐based gene prediction. Nucleic Acids Res. 44, 89–89. [DOI] [PMC free article] [PubMed] [Google Scholar]
- Koren, S. , Walenz, B.P. , Berlin, K. , Miller, J.R. , Bergman, N.H. and Phillippy, A.M. (2017) Canu: scalable and accurate long‐read assembly via adaptive k‐mer weighting and repeat separation. Genome Res. 27, 722–736. [DOI] [PMC free article] [PubMed] [Google Scholar]
- Kozomara, A. and Griffiths‐Jones, S. (2010) miRBase: integrating microRNA annotation and deep‐sequencing data. Nucleic Acids Res. 39, (suppl_1):152–157. [DOI] [PMC free article] [PubMed] [Google Scholar]
- Lei, J.J. , Xue, L. , Guo, R.X. and Dai, H.P. (2017) The Fragaria species native to China and their geographical distribution. Acta Hort. 1156, 37–46. [Google Scholar]
- Li, H. (2013) Aligning sequence reads, clone sequences and assembly contigs with BWA‐MEM. arXiv:1303.3997. [Google Scholar]
- Li, L. , Stoeckert, C.J. and Roos, D.S. (2003) OrthoMCL: identification of ortholog groups for eukaryotic genomes. Genome Res. 13, 2178–2189. [DOI] [PMC free article] [PubMed] [Google Scholar]
- Li, Y. , Wei, W. , Feng, J. , Luo, H. , Pi, M. , Liu, Z. and Kang, C. (2017) Genome re‐annotation of the wild strawberry Fragaria vesca using extensive Illumina‐ and SMRT‐based RNA‐seq datasets. DNA Res. 25, 61–70. [DOI] [PMC free article] [PubMed] [Google Scholar]
- Li, Z.W. , Hou, X.H. , Chen, J.F. , Xu, Y.C. , Wu, Q. , Gonzalez, J. and Guo, Y.L. (2018) Transposable elements contribute to the adaptation of Arabidopsis thaliana . Genome Biol. Evol. 10, 2140–2150. [DOI] [PMC free article] [PubMed] [Google Scholar]
- Lin‐Wang, K. , McGhie, T.K. , Wang, M. , Liu, Y. , Warren, B. , Storey, R. , Espley, R.V. et al. (2014) Engineering the anthocyanin regulatory complex of strawberry (Fragaria vesca). Front. Plant Sci. 5, 651. [DOI] [PMC free article] [PubMed] [Google Scholar]
- Liston, A. , Cronn, R. and Ashman, T.L. (2014) Fragaria: a genus with deep historical roots and ripe for evolutionary and ecological insights. Am. J. Bot. 101, 1686–1699. [DOI] [PubMed] [Google Scholar]
- Liu, B. , Shi, Y. , Yuan, J. , Hu, X. , Zhang, H. , Li, N. , Li, Z. et al. (2013) Estimation of genomic characteristics by analyzing k‐mer frequency in de novo genome projects. arXiv:1308.2012. [Google Scholar]
- Liu, B. , Poulsen, E.G. and Davis, T.M. (2016) Insight into octoploid strawberry (Fragaria) subgenome composition revealed by GISH analysis of pentaploid hybrids. Genome, 59, 79–86. [DOI] [PubMed] [Google Scholar]
- Liu, M. , Li, Y. , Ma, Y. , Zhao, Q. , Stiller, J. , Feng, Q. , Tian, Q. et al. (2019) The draft genome of a wild barley genotype reveals its enrichment in genes related to biotic and abiotic stresses compared to cultivated barley. Plant Biotechnol. J. 18, 443–456. [DOI] [PMC free article] [PubMed] [Google Scholar]
- Lowe, T.M. and Eddy, S.R. (1997) tRNAscan‐SE: a program for improved detection of transfer RNA genes in genomic sequence. Nucleic Acids Res. 25, 955–964. [DOI] [PMC free article] [PubMed] [Google Scholar]
- Luo, G. , Xue, L. , Guo, R. , Ding, Y. , Xu, W. and Lei, J. (2018) Creating interspecific hybrids with improved cold resistance in Fragaria . Sci. Hortic. 234, 1–9. [Google Scholar]
- Luo, Y. , Lin, Y. , Mo, F. , Ge, C. , Jiang, L. , Zhang, Y. , Chen, Q. et al. (2019) Sucrose promotes strawberry fruit ripening and affects ripening‐related processes. Int. J. Genom. 2019, 1–14. [DOI] [PMC free article] [PubMed] [Google Scholar]
- Majoros, W.H. , Pertea, M. and Salzberg, S.L. (2004) TigrScan and GlimmerHMM: two open source ab initio eukaryotic gene‐finders. Bioinformatics,20, 2878–2879. [DOI] [PubMed] [Google Scholar]
- Martin, M. (2011) Cutadapt removes adapter sequences from high‐throughput sequencing reads. EMBnet. J. 17, 10–12. [Google Scholar]
- Medina‐Puche, L. , Cumplido‐Laso, G. , Amil‐Ruiz, F. , Hoffmann, T. , Ring, L. , Rodríguez‐Franco, A. , Caballero, J.L. et al. (2015) MYB10 plays a major role in the regulation of flavonoid/phenylpropanoid metabolism during ripening of Fragaria× ananassa fruits. J. Exp. Bot. 65, 401–417. [DOI] [PubMed] [Google Scholar]
- Michael, T.P. and VanBuren, R. (2015) Progress, challenges and the future of crop genomes. Curr. Opin. Plant Biol. 24, 71–81. [DOI] [PubMed] [Google Scholar]
- Michael, T.P. , Jupe, F. , Bemm, F. , Motley, S.T. , Sandoval, J.P. , Lanz, C. , Loudet, O. et al. (2018) High contiguity Arabidopsis thaliana genome assembly with a single nanopore flow cell. Nat. Commun. 9, 541. [DOI] [PMC free article] [PubMed] [Google Scholar]
- Nathewet, P. , Yanagi, T. , Hummer, K.E. and Iwatsubo, S.K. (2009) Karyotype analysis in wild diploid, tetraploid and hexaploid strawberries, Fragaria (Rosaceae). Cytologia, 74, 355–364. [Google Scholar]
- Nawrocki, E.P. and Eddy, S.R. (2013) Infernal 1.1: 100‐fold faster RNA homology searches. Bioinformatics, 29, 2933–2935. [DOI] [PMC free article] [PubMed] [Google Scholar]
- Niu, X.M. , Xu, Y.C. , Li, Z.W. , Bian, Y.T. , Hou, X.H. , Chen, J.F. , Zou, Y.P. et al. (2019) Transposable elements drive rapid phenotypic variation in Capsella rubella. Proc. Natl Acad. Sci. USA, 116, 6908–6913. [DOI] [PMC free article] [PubMed] [Google Scholar]
- Njuguna, W. , Liston, A. , Cronn, R. , Ashman, T.L. and Bassil, N. (2013) Insights into phylogeny, sex function and age of Fragaria based on whole chloroplast genome sequencing. Mol. Phylogenet. Evol. 66, 17–29. [DOI] [PubMed] [Google Scholar]
- Noguchi, Y. , Mochizuki, T. and Sone, K. (2002) Breeding of a new aromatic strawberry by interspecific hybridization Fragaria × ananassa × F. nilgerrensis . J. Japanese Soc. Horticult. Sci., 71, 208–213. [Google Scholar]
- Parra, G. , Bradnam, K. and Korf, I. (2007) CEGMA: a pipeline to accurately annotate core genes in eukaryotic genomes. Bioinformatics, 23, 1061–1067. [DOI] [PubMed] [Google Scholar]
- Potter, D. , Luby, J.J. and Harrison, R.E. (2000) Phylogenetic relationships among species of Fragaria (Rosaceae) inferred from non‐coding nuclear and chloroplast DNA sequences. Syst. Bot. 25, 337–349. [Google Scholar]
- Price, A.L. , Jones, N.C. and Pevzner, P.A. (2005) De novo identification of repeat families in large genomes. Bioinformatics 21, (suppl_1), 351–358. [DOI] [PubMed] [Google Scholar]
- Qiao, Q. , Xue, L. , Wang, Q. , Sun, H. , Zhong, Y. , Huang, J. , Lei, J. et al. (2016) Comparative transcriptomics of strawberries (Fragaria spp.) provides insights into evolutionary patterns. Front. Plant Sci. 7, 1839. [DOI] [PMC free article] [PubMed] [Google Scholar]
- Quevillon, E. , Silventoinen, V. , Pillai, S. , Harte, N. , Mulder, N. , Apweiler, R. and Lopez, R. (2005) InterProScan: protein domains identifier. Nucleic Acids Res. 33, (suppl_2), 116–120. [DOI] [PMC free article] [PubMed] [Google Scholar]
- Rho, I.R. , Hwang, Y.J. , Lee, H.I. , Lee, C.‐H. and Lim, K.B. (2012) Karyotype analysis using FISH (fluorescence in situ hybridization) in Fragaria . Sci. Hortic. 136, 95–100. [Google Scholar]
- Rousseau‐Gueutin, M. , Gaston, A. , Ainouche, A. , Ainouche, M.L. , Olbricht, K. , Staudt, G. , Richard, L. et al. (2009) Tracking the evolutionary history of polyploidy in Fragaria L. (strawberry): new insights from phylogenetic analyses of low‐copy nuclear genes. Mol. Phylogenet. Evol. 51, 515–530. [DOI] [PubMed] [Google Scholar]
- Saint‐Oyant, L.H. , Ruttink, T. , Hamama, L. , Kirov, I. , Lakhwani, D. , Zhou, N.N. , Bourke, P.M. et al. (2018) A high‐quality genome sequence of Rosa chinensis to elucidate ornamental traits. Nat. Plants, 4, 473–484. [DOI] [PMC free article] [PubMed] [Google Scholar]
- Sangiacomo, M. and Sullivan, J. (1994) Introgression of wild species into the cultivated strawberry using synthetic octoploids. Theor. Appl. Genet. 88, 349–354. [DOI] [PubMed] [Google Scholar]
- Sargent, D.J. , Geibel, M. , Hawkins, J.A. , Wilkinson, M.J. , Battey, N.H. and Simpson, D.W. (2004) Quantitative and qualitative differences in morphological traits revealed between diploid Fragaria species. Ann. Bot. 94, 787–796. [DOI] [PMC free article] [PubMed] [Google Scholar]
- Schulz, P. , Herde, M. and Romeis, T. (2013) Calcium‐dependent protein kinases: hubs in plant stress signaling and development. Plant Physiol. 163, 523–530. [DOI] [PMC free article] [PubMed] [Google Scholar]
- Servant, N. , Varoquaux, N. , Lajoie, B.R. , Viara, E. , Chen, C.‐J. , Vert, J.‐P. , Heard, E. et al. (2015) HiC‐Pro: an optimized and flexible pipeline for Hi‐C data processing. Genome Biol. 16, 259. [DOI] [PMC free article] [PubMed] [Google Scholar]
- She, R. , Chu, J.S.‐C. , Wang, K. , Pei, J. and Chen, N. (2009) GenBlastA: enabling BLAST to identify homologous gene sequences. Genome Res. 19, 143–149. [DOI] [PMC free article] [PubMed] [Google Scholar]
- Shulaev, V. , Sargent, D.J. , Crowhurst, R.N. , Mockler, T.C. , Folkerts, O. , Delcher, A.L. , Jaiswal, P. et al. (2011) The genome of woodland strawberry (Fragaria vesca). Nat. Genet. 43, 109–116. [DOI] [PMC free article] [PubMed] [Google Scholar]
- Simão, F.A. , Waterhouse, R.M. , Ioannidis, P. , Kriventseva, E.V. and Zdobnov, E.M. (2015) BUSCO: assessing genome assembly and annotation completeness with single‐copy orthologs. Bioinformatics, 31, 3210–3212. [DOI] [PubMed] [Google Scholar]
- Song, S. , Tian, D. , Zhang, Z. , Hu, S. and Yu, J. (2018) Rice genomics: over the past two decades and into the future. Genom. Proteom. Bioinform. 16, 397–404. [DOI] [PMC free article] [PubMed] [Google Scholar]
- Stanke, M. and Waack, S. (2003) Gene prediction with a hidden Markov model and a new intron submodel. Bioinformatics, 19(Suppl 2), 215–225. [DOI] [PubMed] [Google Scholar]
- Staudt, G. (1989) The species of Fragaria, their taxonomy and geographical distribution. Acta Hort. 265, 23–34. [Google Scholar]
- Staudt, G. (1999) Systematics and Geographic Distribution of the American Strawberry Species. Berkeley, CA: University of California Publications in Botany. [Google Scholar]
- Staudt, G. (2009) Strawberry biogeography, genetics and systematics. Acta Hort. 842, 71–84. [Google Scholar]
- Sun, C. , Palmqvist, S. , Olsson, H. , Boren, M. , Ahlandsberg, S. and Jansson, C. (2003) A novel WRKY transcription factor, SUSIBA2, participates in sugar signaling in barley by binding to the sugar‐responsive elements of the iso1 promoter. Plant Cell, 15, 2076–2092. [DOI] [PMC free article] [PubMed] [Google Scholar]
- Tang, S. , Lomsadze, A. and Borodovsky, M. (2015) Identification of protein coding regions in RNA transcripts. Nucleic Acids Res. 43, e78. [DOI] [PMC free article] [PubMed] [Google Scholar]
- Tarailo‐Graovac, M. and Chen, N. (2009) Using RepeatMasker to identify repetitive elements in genomic sequences. Curr. Protoc. Bioinform. 25, 4–10. [DOI] [PubMed] [Google Scholar]
- Teh, B.T. , Lim, K. , Yong, C.H. , Ng, C.C.Y. , Rao, S.R. , Rajasegaran, V. , Lim, W.K. et al. (2017) The draft genome of tropical fruit durian (Durio zibethinus). Nat. Genet. 49, 1633–1641. [DOI] [PubMed] [Google Scholar]
- Tenaillon, M.I. , Hufford, M.B. , Gaut, B.S. and Ross‐Ibarra, J. (2011) Genome size and transposable element content as determined by high‐throughput sequencing in maize and Zea luxurians. Genome Biol. Evol. 3, 219–229. [DOI] [PMC free article] [PubMed] [Google Scholar]
- Terzaghi, W.B. and Cashmore, A.R. (1995) Light‐regulated transcription. Annu. Rev. Plant Biol. 46, 445–474. [Google Scholar]
- Walker, B.J. , Abeel, T. , Shea, T. , Priest, M. , Abouelliel, A. , Sakthikumar, S. , Cuomo, C.A. et al. (2014) Pilon: an integrated tool for comprehensive microbial variant detection and genome assembly improvement. PLoS ONE, 9, e112963. [DOI] [PMC free article] [PubMed] [Google Scholar]
- Wang, Z. , Meng, D. , Wang, A. , Li, T. , Jiang, S. , Cong, P. and Li, T. (2013) The methylation of the PcMYB10 promoter is associated with green‐skinned sport in Max Red Bartlett pear. Plant Physiol. 162, 885–896. [DOI] [PMC free article] [PubMed] [Google Scholar]
- Wang, J. , Yu, H.M. , Cai, W.J. and Zhao, M.Z. (2017) Studies on diversity of wild Fragaria species in Yunnan, China. Acta Hort., 1156, 103–110. [Google Scholar]
- Wang, H. , Zhang, H. , Yang, Y. , Li, M. , Zhang, Y. , Liu, J. , Dong, J. et al. (2019) The control of red colour by a family of MYB transcription factors in octoploid strawberry (Fragaria × ananassa) fruits. Plant Biotechnol. J. 10.1111/pbi.13282 [DOI] [PMC free article] [PubMed] [Google Scholar]
- Wu, T.D. and Watanabe, C.K. (2005) GMAP: a genomic mapping and alignment program for mRNA and EST sequences. Bioinformatics, 21, 1859–1875. [DOI] [PubMed] [Google Scholar]
- Xu, Z. and Wang, H. (2007) LTR_FINDER: an efficient tool for the prediction of full‐length LTR retrotransposons. Nucleic Acids Res. 35, (suppl_2), 265–268. [DOI] [PMC free article] [PubMed] [Google Scholar]
- Xu, Y. , Wu, G. , Hao, B. , Chen, L. , Deng, X. and Xu, Q. (2015) Identification, characterization and expression analysis of lineage‐specific genes within sweet orange (Citrus sinensis). BMC Genom. 16, 995. [DOI] [PMC free article] [PubMed] [Google Scholar]
- Yang, Z. (2007) PAML 4: phylogenetic analysis by maximum likelihood. Mol. Biol. Evol. 24, 1586–1591. [DOI] [PubMed] [Google Scholar]
- Yarnell, S. (1928) Notes on the somatic chromosomes of the seven‐chromosome group of Fragaria . Genetic 14, 78–84. [DOI] [PMC free article] [PubMed] [Google Scholar]
- Zhai, R. , Wang, Z. , Zhang, S. , Meng, G. , Song, L. , Wang, Z. , Li, P. et al. (2015) Two MYB transcription factors regulate flavonoid biosynthesis in pear fruit (Pyrus bretschneideri Rehd.). J. Exp. Bot. 67, 1275–1284. [DOI] [PubMed] [Google Scholar]
- Zhang, J. , Chen, L.L. , Xing, F. , Kudrna, D.A. , Yao, W. , Copetti, D. , Mu, T. et al. (2016a) Extensive sequence divergence between the reference genomes of two elite indica rice varieties Zhenshan 97 and Minghui 63. Proc. Natl Acad. Sci. USA, 113, 5163–5171. [DOI] [PMC free article] [PubMed] [Google Scholar]
- Zhang, J. , Yuan, H. , Yang, Y. , Fish, T. , Lyi, S.M. , Thannhauser, T.W. , Zhang, L. et al. (2016b) Plastid ribosomal protein S5 is involved in photosynthesis, plant development, and cold stress tolerance in Arabidopsis. J. Exp. Bot. 67, 2731–2744. [DOI] [PMC free article] [PubMed] [Google Scholar]
- Zhang, J. , Zhang, Y. , Dou, Y. , Li, W. , Wang, S. , Shi, W. , Sun, Y. et al. (2017) Single nucleotide mutation in FvMYB10 may lead to the yellow fruit in Fragaria vesca . Mol. Breeding, 37, 35. [Google Scholar]
- Zhang, L. , Hu, J. , Han, X. , Li, J. , Gao, Y. , Richards, C.M. , Zhang, C. et al. (2019) A high‐quality apple genome assembly reveals the association of a retrotransposon and red fruit colour. Nat. Commun. 10, 1494. [DOI] [PMC free article] [PubMed] [Google Scholar]
Associated Data
This section collects any data citations, data availability statements, or supplementary materials included in this article.
Supplementary Materials
Figure S1 Fragaria nilgerrensis used in this study which is from Yunnan, China.
Figure S2 Schematic workflow for the genome assembly of Fragaria nilgerrensis from Yunnan, China.
Figure S3 Mutogram between all chromosomes in the Fragaria nilgerrensis genome.
Figure S4 K‐mer frequency distribution curve (k‐mer=19) of Illumina short reads of the Fragaria nilgerrensis genome.
Figure S5 Gene collinearity between the Fragaria vesca and F. nilgerrensis genomes.
Figure S6 Schematic workflow for the gene annotation of the Fragaria nilgerrensis.
Figure S7 Venn diagram of gene annotation of the Fragaria nilgerrensis based ab initio gene prediction, homology‐based method and RNA‐seq.
Figure S8 Gene ontology categories of the annotated genes.
Figure S9 HPLC elution profile of anthocyanin accumulated in the mature fruit of Fragaria nilgerrensis (Fn) and F. vesca (Fv).
Figure S10 The alignment of MYB10 proteins from Fragaria nilgerrensis (Fn) and F. vesca (Fv) by DNASTAR software.
Figure S11 The alignment of MYB10 promoter sequences from Fragaria nilgerrensis (Fn) and F. vesca (Fv) by DNASTAR software.
Table S1 Genome completeness evaluation of Fragaria nilgerrensis based on Illumina sequencing reads.
Table S2 Genome completeness assessment of Fragaria nilgerrensis genome by BUSCO.
Table S3 Completeness analysis of Fragaria nilgerrensis genome based on CEG database.
Table S4 Gene prediction of Fragaria nilgerrensis based on Ab initio, Homology‐based and RNA‐seq method.
Table S5 Gene functional annotation of Fragaria nilgerrensis based on different databases.
Table S6 Noncoding RNA prediction of Fragaria nilgerrensis.
Table S7 The number and percentage of SNPs types in Fragaria nilgerrensis compared with F. vesca.
Table S8 The numbers of SNPs in different chromosome in Fragaria nilgerrensis compared with F. vesca.
Table S9 The numbers of Indels in different chromosome in Fragaria nilgerrensis compared with F. vesca.
Table S10 Primers used in this study.
Appendix S1 The sequences of 373 orthologs in 14 species used for analysing the phylogenetic relationships.
Appendix S1 The sequences of 373 orthologs in 14 species used for analysing the phylogenetic relationships.
Appendix S2 The information of expansion genes in F. nilgerrensis based on KEGG pathway classification in Figure 3a.
Appendix S3 The information of contraction genes in F. nilgerrensis based on KEGG pathway classification in Figure 3b.
Appendix S4 The information of unique genes in F. nilgerrensis based on KEGG pathway classification in Figure 3c.
Data Availability Statement
The whole‐genome sequence data reported in this paper have been deposited at DDBJ/ENA/GenBank under accession number WPAB00000000. The version described in this paper is WPAB01000000. The genome assembly and gene annotations have been deposited in the Genome Warehouse in National Genomics Data Center, Beijing Institute of Genomics (BIG), Chinese Academy of Sciences, under accession number GWHABKC00000000 that is publicly accessible at https://bigd.big.ac.cn/gwh.