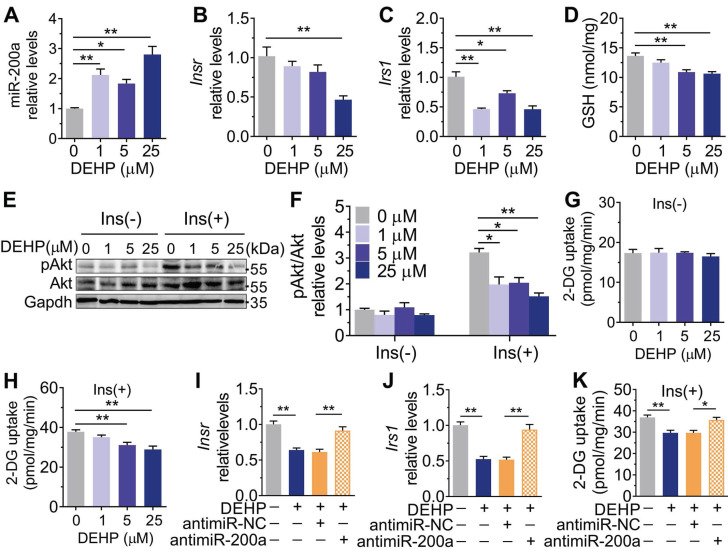
Figure 4.
The role of DEHP exposure in C2C12 myotubes. A-G. C2C12 myotubes were treated with serial concentrations of DEHP for 48 h (n = 3 independent experiments). A. The expression of miR-200a normalized by U6. B-C. The mRNA expression of Insr (B) and Irs1(C) normalized by Gapdh. D. The content of GSH normalized to protein content in DEHP-exposed C2C12 myotubes. E-F. The representative western blot images (E) and quantification (F) of pAkt in DEHP-exposed C2C12 myotubes. Gapdh was used as the loading control. G-H. The basal (G) and insulin-stimulated (H) 2-DG uptake in DEHP-exposed C2C12 myotubes. I-J. The mRNA expression of Insr (I) and Irs1 (J) in C2C12 myotubes transfected with 200 nM antagomir-200a and treated with 25 µM DEHP (n = 3 independent experiments). Gapdh was used as the loading control. K. The insulin-stimulated 2-DG uptake in C2C12 myotubes transfected with 200 nM antagomir-200a and treated with 25 µM DEHP (n = 3 independent experiments). All data were presented as the mean ± SEM. *P < 0.05, **P < 0.01 vs. corresponding control as indicated.

