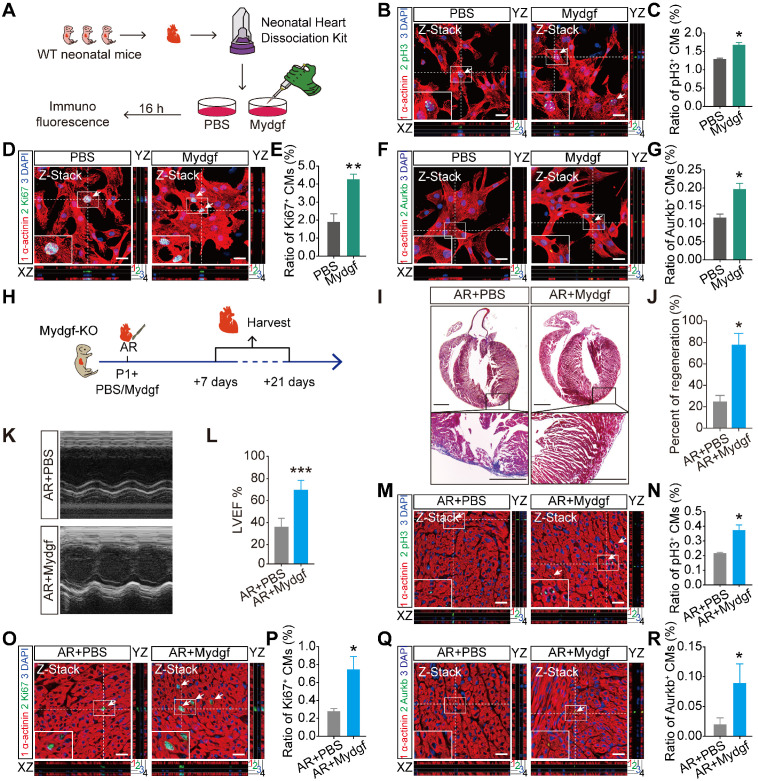
Figure 3.
Mydgf is sufficient for cardiomyocyte proliferation and heart regeneration. (A) Schematic diagram showed the experimental design for B-G. (B and C) Immunostaining illustrated proliferative (pH3+, green, white arrows) primary cardiomyocytes (CMs) were increased in Mydgf-treated group relative to PBS-treated group after 16 hours (n = 3 per group). (D and E) Immunostaining illustrated proliferative (Ki67+, green, white arrows) primary CMs were increased in Mydgf-treated group relative to PBS-treated group after 16 hours (n = 3 per group). (F and G) Immunostaining illustrated proliferative (Aurkb+, green, white arrows) primary CMs were increased in Mydgf-treated group relative to PBS-treated group after 16 hours (n = 3 per group). *P < 0.05 and **P < 0.01 compared to PBS by Student's t-test (C, E and G). (H) Schematic diagram showed the experimental design for I-R. (I and J) Masson's staining showed heart regeneration in Mydgf-KO mice treated with Mydgf relative to PBS at 21 days post resection (dpr). Statistical analysis revealed that heart regeneration was induced in Mydgf-treated mice (n = 20 for Mydgf-treated mice and n = 15 for PBS-treated mice). Scale bars, 500 µm. (K) Representative images of echocardiography analysis in Mydgf-KO mice treated with Mydgf relative to PBS at 21 dpr. (L) Echocardiography analysis of left ventricular ejection fraction (LVEF) in Mydgf-KO mice treated with Mydgf relative to PBS at 21 dpr (n = 10 for Mydgf-treated mice and n = 9 for PBS-treated mice). *P < 0.05 and ***P < 0.001 compared to PBS-treated mice by Student's t-test (J and L). (M and N) Immunostaining illustrated proliferative (pH3+, green, white arrows) CMs were increased in Mydgf-KO neonatal mice treated with Mydgf relative to PBS at 7 dpr (n = 3 per group). (O and P) Immunostaining illustrated proliferative (Ki67+, green, white arrows) CMs were increased in Mydgf-KO neonatal mice treated with Mydgf relative to PBS at 7 days post resection (dpr) (n = 3 per group). (Q and R) Immunostaining illustrated proliferative (Aurkb+, green, white arrows) CMs were increased in Mydgf-KO neonatal mice treated with Mydgf relative to PBS at 7 dpr (n = 3 per group). Scale bars, 20 µm. *P < 0.05 compared to AR+PBS by Student's t-test (N, P and R). Values were presented as the mean ± S.E.M.

