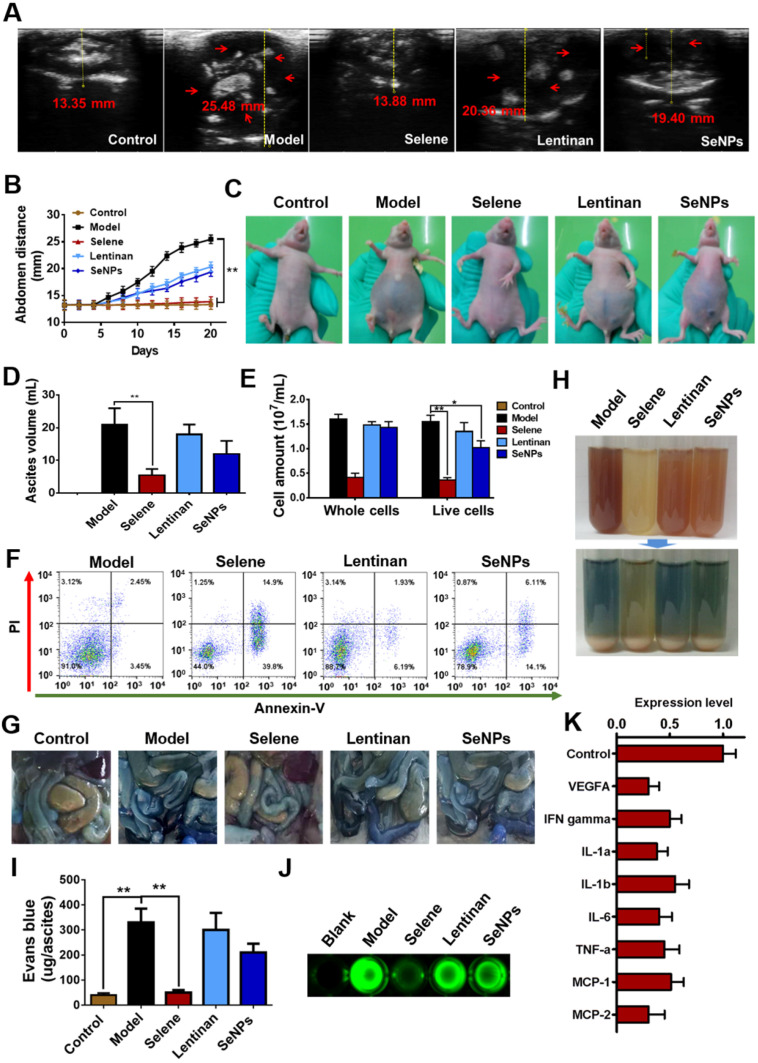
Figure 3.
Selene inhibited ascites induced by ovarian cancer cells in vivo. A and B. Results of B ultrasound and abdominal volume of ascites induced by ovarian cancer cells (OVCAR-3) in different groups. C. Representative images of mice in different groups. D and E. Volume of ascites and cancer cell numbers in ascites. F. Results of cell apoptosis detection of the cancer cells in ascites. G. The photographs of Evans blue dye leakage in the intestines and abdominal walls. H. The photographs of the aspirated ascites before (upper panel) and after (lower panel) centrifugation. I. Comparison of Evans blue amounts in ascites of each group. J. The photographs of the FITC-dextran intensity in 20 mL of ascites of each sample. K. Analysis results of cytokine antibody chip assay of Selene-treated group compared with the model group. Results are shown as means ± SD (*P < 0.05, **P < 0.01).

