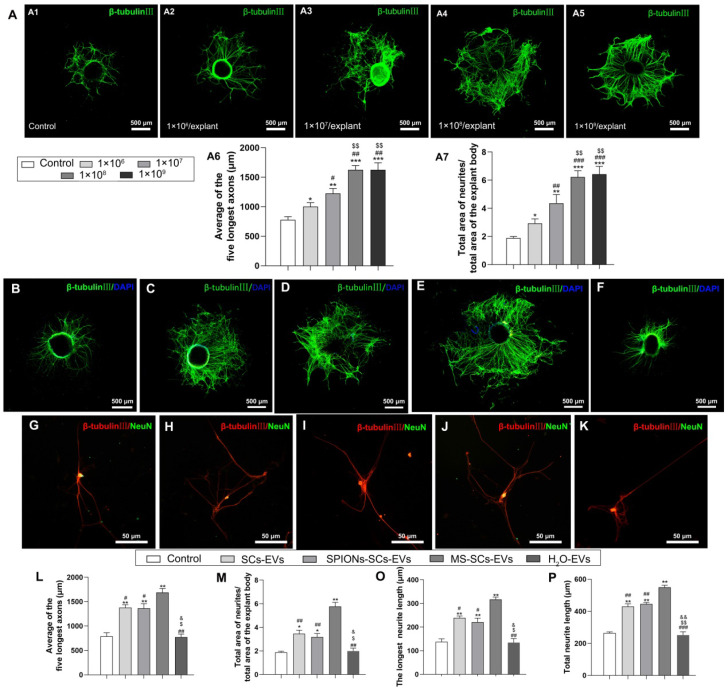
Figure 3.
MS-SCs-EVs enhance axonal growth of DRG explants and neurons. Representative images of DRG explants stained for β-tubulin III (green) with nuclear DAPI counterstaining, DRG neurons were stained for β-tubulin III (red) and NeuN (green). (A) Representative images of DRG explants after the addition of PBS plus increasing MS-SCs-EVs concentrations (A1-A5). (A6 and A7) Axonal lengths were quantified and plotted for each MS-SCs-EVs concentration group of three independent experiments (n =4 per group). Axonal elongation of DRGs after 3 days in PBS (B and G), SCs-EVs (C and H), SPIONs-SCs-EVs (D and I), MS-SCs-EVs (E and J), MS-SCs-EVs pre-treated with H2O (F and K). (L-K) Axonal lengths were quantified and plotted for each treatment of three independent experiments (L-M n=5 per group; O-P n=20 per group). Scale bars: (A1-A5, B-F) 500 μm; (G-K) 50 μm. All data are expressed as means±SEM. One-way ANOVA test with Tukey's post hoc test was used to examine the significance of results. (L-P) * P<0.05 and ** P<0.01 for comparison with the PBS control group; # P<0.05 and ## P<0.01 for comparison with the MS-SCs-EVs group; $ P<0.05 and $$ P<0.01 for comparison with the SCs-EVs group; & P<0.05 and && P<0.01 for comparison with the SPIONs-SCs-EVs group. (A6 and A7) * P<0.05, ** P<0.01 and *** P<0.001 for comparison with the MS-SCs-EVs (0 μg/mL) group; # P<0.05, ## P<0.01 and ### P<0.001 for comparison with the MS-SCs-EVs (1 μg/mL) group; $ P<0.05, $$ P<0.01 and $$$ P<0.001for comparison with the MS-SCs-EVs (2 μg/mL) group.

