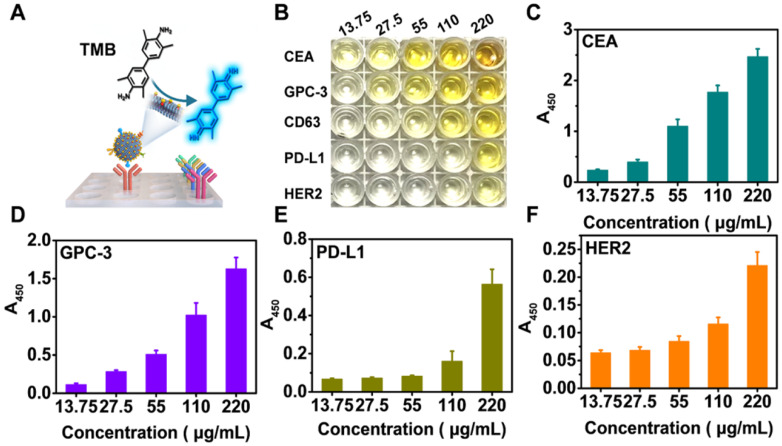
Figure 2.
Profiling of a panel of tumor-associated biomarkers on Exos derived from HepG2 cells. (A) Schematic illustration of exosomal protein profiling by NAISA. (B) Photograph of the colorimetric results for various concentrations of Exo@Au (from 13.75 to 220 µg/mL). Each protein/concentration pair was evaluated in triplicate. Protein levels of (C) CEA, (D) GPC-3, (E) PD-L1 and (F) HER2 on HepG2 Exos with different concentrations. Error bars indicated the mean standard deviation of three parallel samples for each case (n = 3).

