

Abstract
CRISPR-Cas is an adaptive immune system that protects prokaryotes against foreign nucleic acids. Prokaryotes gain immunity by acquiring short pieces of the invading nucleic acid termed prespacers and inserting them into their CRISPR array. In type II-A systems, Cas1 and Cas2 proteins insert prespacers always at the leader–repeat junction of the CRISPR array. Among type II-A CRISPR systems, three distinct groups (G1, G2, and G3) exist according to the extent of DNA sequence conservation at the 3′ end of the leader. However, the mechanisms by which these conserved motifs interact with their cognate Cas1 and Cas2 proteins remain unclear. Here, we performed in vitro integration assays, finding that for G1 and G2, the insertion site is recognized through defined mechanisms, at least in members examined to date, whereas G3 exhibits no sequence-specific insertion. G1 first recognized a 12-bp sequence at the leader–repeat junction and performed leader-side insertion before proceeding to spacer-side insertion. G2 recognized the full repeat sequence and could perform independent leader-side or spacer-side insertions, although the leader-side insertion was faster than spacer-side. The prespacer morphology requirements for Cas1–Cas2 varied, with G1 stringently requiring a 5-nucleotide 3′ overhang and G2 being able to insert many forms of prespacers with variable efficiencies. These results highlight the intricacy of protein–DNA sequence interactions within the seemingly similar type II-A integration complexes and provide mechanistic insights into prespacer insertion. These interactions can be fine-tuned to expand the Cas1–Cas2 toolset for inserting small DNAs into diverse DNA targets.
Keywords: CRISPR adaptation, type II-A, prespacer integration, Cas1, Cas2, streptococcus, leader–repeat junction, spacer, microbial adaptive immunity, integrase, gene tagging, CRISPR/Cas, Streptococcus, biotechnology, DNA–protein interaction, host defense, protein complex, viral DNA, CRISPR adaptive immunity, type II-A CRISPR
CRISPR and CRISPR-associated (Cas) proteins comprise a unique adaptive immune system utilized by bacteria and archaea to defend against invading nucleic acids (1). CRISPR systems accomplish this by acquiring a short piece of the invading nucleic acid, termed prespacer, and inserting it into the CRISPR array (2, 3). The inserted prespacer is then called a spacer and is later used to create a guide RNA for Cas nucleases to target and degrade matching DNA and/or RNA sequences (4).
The process of acquiring and inserting new prespacers into the host CRISPR array is called adaptation and, in most CRISPR types, is carried out primarily by Cas1 and Cas2 proteins (5–10). Known mechanisms of CRISPR adaptation have been recently reviewed (11). In general, Cas1 and Cas2 form a complex (Cas1–Cas2), composed of two Cas1 dimers sandwiching a single Cas2 dimer, that binds and inserts the prespacer at the leader–repeat junction (12). This is accomplished by sequence-specific recognition of the leader–repeat junction and positioning of a 3′-OH of the prespacer in the active site of Cas1 for attack on the phosphate backbone (leader-side), followed by a ruler mechanism for similar positioning and attack by the opposite 3′-OH at the repeat-spacer junction (spacer-side). These two 3′-OH attacks lead to insertion of both strands of the prespacer (full-site integration), adding a new spacer into the CRISPR array (13–15). The resulting gaps in the DNA are repaired by host DNA repair mechanisms (16, 17). The mechanisms involved in recognition of the leader–repeat junction during adaptation have been shown to differ between CRISPR types and subtypes. For example, a host protein called integration host factor has been shown to be essential to enable Cas1–Cas2 to recognize the leader–repeat junction in type I-E (9), while in type II-A, reliable recognition is carried out by Cas1–Cas2 alone by intrinsic DNA sequence recognition (15). In another CRISPR system belonging to type I-A, recognition of the leader–repeat junction has been shown to require as-yet-unidentified cellular host factors (not integration host factor), as well as a long region of the upstream leader sequence and ATP (18). These examples clearly show the distinct protein–DNA requirements for new spacer uptake among CRISPR types and subtypes.
In type II-A systems, the focus of this study, Cas1–Cas2 recognizes conserved sequences at the leader–repeat junction, termed the “leader-anchoring site” (19), without the need of accessory proteins or other factors, based on orthologs that have been characterized so far (15). Adaptation in type II-A systems has been shown in vivo to involve Cas9 and Csn2, both of which are involved in prespacer capture, specifically fidelity and processing requirements rather than their participation in the insertion mechanism (6, 20). Unlike type I systems, which can insert prespacers in a protospacer adjacent motif (PAM)-dependent orientation with Cas1–Cas2, Cas9 was shown to be necessary for PAM-specific insertion of new spacers in type II-A systems (20, 21). A recent structure shows how Csn2 forms a multimeric complex with Cas1 and Cas2 and is likely involved in protecting prespacers from degradation so that they can be inserted into the CRISPR array (22). Type II-A Cas1–Cas2 specifically recognizes the leader–repeat junction through sequence-specific contacts of a helix in Cas1, called the leader-recognition helix with the leader-anchoring site (23). These contacts allow for the positioning of the 3′-OH of the prespacer for nucleophilic attack at the leader–repeat junction. Current literature shows that even though leader-side and spacer-side integrations can occur independently in certain type II-A systems, leader-side integration followed by spacer-side integration is preferred to ensure specificity during prespacer integration (15, 23, 24).
Recently, we presented bioinformatic evidence showing that the 3′ end of type II-A leader sequences segregates into three distinct, conserved groups (25). These three groups are defined by the last 7-base pairs (bp) of the leader sequence: group 1 (G1) with ATTTGAG, group 2 (G2) with CTRCGAG, and group 3 (G3) with NNNNNCG, where R is a purine nucleotide (nt) (A or G), and N is any nt (Fig. 1A). We also showed phylogenetic clustering of Cas proteins and repeat sequences in type II-A systems that mirrored the clustering of leader 3′ ends. Several studies to date have examined the type II-A spacer uptake process, both in vivo (1, 19–21, 26–34) and in vitro (6, 15, 23, 24). The in vivo studies were carried out mainly in Streptococcus thermophilus DGCC7710, which contains two type II-A CRISPR loci (CRISPR1 and CRISPR3) (1, 26–28, 30–32). These studies showed that the CRISPR1 locus was more active at acquiring spacers than the CRISPR3 locus, the reasons for which are not clear (27, 33). In vitro studies have been conducted using type II-A Cas1–Cas2 complexes from S. thermophilus DGCC7710, Streptococcus pyogenes M1GAS, and Enterococcus faecalis. Type II-A Cas1–Cas2 complexes are shown to have intrinsic sequence recognition of the leader–repeat junction and require various elements in the leader and repeat regions for successful full-site integration (15, 23, 24). Even though previous studies have shown integration activities of different Cas1–Cas2 complexes into their cognate backbones, a direct comparison of Cas1–Cas2 complexes from all three different type II-A groups and their abilities to integrate into noncognate target DNAs is missing. This information is essential to derive a complete picture of how adaptation mechanisms vary between different groups of a single CRISPR subtype.
Figure 1.

Prespacer DNA integration by the Cas1–Cas2 protein IC into DNA targets that mimic the CRISPR array. A, sequence logos showing conservation in the last 7 bp of the leader and first 5 bp of the repeat from all three previously identified groups of type II-A CRISPR systems (25). B, schematic showing integration of FAM-labeled prespacer into a 116-bp linear target. Prespacers are integrated either at the leader side (LS) or spacer side (SS) of the repeat. After the fluorescent (FAM-labeled) strand is separated from the unlabeled strand by denaturing PAGE, the leader- and spacer-side integration products will appear at 96 and 116 nt, respectively. C, FAM image of urea-PAGE integration reactions with combinations of G1-IC, G2-IC, and G3-IC with their cognate linear targets. Total reaction time was 30 min. G1-IC integrates both the leader and spacer sides into its cognate target, as does G2-IC. G3-IC shows limited activity in the G1-L target. G1-IC and G2-IC can integrate LS into noncognate targets, if the GAG motif is present at the 3′ leader end. Off-target is when the prespacer integrates somewhere other than LS or SS in the target. NoP indicates “no protein”; the IC protein was omitted from the reaction.
To systematically investigate the basis of the seemingly different mechanisms of prespacer uptake in the type II-A systems, we used an in vitro approach to show protein–DNA sequence requirements without interference from potential cellular factors. Interestingly, our results show that type II-A prespacer insertion mechanisms can be segregated into groups, mirroring the phylogenetic groups identified by our previous bioinformatics study. We show that Cas1–Cas2 complexes preferentially integrate prespacers at their native leader 3′ ends compared with mutated leader 3′ ends or leaders from a different type II-A phylogenetic group. We observed that leader-side integration is a prerequisite for spacer-side insertion in G1, but not in G2. Interestingly, we found that the prespacer structure requirements vary between the groups: G1 is stringent and requires prespacers with a 5-nt 3′ overhang, whereas G2 is more tolerant and can insert prespacers with various morphologies. The isolated Cas1–Cas2 complex from G3 does not show site-specific prespacer insertion. Our results unify the type II-A adaptation process into phylogenetically distinct mechanisms, in which the phylogeny was derived based on protein–DNA sequence conservations related to the CRISPR adaptation module.
Results
G1 and G2 integration complexes support integration preferentially into cognate sequences, whereas G3 does not
With the knowledge of conserved (Fig. 1A) leader 3′ ends within type II-A systems, we set out to characterize the role of these DNA motifs using integration reactions. A representative bacterium was chosen from each group, and Cas1–Cas2 proteins were purified from each. We chose to use in vitro fluorescence-based integration assays using 5′-FAM–labeled prespacer DNA to monitor prespacer integration, as described previously (23). Briefly, a 5′-FAM–labeled prespacer with 5-nt 3′ overhangs was mixed with Cas1–Cas2 and a short linear target DNA that contained the cognate leader–repeat region from each representative bacterium. The spacer region in all targets was kept constant to reduce any interference from secondary structure. After a short incubation period, the samples were run on denaturing urea-PAGE to separate individual strands of DNA, and images were taken to visualize the FAM label. The leader-side and spacer-side integration reactions cause covalent linkage of one of the strands of the prespacer to the target DNA, which will create distinctly sized single-strand DNA products on a denaturing gel (Fig. 1B). The absence of other necessary adaptation proteins (Cas9 and Csn2) will result in spacers being inserted in no specific orientation, allowing the sole measurement of intrinsic sequence specificities of Cas1–Cas2 complexes. We used a prespacer having 5-nt 3′ overhangs on both strands unless otherwise noted in the experiments in this study. Divalent metal cations were tested for each Cas1–Cas2 complex, with the metal cation allowing the highest and specific activity to be selected for the rest of the study (G1, Mn2+; G2, Mg2+; G3, Mn2+; Fig. S1).
For a linear target DNA, the two most likely insertion sites can be distinguished on a denaturing gel by following the FAM label (Fig. 1B). Unincorporated prespacers are also detected at the bottom of each lane. Our results indicate that G1 Cas1–Cas2, which we will call the G1 integration complex (G1-IC), integrates prespacers at both the leader side and the spacer side of its cognate target sequence (G1-L). We also notice two off-target integration bands: one that is between the leader- and spacer-side products (∼99 nt) and another that is ∼60 nt (Fig. 1C). Off-target bands, as will be shown later (see Fig. 4), come from GAG sequence motifs other than the leader–repeat junction that are present in the target sequence. G1-IC also slightly integrates at the leader-side of the cognate G2 target (G2-L, ∼10% compared with integration into G1-L along with some off-target integration; ∼50 and ∼105 nt). A very minimal off-target integration occurs with the cognate G3-L (Fig. 1C). A time-course analysis of G1-IC shows faster leader-side integration compared with spacer-side integration (Fig. S2). Small amounts of spacer-side and a low-molar-mass (∼55 nt) off-target band stop increasing in intensity at 5 min (Fig. S2). As time progresses, leader-side integration maximizes at ∼10 min, with substantially more leader-side than spacer-side integration.
Figure 4.

FAM image of urea-PAGE showing G1-IC and G2-IC integrating prespacers into HP targets to observe full site integration. Both protein complexes integrate full site (FS) only into their cognate target. Removing the 3′-OH abolishes FS integration in both cases as well, showing that the full-site band is the product of a single prespacer being inserted at both ends and not from two independent integration events. Removing the 3′-OH also abolishes spacer-side (SS) integration in the case of G1-IC, but not in G2-IC, which shows a difference in mechanism between the two. Removing all GAGs outside the leader–repeat junction abolishes off-target bands generated by G2-IC (G2-HP-No GAG). The slight variations in the band positions in −OH F and −OH R lanes is most probably due to the remaining secondary structures affecting mobility on a gel (hydroxyl group removed from spacer_Sy_overhangs_5-F (Table S1, −OH F); hydroxyl group removed from spacer_Sy_overhangs_5-R (Table S1, −OH R); and hydroxyl group removed from both these strands (−OH F + R)).
The G2 Cas1–Cas2 integration complex (G2-IC) integrates leader-side into both G1-L and G2-L targets, although the efficiency of integration is much higher with the cognate target DNA. For G2-L, there are two bands at the expected sizes corresponding to leader-side (96 nt) and spacer-side (116 nt) integrations. Like G1-IC, G2-IC does not integrate at the spacer-side of noncognate targets (G1-L and G3-L in this case). Time-course analysis of G2-IC (Fig. S3) shows that at 10 s, a prominent leader-side band is present. As time progresses, spacer-side integration increases. Only one off-target band is evident in G2-IC, compared with several off-targets in G1-IC (Fig. S3). These results also show the robustness of isolated G2-IC compared with isolated G1-IC.
G3 Cas1–Cas2 was promiscuously active in G1-L with integration occurring at a site other than the leader–repeat junction based on the product size (Fig. 1C and Fig. S4). Based on the size of the product in G1-L (∼120 nt), the integration can happen either near position 26 in the top strand or near position 90 in the bottom strand (numbering starts at the 5′ end) (Fig. S4). Because the spacer sequence is conserved in all three linear targets, and we do not see this band in all the targets, the most probable integration site is in the top strand. Use of Mn2+ instead of Mg2+ shows more off-target integration across multiple targets, compared with a single insertion in G1-L with Mg2+ (Fig. S4). It is interesting to see an integration complex show no activity against its cognate target sequence but show preferred insertion in another. It should be noted that G3 leader–repeat junction lacks several of the conserved nt based on our bioinformatic analysis (Fig. 1A).
Type II-A adaptation shows certain level of cross-compatibility between subgroups, but not with a different CRISPR type
To further understand the integration activities, we designed a variety of mutated target sequences to test the integration tendencies of each protein complex. We started with the three target sequences in Fig. 1C and added a fourth target DNA containing the leader–repeat region from the type I-E system of Escherichia coli K-12 (E). We then exchanged the last 7 bp of the leader (at the 3′ end) between the four targets in all possible combinations (Fig. 2A). The exchanged targets and the WT targets together created 16 different sequence backgrounds to test the integration activity.
Figure 2.
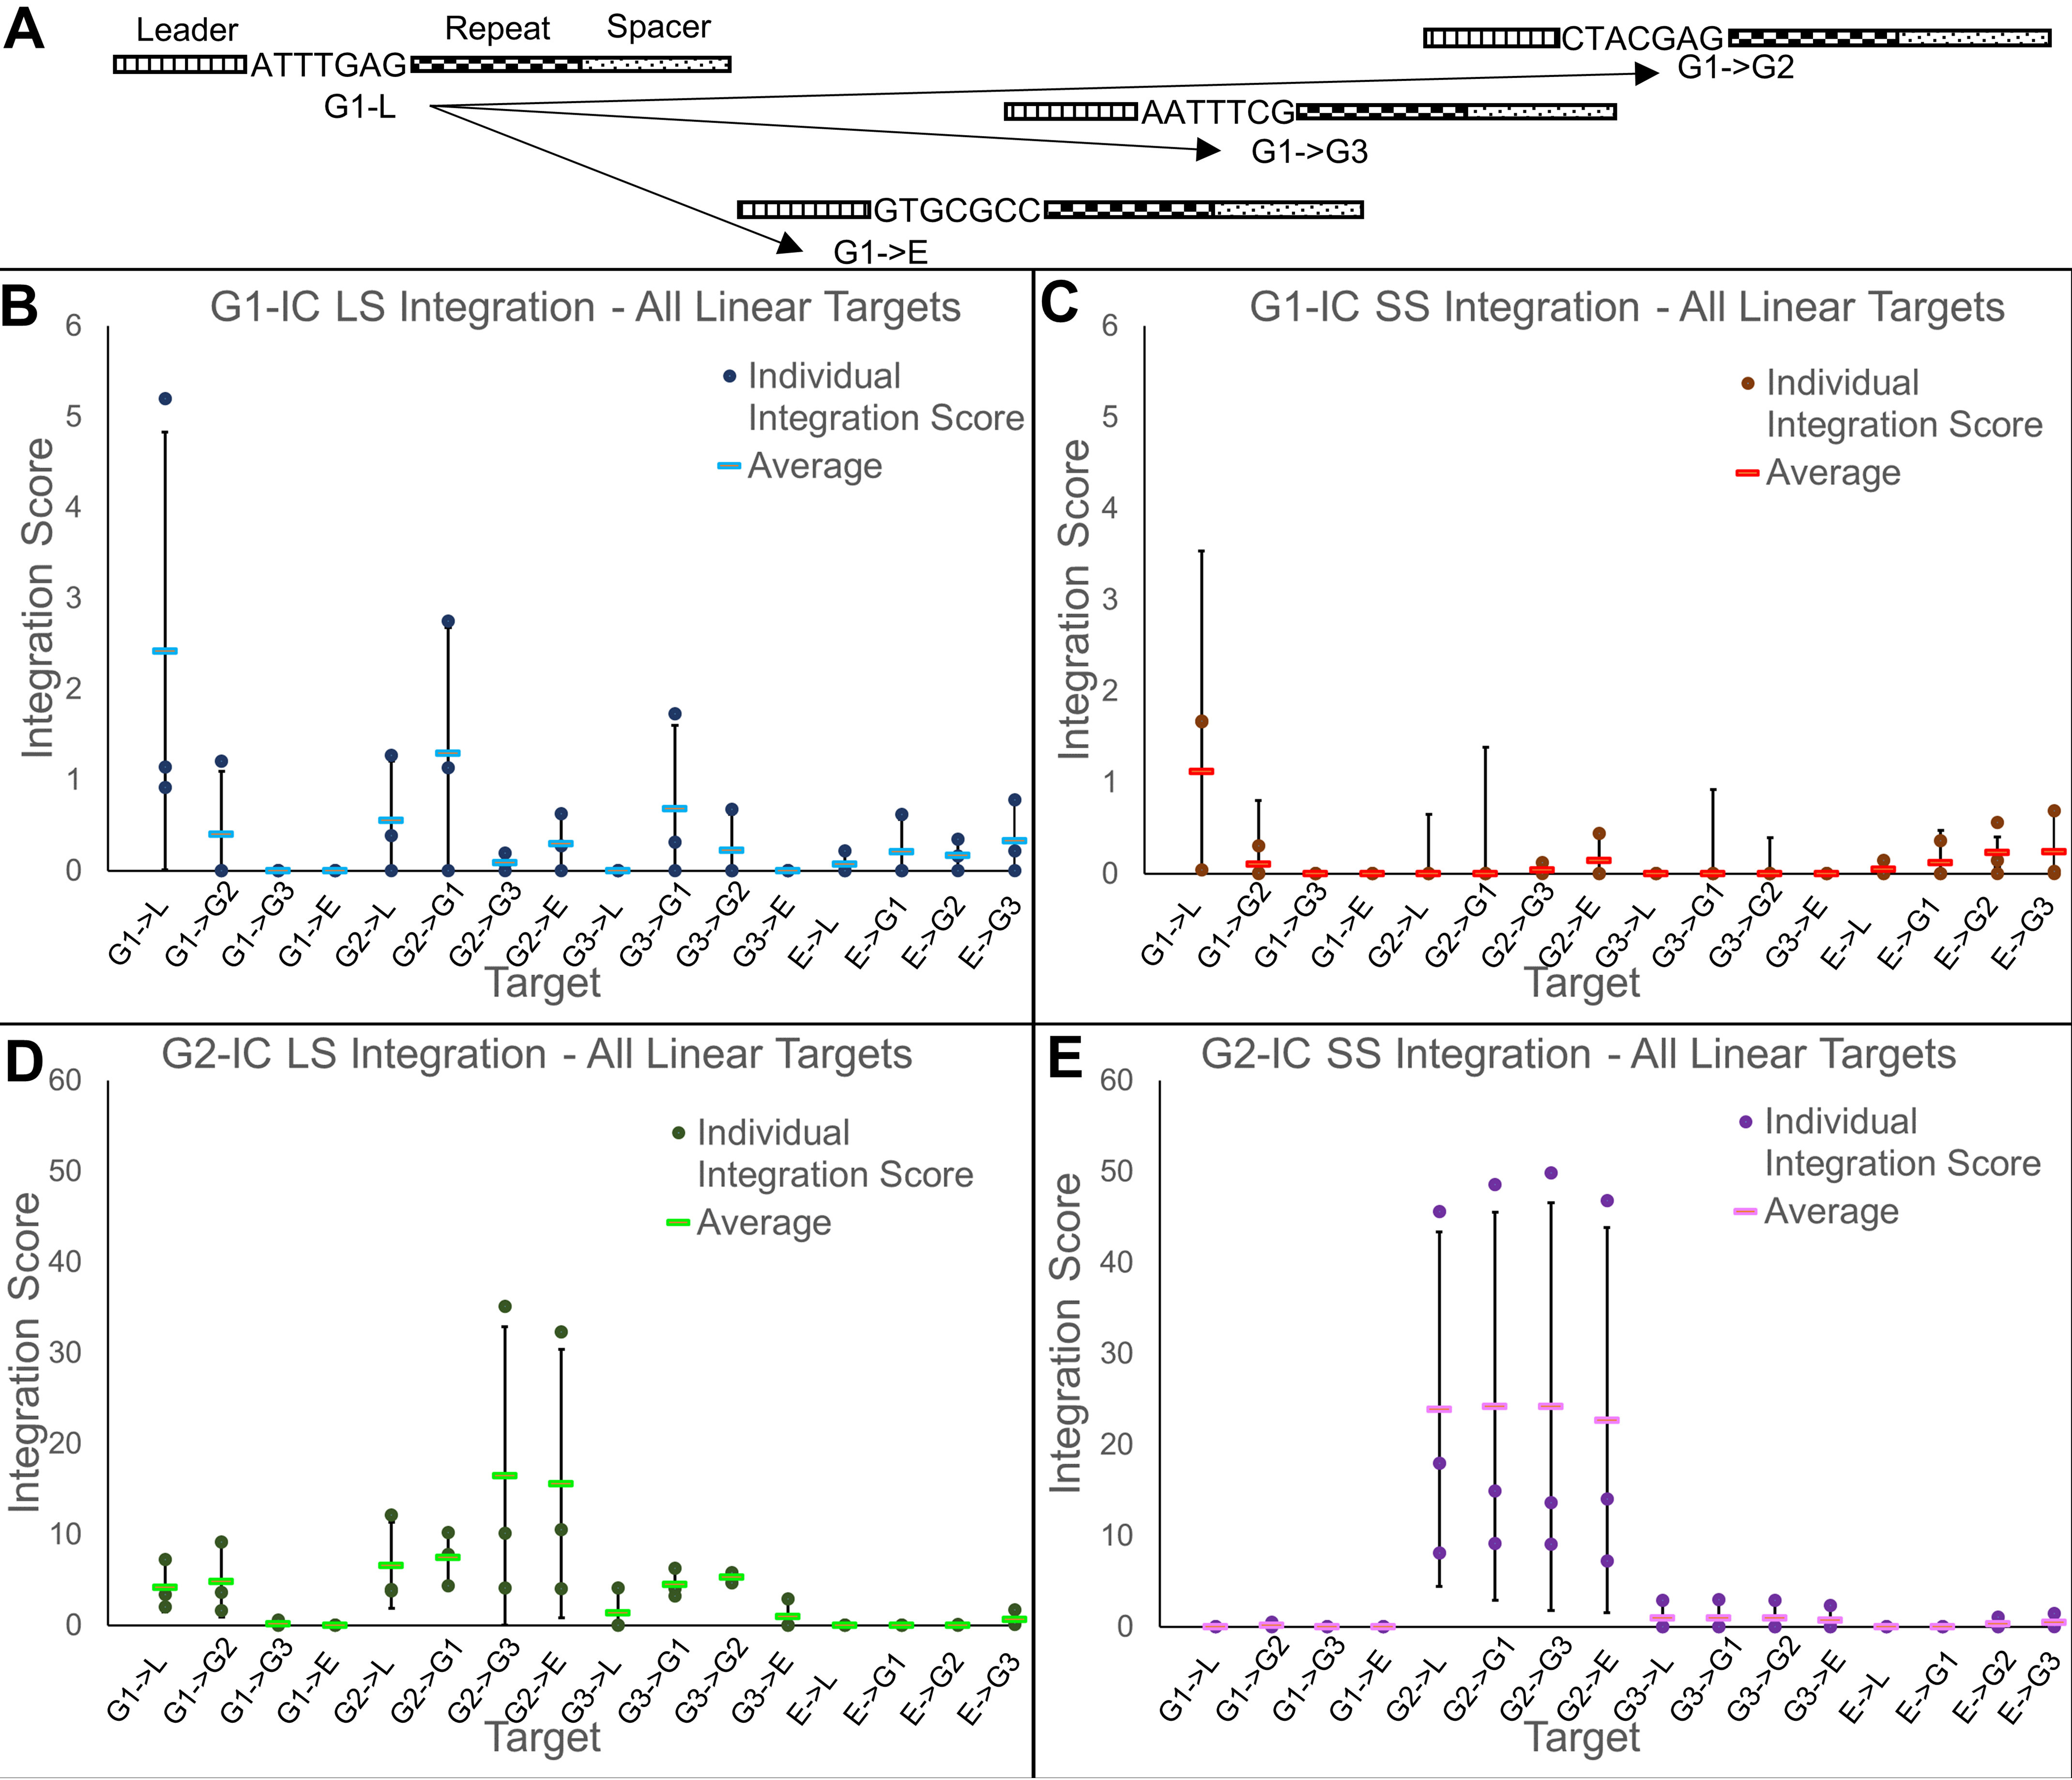
Integration reactions using linear targets with mutated leader 3′ end sequences. A, schematic of the naming scheme for mutant targets. The naming of the targets shows which group the leader-upstream and repeat sequences came from, followed by which group the 7-bp leader-end motif belongs to (for example G1→G2 consists of the G1 leader-upstream and repeat regions but with the last 7 nt of leader switched with that of G2). B, integration scores of group 1 integration complex (G1-IC) integrating leader side (LS) into all linear targets. Individual integration scores from each of three replications are shown as dots, and the average is shown as a solid bar. C, integration scores of G1-IC integrating spacer side (SS) into all linear targets. D and E, integration scores of the G2-IC integrating leader side into all linear targets (D) and G2-IC integrating spacer side into all linear targets (E). Solid black error bars (representing standard deviation) are shown.
Integration scores for each group of Cas1–Cas2 proteins are shown in Fig. 2 (B and C) (gel pictures are shown in Figs. S5 and S6). Integration scores are calculated by dividing the intensity of the integration band by the intensity of the same area in the control lane followed by subtracting 1. This value essentially shows the fold change in band intensity compared with background. For G1-IC, leader-side integration is observed in its cognate sequence (G1-L) and in the G2 and G3 backbones in which the G1 leader-end motif was present (G2→G1 and G3→G1 respectively). No leader-side integration was observed in any of the E targets; only off-target integration is seen (Fig. S5). A slight amount of leader-side integration occurred in G2-L, G1→G2, and G3→G2. The G2 leader end motif only differs from G1 by 3 bp (ATTTGAG in G1 versus CTACGAG in G2), so it is interesting to note that inserting the G2 leader end motif only partially restores leader-side integration activity. This result strongly implies the importance of a continuous 7-bp stretch of DNA at the leader end for successful leader-side integration (Fig. 1A). Significant spacer-side integration only occurred in the G1-L target. This shows that spacer-side is much more selective and occurs when a qualifying leader-side integration occurs first. Overall, our data show that the last 7 bp of the 3′ leader end helps direct G1-IC to the leader–repeat junction. Absence of leader-side or spacer-side integrations into the E→G1 target, however, shows that more than the 7-bp motif is necessary. It should be noted that there is a strong off-target integration into all four E targets. It is possible that this off-target site is more favorable than the leader–repeat junction of the E target, preventing low-level insertions at the leader–repeat junction.
G2-IC shows a more robust integration profile into targets containing the cognate upstream leader and repeat sequences. There is a large increase in integration score (4-fold for LS) for G2-IC compared with G1-IC (Fig. 2C). Spacer-side integration is present only when the whole G2 backbone is present in the target DNA and appears to be more robust than leader-side integration. This can be substantiated by the fact that two independent insertion events contribute to this intensity (spacer-side from half-site and spacer-side from full-site integrations), as described previously (15). The occurrence of leader-side integration when G3 targets are mutated to have G2 or G1 leader-end motifs may be attributable to the strong conservation of GAG in both G1 and G2 leader ends (Fig. 2A). Similar to G1-IC, G2-IC does not integrate leader-side or spacer-side in E targets, giving evidence that the 3ʹ end of the leader alone is not sufficient. This may be because either the leader-upstream and/or the repeat sequence of type II-A that is absent in the type I-E target design is crucial for prespacer integration. No off-target integration is seen in E targets for G2-IC. One observation is that the intensity of leader side products is higher in noncognate targets, G2→G3 and G2→E, compared with the cognate G2-L or G2→G1. We attribute this to full-site integrations occurring in G2-L and G2→G1, where leader-side insertion follows to spacer-side insertion. This causes a reduction in the leader-side band intensity. Interestingly, this also indicates that only G2-L and G2→G1 can support full-site insertion, but not G2→G3 and G2→E.
G3-IC (Fig. S7) showed only a small amount of off-target integration activity using the G1-derived targets. Because we did not find leader- or spacer-side integration products with G3-IC in any of the 16 targets tested, we chose to move forward with only G1-IC and G2-IC for the rest of the study.
Leader-side integration by G1-IC, but not G2-IC, can be directed by a 12-bp motif
Because no Cas1–Cas2 complex was able to integrate leader or spacer-side into any E targets, we hypothesized that the 5′ end of the type II-A repeat (GTTTT) is a crucial sequence element for prespacer insertion (Fig. 3A). Even though E targets hold GTTT sequence near the 5′ end of the repeat (two bases into the repeat), they lack GAG conservation at the 3′ end of the leader. (Fig. 3A). This led us to hypothesize that G1-IC and G2-IC would integrate leader side using a 12-bp motif mimicking the leader–repeat junction.
Figure 3.

Testing role of the leader–repeat junction in G1 and G2 integrations. A, sequence alignment showing the conserved WT leader–repeat region from the three type II-A groups and the E. coli CRISPR type I-E system. B, FAM image of urea-PAGE showing G1-IC and G2-IC integrating into linear cognate target, as well as randomized linear targets containing the conserved leader–repeat junction at different positions. The G1-L and G2-L integration products are 96 nt (leader side, LS) and 116 nt (spacer side, SS), and the Rand114 and Rand75 targets produce leader-side integration products that are 114 and 75 nt, respectively. The results show that although G1 shows reasonable insertion into random DNA (∼60%), the ability of G2 to insert into a minimized DNA backbone is significantly reduced.
To confirm this, we designed randomized DNA targets holding the 12-bp leader–repeat junction. A 104-bp region was randomized by a computer program and was designed to have 50% GC content to avoid other sequence biases (Random DNA Sequence Generator, RRID:SCR_018768). To this 104-bp DNA, we inserted the 12-bp leader–repeat junction belonging to either the G1 or G2 CRISPR locus. This 12-bp leader–repeat junction consisted of the last 7 bp of the leader and the first 5 bp of the repeat (Fig. S8). The 12-bp motif was inserted at two distinct positions in the 104-bp backbone separately, which would result in a 114- or a 75-nt product if integration occurred at the leader–repeat junction. Our results show leader-side bands appearing at the predicted sizes only in G1-IC (Fig. 3B). G1-IC is efficient in integrating after solely recognizing the 12-bp motif, because the band intensities are comparable with the leader-side integration into the cognate backbone. Slight reduction in these band intensities shows that other sequence elements may be necessary for full insertion activity. G2-IC shows very minimal integration using the 12-bp motif, giving evidence that there is a difference in recognition mechanisms between the two type II-A groups.
Order of prespacer insertion varies between G1 and G2 systems
Full-site integration is the result of a single prespacer being integrated at both ends into a single target (Fig. S9). To visualize full-site integration, we employed hairpin targets as previously described (15). The hairpin targets used in this study created a 174-nt leader-side product and a 78-nt spacer-side product for half-site insertions. A full-site integration will create two bands: a 126-nt leader-side product and a 78-nt spacer-side product. G1-IC integrates at all three locations in a cognate hairpin target, as previously shown (24) (Fig. 4). Leader-side integration was the most intense band, followed by spacer-side and then full site. On a G2 hairpin target (G2-HP), G1-IC integrates mainly at the leader-side, along with some minor off-target integration events (Fig. 4). Removing the 3′-OH groups from one of the strands of the prespacer yields only a leader-side product, whereas removing both 3′-OH groups abolishes all insertions. The abolishment of spacer-side integration in G1-IC when only one 3′-OH group is present shows that leader-side integration is a prerequisite for spacer-side integration.
G2-IC can perform full-site integration on cognate target DNA (Fig. 4) as shown previously (15). Several off-target bands are present in the cognate target lanes. These off-target bands were abolished by changing GAG sequences at positions 19 and 70–74 of the G2-HP target to GCG. When the prespacer possessed only one 3′-OH group, both leader and spacer-side insertions are seen, showing that leader-side and spacer-side integration events can occur independently in this group. A small amount of the full-site integration band in lanes where only a single 3′-OH was available shows how often a single target will have two separate prespacers integrating into leader and spacer-sides independently. As expected, there is no integration when 3′-OH is removed from both ends of the spacer. These results indicate an important difference between G1 and G2 integration complexes: G1-IC follows an order while inserting prespacers, but G2-IC does not.
Minimal DNA elements required for prespacer insertions vary for G1 and G2 integration complexes
To define the minimal sequence requirements for the different insertion events (half-site versus full site) in G1 and G2 systems, we performed experiments using randomized hairpin DNA targets. The randomized hairpin target was inserted with either the 36-bp repeat, the 36-bp repeat plus 4 bp of the 3′ leader end, or the 36-bp repeat plus 7 bp of the 3′ leader end (Fig. 5A). For G1-IC, integration bands are present in all the three expected positions (leader-side half-site, 174 nt; spacer-side half-site, 78 nt; and full site, 126 nt) for targets containing at least the full repeat and 4 bp of the leader 3′ end, with leader-side integration being more prominent (Fig. 5B). The repeat alone showed no integration compared with the G1-HP target or the target of Rand+Rep with 4 bp of the leader inserted. This result is interesting because the G1 Rand+Rep target and the G1 target of Rand+Rep with 4 bp of the leader inserted (Fig. 5B) only differ by 4 bp, thus demonstrating the essentiality of the last 4 bp of the leader region in G1 systems. Interestingly, our randomized linear target DNA experiments (Fig. 3) showed that a 12-bp leader–repeat junction was sufficient to insert prespacer at the leader side. Thus, the combined results of both linear and hairpin target DNAs show a preference for leader–repeat junction for leader-side insertion, with the necessity of the full repeat for spacer-side insertion by G1-IC.
Figure 5.

Investigating the role of the whole repeat for integrating prespacers by G1 and G2 into HP targets. A, construction of the randomized DNA hairpin target (Rand), Rand target holding a 36-nt-long repeat belonging to G1 or G2 (Rep), Rep holding a 4-bp region at the 3′ end of the leader (Rep+4), or Rep holding a 7-bp region at the 3′ end of the leader (Rep+7). B, FAM image of urea-PAGE showing G1-IC and G2-IC integrating into cognate L, cognate HP, and random hairpin (Rand) targets. HP targets produce a full-site (FS) band in addition to the leader-side (LS) and spacer-side (SS) bands produced by the linear targets. Neither complex integrated significantly into the random DNA target that is devoid of any CRISPR elements. For G1-IC, addition of the repeat and 4 bp of the leader was necessary for leader-side, spacer-side, and full-site integration to be present. For G2-IC, only the repeat sequence was necessary. The addition of just 4 bp of the leader increased the activity back to cognate amounts. Although Rand and Rand+Rep produced no integration activity in G1-IC, Rand+Rep showed significant activity in G2-IC, showing the differences in the DNA sequence elements required for prespacer insertion in G1 and G2.
G2-IC integrates in all three locations when just the repeat is present. Interestingly, repeat alone can drive full-site insertion efficiently, because the leader-side band intensity is very low, indicating efficient conversion of leader-side insertions to full site events. The addition of 4 bp of the leader brings the intensity of full-site integration back to a comparable amount to G2-HP, showing that the leader end plays some role in integration efficiency but is not a requirement for full-site integration. Another interesting observation is that the spacer-side integration intensity is similar across repeat alone, repeat + 4 bp, or repeat + 7 bp in the case of G2-IC. This again strongly points to the independence in the leader-side and spacer-side insertions in G2, which is distinct from G1. The addition of 7 bp of the leader made no further improvement over the 4-bp leader end in both G1 and G2 systems (Fig. 5B).
G1-IC has specific prespacer requirements, whereas G2-IC is more tolerant
All the integration assays discussed so far in this work used a prespacer containing 5-nt symmetrical 3′ overhangs on each side as described in a previous study (24). We hypothesized that G1-IC and G2-IC would be capable of integrating prespacers with different types of DNA ends. We created a library of different prespacers mimicking different processing options. The first set of prespacers were made by reducing the length of the spacer_30-F strand (Table S1) from both the 5′ and 3′ ends, simultaneously, before annealing to the spacer_30-R strand (Fig. S10). These “nonsymmetrical” prespacers ranged from 0 to 5 nt overhangs at the 5′ and 3′ ends with all possible combinations, totaling 36 different prespacers. It is important to note that 5′ overhangs in the nonsymmetrical prespacers shorten the distance between 3′-OH groups, ranging from 25 to 30 nt. In the next set, we reduced the length from the 5′ ends of both the strands of the prespacer, creating different lengths of 3′ overhangs. These “symmetrical” prespacers ranged from 3- to 7-nt-long overhangs and maintain the 30-nt distance between 3′-OH groups. We also designed prespacers with varying amounts of splaying, from 0 to 7 nt. The results of G1-IC and G2-IC integrating this unique prespacer library into cognate hairpin targets can be seen in Fig. 6 (A and B). G1-IC is very selective about which prespacer is being inserted. Only the symmetrical prespacers with 4- and 5-nt 3′ overhangs support full-site integration. Looking at the nonsymmetrical prespacers, a 3- or 4-nt 3′ overhang can result in weak leader-side insertions (Fig. 6A, red arrows). The 4-nt splayed prespacer also showed a small amount of leader-side and spacer-side integration. Other studies in G1 and G2 systems have also shown that 3′ overhangs improve prespacer integration activity, indicating structural similarity among Cas1–Cas2 complexes (15, 23, 24).
Figure 6.
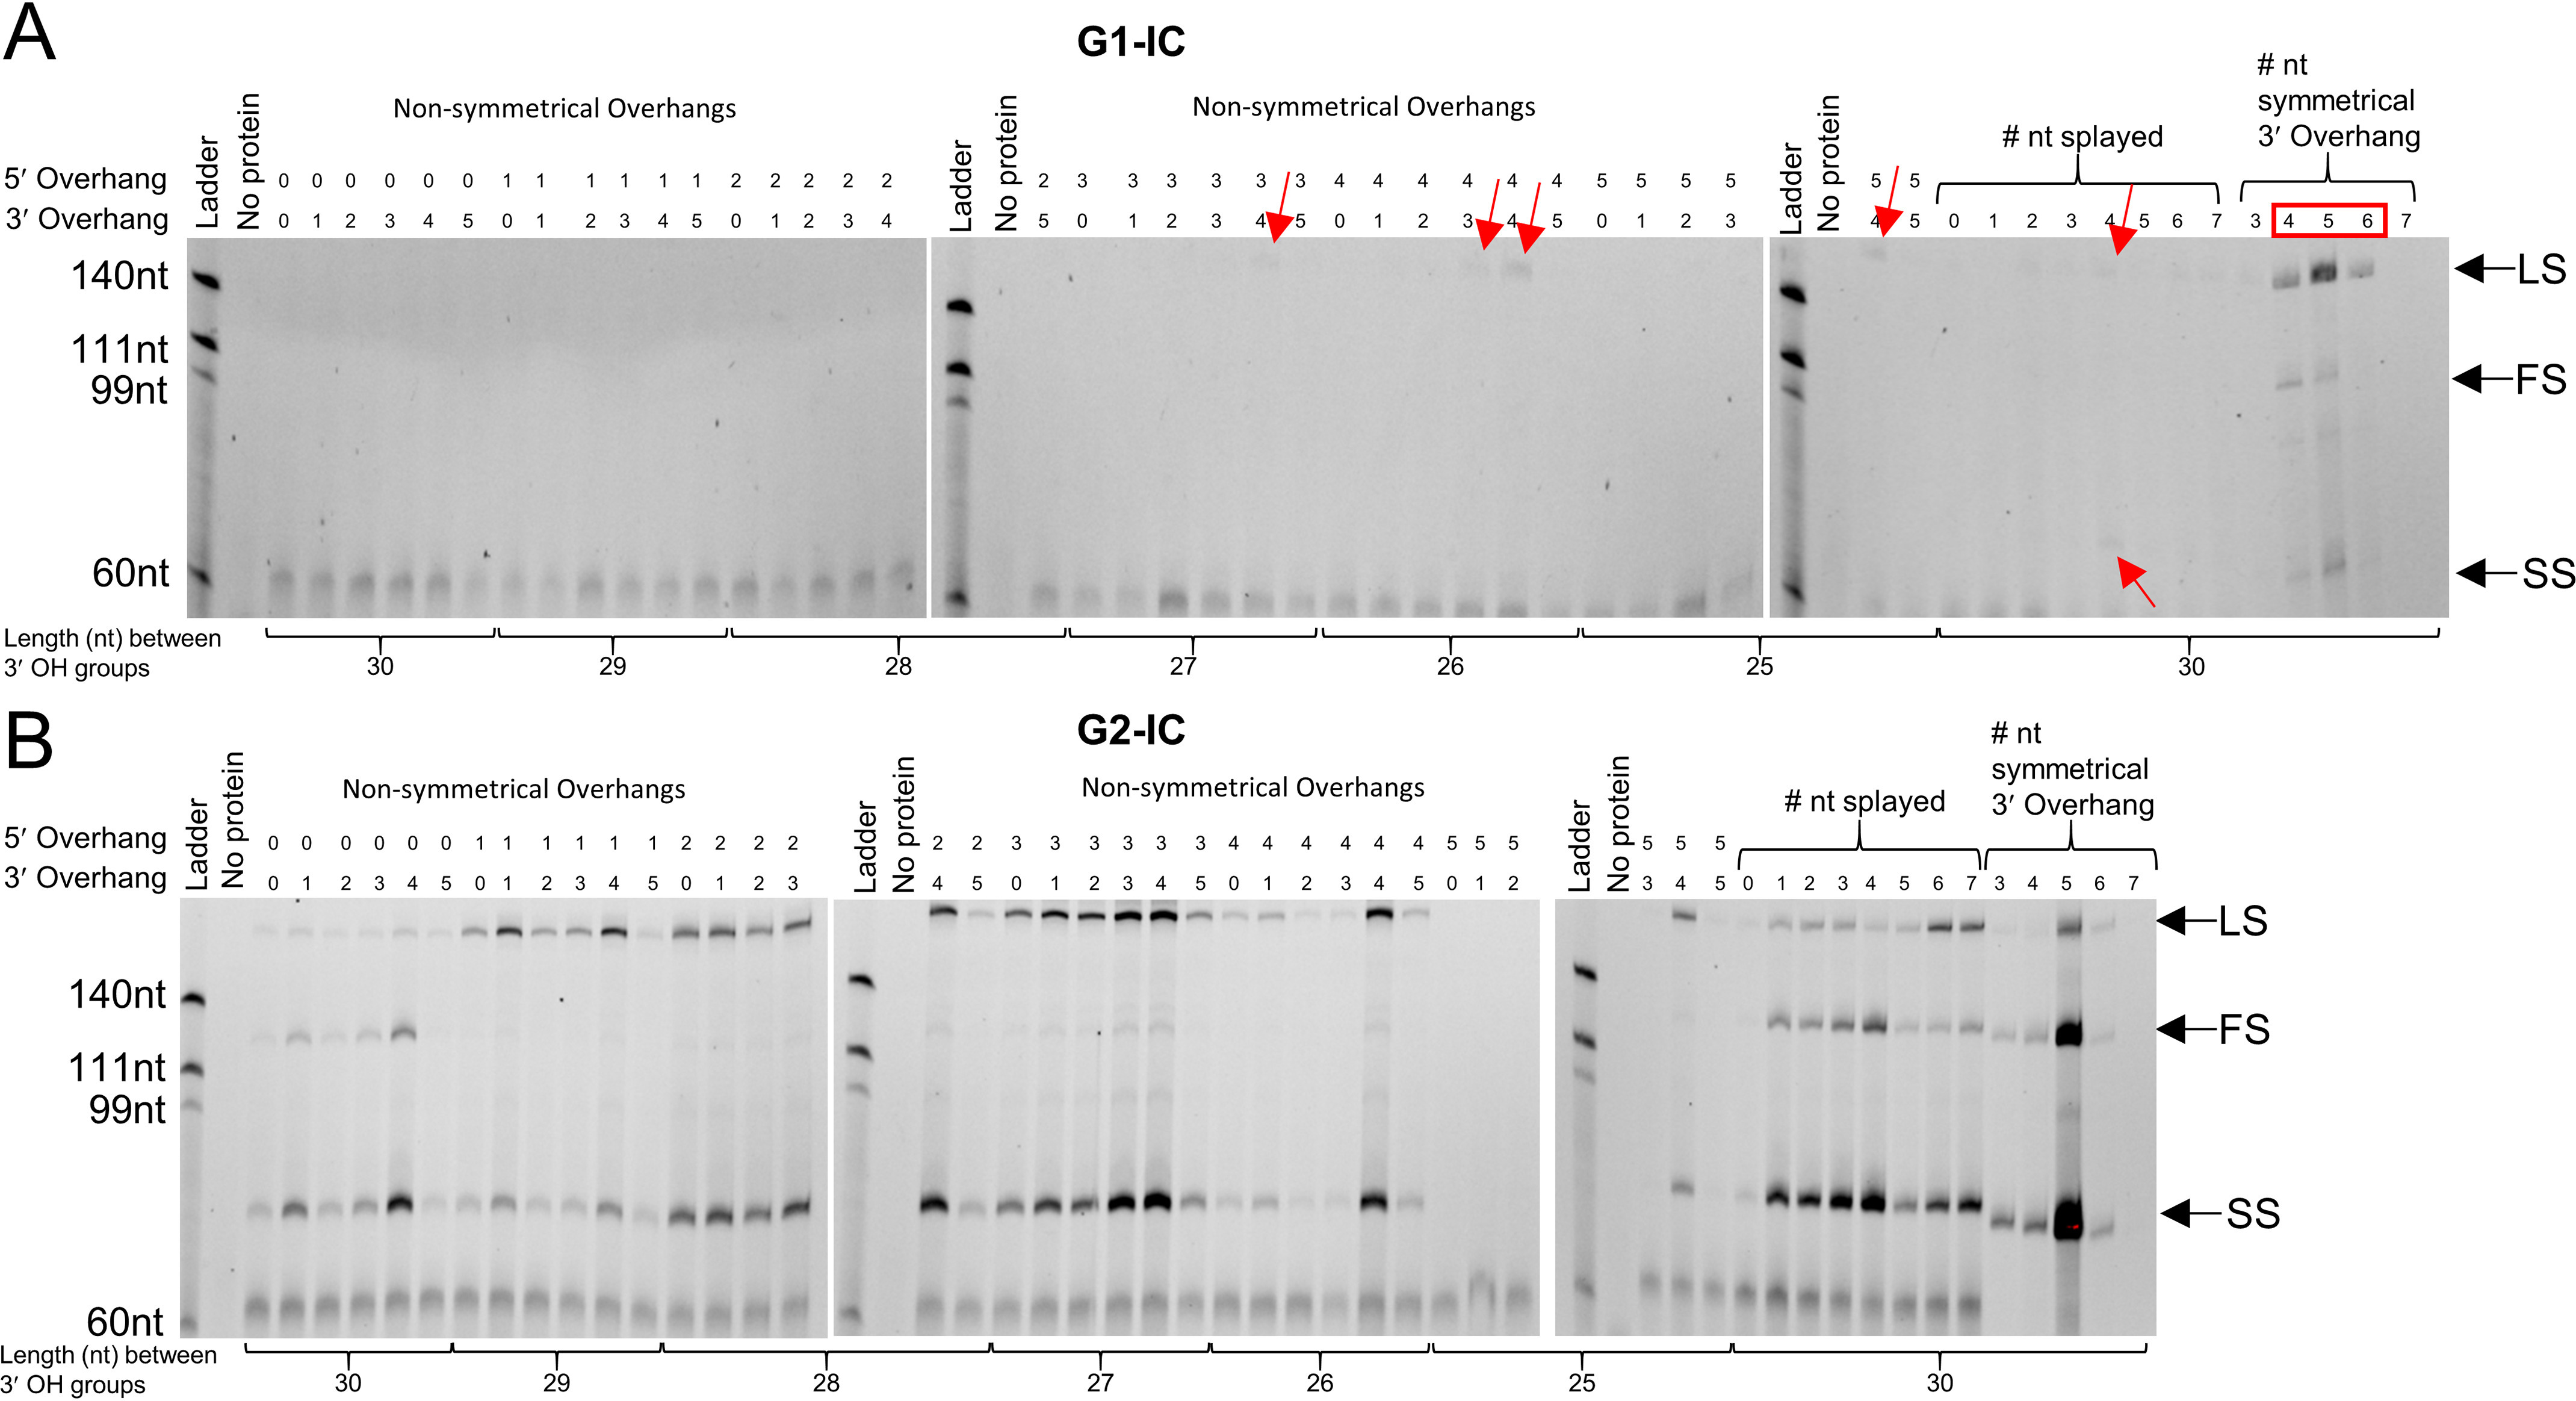
Investigating prespacer preferences of ICs using integration assays with cognate hairpin targets. A, FAM image of urea-PAGE showing G1-IC integrating into a cognate hairpin target using various forms of prespacers. The ability of G1-IC to process or deform prespacers for integration is very limited, and only certain prespacer forms are acceptable. 5′ and 3′ 4-nt nonsymmetrical overhangs resulted in a small amount of leader-side (LS) integration, as did 4 nt of splaying. 4 and 5 nt of symmetrical 3′ overhangs were the only two prespacers to be integrated full site (FS), with 5 nt showing more activity. A red box indicates where integration activity was seen. Red arrows indicate positions of faint integration bands. B, FAM image showing G2-IC integrating into a cognate hairpin target using various forms of prespacers. Many forms of prespacers were acceptable for integration. In general, a 4-nt 3′ overhang resulted in the best possible integration among nonsymmetrical prespacers. Also, decreasing full-site integration by using a nonoptimal prespacer increases leader-side and spacer-side (SS) integration, showing that nonoptimal prespacers can still integrate leader or spacer side but have trouble proceeding to full site (splayed lanes 5–7). A symmetrical 5-nt 3′ overhang shows the best integration. This shows that G2-IC is more tolerant to different prespacer forms.
G2-IC supported integration from various forms of prespacers (Fig. 6B). Most notably, a 4-nt 3′ overhang was generally the best performing prespacer among the 36 nonsymmetrical spacers and the splayed spacers. The 5-nt 3′ overhang symmetrical spacer, however, outperformed all of them. 5′ overhangs of 1–5 nt did not support full-site integration activity when compared with 0 nt. This may either be due to the 5′ overhangs interfering with complex formation, with the ideal placement of the 3′-OH group in the active site of the complex, or due to less than 30 nt between the two 3′-OH groups of the prespacer. Less than 30 nt between the two 3′-OH groups of the prespacer was shown to reduce integration in previous studies (13, 15, 23, 24). The fact that splayed prespacers possess 30 nt suggests that in addition to the distance between the two 3′-OH groups, 5′ overhangs may inhibit integration as well. A very important finding from using this repertoire of prespacers is that G2-IC is more tolerant and can insert anywhere from a fully dsDNA to DNAs with different overhangs, even those with less than 30-nt in between the two 3′-OH groups. Direct mass measurements using size-exclusion chromatography with multiangle light scattering (SEC-MALS) of G1-IC mixed with a 4-nt splayed prespacer resulted in no complex formation (Fig. S11), indicating that incorrect prespacer processing hinders integration complex formation. Interestingly, G2-IC does form a complex with the 4-nt splayed prespacer, showing that G1-IC is likely not active with many forms of spacers because of an inability to bind rather than being catalytically inactive (Fig. S11). These results suggest that G2-IC has a more pliable active site/DNA-binding region that can accommodate a wide range of prespacers, whereas G1-IC is more restrictive in inserting nonideal spacers.
Cas1 and Cas2 groups are not cross-compatible to support integration
Because the current model of an integration complex is Cas14–Cas22 (two dimers of Cas1 sandwiching a Cas2 dimer) bound to a prespacer, we investigated the possibility of Cas1 and Cas2 proteins from different groups being able to form complexes. We monitored the size of complexes formed using SEC-MALS.
Sizes observed by SEC-MALS for the cognate complexes of Cas1 and Cas2 along with the 5-nt symmetrical 3′ overhang prespacer can be seen in Fig. 7. The observed sizes show that all three integration complexes form the expected Cas14–Cas22–DNA complex (∼180 kDa), as does SDS-PAGE and agarose gel analysis of fractions taken from the peaks corresponding to the putative complex (Fig. S12). G3-IC shows a slightly lower retention time than G1-IC and G2-IC, suggesting that the shape of G3-IC may differ from the other two complexes.
Figure 7.

SEC-MALS analysis to determine whether each group (G1, G2, and G3) of proteins forms a stable IC with the 5 nt 3′ overhang prespacer. A, graph showing the light scattering (LS) signal and the molar mass (MM) calculations for G1-IC-DNA, G2-IC-DNA, and G3-IC-DNA as measured by SEC-MALS. The triangles represent molar mass (MM) calculations at specific points, whereas the final number is an average of the points shown. G3-IC has a slightly lower retention time but a very similar MM to the other two complexes, indicating a shape difference. B, table showing the expected MM values of the complete IC, which is four Cas1 and two Cas2 proteins bound to a prespacer (Cas14–Cas22–DNA1). The observed molar masses correspond to the protein complexes eluted from the SEC column and measured using MALS.
A comparison of crystal structures of integration complexes from type I-E and type II-A systems shows similar overall structural alignment, although the separation of Cas1 active sites by the Cas2 gives rise to differences in the length of spacers (23). Even though all the groups tested in our study contain a 30-bp spacer in their CRISPR arrays, complex formation was not observed when Cas1 and Cas2 proteins from different groups were incubated together with the prespacer DNA (Fig. S13). The inability to form complexes between groups indicate shape/structure compatibility issues between the different groups.
Analysis of protein–DNA complexes by SEC-MALS requires long-term stable association of the complexes. It is possible that Cas1 and Cas2 from different groups can transiently interact with themselves and with prespacer DNA to form an active complex but are not stable for longer time periods. To test this possibility, integration assays were performed by mixing Cas1 and Cas2 proteins belonging to the different subgroups. In all cases, no integration was seen (data not shown). Combining the results from SEC-MALS and activity assays, it shows that Cas1 and Cas2 proteins between type II-A groups cannot form productive protein–DNA complexes to support an integration reaction. These structural differences may be influencing the differences in integration activities seen between groups.
Discussion
Characterization of multiple group members establishes conservation of mechanisms within groups
Previous studies used proteins from type II-A CRISPR systems in the S. thermophilus DGCC7710, S. pyogenes M1GAS, and E. faecalis genomes, which belong to the G1, G2, and G2 systems from our analysis, respectively (15, 23, 24). Identities and similarities between the proteins used in our study and the proteins in these previous studies can be seen in Fig. S14. A comparison of our results with in vitro results from the other studies show a mechanistic distinction of prespacer insertion, based on the type II-A groupings that we identified through the bioinformatic work (25). Specifically, the G1 results show a strong dependence on leader–repeat junction for leader-side insertion, followed by a full repeat requirement for spacer-side insertion with an order in prespacer insertion. The G2 loci show dependence on the full repeat sequence for both leader and spacer-side insertions, which are not interdependent. Thus, our study establishes that type II-A systems use different rules for prespacer insertion, based on the members characterized so far, and that these rules have coevolved with leader–repeat and Cas1–Cas2 sequence conservations (25).
Previously published results of an in vivo test in a G1 CRISPR system from S. thermophilus DGCC7710 showed that the last 10 bp of the leader and the entire 36 bp of the first repeat were enough to direct full-site integration in vivo, irrespective of whether these DNA sequences were present in or outside of the CRISPR array (33). Our results further extend this finding that, under in vitro conditions, a 12-bp leader–repeat junction can promote leader-side integration. Experiments with randomized DNA has further reduced this requirement to a 4-bp 3′ leader end and a full repeat for efficient full-site integration. The overall efficiencies of all three integration events (leader side, spacer side, and full site) were comparable between repeat + 4 bp and the full cognate leader–repeat regions (80, 70, and 60%, respectively). Interestingly, the in vivo study in S. thermophilus DGCC7710 showed that its G1 system is more efficient in taking spacers compared with its G2 system co-existing in the same bacterium (33). Comparing adaptation efficiency of an isolated Cas1–Cas2 complex from a G1 system from S. thermophilus CNRZ1066 and a G2 system from S. pyogenes A20 showed that G2 is more robust than G1 in prespacer insertion. These facts point to inherent differences in prespacer insertion between G1 and G2 proteins. There is one amino acid difference between the G1 Cas1 (Q171K) and Cas2 (I64M) proteins in our present study (S. thermophilus CNRZ1066) and the previous in vivo study (S. thermophilus DGCC7710). We introduced amino acid substitutions in S. thermophilus CNRZ1066 G1 Cas1 and Cas2 to produce a 100% amino acid match with that of S. thermophilus DGCC7710 G1 system. Integration assays using hairpin targets and the protein variants showed a slightly better efficiency in using different prespacers compared with native proteins, but with significantly lower efficiency in using prespacers with different morphologies similar to the G1 system that was tested in the present study (Fig. S15). These results support inherent differences in spacer acquisition by different type II-A subgroups.
Steps in prespacer insertion vary between type II-A groups
Our G2-IC can perform independent leader-side and spacer-side insertions at equal efficiencies, but only a cognate leader-side insertion proceeds to full-site insertion (Figs. 4 and 5 and Figs. S2 and S3). The higher intensities for spacer-side insertion for G2-IC lanes (Fig. 4) is supported by previous studies where leader-side recognition was shown to be essential to perform a full-site integration to maintain site specificity during prespacer insertions (15). A spacer-side integration without a leader side was proposed to induce abortive integrations (15). Thus, in our results, when leader-side integration moves forward to full-site integration, it increases the intensity for spacer-side integration band. Our results also show that when insertion occurs at noncognate sites that retain some similarities to the cognate leader–repeat junction (G2→G3 and G2→E in Fig. 2C), it does not proceed to full-site insertion, as indicated by the higher intensity for the leader-side insertion band.
In contrast, our G1-IC shows that there is a preference for leader-side insertion as demonstrated by a single 3′-OH prespacer, where insertion is strictly restricted to the leader side, compared with equal insertion events in G2-IC (Fig. 4). This implicates an inherent, stringent order in the integration events in G1, at least under in vitro conditions.
G1-IC and G2-IC tolerate different prespacer forms
The prespacers may need to be processed by either CRISPR proteins, such as Cas4 shown in previous systems (8, 18, 36), other host proteins, or theoretically by Cas1–Cas2 itself before they can be inserted. Our results showed that the efficiency of full-site integration is sensitive to the length of 3′ overhangs and the distance between 3′-OH groups present on the ends of the potential new spacers. Although trimming of prespacers to prepare it to a morphology that is acceptable by the integration complex may require specific enzymes, preparations that include only separation of the prespacer strands can be done by isolated Cas1–Cas2 complexes, as seen in other structures (13). Our results show that the G1-IC we tested cannot bind to nonideal prespacer and thus may depend on other enzymes to prepare ideal prespacers for it to bind. Interestingly, the G2-IC that we tested can bind and insert several different types of prespacers at the leader side and importantly perform full-site integration with a subset of these prespacers. We can speculate that G2-IC has a more pliable DNA-binding channel and active site to accommodate varied prespacer forms, whereas G1-IC does not. These capabilities make G2-ICs intriguing resources for biotechnological tool development.
Absence of conserved leader–repeat junction in G3 may be physiologically relevant
Interestingly, G3 systems have several anomalies compared with G1 and G2 systems based on our bioinformatics analysis (25). There is only a 2-nt 3′ leader end conservation in G3, which differs greatly from the 7-nt conservation found in G1 and G2 (Fig. 1A). This is significant because 18 of 25 members of G3 in our previous study belonged to lactobacilli, whereas there is a wider distribution of genera in G1 (∼50). Physiologically, lactobacilli harbor temperate phages that are maintained in the bacterial genome (37) and may have evolved to not allow spacer uptake to prevent autoimmunity (38). This indicates that the inability to insert a prespacer into the cognate DNA backbone may be the result of an evolutionary event that is beneficial to the bacterium. It is also possible that the inability of G3-IC to perform full-site integration in vitro may be the result of a missing in vivo factor. Further studies are required to conclusively analyze these different scenarios.
Phylogenetically distinct prespacer insertion mechanisms provide a wide range of applicability
Our results establish that we cannot generalize the rules for prespacer insertion even within closely related CRISPR subtypes. Even within type II-A, we find two distinct mechanisms (Fig. 8): G1 with leader-side recognition followed by full-site integration (Fig. 4) and G2 with repeat recognition followed by fast leader-side integration and slower spacer-side integration (Fig. 5 and Fig. S6). Analysis of a single G3 member that was tested in the current study shows promiscuous integration, possibly arising from a missing a cellular factor or from a dysfunctional mutation in the protein or DNA sequence elements (Fig. S7). Thus, even within closely related CRISPR-types, there may be an interplay of cellular factors or mechanistic differences that fine-tune the integration reactions. Further studies are essential in deciphering different mechanisms available in nature for prespacer insertion. Interestingly, with the current analyses covering our present study and previously published results (15, 23, 24), we show mechanistic separations that mirror the leader–repeat and Cas1–Cas2 sequence conservations (25).
Figure 8.

Schematic of the insertion mechanisms presented for G1-IC and G2-IC. G1-IC recognizes a 12-bp sequence at the leader–repeat junction and inserts leader side first. This is followed by insertion at the spacer side using a ruler mechanism to define the length. G2-IC recognizes sequences in the repeat. Insertion at the leader and spacer sides can happen independently, with the leader side being much faster than the spacer side. Even though the minimal sequence requirement for all prespacer insertions (leader side, spacer side, and full site) is a cognate repeat, the efficiency of the process slightly increases (∼50%) by adding just 4 bp at the 3′ leader end. This supports the strong 3′ leader end conservation for this group, despite the minimal requirement of a repeat sequence for fulfilling the mechanistic requirements.
Potential industrial applications exist for Cas1–Cas2, such as gene tagging, transcriptional recordings, and storage of digital information (39, 40). A better understanding of the functions of Cas proteins in adaptation will make manipulation of the system a possibility, whether that be escalation for better protection of industrially relevant bacteria or combating bacterial pathogens by increasing sensitivity to phages. The results presented here open possibilities of developing several distinct sets of DNA integration tools to match different targeting requirements.
Experimental procedures
Target and prespacer design
Target DNA sequences for each group were designed to mimic the leader–repeat junction and contained the last 50 bp of the leader and the first repeat from the genomic DNA of each representative bacteria, as shown in the CRISPR database (41). For each group, this sequence was followed by the first spacer sequence taken from the CRISPR array in the S. pyogenes A20 type II-A genome (Fig. 1A). The S. pyogenes A20 type II-A spacer sequence was used in all linear targets because initial experiments using cognate native first spacer from each bacterium gave low activity, indicating a role of spacer secondary structure affecting the integration process, at least under the in vitro settings. To avoid such variations in our analysis, we used a spacer sequence with the lowest predicted secondary structure, which was G2 (Fig. S16). G1 came from S. thermophilus CNRZ1066, G2 from S. pyogenes A20 (type II-A), G3 from Lactobacillus paragasseri JV-V03, and E, type I-E system, from E. coli str. K-12 substr. MG1655. The four original linear target sequences (G1-L, G2-L, G3-L, and E-L) were synthesized as double-stranded gene fragments by Integrated DNA Technologies, PCR-amplified, and cloned between BamHI and EcoRI (New England Biolabs) sites of pUC19. Sequence-verified plasmids were used as templates for site-directed mutagenesis (42) using overlapping primers, having the last 7 bp of the leader 3′ ends exchanged in all possible combinations to create twelve mutant substrates (Fig. S17). The sequences for the gene fragments and mutated targets, as well as PCR primers, can be found in Table S1. Sequence-verified plasmids were used as PCR templates to create the 12 mutant 116-bp targets for integration assays. The hairpin targets could not be synthesized as a single molecule because of its secondary structure (77-bp stem, 6-nt loop). To accommodate this, a 67-nt fragment was annealed and ligated to a long template strand containing one strand of the stem (77 nt), the loop (6 nt), and 10 nt of the returning stem. The 67-nt fragment was phosphorylated by calf intestinal phosphatase to facilitate ligation to the 93-nt DNA by T4 DNA ligase. The prespacer used in the bulk of this study was taken from a recently published paper and contained 5-nt 3′ overhangs. (24). Each strand of the prespacer was ordered from Integrated DNA Technologies with a 5′ 6-FAM label and was annealed at an equimolar ratio to create double-stranded, doubly labeled prespacers. For construction of the prespacer library, a single 6-FAM–labeled reverse strand was used to create all nonsymmetrical overhangs. This was done by annealing a shortened nonlabeled forward strand to create the desired overhangs. For spacers that are splayed or with the symmetrical 3′ overhang spacers, unlabeled forward and reverse strands were ordered and were manually labeled using the 5′ EndTagTM labeling DNA/RNA kit from Vector Laboratories before annealing complementary strands at an equimolar ratio.
Cloning of cas genes
The cas1 and cas2 gene sequences from each group were codon optimized by Integrated DNA Technologies for protein expression in E. coli BL21-DE3. Synthetic gene fragments were made for all six Cas genes. G1 Cas1, G1 Cas2, G3 Cas1, and G3 Cas2 were cloned using sequence and ligation-independent cloning (43) into the pET His6 SUMO TEV ligation-independent cloning vector for expression with a SUMO His6 tag (a gift from Scott Gradia, Addgene plasmid 29659, RRID:Addgene_29659). G2 Cas1 and G2 Cas2 were cloned into pMCSG9 using ligation-independent cloning for expression with an N-terminal maltose-binding protein with a His6 tag (44). Solubility tags were necessary for initial protein solubility. Primers used for each reaction can be seen in Table S1.
Protein expression and purification
Plasmids containing the correct gene inserts were transformed into BL21-DE3 cells for protein expression. The cells were grown in 2× YT medium containing the appropriate antibiotic (ampicillin, 100 µg/ml; kanamycin, 50 µg/ml) at 37 °C and at A600 (optical density at 600 nm) of 0.6–0.8 protein was induced with 0.5 mm isopropyl β-d-1-thiogalactopyranoside at 18°C overnight. The cell pellets were resuspended in lysis buffer (50 mm Tris-HCl, pH 8.0, 500 mm NaCl, 20 mm imidazole, 1 mm TCEP, and 10% glycerol), lysed by sonication, and clarified at 38,000 relative centrifugal force for 30 min, and the supernatant was loaded onto a HisTrap Crude column (GE). The proteins were eluted from the nickel column using a gradient of nickel elution buffer (50 mm Tris-HCl, pH 8.0, 500 mm NaCl, 500 mm imidazole, 1 mm TCEP, and 10% glycerol). From this point different protocols were used for each protein.
G1 Cas1 and G1 Cas2 were dialyzed overnight into 50 mm Tris-HCl, pH 8.0, 500 mm NaCl, 1 mm TCEP, and 10% glycerol with the simultaneous addition of TEV protease to cleave off the SUMO His6 solubility tag. The protein was then loaded back onto a HisTrap crude column to separate out the SUMO tag and collect the pure protein in the flow through. Pure protein fractions were checked by SDS-PAGE before being concentrated and loaded onto a HiLoad 16/600 Superdex S 75-pg size-exclusion column (GE), using fresh dialysis buffer as the gel filtration buffer.
G2 Cas1 was dialyzed overnight with TEV in 50 mm Tris-HCl, pH 8.0, 300 mm NaCl, 1 mm TCEP, and 10% glycerol. This removed the maltose-binding protein–His6 tag. The protein was further purified on a HiTrap Heparin HP (GE) column, and pure fractions were concentrated and run on a HiLoad 16/600 Superdex S 75-pg column (GE). G2 Cas2 was purified similarly, but 500 mm NaCl was in all buffers except the 1 m elution buffer for the heparin column, which enhanced protein solubility.
G3 Cas1 was dialyzed overnight in 50 mm Tris-HCl, pH 8.0, 300 mm NaCl, 1 mm TCEP, and 10% glycerol with TEV to remove the SUMO His6 tag. The protein was then loaded back onto a HisTrap crude column, and pure protein separated from the SUMO tag was collected in the flow through. The flow through was concentrated and run on a HiLoad 16/600 Superdex S 75-pg (GE). G3 Cas2 was purified similarly except for the use of 500 mm NaCl in all buffers to keep the protein soluble. All proteins were concentrated to ∼5 mg/ml for Cas1 and ∼1 mg/ml for Cas2. Protein concentrations were measured using the absorbance at 280 nm on a NanoDrop (Thermo Fisher), and extinction coefficients were predicted by ProtParam (35). Small aliquots for integration assays (3–10 µl) were flash-frozen in liquid nitrogen and stored at −80 °C. The concentrations of protein dilutions made for integration assays were measured again using the NanoDrop for accuracy in experiments. All purified protein samples were analyzed by high-resolution intact protein MS at the Laboratory for Molecular Biology and Cytometry Research at the University of Oklahoma Health Sciences Center. Each protein that was compatible was measured within 1 Da of the expected mass, confirming full-length protein samples (Fig. S18). SDS-PAGE confirms that each protein sample is >95% pure (Fig. S19). NCBI Protein accession numbers are as follows: G1 Cas1, WP_011227029; G1 Cas2, WP_011227030; G2 Cas1, AFV38400; G2 Cas2, AFV38399; G3 Cas1, EFJ70028; and G3 Cas2, EFJ70029.
Integration assays
Integration assays were performed similarly as before (23) with slight modifications. The final reaction conditions contained 50 ng of target DNA, 200 nm prespacer, and 500 nm Cas1–Cas2 complex (because the complex is four Cas1 molecules to two Cas2 molecules, we mixed equal volumes of 40 μm Cas1 and 20 μm Cas2 to make a 10× stock solution of 5 μm). Optimum protein concentration was determined by titration assay (Fig. S20). The 30-min reaction time was determined by time courses for each protein complex (Figs. S2 and S3). Reaction buffer differed for each protein complex. G1-IC and G3-IC reaction buffer contained 20 mm HEPES, pH 8.0, 25 mm NaCl, 1 mm TCEP, 10 mm MnCl2, and 10% DMSO. G2-IC reaction buffer contained 20 mm HEPES, pH 8.0, 25 mm NaCl, 1 mm TCEP, 10 mm MgCl2, and 10% DMSO. Different metals in the buffers for each protein complex were based on optimization of reactions using various metals (Fig. S1). 10-μl reactions were run at room temperature for 30 min before being quenched with 10 μl of 95% formamide, 50 mm EDTA, 0.025% bromphenol blue, and 0.025% xylene cyanol. Quenched reactions were heated to 95°C for 5 min before resolving on urea-PAGE. The gel composition was 12.5% acrylamide, 6 m urea, and 20% formamide. A total of three replications were done for each experiment, including proteins from two independent protein preparations. Representative gels used for quantifications can be seen in Figs. S5 and S6. Uncropped gels can be seen in the supporting information. FAM images and ethidium bromide images were taken using a ChemiDoc MP imaging system (Bio-Rad). Quantifications of FAM bands were done using ImageJ (National Institutes of Health). Integration scores were calculated using the following equation.
| (Eq. 1) |
Standard deviation ( was calculated using the following equation.
| (Eq. 2) |
Although this quantification method does not account for loading differences between lanes, this was the only reasonable way we would get quantitative information from these data. The amount of free prespacer left was in amounts causing saturation during quantification, and hence quantification within each lane was not possible. Nevertheless, this method showed its ability to compare between the different experimental conditions in this study.
Analysis of protein complex formation
Protein complex formation was analyzed using SEC-MALS. Running buffer for all the SEC-MALS runs consisted of 20 mm HEPES, pH 8.0, 200 mm NaCl, 1 mm TCEP, 10 mm MgCl2, and 1% glycerol. Individual samples were prepared by diluting 50 μl of 5 μm complex + 5 μm prespacer (in gel filtration buffer from the protein purification) with 450 μl of 20 mm HEPES, pH 8.0, 150 mm NaCl, 1 mm TCEP, and 10 mm MgCl2. The samples were incubated overnight at 4 °C and centrifuged at 16,000 relative centrifugal force. The samples were then injected onto a Superdex 200 Increase column 10/300 GL (GE) with an inline miniDAWN TREOS (Wyatt Technology Co.) multiangle light scattering detector and Optilab T-rEX (Wyatt Technology Co.) differential refractometer. Molar mass analysis was carried out using ASTRA (version 7.3.0) software (Wyatt Technology Co.), and other data analysis was done in Microsoft Excel.
Data availability
Supporting information is available at the Journal's website. Access to raw light scattering data files is available upon request.
Supplementary Material
Acknowledgments
We acknowledge the OU Protein Production and Characterization Core facility at the University of Oklahoma, Department of Chemistry and Biochemistry for assistance with protein production and gel imaging. The University of Oklahoma Protein Production and Characterization Core facility is supported by an Institutional Development Award from the NIGMS, National Institutes of Health under Grant P20GM103640. We thank the Laboratory for Molecular Biology and Cytometry Research at the University of Oklahoma Health Sciences Center for the use of the Core Facility, which provided the high-resolution protein mass measurement service. We thank Dr. Peter Klein, a former Rajan lab member, for initiating the cloning experiments. We acknowledge the financial support provided from the Office of the Vice President for Research and Partnerships and the Office of the Provost, University of Oklahoma towards the publication cost.
This article contains supporting information.
Author contributions—MJVO and RR conceptualization; MJVO and SN data curation; MJVO and RR formal analysis; MJVO and RR validation; MJVO visualization; MJVO and RR methodology; MJVO writing-original draft; SN and RR writing-review and editing; RR resources; RR supervision; RR funding acquisition; RR investigation; RR project administration.
Funding and additional information—This work was supported by Oklahoma Center for the Advancement of Science and Technology Project HR17-124 and in part by National Institutes of Health Grant P20GM103640. The content is solely the responsibility of the authors and does not necessarily represent the official views of the National Institutes of Health.
Conflict of interest—The authors declare that they have no conflicts of interest with the contents of this article.
- Cas
- CRISPR-associated
- G1
- group 1
- G2
- group 2
- G3
- group 3
- HP
- hairpin target
- IC
- integration complex
- L
- linear target
- nt
- nucleotide
- Rand
- random hairpin target
- Rand+Rep
- random hairpin with the repeat sequence inserted
- SEC-MALS
- size-exclusion chromatography with multiangle light scattering
- FAM
- 6-fluorescein amidite
- TCEP
- tris(2-carboxyethyl)phosphine
- TEV
- tobacco etch virus
- bp
- base pair.
References
- 1. Barrangou R., Fremaux C., Deveau H., Richards M., Boyaval P., Moineau S., Romero D. A., and Horvath P. (2007) CRISPR provides acquired resistance against viruses in prokaryotes. Science 315, 1709–1712 10.1126/science.1138140 [DOI] [PubMed] [Google Scholar]
- 2. Bolotin A., Quinquis B., Sorokin A., and Ehrlich S. D. (2005) Clustered regularly interspaced short palindrome repeats (CRISPRs) have spacers of extrachromosomal origin. Microbiology 151, 2551–2561 10.1099/mic.0.28048-0 [DOI] [PubMed] [Google Scholar]
- 3. Mojica F. J., Díez-Villaseñor C., García-Martínez J., and Soria E. (2005) Intervening sequences of regularly spaced prokaryotic repeats derive from foreign genetic elements. J. Mol. Evol. 60, 174–182 10.1007/s00239-004-0046-3 [DOI] [PubMed] [Google Scholar]
- 4. Brouns S. J., Jore M. M., Lundgren M., Westra E. R., Slijkhuis R. J., Snijders A. P., Dickman M. J., Makarova K. S., Koonin E. V., and van der Oost J. (2008) Small CRISPR RNAs guide antiviral defense in prokaryotes. Science 321, 960–964 10.1126/science.1159689 [DOI] [PMC free article] [PubMed] [Google Scholar]
- 5. Sternberg S. H., Richter H., Charpentier E., and Qimron U. (2016) Adaptation in CRISPR-Cas Systems. Mol. Cell 61, 797–808 10.1016/j.molcel.2016.01.030 [DOI] [PubMed] [Google Scholar]
- 6. Ka D., Jang D. M., Han B. W., and Bae E. (2018) Molecular organization of the type II-A CRISPR adaptation module and its interaction with Cas9 via Csn2. Nucleic Acids Res. 46, 9805–9815 10.1093/nar/gky702 [DOI] [PMC free article] [PubMed] [Google Scholar]
- 7. Kieper S. N., Almendros C., Behler J., McKenzie R. E., Nobrega F. L., Haagsma A. C., Vink J. N. A., Hess W. R., and Brouns S. J. J. (2018) Cas4 facilitates PAM-compatible spacer selection during CRISPR adaptation. Cell Rep. 22, 3377–3384 10.1016/j.celrep.2018.02.103 [DOI] [PMC free article] [PubMed] [Google Scholar]
- 8. Lee H., Zhou Y., Taylor D. W., and Sashital D. G. (2018) Cas4-dependent prespacer processing ensures high-fidelity programming of CRISPR arrays. Mol. Cell 70, 48–59.e5 10.1016/j.molcel.2018.03.003 [DOI] [PMC free article] [PubMed] [Google Scholar]
- 9. Nuñez J. K., Bai L., Harrington L. B., Hinder T. L., and Doudna J. A. (2016) CRISPR immunological memory requires a host factor for specificity. Mol. Cell 62, 824–833 10.1016/j.molcel.2016.04.027 [DOI] [PubMed] [Google Scholar]
- 10. Yosef I., Goren M. G., and Qimron U. (2012) Proteins and DNA elements essential for the CRISPR adaptation process in Escherichia coli. Nucleic Acids Res. 40, 5569–5576 10.1093/nar/gks216 [DOI] [PMC free article] [PubMed] [Google Scholar]
- 11. McGinn J., and Marraffini L. A. (2019) Molecular mechanisms of CRISPR-Cas spacer acquisition. Nat. Rev. Microbiol. 17, 7–12 10.1038/s41579-018-0071-7 [DOI] [PubMed] [Google Scholar]
- 12. Nuñez J. K., Kranzusch P. J., Noeske J., Wright A. V., Davies C. W., and Doudna J. A. (2014) Cas1–Cas2 complex formation mediates spacer acquisition during CRISPR-Cas adaptive immunity. Nat. Struct. Mol. Biol. 21, 528–534 10.1038/nsmb.2820 [DOI] [PMC free article] [PubMed] [Google Scholar]
- 13. Nuñez J. K., Harrington L. B., Kranzusch P. J., Engelman A. N., and Doudna J. A. (2015) Foreign DNA capture during CRISPR-Cas adaptive immunity. Nature 527, 535–538 10.1038/nature15760 [DOI] [PMC free article] [PubMed] [Google Scholar]
- 14. Wang J., Li J., Zhao H., Sheng G., Wang M., Yin M., and Wang Y. (2015) Structural and mechanistic basis of PAM-dependent spacer acquisition in CRISPR-Cas systems. Cell 163, 840–853 10.1016/j.cell.2015.10.008 [DOI] [PubMed] [Google Scholar]
- 15. Wright A. V., and Doudna J. A. (2016) Protecting genome integrity during CRISPR immune adaptation. Nat. Struct. Mol. Biol. 23, 876–883 10.1038/nsmb.3289 [DOI] [PubMed] [Google Scholar]
- 16. Arslan Z., Hermanns V., Wurm R., Wagner R., and Pul U. (2014) Detection and characterization of spacer integration intermediates in type I-E CRISPR-Cas system. Nucleic Acids Res. 42, 7884–7893 10.1093/nar/gku510 [DOI] [PMC free article] [PubMed] [Google Scholar]
- 17. Ivancic-Bace I., Cass S. D., Wearne S. J., and Bolt E. L. (2015) Different genome stability proteins underpin primed and naïve adaptation in E. coli CRISPR-Cas immunity. Nucleic Acids Res. 43, 10821–10830 10.1093/nar/gkv1213 [DOI] [PMC free article] [PubMed] [Google Scholar]
- 18. Rollie C., Graham S., Rouillon C., and White M. F. (2018) Prespacer processing and specific integration in a Type I-A CRISPR system. Nucleic Acids Res. 46, 1007–1020 10.1093/nar/gkx1232 [DOI] [PMC free article] [PubMed] [Google Scholar]
- 19. McGinn J., and Marraffini L. A. (2016) CRISPR-Cas systems optimize their immune response by specifying the site of spacer integration. Mol. Cell 64, 616–623 10.1016/j.molcel.2016.08.038 [DOI] [PMC free article] [PubMed] [Google Scholar]
- 20. Wei Y., Terns R. M., and Terns M. P. (2015) Cas9 function and host genome sampling in Type II-A CRISPR-Cas adaptation. Genes Dev. 29, 356–361 10.1101/gad.257550.114 [DOI] [PMC free article] [PubMed] [Google Scholar]
- 21. Heler R., Samai P., Modell J. W., Weiner C., Goldberg G. W., Bikard D., and Marraffini L. A. (2015) Cas9 specifies functional viral targets during CRISPR-Cas adaptation. Nature 519, 199–202 10.1038/nature14245 [DOI] [PMC free article] [PubMed] [Google Scholar]
- 22. Wilkinson M., Drabavicius G., Silanskas A., Gasiunas G., Siksnys V., and Wigley D. B. (2019) Structure of the DNA-bound spacer capture complex of a type II CRISPR-Cas system. Mol. Cell 75, 90–101.e5 10.1016/j.molcel.2019.04.020 [DOI] [PMC free article] [PubMed] [Google Scholar]
- 23. Xiao Y., Ng S., Nam K. H., and Ke A. (2017) How type II CRISPR-Cas establish immunity through Cas1–Cas2–mediated spacer integration. Nature 550, 137–141 10.1038/nature24020 [DOI] [PMC free article] [PubMed] [Google Scholar]
- 24. Kim J. G., Garrett S., Wei Y., Graveley B. R., and Terns M. P. (2019) CRISPR DNA elements controlling site-specific spacer integration and proper repeat length by a Type II CRISPR-Cas system. Nucleic Acids Res. 47, 8632–8648 10.1093/nar/gkz677 [DOI] [PMC free article] [PubMed] [Google Scholar]
- 25. Van Orden M. J., Klein P., Babu K., Najar F. Z., and Rajan R. (2017) Conserved DNA motifs in the type II-A CRISPR leader region. PeerJ 5, e3161 10.7717/peerj.3161 [DOI] [PMC free article] [PubMed] [Google Scholar]
- 26. Deveau H., Barrangou R., Garneau J. E., Labonté J., Fremaux C., Boyaval P., Romero D. A., Horvath P., and Moineau S. (2008) Phage response to CRISPR-encoded resistance in Streptococcus thermophilus. J. Bacteriol. 190, 1390–1400 10.1128/JB.01412-07 [DOI] [PMC free article] [PubMed] [Google Scholar]
- 27. Horvath P., Romero D. A., Coûté-Monvoisin A. C., Richards M., Deveau H., Moineau S., Boyaval P., Fremaux C., and Barrangou R. (2008) Diversity, activity, and evolution of CRISPR loci in Streptococcus thermophilus. J. Bacteriol. 190, 1401–1412 10.1128/JB.01415-07 [DOI] [PMC free article] [PubMed] [Google Scholar]
- 28. Garneau J. E., Dupuis M. E., Villion M., Romero D. A., Barrangou R., Boyaval P., Fremaux C., Horvath P., Magadán A. H., and Moineau S. (2010) The CRISPR/Cas bacterial immune system cleaves bacteriophage and plasmid DNA. Nature 468, 67–71 10.1038/nature09523 [DOI] [PubMed] [Google Scholar]
- 29. Lopez-Sanchez M. J., Sauvage E., Da Cunha V., Clermont D., Ratsima Hariniaina E., Gonzalez-Zorn B., Poyart C., Rosinski-Chupin I., and Glaser P. (2012) The highly dynamic CRISPR1 system of Streptococcus agalactiae controls the diversity of its mobilome. Mol. Microbiol. 85, 1057–1071 10.1111/j.1365-2958.2012.08172.x [DOI] [PubMed] [Google Scholar]
- 30. Paez-Espino D., Morovic W., Sun C. L., Thomas B. C., Ueda K., Stahl B., Barrangou R., and Banfield J. F. (2013) Strong bias in the bacterial CRISPR elements that confer immunity to phage. Nat. Commun. 4, 1430 10.1038/ncomms2440 [DOI] [PubMed] [Google Scholar]
- 31. Sun C. L., Barrangou R., Thomas B. C., Horvath P., Fremaux C., and Banfield J. F. (2013) Phage mutations in response to CRISPR diversification in a bacterial population. Environ. Microbiol. 15, 463–470 10.1111/j.1462-2920.2012.02879.x [DOI] [PubMed] [Google Scholar]
- 32. Hynes A. P., Villion M., and Moineau S. (2014) Adaptation in bacterial CRISPR-Cas immunity can be driven by defective phages. Nat. Commun. 5, 4399 10.1038/ncomms5399 [DOI] [PubMed] [Google Scholar]
- 33. Wei Y., Chesne M. T., Terns R. M., and Terns M. P. (2015) Sequences spanning the leader–repeat junction mediate CRISPR adaptation to phage in Streptococcus thermophilus. Nucleic Acids Res. 43, 1749–1758 10.1093/nar/gku1407 [DOI] [PMC free article] [PubMed] [Google Scholar]
- 34. Heler R., Wright A. V., Vucelja M., Bikard D., Doudna J. A., and Marraffini L. A. (2017) Mutations in Cas9 enhance the rate of acquisition of viral spacer sequences during the CRISPR-Cas immune response. Mol. Cell 65, 168–175 10.1016/j.molcel.2016.11.031 [DOI] [PMC free article] [PubMed] [Google Scholar]
- 35. Wilkins M. R., Gasteiger E., Bairoch A., Sanchez J. C., Williams K. L., Appel R. D., and Hochstrasser D. F. (1999) Protein identification and analysis tools in the ExPASy server. Methods Mol. Biol. 112, 531–552 [DOI] [PubMed] [Google Scholar]
- 36. Shiimori M., Garrett S. C., Graveley B. R., and Terns M. P. (2018) Cas4 nucleases define the PAM, length, and orientation of DNA fragments integrated at CRISPR loci. Mol. Cell 70, 814–824.e6 10.1016/j.molcel.2018.05.002 [DOI] [PMC free article] [PubMed] [Google Scholar]
- 37. Sanozky-Dawes R., Selle K., O'Flaherty S., Klaenhammer T., and Barrangou R. (2015) Occurrence and activity of a type II CRISPR-Cas system in Lactobacillus gasseri. Microbiology 161, 1752–1761 10.1099/mic.0.000129 [DOI] [PubMed] [Google Scholar]
- 38. Rollie C., Chevallereau A., Watson B. N. J., Chyou T. Y., Fradet O., McLeod I., Fineran P. C., Brown C. M., Gandon S., and Westra E. R. (2020) Targeting of temperate phages drives loss of type I CRISPR-Cas systems. Nature 578, 149–153 10.1038/s41586-020-1936-2 [DOI] [PMC free article] [PubMed] [Google Scholar]
- 39. Schmidt F., Cherepkova M. Y., and Platt R. J. (2018) Transcriptional recording by CRISPR spacer acquisition from RNA. Nature 562, 380–385 10.1038/s41586-018-0569-1 [DOI] [PubMed] [Google Scholar]
- 40. Shipman S. L., Nivala J., Macklis J. D., and Church G. M. (2017) CRISPR-Cas encoding of a digital movie into the genomes of a population of living bacteria. Nature 547, 345–349 10.1038/nature23017 [DOI] [PMC free article] [PubMed] [Google Scholar]
- 41. Grissa I., Vergnaud G., and Pourcel C. (2007) The CRISPRdb database and tools to display CRISPRs and to generate dictionaries of spacers and repeats. BMC Bioinformatics 8, 172 10.1186/1471-2105-8-172 [DOI] [PMC free article] [PubMed] [Google Scholar]
- 42. Carey M. F., Peterson C. L., and Smale S. T. (2013) PCR-mediated site-directed mutagenesis. Cold Spring Harb. Protoc. 2013, 738–742 10.1101/pdb.prot076505 [DOI] [PubMed] [Google Scholar]
- 43. Li M. Z., and Elledge S. J. (2012) SLIC: a method for sequence- and ligation-independent cloning. Methods Mol. Biol. 852, 51–59 10.1007/978-1-61779-564-0_5 [DOI] [PubMed] [Google Scholar]
- 44. Aslanidis C., and de Jong P. J. (1990) Ligation-independent cloning of PCR products (LIC-PCR). Nucleic Acids Res. 18, 6069–6074 10.1093/nar/18.20.6069 [DOI] [PMC free article] [PubMed] [Google Scholar]
Associated Data
This section collects any data citations, data availability statements, or supplementary materials included in this article.
Supplementary Materials
Data Availability Statement
Supporting information is available at the Journal's website. Access to raw light scattering data files is available upon request.