

Abstract
The hallmarks of neurodegenerative diseases, including neural fibrils, reactive oxygen species, and cofilin–actin rods, present numerous challenges in the development of in vivo diagnostic tools. Biomarkers such as β-amyloid (Aβ) fibrils and Tau tangles in Alzheimer's disease are accessible only via invasive cerebrospinal fluid assays, and reactive oxygen species can be fleeting and challenging to monitor in vivo. Although remaining a challenge for in vivo detection, the protein–protein interactions underlying these disease-specific biomarkers present opportunities for the engineering of in vitro pathology-sensitive biosensors. These tools can be useful for investigating early stage events in neurodegenerative diseases in both cellular and animal models and may lead to clinically useful reagents. Here, we report a light- and cellular stress–gated protein switch based on cofilin–actin rod formation, occurring in stressed neurons in the Alzheimer's disease brain and following ischemia. By coupling the stress-sensitive cofilin–actin interaction with the light-responsive Cry2-CIB blue-light switch, referred to hereafter as the CofActor, we accomplished both light- and energetic/oxidative stress–gated control of this interaction. Site-directed mutagenesis of both cofilin and actin revealed residues critical for sustaining or abrogating the light- and stress-gated response. Of note, the switch response varied depending on whether cellular stress was generated via glycolytic inhibition or by both glycolytic inhibition and azide-induced ATP depletion. We also demonstrate light- and cellular stress–gated switch function in cultured hippocampal neurons. CofActor holds promise for the tracking of early stage events in neurodegeneration and for investigating actin's interactions with other proteins during cellular stress.
Keywords: cofilin-actin rods, neurodegenerative disease, cellular stress, optogenetics, cryptochrome 2, actin, cytoskeletal dynamics, CofActor, cell signaling, molecular switch, oxidative stress, cytoskeleton, cryptochrome, neuron, ATP depletion, cofilin actin rods, Cry2/CIB, cytoskeletal dysregulation, neurodegeneration
Actin–cofilin bundles or rods, formed in neurons as part of a cellular stress response, impact synaptic function and may play a significant early role in the progression of neurodegenerative disorders (1). Prior studies have shown that actin and cofilin combine in a 1:1 ratio in rods, with actin assuming a highly twisted conformation (2). This unusual arrangement excludes most other potential binding partners, with particular isoforms of 14-3-3 protein being a notable exception (2, 3). Although cofilin–actin rods are frequently observed in postmortem brain slices from Alzheimer's disease patients, their transient nature, along with the multifaceted activities of both cofilin and actin, makes them particularly challenging to study in vivo (1). Thus, methods for the induction of cofilin–actin rods in cell culture have been developed, including in primary neurons exposed to Aβ fibrils (4) and HeLa cells subjected to ATP-depleting conditions (2). Both oxidative and energetic stress, separately, have been shown to induce cofilin–actin rods. Exposure of cells to H2O2 induces cofilin–actin rod formation through an ROS-dependent mechanism via activation of the cofilin slingshot phosphatase, whereas exposure to sodium azide/Deoxy-d-glucose induces cofilin–actin rod formation through mitochondrial inhibition, subsequent ATP depletion, and activation of the cofilin phosphatase chronophin (5).
Prior work shows that mutagenesis of only one or two amino acids in cofilin (e.g. S3E, S3A/S120A) can significantly reduce the affinity of cofilin for native actin structures, both in vivo and in vitro (6–9). These mutant cofilins are subsequently able to function as biosensors and bioactuators of cofilin-dependent cell functions (10–12). Recently, a cofilin mutant (R21Q) was described that enables real-time tracking of cofilin–actin rod formation and dissipation in cell culture models when expressed as a fusion with the fluorescent protein mCherry (13). Unlike overexpressed WT cofilin, the R21Q mutant resists incorporation into cofilin–actin rods in the absence of oxidative and energetic stress; however, it readily incorporates into cofilin–actin bundles under sources of oxidative and energetic stress (α-amino-3-hydroxy-5-methyl-4-isoxazolepropionic acid, Aβ, ATP depletion). In light of the R21Q study, we asked whether a cofilin mutant with substantially reduced affinity for F-actin could be the basis for an optogenetic switch that enables the bundling of cofilin and actin in response to both light and cellular stress stimuli. The requirement for such a switch would be that it resists background incorporation into cofilin–actin bundles under both normal and cellular stress conditions, yet readily forms cofilin–actin bundles when exposed to a combination of cellular stress and light. However, in contrast to native cofilin–actin bundle formation, reversal of the light-induced cofilin–actin bundles could be accomplished without removal of the source of cellular stress. With the advantage of rapid and reversible light-mediated induction, the resulting switch would allow for tracking the formation and movement of cofilin–actin bundles in living cells, including neurons.
Results
Prior studies demonstrated that point mutants of cofilin-1 (e.g. S3E, S3A/S120A) exhibit diminished actin-binding capabilities, both when expressed as stand-alone cofilins and when incorporated into protein fusions (cofilin–cryptochrome 2–mCherry) (6). We investigated whether the same cofilin-containing protein fusions exhibited a similar response to energetic stress in the presence of an ATP-depletion medium, as has been previously reported for both endogenous and overexpressed cofilins (2, 13, 14). Following literature procedures, cofilin (WT, S3E, S3A, S3A/S120A)-Cry2PHR-mCh protein fusions expressed in HeLa cells were incubated with either PBS or ATP depletion media for 1 h, followed by fixation and imaging. As a result of the applied cellular stress, cofilins with full actin-binding capability (WT and S3A) were readily incorporated into clusters, whereas cofilins with impaired actin-binding ability (S3A/S120A and S3E) failed to incorporate into clusters (Fig. 1A and B). Via immunostaining with an actin antibody, we demonstrated that the observed cofilin clusters were co-localized with endogenous β-actin (Fig. 1B). Further exploration of the ATP-depletion buffer revealed that using the full complement of mitochondrial inhibition (10 mm NaN3/6 mm 2-Deoxy-d-Glucose) resulted in abundant cofilin–actin clusters distributed throughout the cell body, whereas treatment with glycolytic inhibition only (0 mm NaN3/6 mm 2-DG) resulted in the accumulation of cofilin–actin bundles around the cell periphery (Fig. 2 and Figs. S1–S3). We attribute this effect to naturally occurring ROS production, which is higher at the highly dynamic cell edges (15). Experiments were also conducted to establish the minimum time and concentrations necessary for induction of cofilin–actin clustering, demonstrating that 15 min in full ATP-depletion medium was sufficient for inducing robust cofilin–actin bundling (Fig. S1–S3).
Figure 1.

Cofilin actin rods formed with cofilin WT protein fusion. A, widefield fluorescent microscopy images of responses of cofilin protein fusions (expressed as a Cof-Cry2-mCherry fusion in HeLa cells) to energetic stress. Actin-binding cofilins (WT and S3A) incorporate into cofilin–actin rods after 1 h in 6 mm 2-Deoxy-d-glucose and 10 mm sodium azide, while actin-binding–impaired mutants (S3A/A120A; S3E) and the cofilin-free control (Cry2-mCh) remain cytosolic. Scale bar = 10 μm. B, Zeiss Airyscan Confocal image of immunostaining of CofWT-Cry2-mCh cofilin–actin rods with β-actin antibody demonstrates presence of endogenous actin in actin–cofilin clusters (yellow spots in overlay). Scale bars = 10 μm. C, quantitation of clusters/rods formed per cell in panel A (n = 10 cells per condition).
Figure 2.
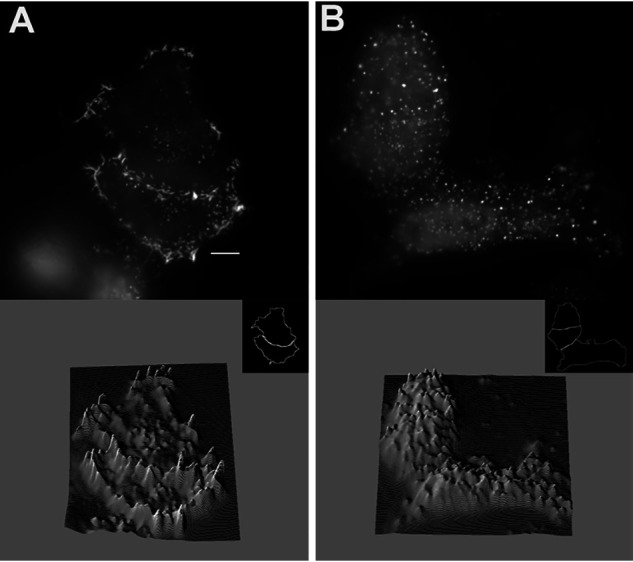
Response to variation in stress-inducing buffers in HeLa cells expressing Cof. A and B, WT-Cry2-mCh subjected to (A) 6 mm 2-Deoxy-d-glucose alone for 15 min at 37°C or (B) 6 mm 2-Deoxy-d-glucose/10 mm sodium azide for 15 min at 37°C. Bottom images depict 3D surface plots for each image (FIJI). Scale bar = 10 μm.
Having established that the cofilin-Cry2 fusions responded as expected to cofilin–actin bundle–forming conditions (i.e. ATP depletion), we investigated whether the fusions would respond to both cellular stress and light inputs in the presence of the Cry2-binding partner CIB. To test this, both N- and C-terminal cofilin-Cry2 fusion proteins and a β-actin–CIB-GFP protein fusion were co-expressed in HeLa cells. Cells were incubated in the presence of ATP-depletion medium for 15 min prior to imaging on a widefield fluorescent microscope. Of the various combinations of cofilin-Cry2 and actin-CIB, the N-terminal Cof/S3A/S120A and the C-terminal Cof/S3E exhibited robust light- and stress-dependent cofilin–actin fusion protein clustering that was reversible in the absence of blue light (Table 1). As the response of the Cry2-mCh-CofS3E fusion was somewhat more robust (Fig. 3 and Movie S1), this construct was carried forward in conjunction with the β-actin–CIB-GFP construct for the remaining studies.
Table 1.
Screening of optogenetic constructs in presence of light + ATP depletion: Survey of light-stimulated cofilin–actin cluster formation
Various N- and C-terminal cofilin mutant fusions to Cry2 were tested in the presence of β-actin–Cib-GFP and 10 mm azide/6 mm 2-Deoxy-d-glucose. Symbols: ++++, >90% with light-inducible clusters; +++, ≥ 60–90% form clusters; ++, 30–60% cells form clusters; +, ≤ 30% cells form clusters; —, no cluster formation detected; I, irreversible cluster formation in the absence of blue light; R, reversible cluster formation in the absence of blue light.
| Protein pair | DMEM/10% FBS | ATP-depletion media |
|---|---|---|
| N-terminal cofilins | ||
| Cof-WT-Cry2/ β-actin -Cib | No clusters | ++++; I |
| Cof-S3A/S120A-Cry2/ β-actin -Cib | No clusters | +++; R |
| Cof-S3E-Cry2/ β-actin -Cib | No clusters | ++; R |
| Cof-S3A/S120A-Cry2/Cib-ONLY | No clusters | — |
| C-terminal cofilins | ||
| Cry2-Cof-WT/ β-actin -Cib | No clusters | ++++; I |
| Cry2-Cof-S3A/S120A/β-actin-Cib | No clusters | +++; I |
| Cry2-Cof-S3E/β-actin-Cib | No clusters | ++++; R |
| No cofilin controls | ||
| Cry2-mCh/β-actin -Cib | No clusters | +; R |
| Cry2-mCh/Cib-ONLY | No clusters | — |
Figure 3.
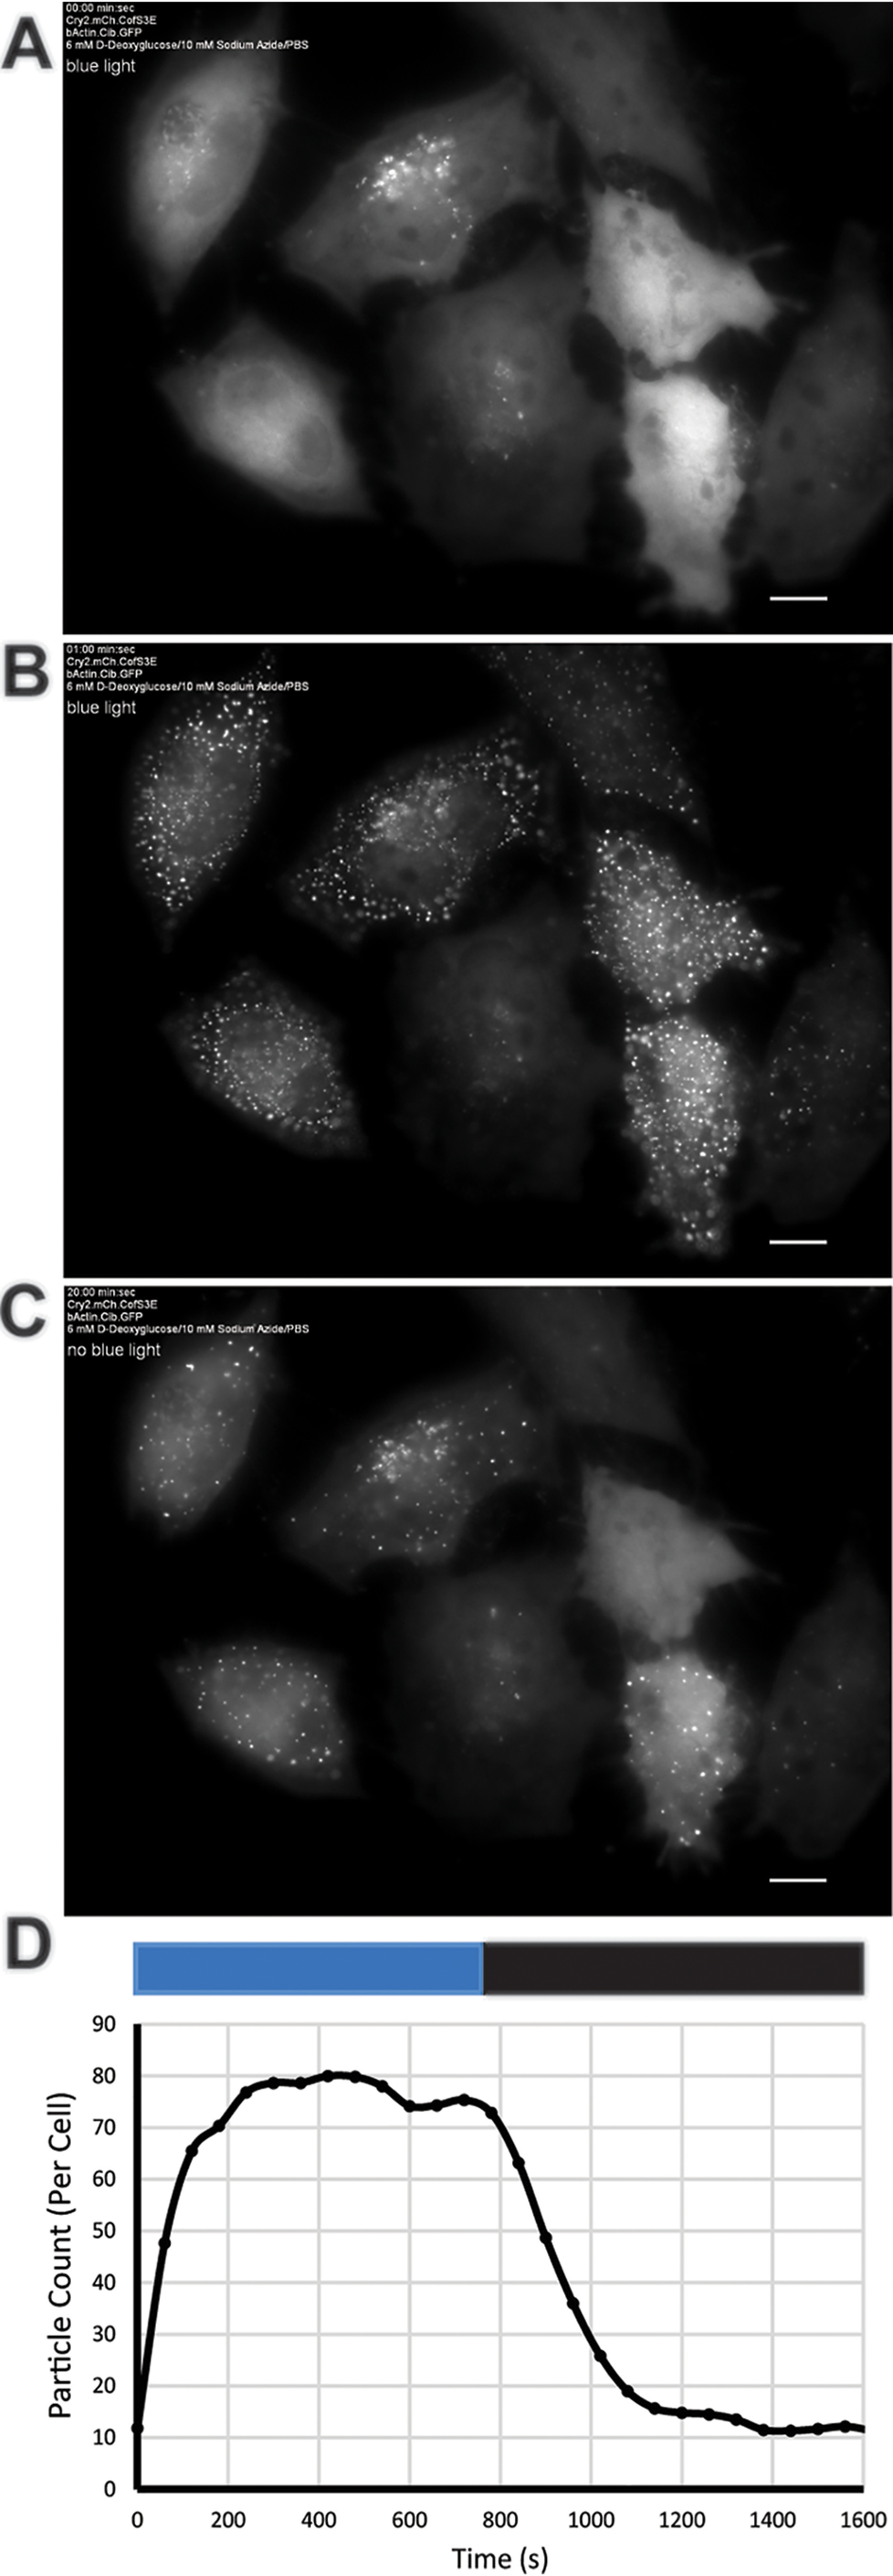
Demonstration of light-initiated clustering between cofilin- and actin-linked Cry2-CIB. Light-initiated cofilin–actin clusters in HeLa cells form in the presence of energetic stress. A, prior to 470 nm light pulse Cry2-mCh-CofS3E reagent is primarily cytosolic. B, rods/clusters are clearly visible 1 min post 10 ms light pulse. C, 20 min post pulse most of the rods have dissipated. D, line graph shows automated particle counting analysis (FIJI) of cluster formation time course in cells (n = 6) from Movie S1 (blue bar = 470 nm on; black bar = 470 nm off). Scale bars = 10 μm.
As the interaction of the WT cofilin construct with endogenous actin varied in response to changing cellular stress levels, the same treatments were applied to the optogenetic cofilin–actin bundling proteins (Fig. 4 and Movies S2–S5). In response to a full complement of azide, but no glycolysis inhibitor (10 mm azide/0 mm 2-DG), light-activated cofilin–actin bundles were formed throughout cell bodies but were shorter lived than those formed in the presence of 10 mm azide/6 mm 2-DG. In response to full inhibition of glycolysis, but no azide (0 mm azide/6 mm 2-DG), light-activated cofilin–actin bundles formed chiefly around the cell periphery but were also shorter lived than those under full ATP depletion conditions. We note that this is an analogous response to that observed with incorporation of WT cofilin into endogenous actin bundles (Fig. 2). Finally, although control cells (in the absence of ATP depletion) form sparse light + stress–induced clusters (Fig. 4B), weak light-activated localization between cytosolic Cry2-mCh-CofS3E and β-actin–CIB-GFP can still be observed in a subset of transfected cells (14.5% (10.7); n = 5 replicates (Fig. 5 and Movie S5).
Figure 4.

Light clustering behavior under variable stress conditions in HeLa cells. A, images shown are before, 10 min after, and an additional 10 min in the absence of blue light stimulation. Energetic stress conditions are indicated in the figure for each group of cells; conditions applied for 10 min prior to beginning of illumination sequence. B, counting of cofilin–actin clusters (ImageJ Particle Analysis) depicts time course of cluster formation in blue light (0–600 s) and dissipation in the absence of blue light (600–1200 s). Error bars represent S.E. from n = 3 replicate measurements. See also Movies S2–S5. C, quantification of ATP levels in CofActor-transfected HeLa cells treated with 10 mm sodium azide/6 mm 2-Deoxy-d-glucose. ANOVA p-value ≤ 0.0001; control versus treated ≤ 0.0001; control versus treated + light ≤ 0.0001; treated versus treated + light = 0.8671. Scale bars = 10 μm.
Figure 5.
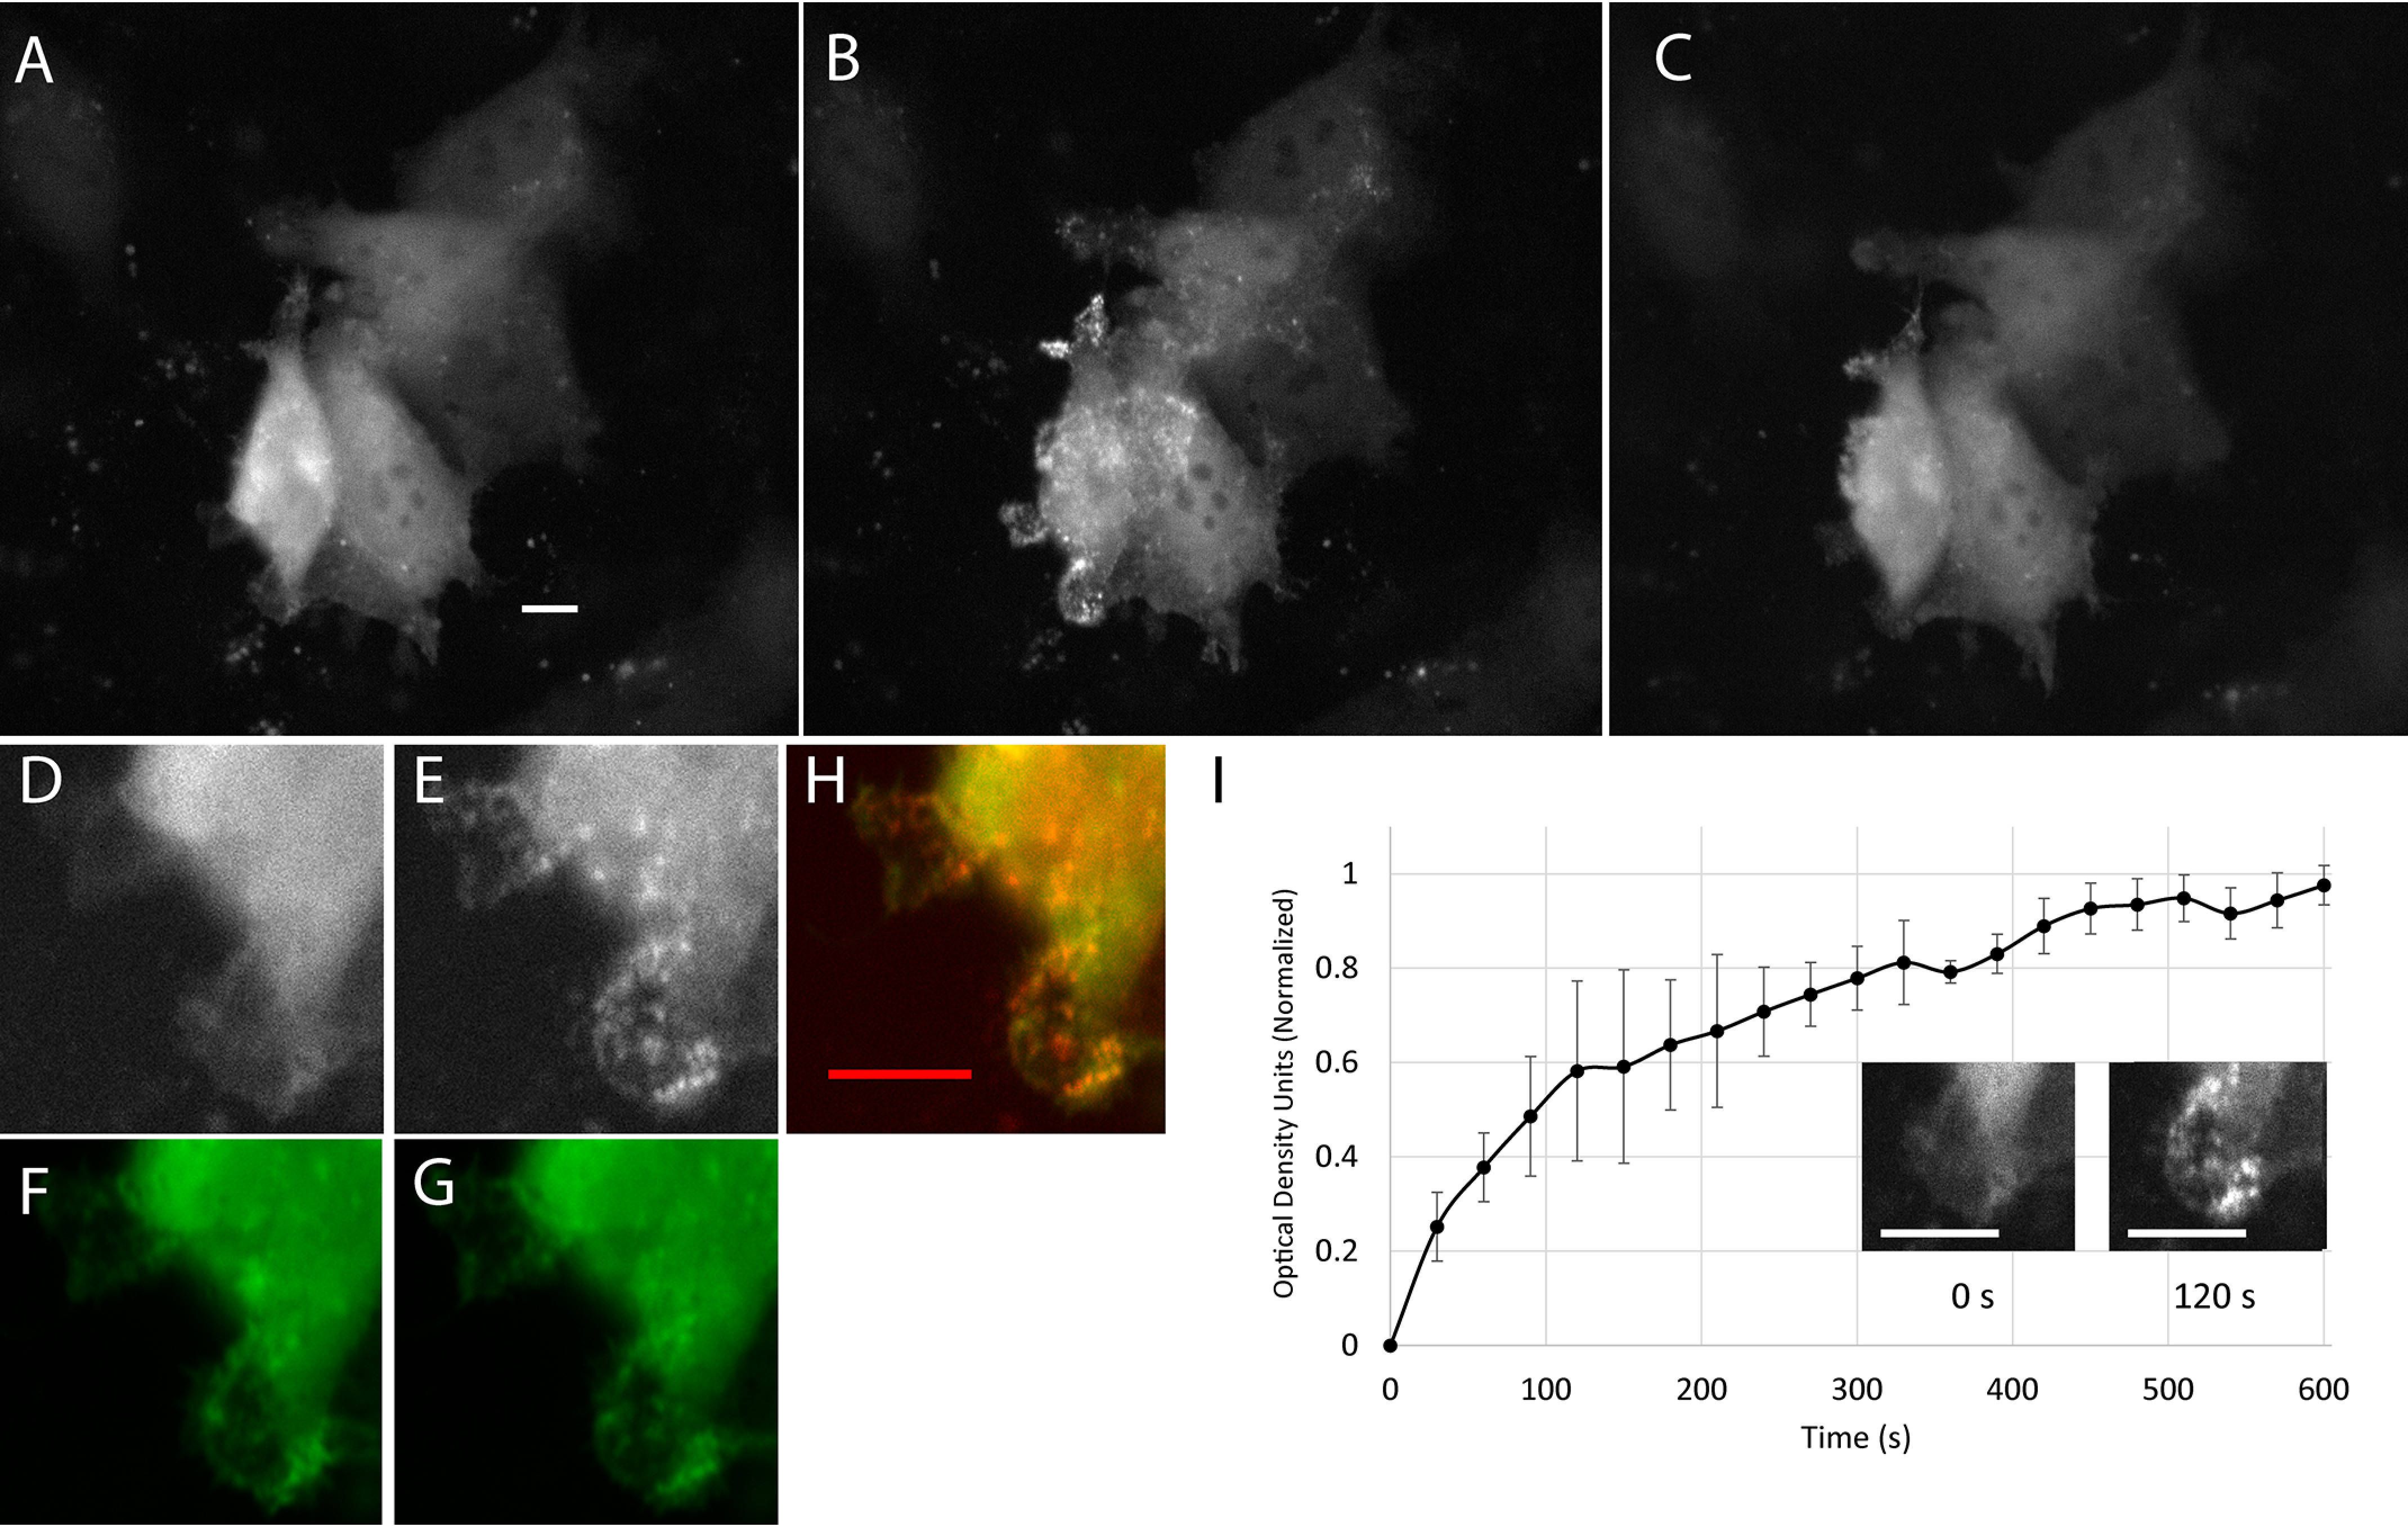
Stress-independent co-localization of Cry2-mCh-Cof.S3E and β-actin–CIB-GFP at the cell periphery. HeLa cells expressing Cry2-mCh-Cof.S3E/actin-CIB-GFP are shown. A–C, before blue-light stimulation (A), after 10 min of blue-light stimulation (B), and after an additional 10 min without blue light stimulation (C). D–G, zoomed region of cell from A shows cell periphery (D) mCherry and (F) GFP before and (E) mCherry and (G) GFP 2 min post light stimulation. H, co-localization of images shown in E and G. Scale bar = 10 μm. I, time course of co-localization of cropped region shows change in mCherry fluorescence intensity versus time at the cell periphery. Error bars (S.E.) are determined from three different peripheral regions. A, H, and I, scale bars = 10 μm.
The light- and cellular stress–dependent clustering of the cofilin and actin fusions indicated that site-directed mutagenesis of both cofilin and actin might provide insight into the mechanism of interaction between the two proteins. One of the primary driving forces of native cofilin–actin bundling is the switch from primarily ATP-actin to ADP-actin that occurs as a result of mitochondrial inhibition-induced depletion of ATP. Thus, we investigated whether alteration of the ATP-binding site of actin via site-directed mutagenesis might alter its ability to bind cofilin in the absence of ATP depletion by mimicking actin in its ADP-bound state. Inspection of a crystal structure of actin with a nonhydrolysable ATP mimic (PDB ID 1NWK (16)) revealed two potential contacts that might be critical for binding the tertiary phosphate group of ATP: Ser-14 (a predicted hydrogen bond contact) and Val-159 (potentially critical for maintaining binding cavity shape and hydrophobic packing) (Fig. 6). We proposed that removal of the Ser-14–phosphate hydrogen bond–forming ability might create an actin mutant with the properties of an ADP-actin, whereas increasing the steric bulk of the Val-159 residue might have a similar effect by occluding the binding site for the tertiary phosphate of ATP. In addition to the proposed actin mutants, we also considered whether further mutagenesis of cofilin could impact the function of the light-activated switch. Cofilin has four cysteine residues, two of which have previously been demonstrated to be critical for cofilin–actin rod stability via the formation of intermolecular disulfide bonds (Cys-39 and Cys-147; Fig. 6C) (14, 17, 18). Simultaneous mutation of cofilin cysteines 39 and 147 to alanine has been shown to interfere with efficient incorporation into cofilin–actin rods (14). We hypothesized that if cofilin–actin bundling with CofActor was similar to native cofilin–actin rod formation, then mutagenesis of cofilin Cys-39 and Cys-147 in CofActor should also interfere with switch function in the presence of cellular stress.
Figure 6.

Mutagenesis strategy for modifying switch response. A, crystal structure of monomeric β-actin bound to ATP analog (PDB ID 1NWK). B, a close up of the ATP binding pocket. The terminal phosphate of ATP is surrounded by a hydrophobic valine (Val-159) and hydrogen bound to a serine residue (Ser-14) and a calcium ion. Image rendered with PyMol. C, cofilin cysteines (Cys-39 and Cys-147, depicted as spheres color coded by element) responsible for intermolecular oxidation of cofilin (PDB ID 1Q8G). Images rendered in PyMol.
Single and double mutant actins and cofilins were generated and tested for their ability to participate in light- and stress-activated clustering when co-transfected with the corresponding Cry2-mCh-CofS3E or β-actin–CIB-GFP (Table 2). In the case of the V159I single mutant (β-actinV159I–CIB-GFP), light + cellular stress were both required for cofilin–actin cluster formation. However, the S14V mutant (β-actinS14V–CIB-GFP) gave a robust, reversible light-activated clustering response in the absence of ATP-depletion media (Fig. 7 and Movie S6). Notably, the S14V mutant formed rodlike bundles with dimensions similar to those observed with native cofilin–actin rods (avg. 2 rods per cell (± 1); length of 7.42 μm (± 0.68)). These structures are present prior to light-activated recruitment of Cry2, indicating that they are formed independently of optogenetic cofilin. Optogenetic cofilin undergoes light-activated recruitment to these rodlike structures in addition to forming cofilin–actin clusters analogous to those observed in the presence of nonmutant actin (Fig. 7A–F). Double mutants (S14V/V159L and S14V/V159I) exhibited a stress-independent response analogous to that of the S14V mutant, forming numerous light-independent rodlike structures present in cells (Fig. 7D). Interestingly, while the V159I single mutant (β-actinV159I–CIB-GFP) did not efficiently form stress-independent clusters as observed with the S14V mutant, it did exhibit enhanced nuclear localization and formed numerous nuclear-localized light-activated cofilin–actin clusters in the presence of cellular stress (Fig. 8 and Movie S7), indicating that the presence of a hydrophobic side chain at the 159 position may enhance nuclear import of the actin construct. In the case of the cofilin mutants (Fig. 9A–G), light- and stress-activation of cofilin–actin bundles were not significantly reduced in the C39A and C147A single mutants, but were highly diminished in the C39A/C147A double mutant, consistent with a previous report (14). Conversely, light + stress activation of bundle formation was eliminated in the C39D and C39D/C147D mutants, but not in the C147D mutant (Fig. 9G).
Table 2.
Summary of blue-light activation responses of actin and cofilin mutants under normal and energetic stress conditions
Summary of light-stimulated cofilin–actin cluster formation of actin and cofilin mutants in the presence of 10 mm azide/6 mm 2-Deoxy-d-glucose/PBS or PBS. Symbols: ++++, >90% with light inducible clusters; +++, 50–90% form clusters; +, <50% cells form clusters; —, no cluster formation detected (n = 6 cells analyzed per experimental condition).
| PBS | ATP depleted | |
|---|---|---|
| Actin mutants | ||
| V159I | — | ++++ |
| S14V | +++ | ++++ |
| V159L/ S14V | ++++ | ++++ |
| V159I/ S14V | ++++ | ++++ |
| Cofilin mutants | ||
| S3E/C39A | — | +++ |
| S3E/C147A | — | +++ |
| S3E/C39A/C147A | — | + |
| S3E/C39D | — | — |
| S3E/C147D | — | +++ |
| S3E/C39D/C147D | — | — |
Figure 7.

Rod formation with actin mutants in the absence of energetic stress. A and B, HeLa cells transfected with β-actin–S14V-CIB-GFP/Cry2-mCh-Cof.S3E protein pair (A) before (mCherry fluorescence shown) and (B) 5 min post (mCherry fluorescence shown) blue-light stimulation. C, β-actin–S14V-CIB-GFP construct at beginning of illumination sequence. D, % cells forming light inducible cofilin–actin rods and clusters in the absence of energetic stress Error bars are S.D. from (n = 5 replicate measurements per mutant; *, p < 0.001 versus WT control; one-way ANOVA, Holm-Sidak method). E and F, actin double mutant S14V/V159L-CIB-GFP/Cry2-mCh-Cof-S3E (E) before and (F) 10 min after blue-light illumination. All experiments were conducted under oxidant-free (PBS only) conditions. Scale bar = 10 μm. See also Movie S6.
Figure 8.

Light-inducible nuclear cofilin–actin cluster formation. A and B, HeLa cells expressing Cry2-mCh-Cof-S3E/actin-V159Ile-CIB-GFP in 10 mm azide/6 mm 2-DG/PBS are shown (A) pre- and (B) post 5 min of blue-light stimulation. C, nuclear-localized cofilin–actin clusters. Cry2-mCh-Cof.S3E (mCherry fluorescence). D, Actin-V159I-CIB-GFP (GFP fluorescence). E, overlay of mCherry and GFP channels. Scale bar = 10 μm. See also Movie S7.
Figure 9.

Mutation of cofilin Cys-39 and Cys-147 impairs actin-cofilin bundle formation. Cells are shown before and after 10 min of blue-light stimulation. A, HeLa cells expressing Cof-S3E-C39A/actin-CIB-GFP. B, HeLa cells expressing Cof-S3E-C147A/actin-CIB-GFP. C, HeLa cells expressing Cof-S3E-C39A-C147A/actin-CIB-GFP. D, HeLa cells expressing Cof-S3E-C39D/actin-CIB-GFP. E, HeLa cells expressing Cof-S3E-C147D/actin-CIB-GFP. F, HeLa cells expressing Cof-S3E-C39D-C147D/actin-CIB-GFP. G, quantification of A–F as % cells forming light inducible clusters. Error bars are S.D. from minimum six replicate measurements. *, p < 0.001 versus S3E control; one-way ANOVA, Holm-Sidak method. All scale bars = 10 μm.
Next, to demonstrate the potential utility of CofActor in neurons, we tested switch responsivity in primary hippocampal neuron cultures prepared from newborn mice. These cultures are routinely used as in vitro models to study cellular mechanisms of neurodegeneration (19). Prior to light stimulation, dissociated neuron cultures transfected with the CofActor system exhibited 8.14 (± 2.49) actin rods and 2.14 (± 0.55) cofilin rods in soma and 54.86 (± 16.17) actin rods and 25.14 (± 4.69) cofilin rods in neuronal processes (Fig. 10A–C). Upon stimulation with light in ATP-depletion medium, the number of rods significantly increased in both subcellular compartments (Fig. 10B). In the soma, the number of actin rods increased by 267% (21.71 ± 5.32; p = 0.018), whereas the number of cofilin rods increased by 327% (7 ± 2.02; p = 0.032). In neuronal processes, the number of actin rods increased by 168% (92.43 ± 15.7; p = 0.004), whereas the number of cofilin rods increased by 223% (56.14 ± 12.73; p = 0.039). Taken together, the data presented here show that the CofActor optogenetic sensor reports on conditions required for the formation of native actin–cofilin rods in cells exposed to ATP-depletion conditions and therefore is a promising tool to study the cellular mechanisms that lead to abnormal cytoskeletal reorganization and are associated with pathological conditions, including neurodegeneration and excitotoxicity.
Figure 10.
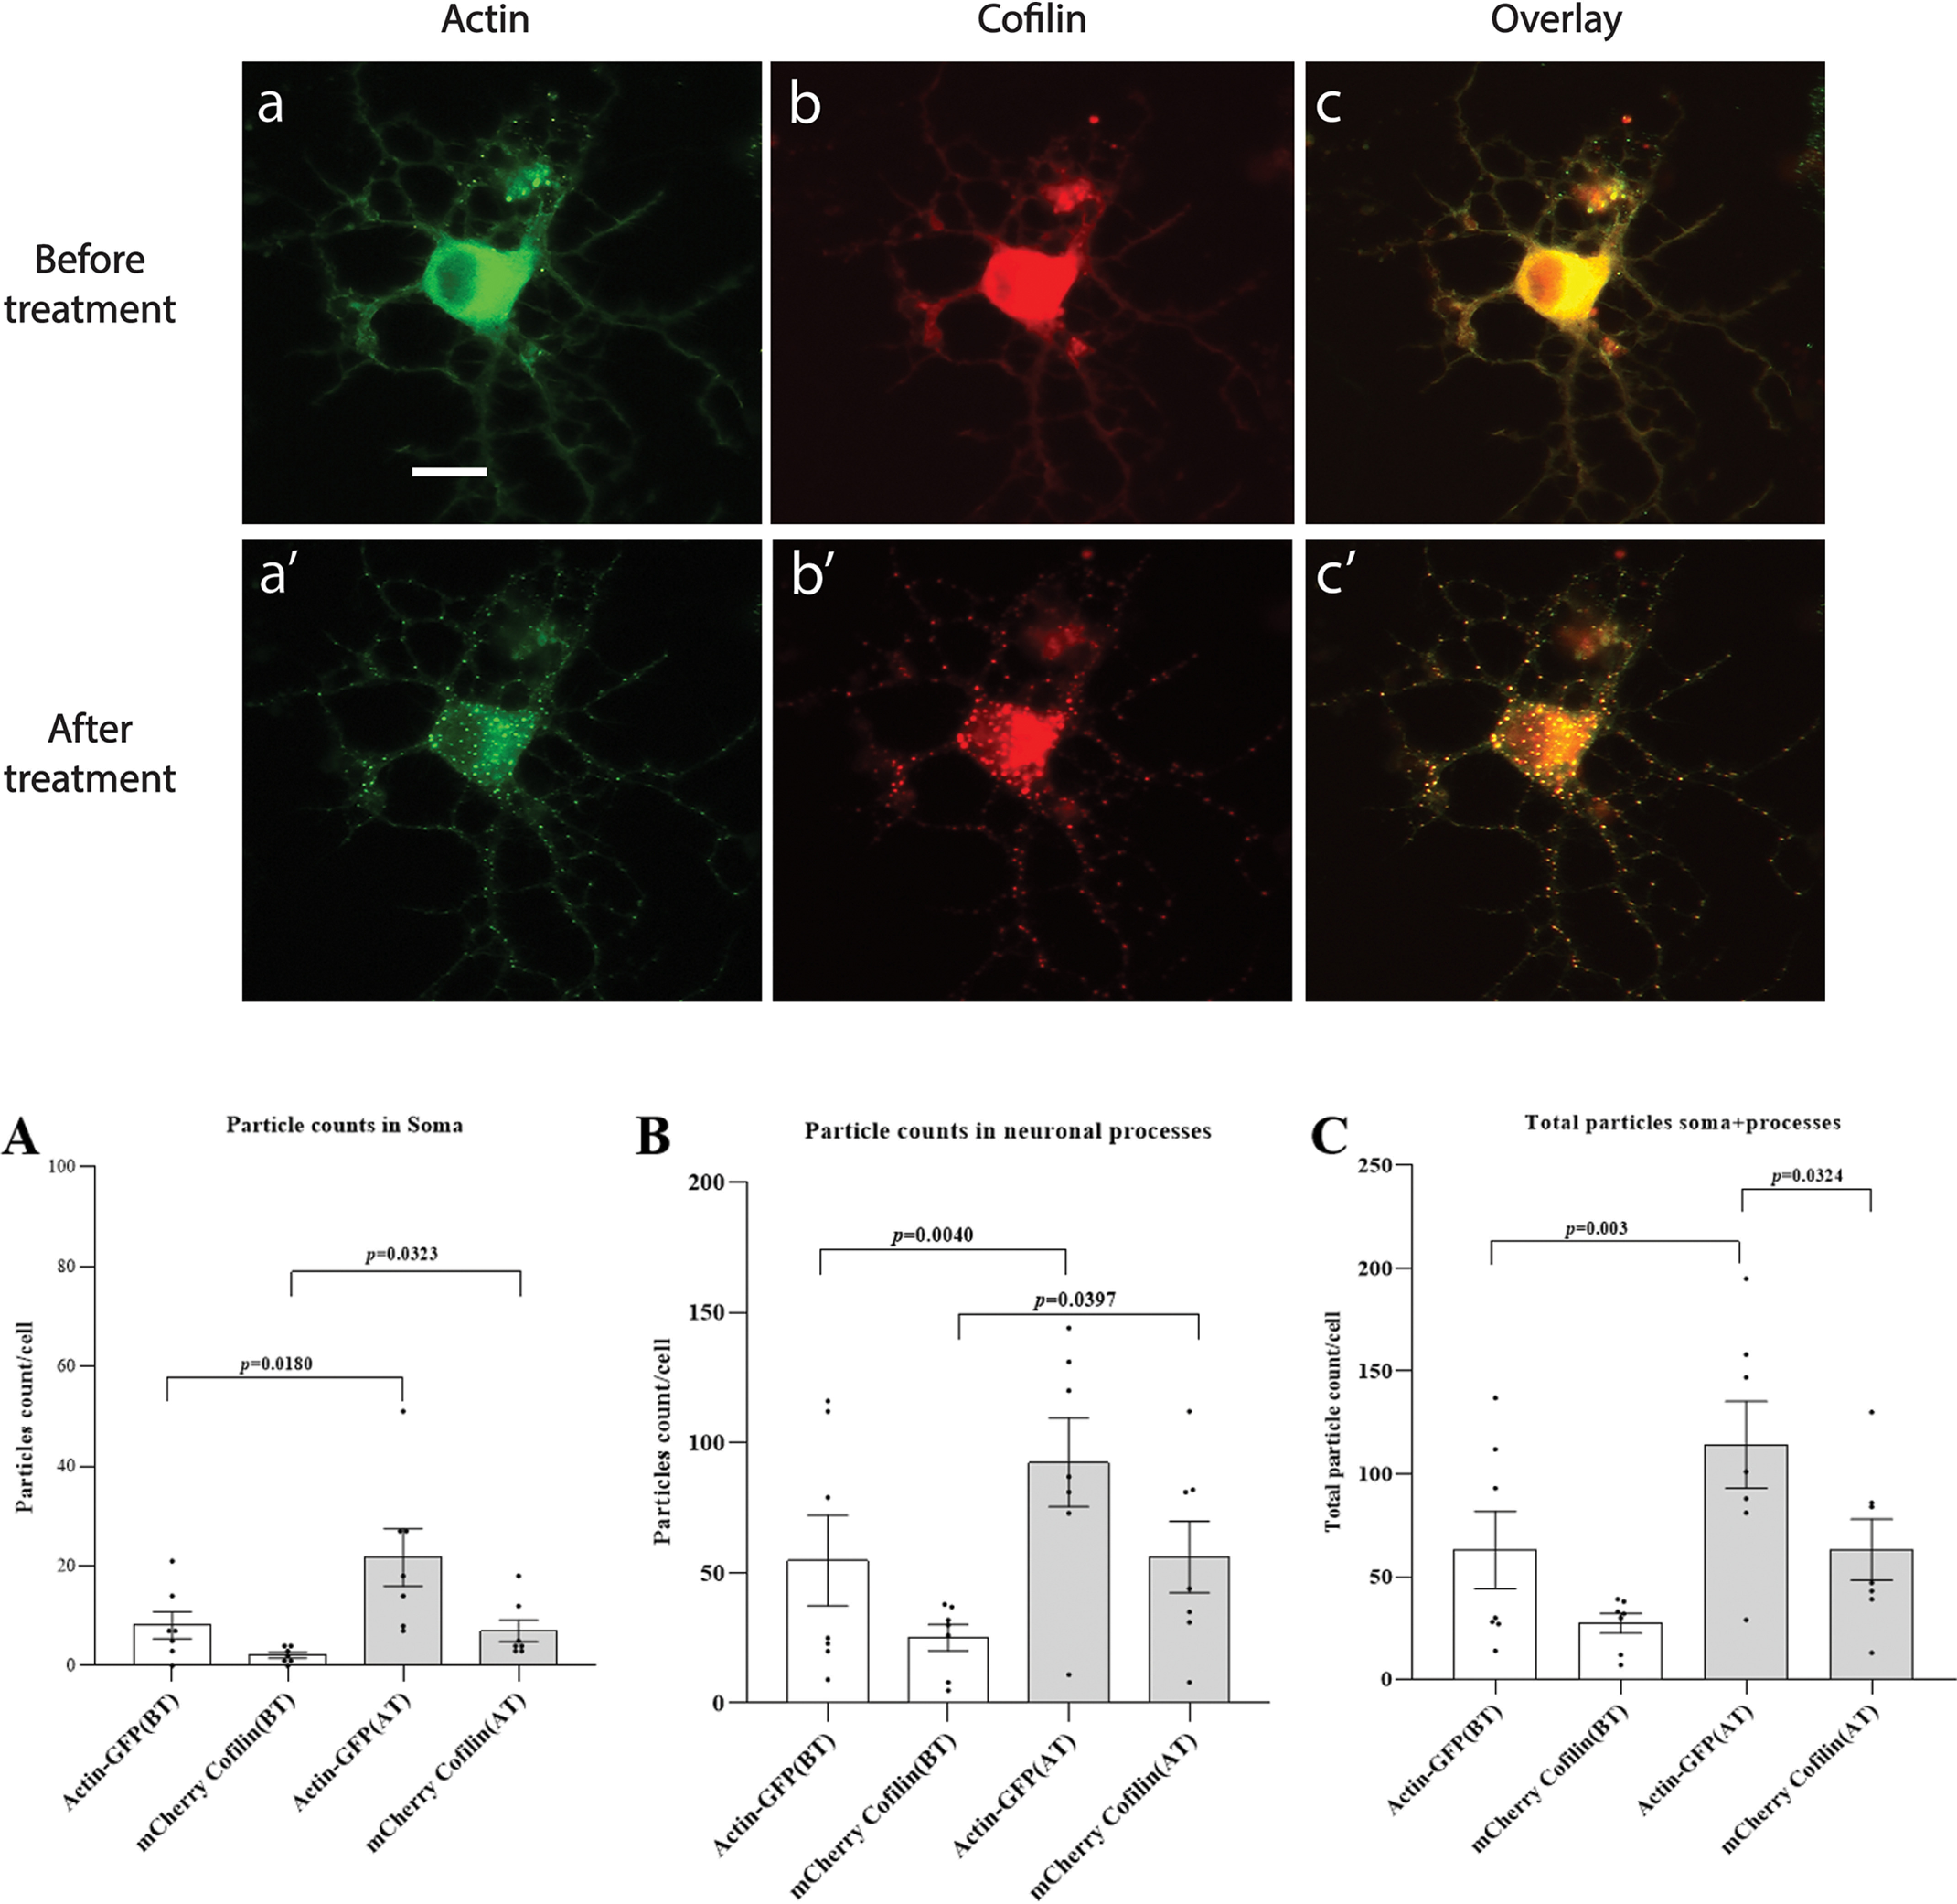
Validation of CofActor in primary hippocampal neuron cultures. A, representative micrographs of primary hippocampal neurons transfected with CofActor system, before (a, b, c) and after (a′, b′, c′) exposure to ATP depletion conditions and illumination sequence. B, number of actin and cofilin rods increases significantly in neurons transfected with the CofActor system upon ATP depletion and illumination with blue light both in soma (A) and in neuronal processes (B). C, graph shows the overall increase in rod formation in neurons. Data are average of seven neurons from two independent cultures. Error bars are mean ± S.E. Scale bar = 20 μm.
Finally, we investigated whether CofActor would respond to alternate sources of cellular stress (ROS-generating H2O2), and whether that response could be inhibited with a recently reported inhibitor of cofilin–actin rod formation in neurons (20). In HeLa cells treated with 500 μm H2O2, we observed a light-induced CofActor response analogous to that observed with ATP-depleted cells (Fig. 11 and Movie S8). The CofActor response was somewhat less robust in H2O2 than in azide/2-DG, consistent with previous observations of endogenous cofilin–actin rod induction (21). H2O2-activated CofActor was also inhibited in the presence of NOX inhibitor VAS2870, consistent with the involvement of NOX in the ROS-activated cofilin slingshot phosphatase pathway (3). We also sought to demonstrate potential applications of the CofActor system. In particular, this could be in the form of an “optical two-hybrid” assay, in which light-induced clustering is used to identify other proteins interacting with cofilin–actin rods. This could be accomplished by either live-cell imaging or immunofluorescence. As a proof of principle experiment, transfected HeLa cells with a GFP-free iteration of the CofActor system (Cry2-mCh-CofS3E/actin-CIB-STOP) and a GFP-actin construct, and using live cell imaging, whether the Actin-GFP construct would be incorporated into the light-activated CofActor clusters under either energetic or oxidative stress conditions was investigated (Fig. 12 and Movies S9 and S10). In these experiments, we were able to observe GFP-actin induction into CofActor clusters beginning around 10 min after light induction. We also performed an experiment in which we probed for the association of Cdc42 with light-induced CofActor clusters. Cdc42, a small GTPase regulator of actin dynamics, has previously been demonstrated to play a role in the formation of Aβ-induced rods (21). We asked whether endogenous Cdc42 might be associated with light-induced clusters. Consequently, we were able to observe Cdc42 localized with CofActor-induced clusters in HeLa cells (Fig. 13). N-WASP–mediated association of Cdc42 with the actin remodeling Arp2/3 complex is a likely culprit in its co-localization with the CofActor clusters (22).
Figure 11.

CofActor response in H2O2 and in presence of a NOX inhibitor. A, light activation of CofActor in HeLa cells under oxidative stress conditions (H2O2) and mitochondrial inhibition conditions (azide/2-DG), with or without NOX inhibitor VAS2870. B, quantification of % light-induced cluster forming cells over a 10-min time course. Data are from n = 8 replicates per condition. Error bars represent the S.D.; scale bar = 10 μm. *, p < 0.001 for all pairwise comparisons.
Figure 12.
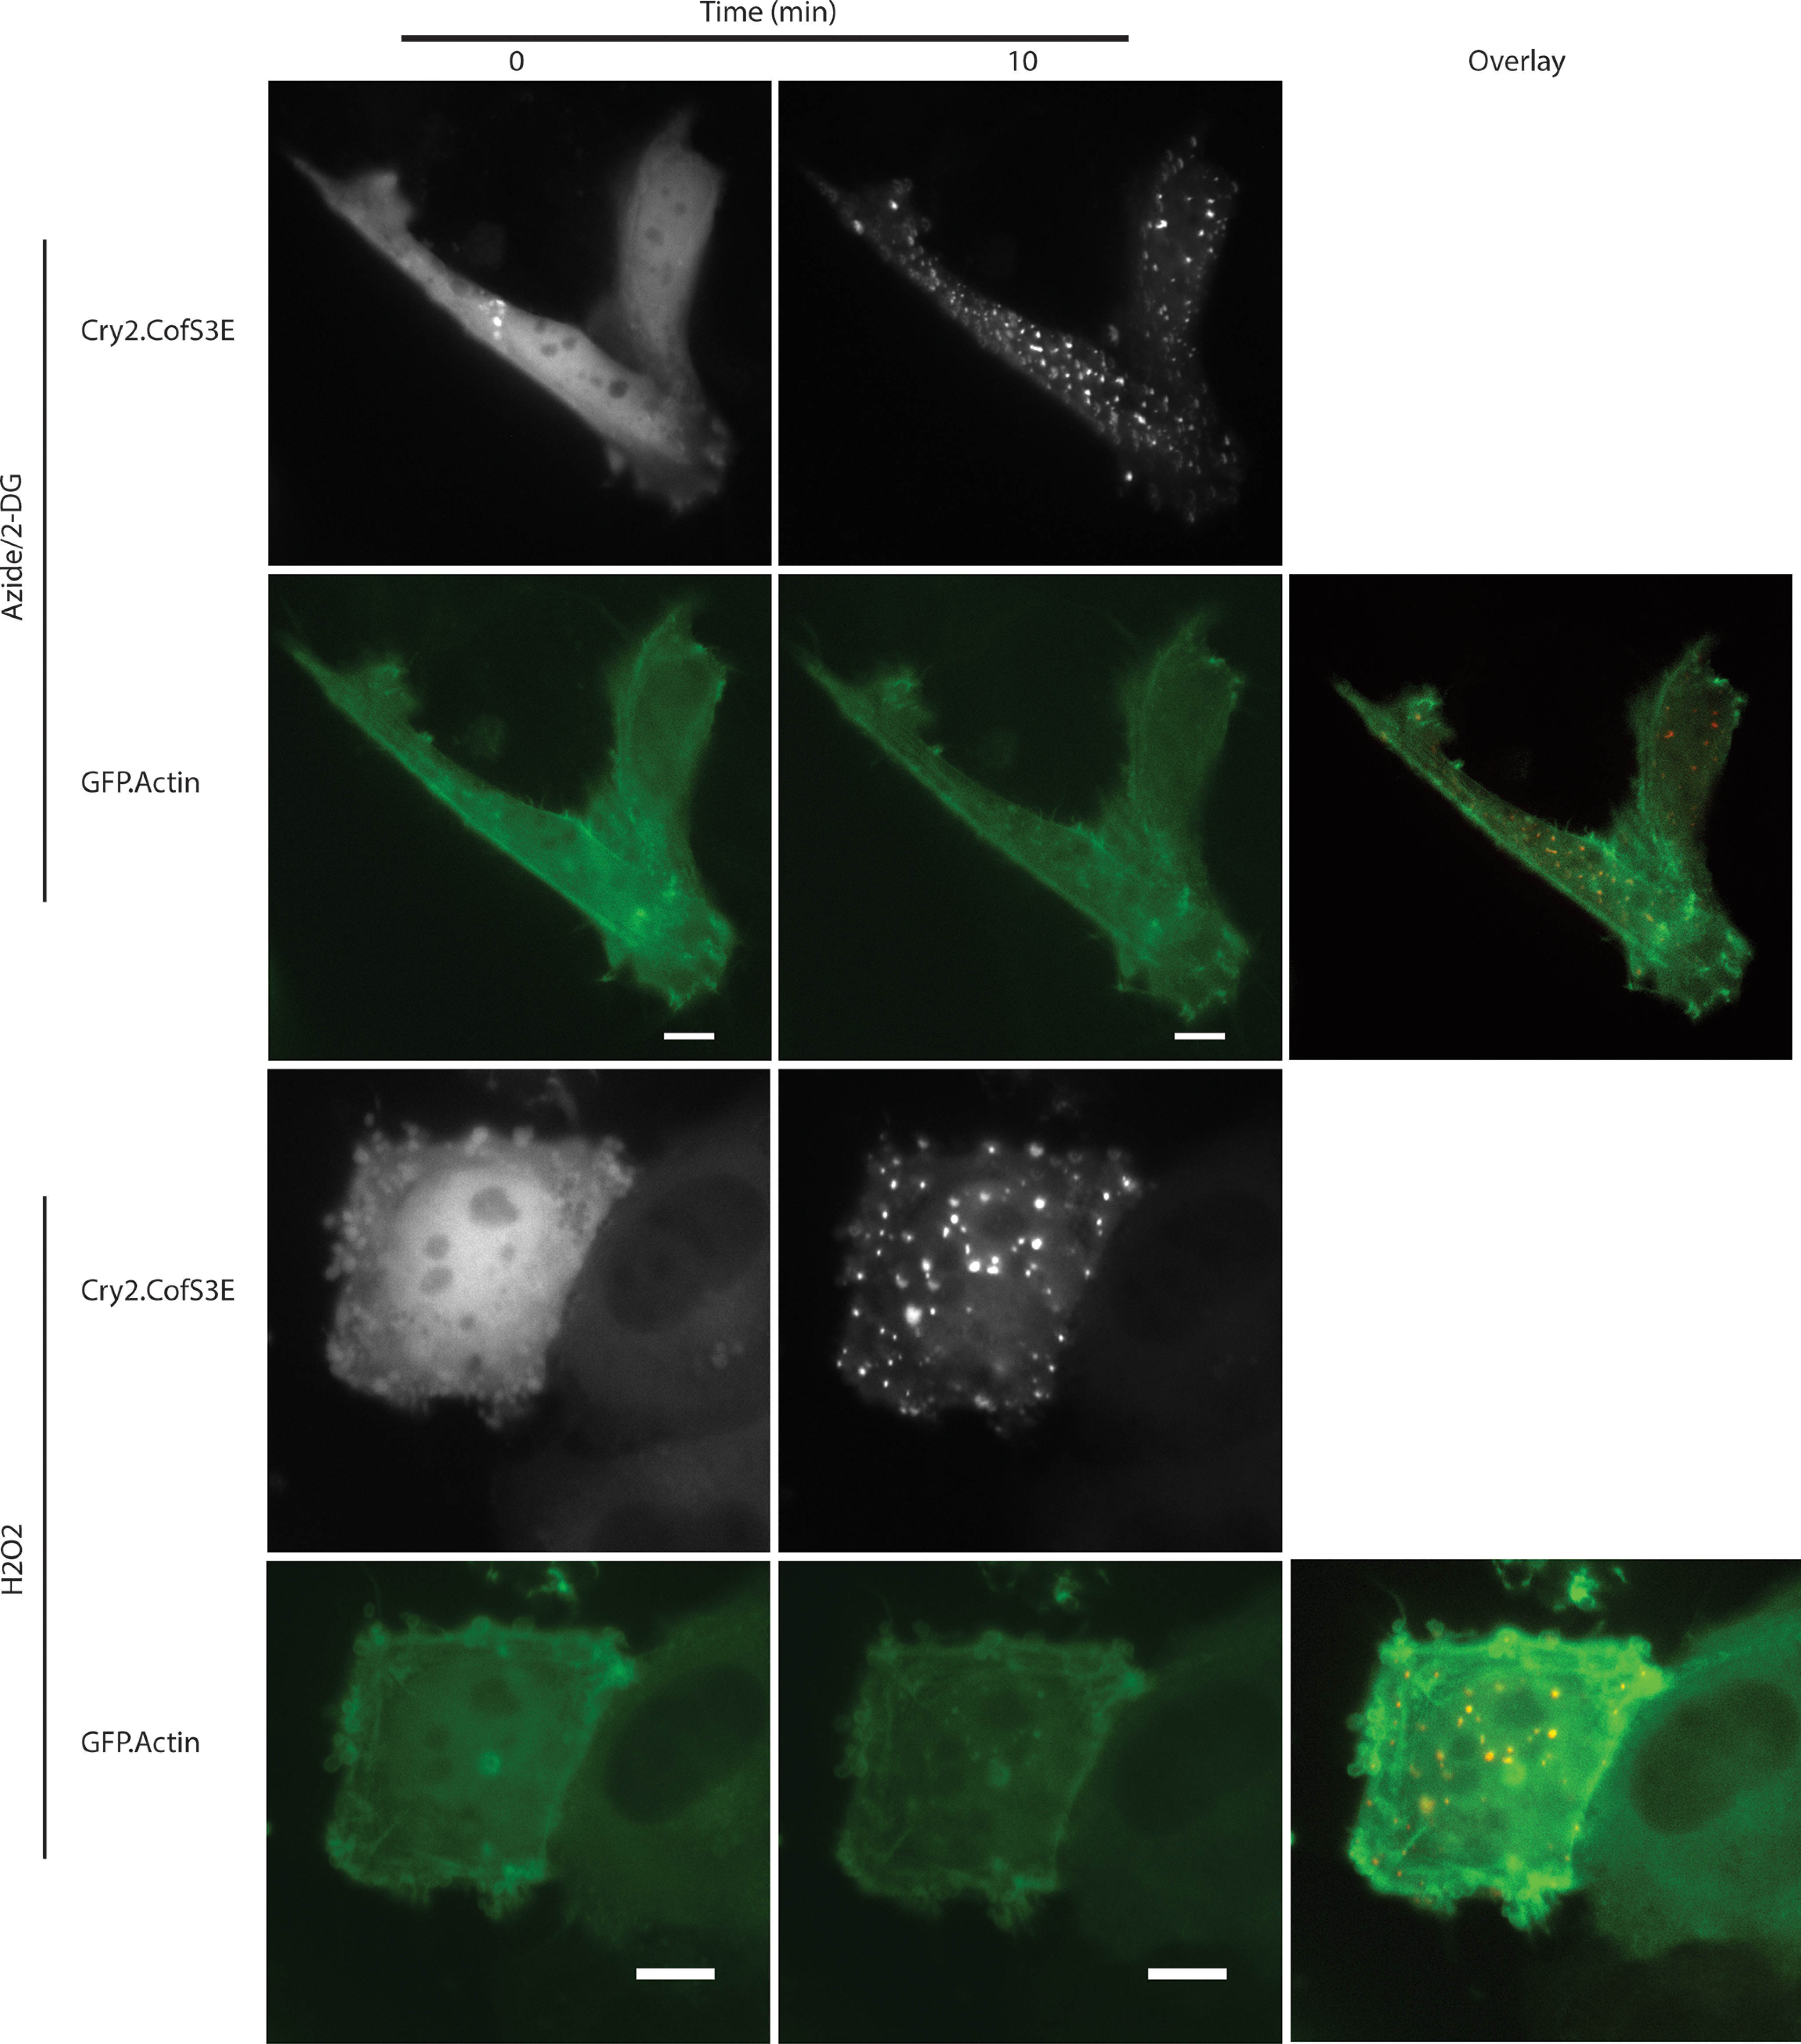
Inclusion of GFP-Actin in light- + stress-induced CofActor clusters. Light activation of CofActor in HeLa cells under mitochondrial inhibition conditions (azide/2-DG) and oxidative stress conditions (H2O2) in the presence of a GFP-tagged actin. Overlays of GFP and mCherry channels are shown in third column. Scale bar = 10 μm. See also Movies S9 and S10.
Figure 13.
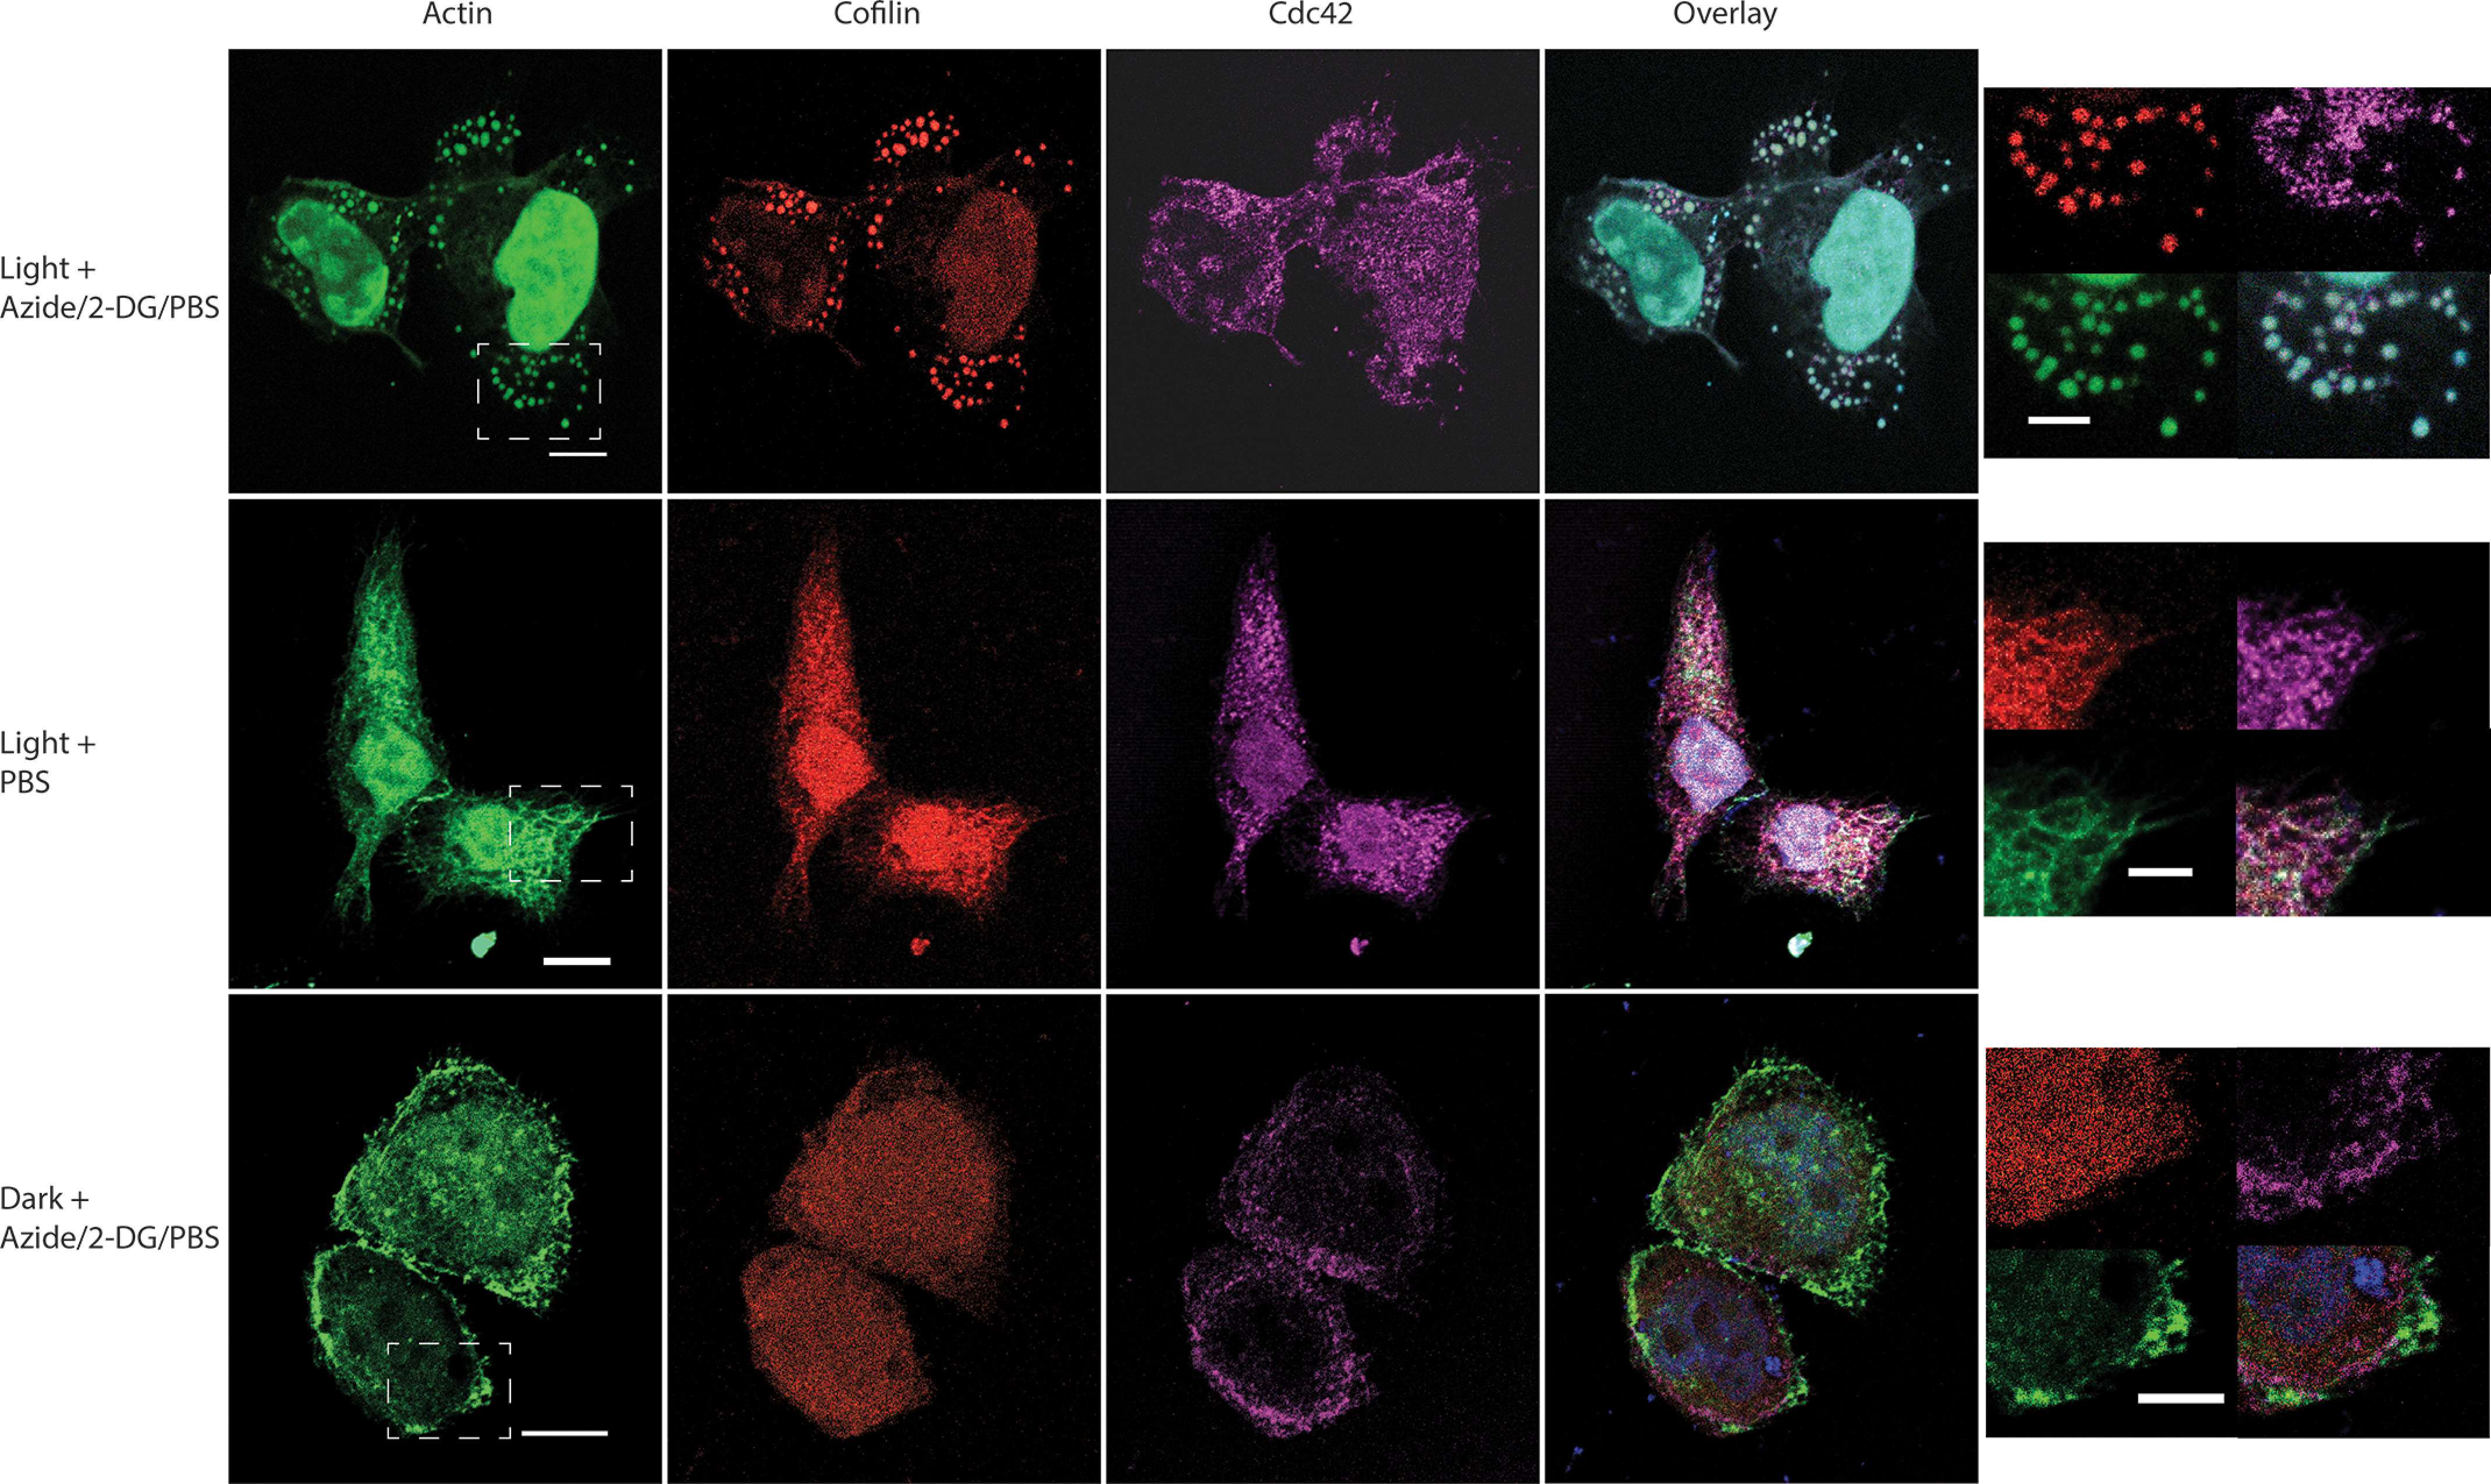
Immunostain for association of CDC42 with light- + stress-induced CofActor clusters. Light activation of CofActor in HeLa cells under mitochondrial inhibition conditions (azide/2-DG, top row), light activation in the absence of stress (PBS, middle row), and cellular stress in the absence of light (bottom row). Panels shown (left to right) are GFP (actin-Cib-GFP plus DAPI), mCherry (Cry2-mCh-Cof.S3E), Alexa Fluor 647 (anti-mouse secondary for CDC42 primary antibody), overlay of all channels, and a zoomed region (dashed line from GFP image) for each condition. Scale bars (left column) = 10 μm; scale bars (zoomed regions) = 5 μm.
Discussion
Cytoskeletal dysregulation is a prominent feature of numerous diseases, including cancer, stroke, and neurodegenerative disorders (1, 23, 24). Whether prominent cytoskeletal features are progenitors or merely symptoms of disease progression remains open for debate (25). As a result, biosensors and bioactuators that recapitulate the anomalous cytoskeletal responses to disease are valuable for contextualizing their role(s) in disease pathology. In this work, a known, disease-relevant protein–protein interaction (cofilin–actin) has been coupled with an optogenetic oligomerizer (Cry2-CIB), to better understand the factors governing their interaction (CofActor). Where previous studies have developed mutants of cofilin that resist incorporation into cofilin–actin rods under normal physiological conditions (13), these mutants resist incorporation until activated with a pulse of blue light. This is advantageous for cellular studies, as cells can be more precisely treated with stress stimuli, and the cytoskeletal events are precisely triggered following application of the stimuli. Furthermore, the two-component nature of the Cry2-CIB system enables testing of both cofilin and actin mutants in parallel, whereas a cofilin-only or actin-only system only allows testing with endogenous actin or cofilin. The S14V actin mutant, which eliminates the need for ATP-depletion medium, likely operates by shifting actin into either an ADP-bound state or promotes an actin structure similar to the ADP-bound state. This is supported by the numerous rodlike actin substructures that form from the actinS14V-CIB-GFP construct which are similar to cofilin–actin rods formed in vivo. Perhaps significantly, these rodlike actin structures are present prior to CofActor activation with blue light. These preassembled rods may incorporate significant amounts of endogenous cofilin, whereas the absence of endogenous cofilin in these rods would indicate an actin-nucleated mechanism for rod formation that is independent of cofilin. Whether rods can form in vivo in a cofilin-independent fashion is unknown and invites further inquiry. Although the S14V single and double actin mutants exhibit robust light activated clustering in stressor-free medium, they also function in the presence of ATP-depletion buffer, making them potentially useful stress-independent light-activated tools that function under various experimental conditions (Table 2). We expect that the mutagenesis of other critical contacts between ATP and actin may also generate interesting stress-independent behaviors when incorporated into the CofActor system. Alternately, site directed mutagenesis of cysteine residues in cofilin, guided by previously reported studies (14, 15), resulted in Cry2PHR-mCh-cofilin fusions with impaired light-activated cluster formation. We were skeptical whether cysteine mutagenesis would produce a significant effect, given that Cry2PHR-mCh-CofS3E readily formed light-induced clusters with the actinS14V mutant under stress-free conditions. Nonetheless, the C147A/C39A cofilin double mutant significantly reduced the light-induced clustering behavior in the presence of ATP-depletion medium. The effect is notably more pronounced with Cys to Asp than with Cys to Ala mutations. In particular, the C39D mutation is sufficient for eliminating light-activated clustering altogether under energetic stress. This effect may result from electrostatic repulsion between the Asp side chain and the actin-binding interface when brought into close proximity with actin, as has been proposed elsewhere (15). Alternately, the Cys to Ala mutants can compensate somewhat for the loss of the native disulfide bond capability through nonspecific hydrophobic interactions with the binding interface and are thus less deleterious to cofilin–actin cluster formation.
Finally, the ability to activate the CofActor system with different stimuli indicates utility as a general tool for studying stress-induced cytoskeletal dysregulation. Inhibiting the CofActor response as a probe of biochemical pathways or as a screen for therapeutic molecules is one means of identifying potent regulators of pathways impacted by cellular stress. Several possible applications are currently under investigation for CofActor. For example, the CofActor switch could form the basis of a Boolean AND gate for induction of protein–protein interactions, where both light and cellular stress inputs would be required for clustering. CofActor can also be used as an optical two-hybrid assay for actin- or cofilin-binding protein interactions, with cluster formation as a readout of protein–protein interaction propensity rather than transcription of a reporter gene. As a probe of biochemical pathways, this approach has value in teasing apart the various secondary proteins responsible for assembly and disassembly of cofilin–actin rods. We anticipate that the capability to produce cofilin–actin bundles with photostimulation could be a useful tool in the field of neuroscience to study the effects of abnormal cytoskeletal rearrangement associated with synaptic dysfunctions and behavioral deficits in neurological disease model organisms.
Materials and methods
Plasmids and cloning
Cloning of Cof-Cry2PHR-mCh and Cry2PHR-mCh-Cof constructs has been reported previously (6). Cloning of the β-actin–CIB-GFP construct was conducted according to previously reported methods (27). Briefly, genes encoding β-actin and CIB were PCR amplified with overlapping primer sequences. Gene fragments were gel isolated, then stitched together via splice overlap extension PCR. The resulting gene fragment was trimmed via restriction digest, followed by ligation into complementary restriction sites in the target plasmid. Point mutations were introduced into actin in a pNic28 plasmid, followed by subcloning into the CIB-GFP mammalian expression plasmid (phCMV-GFP; Genlantis). Cofilin mutants were synthesized by Integrated DNA Technologies (Coralville, IA), PCR amplified, and subcloned into the Cry2-mCh mammalian expression plasmids (mCherry-N1 (Clontech)) via restriction digest and ligation. The actin encoding gene (pCAG-mGFP-actin; Addgene no. 21948) construct was a generous gift from Ryohei Yasuda (28).
Cell lines and transfection
Midi prep quantities of DNA of each construct were created from Escherichia coli and collected for cell transfection. Transfection of HeLa cells was then performed with the Lipofectamine 3000 reagent (Invitrogen) following manufacturer's suggested protocols. Briefly, for dual transfections in 35 mm glass-bottom dishes, plasmid DNA was combined in a 1:1 ratio (1250 ng per plasmid for dual transfections; 1000 ng per plasmid for triple transfections) in 125 μl of Opti-MEM, followed by the addition of 5 μl of P3000 reagent. For single transfections in 35-mm glass-bottom dishes, 2500 ng of plasmid DNA was used per transfection. In a separate vial, 3.75 μl of Lipofectamine 3000 were added to 125 μl of Opti-MEM. The two 125-μl solutions were combined and allowed to incubate at room temperature for 10 min, followed by dropwise addition to cell culture. Transfection solutions were allowed to remain on cells overnight. Cells were maintained at 37°C and 5% CO2 in a humidified tissue culture incubator, in culture medium consisting of DMEM supplemented with 10% FBS and 1% penicillin-streptomycin.
Fixed cell experiments
Transfected HeLa cells were washed with Dulbecco's PBS (with calcium and magnesium; 3 × 1 ml) prior to treatment with ATP-depletion medium (6 mm 2-Deoxy-d-glucose and 10 mm sodium azide in Dulbecco's PBS) for the indicated time intervals. ATP-depletion medium was removed by aspiration, cells washed gently (1× with 1 ml Dulbecco's PBS), then fixed for 45 min with prewarmed 4% paraformaldehyde solution (37°C) prepared from 16% paraformaldehyde (Electron Microscopy Sciences and Dulbecco's PBS) at room temperature for 45 min. Following fixation, cells were washed with PBS, then permeabilized for 3 min using prechilled methanol (−20°C). Methanol was removed by aspiration, then cells were blocked for 30 min with antibody dilution buffer (30 µl Triton X-100, 0.1 g of BSA, 10 ml of Dulbecco's PBS). Cells then were incubated overnight at 4°C with primary antibody (anti-actin, Santa Cruz, no. sc-8432; 1:500 in antibody dilution buffer). The following day, primary antibody solution was removed by pipette, and cells were washed three times with Dulbecco's PBS. Cells were incubated with Alexa Fluor 488 conjugated goat anti-mouse secondary (Invitrogen; 1:200 in antibody dilution buffer) for 1 h at room temperature, followed by a Dulbecco's PBS wash (1 ml; 3 × 5 min). Cells were stored in Dulbecco's PBS prior to imaging.
Live cell experiments with NOX inhibitor
Transfected HeLa cells were washed with Dulbecco's PBS (with calcium and magnesium; 1 × 1 ml), prior to treatment with ATP-depletion medium (6 mm 2-Deoxy-d-glucose and 10 mm sodium azide in PBS) or ROS-inducing medium (500 μm H2O2 in PBS). Experiments with the NOX inhibitor VAS2870 were conducted by preincubating cells for 30 min in the presence of 5 μm VAS2870 or a vehicle only (DMSO) control. The inhibitor was also maintained at 5 μm in the cellular stress media added just prior to the experiment. All cells were equilibrated in the live cell incubation system (OKOLab) for 10 min prior to beginning the illumination sequence.
Measurement of ATP depletion
HeLa cells (control group, ATP depletion group, and ATP depletion + light group) were each plated on 35-mm plates (n = 6 per condition). 2 days after plating cells were checked for confluency (70–80%) and transfections were performed. The following day the cells were inspected to ensure transfection occurred. Once transfection was observed, the culture media were removed from the 35-mm dishes. The control group received 1 ml per dish of Dulbecco's PBS for 30 min whereas the other two treatment groups were treated with 1 ml per dish of ATP depletion medium (6 mm 2-Deoxy-d-glucose and 10 mm sodium azide in Dulbecco's PBS) for the same duration. For the final 10 min the ATP depletion + light group were exposed to a blue LED light. Once the 30 min were complete, the media in each dish were immediately removed by aspiration. Triplicates of each dish were then measured for ATP levels using a Luminescence ATP Detection Assay Kit (Abcam) according to manufacturer's instructions. Luminescence was detected using a multimode microplate reader (SpectraMax, Promega).
Cdc42 immunostaining
HeLa cells were cultured on poly-d-lysine–coated glass coverslips and transfected at 60% confluency and treated with ATP-depletion medium as described above. Cells were then fixed for 15 min with 4% paraformaldehyde at room temperature and for 10 min with absolute methanol (prechilled at −20°C). Cultures were permeabilized with 1% PBS-T (1% Triton X-100 in 1× PBS) for 20 min, then blocked for 2 h at room temperature in blocking medium containing 10% normal goat serum, 5% BSA in 0.1% PBS-T (0.1% Triton X-100 in 1× PBS). Cells were then incubated overnight at 4 °C with primary antibody against CDC-42 (Santa Cruz Biotechnology, sc-8401; 1:100 diluted in blocking medium). After three washes with PBS-T, cells were incubated at room temperature for 2 h with Alexa Fluor 647 conjugated goat anti-mouse secondary antibody (Life Technologies; 1:200 diluted in blocking medium). Following three washes with 0.1% PBS-T, immunostained coverslips were mounted on Superfrost slides using ProLong Gold Antifade mounting medium (Invitrogen).
Imaging
Confocal Microscopy—Confocal images of fixed cells were obtained with Olympus IX2-DSU tandem spinning disk confocal laser scanning microscope or with a Zeiss LSM 880 microscope with Airyscan technology. Fluorescence images were colorized and overlaid using FIJI software.
Widefield Microscopy—A Leica DMi8 Live Cell Imaging System, equipped with an OKOLab stage-top live cell incubation system, LASX software, Leica HCX PL APO 63×/1.40–0.60 numerical aperture oil objective, Lumencor LED light engine, CTRadvanced+ power supply, and a Leica DFC900 GT camera were used to acquire images. Exposure times were set at 150 ms (GFP, 470 nm) and 300 ms (mCherry, 550 nm), with LED light sources at 50% power, and images acquired every 30 s over a 20-min time course.
Primary neuron culture preparation, transfection, and treatment
Dissociated hippocampal neuron cultures were prepared as described previously (29). Briefly, hippocampi from newborn B6 mice were used to prepare dissociated postnatal neuron cultures. Cells were plated into 35 mm glass bottom Petri dishes with growth medium consisting of β-mercaptoethanol supplemented with 10% BCS and antibiotics. 24 h after plating, the culture medium was changed to Neurobasal A medium, supplemented with B27-plus reagent (Invitrogen). Neurons were transfected with the CofActor optogenetic system (6 µg plasmid/plate) on day in vitro 3–5 using Lipofectamine 2000 (Invitrogen). 48 h post transfection, culture medium was removed, and neurons were placed in ATP-depletion medium (6 mm 2-Deoxy-d-glucose and 10 mm sodium azide in PBS). Cultures were returned to tissue culture incubator (37°C; 5% CO2) and allowed to equilibrate for 10 min prior to starting the illumination sequence. Live cell imaging of neurons was performed before and after illumination, using a Keyence (BZ × 800) all-in-one fluorescence microscope.
Particle counting
Analysis of imaging data was performed in FIJI equipped with the BioFormats package (30, 31). Particle counting was performed using the Analyze Particles feature. Particle size was restricted from 20 to 200 pixels and circularity restricted from 0.2 to 1.00. Particle counts are reported as average number of particles counted per cell.
Western blotting
HeLa cells were lysed post transfection with 200 μl of M-PER lysis buffer (Thermo Scientific) with protease inhibitors. After 10 min on a rotary shaker at room temperature, lysates were collected and centrifuged for 15 min (94 rcf; 4°C). The supernatants were used for further experiments. The resulting lysates were subjected to electrophoresis on a 10% SDS-PAGE gel and then transferred onto PVDF membranes (20 V, overnight, at 4°C). Membranes were then blocked for 1 h with 5% BSA in Tris-buffered saline with 1% Tween (TBST), followed by incubation with primary antibody (anti-mCherry antibody; Cell Signaling Technology, no. 43590); 1:1000 dilution in 5% BSA–TBST; anti-GFP antibody (Santa Cruz Biotechnology, no. sc-8334); 1:1000 dilution in 5% BSA–TBST) overnight at 4°C on a platform rocker. The membranes were then washed 3 × 5 min each with TBST and incubated with the appropriate secondary antibody in 5% BSA–TBST for 2 h at room temperature. After washing 3 × 5 min with TBST, the membranes were exposed to a chemiluminescent substrate for 5 min and imaged using an Azure cSeries imaging station.
Statistical analyses
Statistical significance (p values; Figs. 7, 9, and 11) were determined using a one-way ANOVA (Holm-Sidak method) in SigmaPlot v. 13.0 (Systat Software, Inc.) (26). A paired t test was performed to analyze particle count data (Fig. 10) and expressed as mean ± S.E. Plots were constructed using GraphPad Prism version 8.2.1 for Windows, GraphPad Software, San Diego, California, USA.
Data availability
All data are contained within the manuscript and the supporting information. Plasmids generated for this publication are available through Addgene, Inc., a not-for-profit plasmid DNA repository.
Supplementary Material
Acknowledgments
R. M. H. lab: We thank Dr. Elizabeth Ables and Dr. Karen Litwa for assistance with Zeiss Airyscan imaging and Dr. Nathan Hudson for use of the Leica widefield microscope. E. M. S. lab: We thank Rachel Hope Dodson for outstanding technical support, Dr. Silvana Pasetto for assistance with the ATP assay, and Heather Sorenson for research coordination support.
This article contains supporting information.
Author contributions—F. B. S., W. P. B., V. V. P., A.-B. K., and R. M. H. investigation; F. B. S., W. P. B., V. V. P., A.-B. K., C. T. O., E. M. S., and R. M. H. methodology; F. B. S., A.-B. K., and R. M. H. writing-original draft; F. B. S., W. P. B., V. V. P., A. K. M., E. M. S., and R. M. H. writing-review and editing; C. T. O. and R. M. H. resources; A. K. M., E. M. S., and R. M. H. conceptualization; E. M. S. and R. M. H. supervision; R. M. H. data curation; R. M. H. formal analysis.
Conflict of interest—The authors declare that they have no conflicts of interest with the contents of this article.
- Cry2
- cryptochrome 2
- CIB
- cryptochrome-interacting basic-helix-loop-helix
- Aβ
- amyloid β
- TBST
- Tris-buffered saline with Tween 20
- ROS
- reactive oxygen species
- CofActor
- light-responsive Cry2-CIB blue-light switch
- NOX
- NADPH oxidase
- ANOVA
- analysis of variance
- 2-DG
- 2-Deoxy-d-glucose.
References
- 1. Bamburg J. R., Bernstein B. W., Davis R. C., Flynn K. C., Goldsbury C., Jensen J. R., Maloney M. T., Marsden I. T., Minamide L. S., Pak C. W., Shaw A. E., Whiteman I., and Wiggan O. (2010) ADF/Cofilin-actin rods in neurodegenerative diseases. Curr. Alzheimer Res. 7, 241–250 10.2174/156720510791050902 [DOI] [PMC free article] [PubMed] [Google Scholar]
- 2. Minamide L. S., Maiti S., Boyle J. A., Davis R. C., Coppinger J. A., Bao Y., Huang T. Y., Yates J., Bokoch G. M., and Bamburg J. R. (2010) Isolation and characterization of cytoplasmic cofilin-actin rods. J. Biol. Chem. 285, 5450–5460 10.1074/jbc.M109.063768 [DOI] [PMC free article] [PubMed] [Google Scholar]
- 3. Kim J.-S., Huang T. Y., and Bokoch G. M. (2009) Reactive oxygen species regulate a slingshot-cofilin activation pathway. Mol. Biol. Cell 20, 2650–2660 10.1091/mbc.e09-02-0131 [DOI] [PMC free article] [PubMed] [Google Scholar]
- 4. Davis R. C., Marsden I. T., Maloney M. T., Minamide L. S., Podlisny M., Selkoe D. J., and Bamburg J. R. (2011) Amyloid beta dimers/trimers potently induce cofilin-actin rods that are inhibited by maintaining cofilin-phosphorylation. Mol. Neurodegener. 6, 10 10.1186/1750-1326-6-10 [DOI] [PMC free article] [PubMed] [Google Scholar]
- 5. Whiteman I. T., Gervasio O. L., Cullen K. M., Guillemin G. J., Jeong E. V., Witting P. K., Antao S. T., Minamide L. S., Bamburg J. R., and Goldsbury C. (2009) Activated actin-depolymerizing factor/cofilin sequesters phosphorylated microtubule-associated protein during the assembly of Alzheimer-like neuritic cytoskeletal striations. J. Neurosci. 29, 12994–13005 10.1523/JNEUROSCI.3531-09.2009 [DOI] [PMC free article] [PubMed] [Google Scholar]
- 6. Hughes R. M., and Lawrence D. S. (2014) Optogenetic engineering: Light-directed cell motility. Angew. Chem. Int. Ed. Engl. 53, 10904–10907 10.1002/anie.201404198 [DOI] [PMC free article] [PubMed] [Google Scholar]
- 7. Moriyama K., and Yahara I. (2002) The actin-severing activity of cofilin is exerted by the interplay of three distinct sites on cofilin and essential for cell viability. Biochem. J. 365, 147–155 10.1042/bj20020231 [DOI] [PMC free article] [PubMed] [Google Scholar]
- 8. Moriyama K., and Yahara I. (1999) Two activities of cofilin, severing and accelerating directional depolymerization of actin filaments, are affected differentially by mutations around the actin-binding helix. EMBO J. 18, 6752–6761 10.1093/emboj/18.23.6752 [DOI] [PMC free article] [PubMed] [Google Scholar]
- 9. Moriyama K., Iida K., and Yahara I. (1996) Phosphorylation of Ser-3 of cofilin regulates its essential function on actin. Genes Cells 1, 73–86 10.1046/j.1365-2443.1996.05005.x [DOI] [PubMed] [Google Scholar]
- 10. Ghosh M., Song X., Mouneimne G., Sidani M., Lawrence D. S., and Condeelis J. S. (2004) Cofilin promotes actin polymerization and defines the direction of cell motility. Science 304, 743–746 10.1126/science.1094561 [DOI] [PubMed] [Google Scholar]
- 11. Ghosh M., Ichetovkin I., Song X., Condeelis J. S., and Lawrence D. S. (2002) A new strategy for caging proteins regulated by kinases. J. Am. Chem. Soc. 124, 2440–2441 10.1021/ja017592l [DOI] [PubMed] [Google Scholar]
- 12. Zebda N., Bernard O., Bailly M., Welti S., Lawrence D. S., and Condeelis J. S. (2000) Phosphorylation of ADF/cofilin abolishes EGF-induced actin nucleation at the leading edge and subsequent lamellipod extension. J. Cell Biol. 151, 1119–1128 10.1083/jcb.151.5.1119 [DOI] [PMC free article] [PubMed] [Google Scholar]
- 13. Mi J., Shaw A. E., Pak C. W., Walsh K. P., Minamide L. S., Bernstein B. W., Kuhn T. B., and Bamburg J. R. (2013) A genetically encoded reporter for real-time imaging of cofilin-actin rods in living neurons. PLoS One 8, e83609 10.1371/journal.pone.0083609 [DOI] [PMC free article] [PubMed] [Google Scholar]
- 14. Bernstein B. W., Shaw A. E., Minamide L. S., Pak C. W., and Bamburg J. R. (2012) Incorporation of cofilin into rods depends on disulfide intermolecular bonds: Implications for actin regulation and neurodegenerative disease. J. Neurosci. 32, 6670–6681 10.1523/JNEUROSCI.6020-11.2012 [DOI] [PMC free article] [PubMed] [Google Scholar]
- 15. Cameron J. M., Gabrielsen M., Chim Y. H., Munro J., McGhee E. J., Sumpton D., Eaton P., Anderson K. I., Yin H., and Olson M. F. (2015) Polarized cell motility induces hydrogen peroxide to inhibit cofilin via cysteine oxidation. Curr. Biol. 25, 1520–1525 10.1016/j.cub.2015.04.020 [DOI] [PMC free article] [PubMed] [Google Scholar]
- 16. Graceffa P., and Dominguez R. (2003) Crystal structure of monomeric actin in the ATP state. Structural basis of nucleotide-dependent actin dynamics. J. Biol. Chem. 278, 34172–34180 10.1074/jbc.M303689200 [DOI] [PubMed] [Google Scholar]
- 17. Pope B. J., Zierler-Gould K. M., Kühne R., Weeds A. G., and Ball L. J. (2004) Solution structure of human cofilin: Actin binding, pH sensitivity, and relationship to actin-depolymerizing factor. J. Biol. Chem. 279, 4840–4848 10.1074/jbc.M310148200 [DOI] [PubMed] [Google Scholar]
- 18. Bamburg J. R., and Bernstein B. W. (2016) Actin dynamics and cofilin-actin rods in Alzheimer disease. Cytoskeleton 73, 477–497 10.1002/cm.21282 [DOI] [PMC free article] [PubMed] [Google Scholar]
- 19. Szatmari E. M., Oliveira A. F., Sumner E. J., and Yasuda R. (2013) Centaurin-α1-Ras-Elk-1 signaling at mitochondria mediates β-amyloid-induced synaptic dysfunction. J. Neurosci. 33, 5367–5374 10.1523/JNEUROSCI.2641-12.2013 [DOI] [PMC free article] [PubMed] [Google Scholar]
- 20. Tam S.-W., Feng R., Lau W. K.-W., Law A. C.-K., Yeung P. K.-K., and Chung S. K. (2019) Endothelin type B receptor promotes cofilin rod formation and dendritic loss in neurons by inducing oxidative stress and cofilin activation. J. Biol. Chem. 294, 12495–12506 10.1074/jbc.RA118.005155 [DOI] [PMC free article] [PubMed] [Google Scholar]
- 21. Davis R. C., Maloney M. T., Minamide L. S., Flynn K. C., Stonebraker M. A., and Bamburg J. R. (2009) Mapping cofilin-actin rods in stressed hippocampal slices and the role of cdc42 in amyloid-β-induced rods. J. Alzheimers Dis. 18, 35–50 10.3233/JAD-2009-1122 [DOI] [PMC free article] [PubMed] [Google Scholar]
- 22. Rohatgi R., Ma L., Miki H., Lopez M., Kirchhausen T., Takenawa T., and Kirschner M. W. (1999) The interaction between N-WASP and the Arp2/3 complex links Cdc42-dependent signals to actin assembly. Cell 97, 221–231 10.1016/S0092-8674(00)80732-1 [DOI] [PubMed] [Google Scholar]
- 23. Schönhofen P., de Medeiros L. M., Chatain C. P., Bristot I. J., and Klamt F. (2014) Cofilin/actin rod formation by dysregulation of cofilin-1 activity as a central initial step in neurodegeneration. Mini Rev. Med. Chem. 14, 393–400 10.2174/1389557514666140506161458 [DOI] [PubMed] [Google Scholar]
- 24. Elmore S. (2007) Apoptosis: A review of programmed cell death. Toxicol. Pathol. 35, 495–516 10.1080/01926230701320337 [DOI] [PMC free article] [PubMed] [Google Scholar]
- 25. Bamburg J. R., and Bloom G. S. (2009) Cytoskeletal pathologies of Alzheimer disease. Cell Motil. Cytoskeleton 66, 635–649 10.1002/cm.20388 [DOI] [PMC free article] [PubMed] [Google Scholar]
- 26. Holm S. (1979) A simple sequentially rejective multiple test procedure. Scand. J. Stat. 6, 65–70 [Google Scholar]
- 27. Hughes R. M., Freeman D. J., Lamb K. N., Pollet R. M., Smith W. J., and Lawrence D. S. (2015) Optogenetic apoptosis: Light-triggered cell death. Angew. Chemie Int. Ed. Engl. 54, 12064–12068 10.1002/anie.201506346 [DOI] [PMC free article] [PubMed] [Google Scholar]
- 28. Murakoshi H., Lee S.-J., and Yasuda R. (2008) Highly sensitive and quantitative FRET-FLIM imaging in single dendritic spines using improved non-radiative YFP. Brain Cell Biol. 36, 31–42 10.1007/s11068-008-9024-9 [DOI] [PMC free article] [PubMed] [Google Scholar]
- 29. Chang J.-Y., Parra-Bueno P., Laviv T., Szatmari E. M., Lee S.-J. R., and Yasuda R. (2017) CaMKII autophosphorylation is necessary for optimal integration of Ca2+ signals during LTP induction, but not maintenance. Neuron 94, 800–808.e4 10.1016/j.neuron.2017.04.041 [DOI] [PMC free article] [PubMed] [Google Scholar]
- 30. Schindelin J., Arganda-Carreras I., Frise E., Kaynig V., Longair M., Pietzsch T., Preibisch S., Rueden C., Saalfeld S., Schmid B., Tinevaz J.-Y., White D. J., Hartenstein V., Eliceiri K., Tomancak P., et al. (2012) Fiji: an open-source platform for biological-image analysis. Nat. Methods. 9, 676–682 10.1038/nmeth.2019 [DOI] [PMC free article] [PubMed] [Google Scholar]
- 31. Linkert M., Rueden C. T., Allan C., Burel J.-M., Moore W., Patterson A., Loranger B., Moore J., Neves C., Macdonald D., Tarkowska A., Sticco C., Hill E., Rossner M., Eliceiri K. W., et al. (2010) Metadata matters: access to image data in the real world. J. Cell Biol. 189, 777–782 10.1083/jcb.201004104 [DOI] [PMC free article] [PubMed] [Google Scholar]
Associated Data
This section collects any data citations, data availability statements, or supplementary materials included in this article.
Supplementary Materials
Data Availability Statement
All data are contained within the manuscript and the supporting information. Plasmids generated for this publication are available through Addgene, Inc., a not-for-profit plasmid DNA repository.