

Abstract
Background
As a multifaceted disease, atherosclerosis is often characterized by the formation and accumulation of plaque anchored to the inner wall of the arteries and causes some cardiovascular diseases and vascular embolism. Numerous studies have reported on the pathogenesis of atherosclerosis. However, fewer studies focused on both genes and immune cells, and the correlation of genes and immune cells was evaluated via comprehensive bioinformatics analyses.
Methods
29 samples of atherosclerosis-related gene expression profiling, including 16 human advanced atherosclerosis plaque (AA) and 13 human early atherosclerosis plaque (EA) samples from the Gene Expression Omnibus (GEO) database, were analyzed to get differentially expressed genes (DEGs) and the construction of protein and protein interaction (PPI) networks. Besides, we detected the relative fraction of 22 immune cell types in atherosclerosis by using the deconvolution algorithm of “cell type identification by estimating relative subsets of RNA transcripts (CIBERSORT).” Ultimately, based on the significantly changed types of immune cells, we executed the correlation analysis between DEGs and immune cells to discover the potential genes and pathways associated with immune cells.
Results
We identified 17 module genes and 6 types of significantly changed immune cells. Correlation analysis showed that the relative percentage of T cell CD8 has negative correlation with the C1QB expression (R = −0.63, p = 0.02), and the relative percentage of macrophage M2 has positive correlation with the CD86 expression (R = 0.57, p = 0.041) in EA. Meanwhile, four gene expressions (CD53, C1QC, NCF2, and ITGAM) have a high correlation with the percentages of T cell CD8 and macrophages (M0 and M2) in AA samples.
Conclusions
In this study, we suggested that the progression of atherosclerosis might be related to CD86, C1QB, CD53, C1QC, NCF2, and ITGAM and that it plays a role in regulating immune-competent cells such as T cell CD8 and macrophages M0 and M2. These results will enable studies of the potential genes associated with immune cells in the progression of atherosclerosis, as well as provide insight for discovering new treatments and drugs.
1. Background
Atherosclerosis is a multifaceted, progressive, and chronic inflammatory arterial disease that is recognized to be the leading cause of morbidity and mortality around the world [1]). It is characterized by the formation and build-up of atherosclerosis plaque inside the damaged arteries [2, 3]. Plaque is composed of low-density lipoprotein (LDL) cholesterol, fat, calcium, and other substances existing in the blood, which can harden and narrow the arteries [4–7]. Many studies have shown that atherosclerosis can affect any arterial blood vessels in the body and can lead to the atherosclerosis-related diseases, including ischemic heart, carotid artery, peripheral artery, and chronic kidney diseases [8–13]. Risk factors include high blood pressure, abnormal cholesterol levels, diabetes, obesity, family genetic history, smoking, age, and an unhealthy lifestyle.
Data mining has been used in various applications, including sequencing [14], microarray gene expression analysis [15–17], single-nucleotide polymorphism detection [18, 19], and genomic loss and amplification (copy number variation) analysis [20, 21]. Using microarrays, integrated bioinformatics enables researchers to quickly identify differentially expressed target genes between atherosclerosis samples in a single experiment [22, 23]. CIBERSORT is a deconvolution computational method for quantifying immune cell fractions from bulk tissue gene expression profiles. This method can accurately calculate the relative proportion of 22 types of immune cell compositions in lesion samples [24, 25].
The detailed mechanism of the pathogenesis of atherosclerosis is unclear. Although studies have revealed that chronic inflammation can drive atherosclerosis, which is the leading cause of cardiovascular disease as confirmed by molecular and cellular experiments, fewer studies have been conducted to analyze the correlation of genes and immune cells in atherosclerosis-related big data.
In this study, we reanalyzed the GSE28829 dataset reported previously in Doring et al.'s team research [2] and detected potential target genes for atherosclerosis treatment from the perspective of big data analysis. We firstly identified candidate DEGs and significant immune cells. Then, we explored the correlation between gene expressions and the relative percentages of immune cells to identify potential gene signatures useful for the diagnosis and therapeutic treatment of atherosclerosis.
2. Materials and Methods
2.1. Data Acquisition
The robust multiarray averaging normalized microarray expression profile GSE28829 [2] and affiliated annotation file were downloaded from the National Center Biotechnology Information Gene Expression Omnibus (https://www.ncbi.nlm.nih.gov/geo/) website [26], which was tested on the GPL570 platform based on the Affymetrix Human Genome U133 Plus 2.0 array. GSE28829 contains 13 early atherosclerotic plaque samples (EA group) and 16 advanced atherosclerotic plaque samples (AA group) from the human carotid artery. Figure 1(a) provides an overview of the analysis workflow.
Figure 1.

(a) Workflow of the analysis. (b) Volcano plot of differentially expressed genes; red represents upregulated genes, whereas blue represents downregulated genes. (c) Significance of GO and pathway enrichment of DEGs.
2.2. Data Preprocessing
After the GSE28829 expression matrix was downloaded, probe identification was matched to the corresponding gene symbol. For multiprobes to one gene, we retained the probe showing a significant gene expression value after deleting the non-mRNA probe. Based on this gene expression matrix information, we identified the significant differentially expressed genes and immune cells.
2.3. Identification of DEGs
The limma package was utilized to identify differentially expressed genes (DEGs) between advanced atherosclerotic plaques and early atherosclerotic plaque samples in RStudio [27–29]. The criteria were as follows: (1) the adjusted p < 0.01, a moderate t-test corrected by Benjamini and Hochberg's method [30]; (2) log fold change (FC) of upregulated genes ≥ 1.5 or log fold change (FC) of downregulated genes ≤ −1.
2.4. Gene Ontology and Pathway Analysis
Gene Ontology (GO) is used to describe the roles of genes and gene products in any organism based on existing biological knowledge and is divided into three independent branches: biological process (BP), cellular component (CC), and molecular function (MF) (Harris et al., 2004; Harris et al., 2006). Metabolic pathways and gene signaling networks based on available databases such as KEGG [31] and Reactome [32] were used to describe the pathway enrichment analyses. We used the DAVID website (https://david. http://ncifcrf.gov/) for gene annotation and visualization to perform the GO and pathway analysis. p < 0.05, calculated via Fisher's exact test [33], was used as the threshold for statistical significance [32, 34].
2.5. PPI Network Construction and Module Analysis
First, the identified DEGs were uploaded to the STRING [35] (version 11.0) website which includes 2 billion interactions associated with 24.6 million proteins referred to 5090 organs. STRING was used to determine the PPIs between DEG-encoded proteins. Second, the minimum interaction score was set to 0.4. The PPI networks were constructed using Cytoscape software [36]. The built-in Molecular Complex Detection (MCODE), a well-known automated method for detecting highly interconnected subgraphs as molecular complexes or clusters in large PPI networks was utilized to screen the modules in the PPI network. The correlated parameter criteria were set by default, except K‐core = 7. Moreover, functional enrichment analysis was performed for DEGs in the significant module with p < 0.05, calculated via Fisher's exact test [34], as the cutoff criterion.
2.6. Immune Cell Infiltration Analysis
Normalized gene expression data were utilized to evaluate the relative proportions of 22 types of infiltrating immune cells via using the CIBERSORT algorithm [25]. The gene expression matrix was uploaded to the CIBERSORT online website (https://cibersort.stanford.edu) by setting the default signature matrix at 1000 permutations. CIBERSORT is a deconvolution algorithm that depends on a set of reference gene expression values (a “signature matrix” of 547 genes in 22 types of immune cells). Next, significant immune cells between EA and AA samples were identified with the threshold Wilcoxon test at p < 0.05.
2.7. Correlation Analysis of Genes and Immune Cells
Pearson correlation test analysis was carried out to illustrate the relationship between gene expressions and the relative percentages of immune cells in EA and AA samples, respectively [37]. The value of the correlation coefficient between gene expressions and the relative proportion of immune cells could indicate the strong, weak, or no correlation. Based on the paired t-test, p < 0.05 was considered statistically significant.
2.8. Statistical Analysis
The moderate t-test was used to identify differentially expressed genes. Fisher's exact test was applied to perform GO and KEGG analysis. The Wilcoxon test was applied to immune cell analysis. Paired t-test was applied to correlation analysis between genes and cells. All statistical analyses were carried out in R version 3.5.2 software.
3. Results
3.1. Identification of DEGs
In the study, we identified 91 differentially expressed genes (DEGs) in the AA group compared to the EA group (Figure 1(b) and Table 1). Among them, 59 DEGs were upregulated (adjusted p < 0.01 and log FC ≥ 1.5), and the remaining 32 DEGs were downregulated (adjusted p < 0.01 and log FC ≤ −1).
Table 1.
The 91 differentially expressed genes were identified in AA samples compared to EA samples. (The differentially expressed genes were ranked from the smallest to the largest of adjusted p value).
| DEGs | Gene name |
|---|---|
| Upregulated genes (logFC ≥ 1.5) | SLAMF8, SERPINA1, VAMP8, C3AR1, CD52, CD84, CCR1, FCGBP, CD14, FCGR1B, ITGB2, LAPTM5, PIK3AP1, C1QB, APOE, KYNU, CTSS, RAC2, CD37, TYROBP, IGLC1, ACP5, TNFSF13B, CD53, CCL19, LY86, NPL, CCL18, IGLV1-44, BCAT1, SPP1, FCGR2B, C1QC, FABP5, PTPRC, MS4A7, CHI3L1, PLXNC1, GIMAP2, IER3, ADAMDEC1, CSF2RB, ITGAM, NCF2, CEMIP, CLEC5A, IGKC, CD86, IGLL3P, IGJ, CXCR4, CXCL2, RNASE6, FPR3, MSR1, KCNT2, EVI2B, IGHM, MMP9 |
| Downregulated genes (logFC ≤ −1) | ANGPTL1, TMEM35, BTC, BAG2, SLMAP, MBNL1-AS1, ATP1A2, PIP5K1B, C3orf70, SH3BGR, CNTN4, SBSPON, CAB39L, ACADL, ACTN2, NEXN, PDZRN3, PLD5, SLC22A3, KCNMA1, TTLL7, BAMBI, PPP1R1A, NTN1, AMIGO2, APCDD1, MYBL1, CNN1, RBP4, TOX2, CNTN1, LGR6 |
3.2. GO and Pathway Analysis
DEGs were uploaded to the DAVID website to identify the GO and pathway terms. As shown in Figure 1(c), significantly enriched GO and pathway DEGs were involved in defense response (BP), extracellular space (CC), immunoglobulin receptor binding (MF), and Staphylococcus aureus infection (KEGG pathway). As shown in Table 2, the significant GO terms of upregulated DEGs were mainly enriched in defense response (BP), immune response (BP), and regulation of immune response (BP), while significant GO terms of downregulated DEGs mainly were enriched in muscle contraction (BP), muscle system process (BP), and movement of cell or subcellular component (BP). The pathway terms of upregulated DEGs were enriched in Staphylococcus aureus infection (KEGG), phagosome (KEGG), and leukocyte transendothelial migration (KEGG), while the pathways of downregulated DEGs were unavailable (Table 3).
Table 2.
The significant Gene Ontology enrichments of differentially expressed genes (DEGs).
| Category | Term | Count | p value |
|---|---|---|---|
| Upregulated genes | |||
| GOTERM_BP_FAT | GO:0006952~defense response | 34 | 1.78E-22 |
| GOTERM_BP_FAT | GO:0006955~immune response | 32 | 9.60E-20 |
| GOTERM_BP_FAT | GO:0050776~regulation of immune response | 23 | 4.74E-15 |
| GOTERM_BP_FAT | GO:0045087~innate immune response | 21 | 1.47E-13 |
| GOTERM_BP_FAT | GO:0002684~positive regulation of immune system process | 22 | 1.68E-13 |
| GOTERM_BP_FAT | GO:0002682~regulation of immune system process | 25 | 2.27E-13 |
| GOTERM_BP_FAT | GO:0050778~positive regulation of immune response | 18 | 8.88E-12 |
| GOTERM_BP_FAT | GO:0048584~positive regulation of response to stimulus | 26 | 1.26E-10 |
| GOTERM_BP_FAT | GO:0009605~response to external stimulus | 26 | 1.99E-10 |
| GOTERM_BP_FAT | GO:0002250~adaptive immune response | 14 | 2.78E-10 |
| GOTERM_BP_FAT | GO:0006954~inflammatory response | 16 | 4.15E-10 |
| GOTERM_BP_FAT | GO:0002253~activation of immune response | 15 | 6.56E-10 |
| GOTERM_BP_FAT | GO:0002764~immune response-regulating signaling pathway | 14 | 4.79E-09 |
| GOTERM_BP_FAT | GO:0007166~cell surface receptor signaling pathway | 27 | 7.57E-09 |
| GOTERM_BP_FAT | GO:0050900~leukocyte migration | 12 | 1.43E-08 |
| GOTERM_BP_FAT | GO:0002757~immune response-activating signal transduction | 13 | 2.47E-08 |
| GOTERM_BP_FAT | GO:0032101~regulation of response to external stimulus | 14 | 1.75E-07 |
| GOTERM_BP_FAT | GO:0002252~immune effector process | 14 | 2.44E-07 |
| GOTERM_CC_FAT | GO:0044421~extracellular region part | 33 | 4.63E-07 |
| GOTERM_CC_FAT | GO:0005615~extracellular space | 20 | 4.84E-07 |
| Downregulated genes | |||
| GOTERM_BP_FAT | GO:0006936~muscle contraction | 5 | 0.00187531 |
| GOTERM_BP_FAT | GO:0003012~muscle system process | 5 | 0.003885779 |
| GOTERM_BP_FAT | GO:0006928~movement of cell or subcellular component | 9 | 0.006091447 |
| GOTERM_BP_FAT | GO:0015672~monovalent inorganic cation transport | 5 | 0.007385488 |
| GOTERM_BP_FAT | GO:0002028~regulation of sodium ion transport | 3 | 0.007948344 |
| GOTERM_BP_FAT | GO:0040011~locomotion | 8 | 0.0093652 |
| GOTERM_BP_FAT | GO:0043269~regulation of ion transport | 5 | 0.011584817 |
| GOTERM_BP_FAT | GO:0010959~regulation of metal ion transport | 4 | 0.014867703 |
| GOTERM_MF_FAT | GO:0003779~actin binding | 4 | 0.017959842 |
| GOTERM_BP_FAT | GO:0006812~cation transport | 6 | 0.018744883 |
| GOTERM_BP_FAT | GO:0030007~cellular potassium ion homeostasis | 2 | 0.019293154 |
| GOTERM_BP_FAT | GO:0042391~regulation of membrane potential | 4 | 0.019968055 |
| GOTERM_BP_FAT | GO:0034765~regulation of ion transmembrane transport | 4 | 0.024929627 |
| GOTERM_BP_FAT | GO:0034762~regulation of transmembrane transport | 4 | 0.02729303 |
| GOTERM_BP_FAT | GO:0055075~potassium ion homeostasis | 2 | 0.028804816 |
| GOTERM_MF_FAT | GO:0008092~cytoskeletal protein binding | 5 | 0.029503547 |
| GOTERM_BP_FAT | GO:0071805~potassium ion transmembrane transport | 3 | 0.034876856 |
| GOTERM_BP_FAT | GO:0071804~cellular potassium ion transport | 3 | 0.034876856 |
| GOTERM_BP_FAT | GO:0032412~regulation of ion transmembrane transporter activity | 3 | 0.03593287 |
| GOTERM_BP_FAT | GO:0048738~cardiac muscle tissue development | 3 | 0.036287643 |
Table 3.
The significant signal pathways of differentially expressed genes (DEGs).
| Pathway | Term | Count | P value |
|---|---|---|---|
| Upregulated genes | |||
| KEGG_PATHWAY | hsa05150: Staphylococcus aureus infection | 7 | 2.40E-07 |
| KEGG_PATHWAY | hsa04145: phagosome | 7 | 9.36E-05 |
| KEGG_PATHWAY | hsa04670: leukocyte transendothelial migration | 6 | 2.60E-04 |
| KEGG_PATHWAY | hsa05133: pertussis | 5 | 5.28E-04 |
| KEGG_PATHWAY | hsa04060: cytokine-cytokine receptor interaction | 7 | 0.001252687 |
| KEGG_PATHWAY | hsa04062: chemokine signaling pathway | 6 | 0.002299717 |
| KEGG_PATHWAY | hsa05134: legionellosis | 4 | 0.002506044 |
| BioCarta | h_blymphocytePathway: B lymphocyte cell surface molecules | 3 | 0.003628217 |
| KEGG_PATHWAY | hsa04610: complement and coagulation cascades | 4 | 0.005025012 |
| KEGG_PATHWAY | hsa05323: rheumatoid arthritis | 4 | 0.009854418 |
| KEGG_PATHWAY | hsa05152: tuberculosis | 5 | 0.011906527 |
| KEGG_PATHWAY | hsa04672: intestinal immune network for IgA production | 3 | 0.023560079 |
| KEGG_PATHWAY | hsa04380: osteoclast differentiation | 4 | 0.028350582 |
| KEGG_PATHWAY | hsa05416: viral myocarditis | 3 | 0.033703679 |
| KEGG_PATHWAY | hsa04514: cell adhesion molecules (CAMs) | 4 | 0.034833291 |
| Downregulated genes |
No significant signal pathway (P value < 0.05) available.
3.3. PPI Network Construction and Module Analysis
After uploading the 91 DEGs into the STRING online database and downloading the TSV format file of the interaction of multiple genes to Cytoscape software for PPI network construction, 59 DEGs (48 upregulated and 11 downregulated genes) were filtered from the 91 DEGs to construct the PPI networks, which contained 59 nodes/genes and 306 edges (Figure 2(a)); 32 genes did not participate in the PPI networks. Among these 59 nodes/genes, 17 central nodes/genes in module 1 were identified by the MCODE app and significantly associated with immune system function (Figure 2(b), Figure S1).
Figure 2.

(a) Protein-protein interaction (PPI) networks; red represents upregulated genes, blue represents downregulated genes, and yellow represents the significant module genes. Analysis was performed with MCODE. (b) Significant module genes; red represents upregulated module genes.
3.4. Immune Cell Infiltration Analysis
We first used the CIBERSORT algorithm to investigate the relative proportion of the 22 subpopulations of immune cells among EA and AA samples (Figure 3(a)). The relative proportions of 6 types of immune cells were significantly different between the EA and AA groups (Figure 3(b)). The cell types were T cell CD8 (p = 0.017), T cell gamma delta (p = 0.015), monocytes (p = 0.007), macrophage M0 (p = 0.007), macrophage M2 (p = 0.002), and dendritic cells (activated) (p = 0.005). Among these 6 types of immune cells, we found that T cell CD8, monocytes, and dendritic cells (activated) in the EA group were present at higher fractions than in the AA group, while the other three types of immune cells showed the opposite results (Figure 3(b)).
Figure 3.

(a) Relative proportions of 22 types of infiltrated immune cells in EA and AA groups. (b) Significant changes in infiltrated immune cells in AA compared to EA group (Wilcoxon test p < 0.05).
3.5. Correlation Analysis of Genes and Immune Cells
Correlation analysis (Pearson test) was carried out to illustrate and display the relationship between candidate genes and immune cells in EA and AA samples (Figures 4 and 5). As shown, CD86 and macrophage M2 (R = 0.57, p = 0.041) and C1QB and T cell CD8 (R = −0.63, p = 0.02) represented good correlation (Figures 4(a) and 4(b)) in early atherosclerosis plaque samples. Moreover, most genes have a close correlation with immune cells in advanced atherosclerosis plaque samples. It is worth noting that four common genes (CD53, C1QC, NCF2, and ITGAM) from module 1 have a close correlation with T cell CD8 and macrophages M0 and M2 (Figures 5(a) and 5(b)). However, we have discarded that situation: although the p value was less than 0.05 and had a high absolute value of R, the scatter plot shows that the point distribution was aggregated to zero (supplement Figures S2-3).
Figure 4.
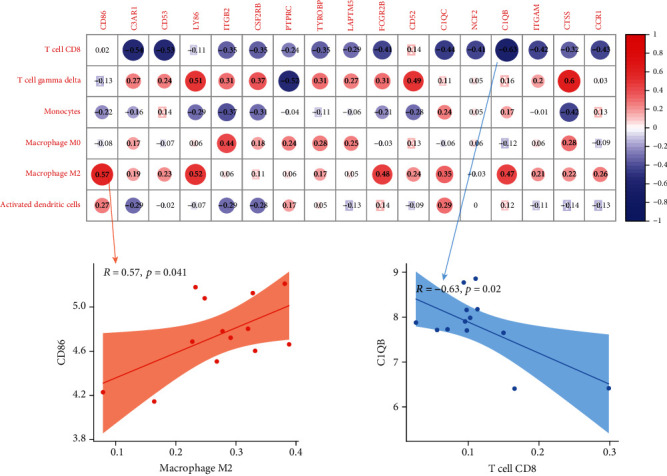
(a) Correlation between gene expressions and the relative percentages of immune cells in the EA group. (b) Scatterplots illustrate the exact relationship between the CD86 expression and the relative proportion of macrophage M2 (R = 0.57, p = 0.041) and the correlation between the C1QB expression and the relative proportion of T cell CD8 (R = −0.63, p = 0.02). Gray-shaded areas in scatterplots represent the standard errors of the regression lines. R: correlation coefficient.
Figure 5.

(a) Correlation between gene expressions and the relative percentages of immune cells in the AA group. (b) Scatterplots illustrate the relationship between four common gene expressions (CD53, C1QC, NCF2, and ITGAM) and the relative proportions of these three types of immune cells (T cell CD8, macrophage M0, and macrophage M2). Gray-shaded areas in scatterplots represent the standard errors of the regression lines. R: correlation coefficient. ∗Icon indicates the four common genes.
4. Discussion
Atherosclerosis is a disease caused by plaque accumulation within the arteries. Current studies have confirmed that immune cells including dendritic cells, several T cells, monocyte/macrophage subsets, and neutrophils are associated with atherosclerosis [2, 38–40]. It has been shown that specific therapies targeting the pro/anti-inflammatory cytokines such as CCL2, TNFα, and IL-6 have suggested slowing in the progression of atherosclerosis in animal models and might improve cardiovascular outcomes in human subjects in large-scale phase III trials. [41, 42]. Notably, the monoclonal antibody canakinumab, targeting to IL-1β, has reduced the risk of adverse cardiovascular events [41, 42].
In the current study, we aimed to identify the potential molecular gene signatures associated with the immune system during the progression of atherosclerotic disease. We first figured out the genes in module 1 (17 genes) and significantly changed types of immune cells (6 types of immune cells) between advanced atherosclerosis and early atherosclerosis. Afterward, according to the correlation analysis between genes and immune cells, we inferred that CD86 and C1QB have a good correlation with macrophage M2 and T cell CD8 in EA, respectively. What is more, most of the genes have associated with T cell CD8, macrophages (M0 and M2), and four common genes (CD53, C1QC, NCF2, and ITGAM), and all have correlation with the three types of immune cells in AA.
CD86 (cluster of differentiation 86) is a protein encoded by CD86, which is expressed on antigen-presenting cells (APCs) and provides costimulatory signals to T cells [43]. Meletta et al. used CD86/CD80 as a probe for atherosclerosis imaging [43]. Transfer of native Foxp3+ T cells showed a protective effect against experimental atherosclerosis (Ait-Oufella et al.; [44, 45]). CD53 (leukocyte surface antigen) is a member of the “tetraspan family” of membrane proteins and is expressed on various immune cells [46, 47]. CD53 can contribute to improving the transduction of CD2-generated signals in T cells and natural killer cells [48]. C1QB (complement C1q B chain) or C1QC (complement C1q C chain) encodes the C-chain or B-chain polypeptide of serum complement subcomponent C1q, respectively, and deficiency of C1q is associated with glomerulonephritis and lupus erythematosus. The Bos et al. team has suggested that C1QB might be associated with atherosclerosis and coronary artery disease [49]. What is more, the Khoonsari et al. group has revealed that the lower levels of C1QB and C1QC were involved in cell adhesion, migration, regulation of the synapse, and the immune system [50]. NCF2 (neutrophil cytosol factor 2) encodes a subunit of NADPH oxidase, and mutation in this gene can result in chronic granulomatous disease [51]. However, no research has revealed that NCF2 was involved in atherosclerosis. ITGAM (integrin alpha M) is known as complement receptor 3A (CR3A) or cluster of differentiation molecule 11B (CD11B) [52] and primarily expressed on the surface of innate immune cells [53]. Recent reports revealed that NCF2 and ITGAM play significant immune-regulatory roles in autoimmune disease [54, 55]. To date, fewer studies were focused on how genes (C1QB, C1QC, NCF2, and ITGAM) regulate immune cells (T cell CD8 and macrophages M0 or M2) and their relationship between gene expressions and the relative percentages of immune cells.
Based on this fact, (1) atherosclerotic diseases are related to immune cells and (2) there are examples of researchers using modified genes (such as IL-1β, CCL2, and IL-6) to treat atherosclerotic diseases [41, 42]. The innovation of this study is to screen out gene signatures associated with immune cells in the progression of atherosclerosis. According to the relationship between gene expressions and the relative proportions of immune cells, these genes may interact with immune cells through some unknown cell membrane receptors or ligands. It may be possible to modify the interactions of these genes with membrane receptors or ligands to identify new therapeutic treatments for atherosclerosis, as well as mechanisms of atherosclerosis regulation.
Nevertheless, there exist some inevitable difficulties in this study that should be taken into consideration. For instance, the atherosclerosis-related datasets were fewer and not as easily acquired and collected from the open public database as cancer datasets, which leads to the lack of comprehensiveness of the study which cannot be used to verify our results. Although the limited sample size of atherosclerosis may reduce the confidence, the approaches and ideas in this study are helpful in enlightening the inspiration of other researchers. Of course, additional molecular and cellular experiments should be performed to assess their characteristics.
5. Conclusions
The identification of 6 specific gene signatures and correlated immune cells in the progression of atherosclerosis may give us a clue to explore the mechanism of cardiovascular disease and its therapeutic treatments.
Acknowledgments
We also would like to thank Huabo Yang from the College of Foreign Languages and Cultures, Xiamen University, for correcting the grammar in the manuscript. We also thank Yingying Zhang (the General Hospital of PLA Rocket Force) for the statistics analysis. This study was supported by the National Natural Science Foundation of China (No. 81770294).
Abbreviations
- NCBI:
National Center for Biotechnology Information
- GEO:
Gene Expression Omnibus
- DEGs:
Differentially expressed genes
- PPI:
Protein and protein interaction
- CIBERSORT:
Cell type identification by estimating relative subsets of RNA transcripts
- LDL:
Low-density lipoprotein
- EA:
Early atherosclerosis
- AA:
Advanced atherosclerosis
- GO:
Gene Ontology
- KEGG:
Kyoto Encyclopedia of Genes and Genomes
- BP:
Biological process
- CC:
Cellular component
- MF:
Molecular function
- MCODE:
Molecular complex detection.
Data Availability
The data associated with this article has been deposited in the NCBI-GEO website (https://www.ncbi.nlm.nih.gov/geo/query/acc.cgi).
Conflicts of Interest
The authors declare that the research was conducted in the absence of any commercial or financial relationships that could be construed as a potential conflict of interest.
Authors' Contributions
BZ performed comparative analysis using bioinformatics tools. DW, YLL, XHZ, ZW, JLW, TS, LSD, YW, and YHZ participated in data analysis and discussion. BZ interpreted the data and wrote the manuscript. YLZ organized and offered funding for the project. All authors read and approved the final manuscript.
Supplementary Materials
Figure S1: the chord plot for functional enrichments of module 1 genes. Figure S2: the scatterplot of correlation between CTSS expression and the relative proportion of T cell gamma delta. Gray-shaded areas in scatterplots represent the standard errors of the blue regression lines. R: correlation coefficient. Figure S3: the scatterplot of correlation between 17 gene expressions and the proportion of dendritic cells activated. Gray-shaded areas in scatterplots represent the standard errors of the blue regression lines. R: correlation coefficient.
References
- 1.Hilgendorf I., Swirski F. K., Robbins C. S. Monocyte fate in atherosclerosis. Arteriosclerosis, Thrombosis, and Vascular Biology. 2015;35(2):272–279. doi: 10.1161/ATVBAHA.114.303565. [DOI] [PubMed] [Google Scholar]
- 2.Döring Y., Manthey H. D., Drechsler M., et al. Auto-antigenic protein-DNA complexes stimulate plasmacytoid dendritic cells to promote atherosclerosis. Circulation. 2012;125(13):1673–1683. doi: 10.1161/CIRCULATIONAHA.111.046755. [DOI] [PubMed] [Google Scholar]
- 3.Woollard K. J., Geissmann F. Monocytes in atherosclerosis: subsets and functions. Nature Reviews Cardiology. 2010;7(2):77–86. doi: 10.1038/nrcardio.2009.228. [DOI] [PMC free article] [PubMed] [Google Scholar]
- 4.Arnold N., Koenig W. Atherosklerose als inflammatorische Erkrankung – Pathophysiologie, klinische Relevanz und therapeutische Implikationen. Deutsche Medizinische Wochenschrift. 2019;144(5):315–321. doi: 10.1055/a-0657-1595. [DOI] [PubMed] [Google Scholar]
- 5.Jin W., Wu W., Yang K., et al. The single nucleotide polymorphisms of chromosome 9p21 and CD147 were relevant with the carotid plaque risk in acute cerebral infarction patients among Chinese Han population. Journal of Molecular Neuroscience. 2020;70:1–11. doi: 10.1007/s12031-020-01540-9. [DOI] [PubMed] [Google Scholar]
- 6.Nilsson J., Hansson G. K. Vaccination strategies and immune modulation of atherosclerosis. Circulation Research. 2020;126(9):1281–1296. doi: 10.1161/CIRCRESAHA.120.315942. [DOI] [PubMed] [Google Scholar]
- 7.Tulenko T. N., Laury-Kleintop L., Walter M. F., Mason R. P. Cholesterol, calcium and atherosclerosis: is there a role for calcium channel blockers in atheroprotection? International Journal of Cardiology. 1997;62:S55–S66. doi: 10.1016/S0167-5273(97)00242-8. [DOI] [PubMed] [Google Scholar]
- 8.Aboyans V., Ricco J.-B., Bartelink M.-L. E. L., et al. 2017 ESC guidelines on the diagnosis and treatment of peripheral arterial diseases, in collaboration with the European Society for Vascular Surgery (ESVS) European Heart Journal. 2018;39(9):763–816. doi: 10.1093/eurheartj/ehx095. [DOI] [PubMed] [Google Scholar]
- 9.Anand S. S., Yusuf S., Vuksan V., et al. Differences in risk factors, atherosclerosis, and cardiovascular disease between ethnic groups in Canada: the Study of Health Assessment and Risk in Ethnic groups (SHARE) The Lancet. 2000;356(9226):279–284. doi: 10.1016/S0140-6736(00)02502-2. [DOI] [PubMed] [Google Scholar]
- 10.Criqui M. H., Aboyans V. Correction. Circulation Research. 2015;117(1):e12–e26. doi: 10.1161/RES.0000000000000059. [DOI] [PubMed] [Google Scholar]
- 11.DeFronzo R. A., Ferrannini E. Insulin resistance: a multifaceted syndrome responsible for NIDDM, obesity, hypertension, dyslipidemia, and atherosclerotic cardiovascular disease. Diabetes Care. 1991;14(3):173–194. doi: 10.2337/diacare.14.3.173. [DOI] [PubMed] [Google Scholar]
- 12.Kullo I. J., Rooke T. W. Peripheral artery disease. New England Journal of Medicine. 2016;374(9):861–871. doi: 10.1056/NEJMcp150763. [DOI] [PubMed] [Google Scholar]
- 13.Levey A. S., Eckardt K. U., Tsukamoto Y., et al. Definition and classification of chronic kidney disease: a position statement from Kidney Disease: Improving Global Outcomes (KDIGO) Kidney International. 2005;67(6):2089–2100. doi: 10.1111/j.1523-1755.2005.00365.x. [DOI] [PubMed] [Google Scholar]
- 14.Brown A. A., Viñuela A., Delaneau O., Spector T. D., Small K. S., Dermitzakis E. T. Predicting causal variants affecting expression by using whole-genome sequencing and RNA-seq from multiple human tissues. Nature Genetics. 2017;49(12):1747–1751. doi: 10.1038/ng.3979. [DOI] [PubMed] [Google Scholar]
- 15.Martorell-Marugan J., Toro-Dominguez D., Alarcon-Riquelme M. E., Carmona-Saez P. MetaGenyo: a web tool for meta-analysis of genetic association studies. BMC Bioinformatics. 2017;18(1):p. 563. doi: 10.1186/s12859-017-1990-4. [DOI] [PMC free article] [PubMed] [Google Scholar]
- 16.Stears R. L., Martinsky T., Schena M. Trends in microarray analysis. Nature Methods. 2003;9(1):140–145. doi: 10.1038/nm0103-140. [DOI] [PubMed] [Google Scholar]
- 17.Toro-Domínguez D., Martorell-Marugán J., López-Domínguez R., et al. ImaGEO: integrative gene expression meta-analysis from GEO database. Bioinformatics. 2019;35(5):880–882. doi: 10.1093/bioinformatics/bty721. [DOI] [PubMed] [Google Scholar]
- 18.Fan J. B., Chen X., Halushka M. K., et al. Parallel genotyping of human SNPs using generic high-density oligonucleotide tag arrays. Genome Research. 2000;10(6):853–860. doi: 10.1101/gr.10.6.853. [DOI] [PMC free article] [PubMed] [Google Scholar]
- 19.Wang D. G., Fan J. B., Siao C. J., et al. Large-scale identification, mapping, and genotyping of single-nucleotide polymorphisms in the human genome. Science. 1998;280(5366):1077–1082. doi: 10.1126/science.280.5366.1077. [DOI] [PubMed] [Google Scholar]
- 20.Walsh T., McClellan J. M., McCarthy S. E., et al. Rare structural variants disrupt multiple genes in neurodevelopmental pathways in schizophrenia. Science. 2008;320(5875):539–543. doi: 10.1126/science.1155174. [DOI] [PubMed] [Google Scholar]
- 21.Watkins-Chow D. E., Pavan W. J. Genomic copy number and expression variation within the C57BL/6J inbred mouse strain. Genome Research. 2007;18(1):60–66. doi: 10.1101/gr.6927808. [DOI] [PMC free article] [PubMed] [Google Scholar]
- 22.Perisic L., Aldi S., Sun Y., et al. Gene expression signatures, pathways and networks in carotid atherosclerosis. Journal of Internal Medicine. 2016;279(3):293–308. doi: 10.1111/joim.12448. [DOI] [PubMed] [Google Scholar]
- 23.Tan X. W., Zhang X. T., Pan L. L., Tian X. X., Dong P. Z. Identification of key pathways and genes in advanced coronary atherosclerosis using bioinformatics analysis. BioMed Research International. 2017;2017:12. doi: 10.1155/2017/4323496. [DOI] [PMC free article] [PubMed] [Google Scholar]
- 24.Gentles A. J., Newman A. M., Liu C. L., et al. The prognostic landscape of genes and infiltrating immune cells across human cancers. Nature Medicine. 2015;21(8):938–945. doi: 10.1038/nm.3909. [DOI] [PMC free article] [PubMed] [Google Scholar]
- 25.Newman A. M., Liu C. L., Green M. R., et al. Robust enumeration of cell subsets from tissue expression profiles. Nature Methods. 2015;12(5):453–457. doi: 10.1038/NMETH.3337. [DOI] [PMC free article] [PubMed] [Google Scholar]
- 26.Barrett T., Troup D. B., Wilhite S. E., et al. NCBI GEO: mining tens of millions of expression profiles--database and tools update. Nucleic Acids Research. 2007;35:D760–D765. doi: 10.1093/nar/gkl887. [DOI] [PMC free article] [PubMed] [Google Scholar]
- 27.Phipson B., Lee S., Majewski I. J., Alexander W. S., Smyth G. K. Robust hyperparameter estimation protects against hypervariable genes and improves power to detect differential expression. The Annals of Applied Statistics. 2016;10(2):946–963. doi: 10.1214/16-AOAS920. [DOI] [PMC free article] [PubMed] [Google Scholar]
- 28.Ruegg K. C., Anderson E. C., Harrigan R. J., et al. Genetic assignment with isotopes and habitat suitability (GAIAH), a migratory bird case study. Methods in Ecology and Evolution. 2017;8(10):1241–1252. doi: 10.1111/2041-210X.12800. [DOI] [Google Scholar]
- 29.Smyth G. K. Linear models and empirical Bayes methods for assessing differential expression in microarray experiments. Statistical Applications in Genetics and Molecular Biology. 2004;3(1):1–25. doi: 10.2202/1544-6115.1027. [DOI] [PubMed] [Google Scholar]
- 30.Benjamini Y., Hochberg Y. Controlling the false discovery rate - a practical and powerful approach to multiple testing. Journal of the Royal Statistical Society. 1995;57(1):289–300. doi: 10.1111/j.2517-6161.1995.tb02031.x. [DOI] [Google Scholar]
- 31.Kanehisa M., Goto S., Kawashima S., Okuno Y., Hattori M. The KEGG resource for deciphering the genome. Nucleic Acids Research. 2004;32(90001):277D–2280. doi: 10.1093/nar/gkh063. [DOI] [PMC free article] [PubMed] [Google Scholar]
- 32.Joshi-Tope G., Gillespie M., Vastrik I., et al. Reactome: a knowledgebase of biological pathways. Nucleic Acids Research. 2004;33:D428–D432. doi: 10.1093/nar/gki072. [DOI] [PMC free article] [PubMed] [Google Scholar]
- 33.Fisher R. A. On the interpretation of χ2 from contingency tables, and the calculation of P. Journal of the Royal Statistical Society. 1922;85(1):87–94. doi: 10.2307/2340521. [DOI] [Google Scholar]
- 34.Dennis G., Sherman B. T., Hosack D. A., et al. DAVID: Database for Annotation, Visualization, and Integrated Discovery. Genome Biology. 2003;4(9):p. R60. doi: 10.1186/gb-2003-4-9-r60. [DOI] [PubMed] [Google Scholar]
- 35.Franceschini A., Szklarczyk D., Frankild S., et al. STRING v9.1: protein-protein interaction networks, with increased coverage and integration. Nucleic Acids Research. 2012;41(D1):D808–D815. doi: 10.1093/nar/gks1094. [DOI] [PMC free article] [PubMed] [Google Scholar]
- 36.Kohl M., Wiese S., Warscheid B. Cytoscape: software for visualization and analysis of biological networks. Methods in Molecular Biology. 2011;696:291–303. doi: 10.1007/978-1-60761-987-1_18. [DOI] [PubMed] [Google Scholar]
- 37.Sedgwick P. Pearson's correlation coefficient. British Medical Journal. 2012;345 doi: 10.1136/bmj.e4483. [DOI] [Google Scholar]
- 38.Vazquez M. M., Gutierrez M. V., Salvatore S. R., et al. Nitro-oleic acid, a ligand of CD36, reduces cholesterol accumulation by modulating oxidized-LDL uptake and cholesterol efflux in RAW264.7 macrophages. Redox Biology. 2020;36, article 101591 doi: 10.1016/j.redox.2020.101591. [DOI] [PMC free article] [PubMed] [Google Scholar]
- 39.Weber C., Zernecke A., Libby P. The multifaceted contributions of leukocyte subsets to atherosclerosis: lessons from mouse models. Nature Reviews Immunology. 2008;8(10):802–815. doi: 10.1038/nri2415. [DOI] [PubMed] [Google Scholar]
- 40.Zernecke A., Bot I., Djalali-Talab Y., et al. Protective role of CXC receptor 4/CXC ligand 12 unveils the importance of neutrophils in atherosclerosis. Circulation Research. 2008;102(2):209–217. doi: 10.1161/CIRCRESAHA.107.160697. [DOI] [PubMed] [Google Scholar]
- 41.Khambhati J., Engels M., Allard-Ratick M., Sandesara P. B., Quyyumi A. A., Sperling L. Immunotherapy for the prevention of atherosclerotic cardiovascular disease: promise and possibilities. Atherosclerosis. 2018;276:1–9. doi: 10.1016/j.atherosclerosis.2018.07.007. [DOI] [PubMed] [Google Scholar]
- 42.Ridker P. M., Luscher T. F. Anti-inflammatory therapies for cardiovascular disease. European Heart Journal. 2014;35(27):1782–1791. doi: 10.1093/eurheartj/ehu203. [DOI] [PMC free article] [PubMed] [Google Scholar]
- 43.Meletta R., Herde A. M., Dennler P., Fischer E., Schibli R., Krämer S. D. Preclinical imaging of the co-stimulatory molecules CD80 and CD86 with indium-111-labeled belatacept in atherosclerosis. EJNMMI Research. 2016;6(1):p. 1. doi: 10.1186/s13550-015-0157-4. [DOI] [PMC free article] [PubMed] [Google Scholar]
- 44.Mor A., Planer D., Luboshits G., et al. Role of naturally occurring CD4+ CD25+ regulatory T cells in experimental atherosclerosis. Arteriosclerosis Thrombosis and Vascular Biology. 2007;27(4):893–900. doi: 10.1161/01.ATV.0000259365.31469.89. [DOI] [PubMed] [Google Scholar]
- 45.Ait-Oufella H., Salomon B. L., Potteaux S., et al. Natural regulatory T cells control the development of atherosclerosis in mice. Nature Medicine. 2006;12(2):178–180. doi: 10.1038/nm1343. [DOI] [PubMed] [Google Scholar]
- 46.Jin H. S., Cho J. E., Park S. Association between CD53 genetic polymorphisms and tuberculosis cases. Genes & Genomics. 2019;41(4):389–395. doi: 10.1007/s13258-018-0764-3. [DOI] [PubMed] [Google Scholar]
- 47.Korinek V., Horejsi V. Genomic structure of the human CD53 gene. Immunogenetics. 1993;38(4):272–279. doi: 10.1007/BF00188803. [DOI] [PubMed] [Google Scholar]
- 48.Comerci C. J., Mace E. M., Banerjee P. P., Orange J. S. CD2 promotes human natural killer cell membrane nanotube formation. PLoS One. 2012;7(10, article e47664) doi: 10.1371/journal.pone.0047664. [DOI] [PMC free article] [PubMed] [Google Scholar]
- 49.Bos S., Phillips M., Watts G. F., Verhoeven A. J. M., Sijbrands E. J. G., Ward N. C. Novel protein biomarkers associated with coronary artery disease in statin- treated patients with familial hypercholesterolemia. Journal of Clinical Lipidology. 2017;11(3):682–693. doi: 10.1016/j.jacl.2017.03.014. [DOI] [PubMed] [Google Scholar]
- 50.Khoonsari P. E., Häggmark A., Lönnberg M., et al. Analysis of the cerebrospinal fluid proteome in Alzheimer’s disease. PLoS One. 2016;11(3, article e0150672) doi: 10.1371/journal.pone.0150672. [DOI] [PMC free article] [PubMed] [Google Scholar]
- 51.Kenney R. T., Leto T. L. A HindIII polymorphism in the human NCF2 gene. Nucleic Acids Research. 1990;18(23):p. 7193. doi: 10.1093/nar/18.23.7193-a. [DOI] [PMC free article] [PubMed] [Google Scholar]
- 52.Solovjov D. A., Pluskota E., Plow E. F. Distinct roles for the α and β subunits in the functions of integrin αMβ2. Journal of Biological Chemistry. 2005;280(2):1336–1345. doi: 10.1074/jbc.M406968200. [DOI] [PubMed] [Google Scholar]
- 53.Park S., Sim H., Kim H. I., et al. CD11b regulates antibody class switching via induction of AID. Molecular Immunology. 2017;87:47–59. doi: 10.1016/j.molimm.2017.04.005. [DOI] [PubMed] [Google Scholar]
- 54.Chou J., Hsu J. T., Bainter W., Al-Attiyah R.'a., Al-Herz W., Geha R. S. A novel mutation in _NCF2_ associated with autoimmune disease and a solitary late-onset infection. Clinical Immunology. 2015;161(2):128–130. doi: 10.1016/j.clim.2015.08.003. [DOI] [PubMed] [Google Scholar]
- 55.Rosetti F., Mayadas T. N. The many faces of Mac-1 in autoimmune disease. Immunological Reviews. 2016;269(1):175–193. doi: 10.1111/imr.12373. [DOI] [PubMed] [Google Scholar]
Associated Data
This section collects any data citations, data availability statements, or supplementary materials included in this article.
Supplementary Materials
Figure S1: the chord plot for functional enrichments of module 1 genes. Figure S2: the scatterplot of correlation between CTSS expression and the relative proportion of T cell gamma delta. Gray-shaded areas in scatterplots represent the standard errors of the blue regression lines. R: correlation coefficient. Figure S3: the scatterplot of correlation between 17 gene expressions and the proportion of dendritic cells activated. Gray-shaded areas in scatterplots represent the standard errors of the blue regression lines. R: correlation coefficient.
Data Availability Statement
The data associated with this article has been deposited in the NCBI-GEO website (https://www.ncbi.nlm.nih.gov/geo/query/acc.cgi).