

Abstract
The Na-K-Cl cotransporter-1, NKCC1, by mediating the electroneutral transport of Na+, K+, and Cl− plays an important role in cell volume regulation, epithelial transport, and the control of neuronal excitability. Recently, we reported the first known human mutation in SLC12A2, the gene encoding NKCC1. The 17-year old patient suffers from multi-organ failure. Laboratory tests conducted on muscle and liver biopsies of the patient showed abnormal increase in mitochondrial DNA copy number and increased glycogen levels, indicating the possibility that the transporter may play a role in energy metabolism. Here, we show that fibroblasts isolated from the patient demonstrate a significant increase in mitochondrial respiration, compared to fibroblasts isolated from healthy individuals. Similarly, MDCK cells transfected with EGFP-tagged mutant NKCC1 DNA demonstrated increased mitochondrial respiration when compared to MDCK cells expressing EGFP-tagged wild-type cotransporter. Direct inhibition of the cotransporter through addition of bumetanide did not change the rate of basal respiration, but led to increased maximal mitochondrial respiration. Fibroblasts extracted from NKCC1WT/DFX and NKCC1DFX/DFX mice also demonstrated a significant elevation in mitochondrial respiration, compared to fibroblasts isolated from their wild-type littermates. Expression of the mutant protein was associated with an increase in hydrogen peroxide and peroxidase activity and a decrease in mRNA transcript levels for protein involved in the unfolded protein response (UPR). These data reveal that cells expressing the mutant cotransporter demonstrate increased mitochondrial respiration and behave like they are experiencing a state of starvation.
Keywords: Mitochondrial respiration, glycolysis, Na-K-2Cl cotransport, fibroblasts, epithelial cells
INTRODUCTION
We recently reported the case of a patient expressing a de novo (heterozygous) 11 base pair deletion in SLC12A2, the gene encoding the Na-K-2Cl cotransporter-1 (NKCC1) (Delpire et al., 2016). The patient was referred to the Undiagnosed Diseases Program (UDP) at the NIH with symptoms such as decreased energy and fatigue, obstructive apnea, vomiting and dehydration, exercise intolerance, dilated cardiomyopathy in the left ventricle, and seizure like episodes. She also experienced multi-organ dysfunction involving the gastrointestinal, urinary, and exocrine systems. Thus, as the patient’s organs kept ‘failing’, and she showed clear signs of excessive sleeping, hypotonia, and exercise intolerance, clinicians postulated that she suffered from some type of mitochondrial or metabolic syndrome. Clinical tests at age 7 revealed elevated liver and muscle glycogen levels and an increased mitochondrial DNA copy number. On this basis, she was enrolled in the NIH Epi-743 clinical trial at the UDP to improve energy production.
Genomic analysis revealed additional mutations in the PCNT (pericentrin) and FMN2 (formin 2) genes. However, none of the diseases associated with PCNT or FMN2 mutations were observed in the patient. The 11 bp deletion in SLC12A2 was found in exon 22, leading to a frameshift and the introduction of a premature stop codon resulting in the truncation of 200 amino acids from the carboxyl-terminal tail of the cotransporter. The mutant was called NKCC1-DFX for the last “intact” residue, aspartic acid residue (D), followed by a new residue, phenylalanine (F), and a stop codon (X) (Delpire et al., 2016). Functional analyses revealed absence of function of the mutant transporter and absence of dominant negative effects in Xenopus laevis oocytes and fibroblasts (Delpire et al., 2016). In contrast, a dominant negative effect was observed in epithelial cells with the mutant transporter mistrafficking to the apical and subapical pole of the cells and through dimerization, it carries with it some wild-type transporters to the apical membrane (Koumangoye, Omer, & Delpire, 2018). Improper trafficking is due to the loss of a dileucine motif located close to the extreme COOH-terminus of the protein (Koumangoye, Omer, & Delpire, 2019). In addition, improper trafficking was confirmed in a mouse model recapitulating the patient mutation. The mutant mouse exhibited signs of gastrointestinal deficits, including decreased fluid secretion, abnormal mucus release, and bacterial invasion of the epithelial layer, consistent with the patient gastrointestinal issues (Koumangoye, Omer, Kabeer, & Delpire, 2020).
Detailed analyses of intracellular compartments revealed that the mutant transporter was able to clear the endoplasmic reticulum (ER) and was found principally at the apical membrane, in Rab5-positive apical early endosomes, and in lysosomes (Koumangoye, Omer, & Delpire, 2019). Because overexpression of truncated transporters often results in their accumulation in the ER (Nezu, Parvin, & Turner, 2009), we postulated that the mutant transporter to clear the ER might require additional energy. Increased mitochondrial respiration is an adaptive cellular response to protein misfolding in the ER, by reducing ROS accumulation from the ER and promoting cell survival (J. Knupp, P. Arvan, & A. Chang, 2019).
Alternatively, NKCC1 activity in cells affects intracellular levels of Na+, K+, and Cl− and the Na+ concentration in particular might affect intracellular Ca2+ levels through plasma membrane Na+/Ca2+ exchangers. Thus, changes in NKCC1 function might lead to changes in mitochondrial function through Na+ and Ca2+ levels. In this paper, we examine the consequences of expressing the mutant NKCC1 cotransporter on mitochondrial function. We show that the fibroblasts from the patient have increased basal mitochondrial respiration rate, as do MDCK cells overexpressing the mutant transporter and mouse fibroblasts natively expressing the defective transporter. In addition, fibroblasts lacking NKCC1 function demonstrate increased hydrogen peroxide production and peroxidase activity, hallmarks of increased oxidative stress. When combined with the observation that proteins involved in the unfolded protein response demonstrate reduced expression, our data suggest that cells expressing the mutant transporter behave like they are deprived of key nutrients or in a state of starvation.
MATERIALS AND METHODS
Cell lines –
Primary human fibroblasts isolated from two healthy individuals and fibroblasts from the NKCC1-DFX patient and immortalized by the Undiagnosed Diseases Program were obtained and cultured in 10-cm dishes in DMEM:F12 medium containing 10% fetal bovine serum and 200 U penicillin + 200 μg/mL streptomycin and kept at 37°C under 95% air, 5% CO2. At the time of experiments, the fibroblasts were used at low (up to 3) passages. The wild-type and mutant NKCC1 plasmids used to transfect Madin Darby Canine Kidney (MDCK) cells were described previously (Delpire et al., 2016). MDCK cells expressing wild-type and mutant cotransporters were grown in selection media (DMEM supplemented with 5% FBS, 1% penicillin and streptomycin, and 500 μg/ml of Geneticin). Previous studies had shown that the addition of fluorescent markers to the N-terminus of NKCC1 did not affect cotransporter expression, trafficking, and function (Gagnon, England, & Delpire, 2006; Koumangoye, Omer, & Delpire, 2018). Primary mouse fibroblasts were isolated from tails of wild-type (WT) mice, mice heterozygous for the NKCC1-DFX mutation (NKCC1WT/DFX), and mice homozygous for the NKCC1-DFX mutation (NKCC1DFX/DFX), as described below. The generation of these mice were described in a previous paper (Koumangoye, Omer, & Delpire, 2018).
Seahorse assays –
Cells were plated in a 96-well plate at 15 × 103 cells per well in Seahorse Assay Media and assessed on the Seahorse XFe 96 Extracellular Flux Analyzer (Agilent Technologies, Santa Clara, CA). The Seahorse assay media was DMEM-based and contained 2 mM of L-glutamine (as L-alanyl-glutamine or GlutaMAX) and no glucose (Agilent Technologies, catalog #102365–100). For the mitochondrial stress test, assay media were supplemented with 10 mM glucose, and cells were sequentially treated with 1 mM oligomycin, 1 mM FCCP, and 0.5 mM of antimycin A and rotenone (all from Agilent Technologies). Basal respiration was quantified as the difference between the last rate measurement before oligomycin injection, and the minimum rate measurement after rotenone/antimycin A injection. Maximum respiration is the difference between the maximum rate measurement after FCCP injection and the minimum rate measurement after rotenone/antimycin A injection. For the glycolysis stress test, cells were sequentially treated with 10 mM glucose (Sigma-Aldrich, St. Louis, MO), 1 mM oligomycin, and 50 mM 2-deoxyglucose (2-DG) (Sigma-Aldrich). Glycolysis was quantified as the difference between the maximum rate measurement before oligomycin injection and the last rate measurement before glucose injection. Glycolytic capacity was quantified as the difference between the maximum rate measurement after oligomycin injection and the last rate measurement before glucose injection. For both mitochondrial and glycolysis stress tests, some cells were pretreated with 20 μM of bumetanide (Sigma-Aldrich). A Bio Rad TC20™ Automated Cell Counter was used to ensure that the same numbers of cells was used in each assay. Statistical analyses were performed using Prism (GraphPad Software, Inc.) using one way analysis of variance (ANOVA) to determine any statistical significance of differences between the means of two or more independent groups.
Mitochondrial density –
Mitochondrial density was measured in primary human fibroblasts isolated from healthy individuals and fibroblasts from the NKCC1-DFX patient; and fibroblasts isolated from WT, NKCC1WT/DFX and NKCC1DFX/DFX mice using the MITO-ID® Green detection kit (Enzo Life Sciences, ENZ-51022–0100). The same numbers of cells were used for each assay by counting cells using a Bio Rad TC20™ Automated Cell Counter. Cells were stained with 0.33 μl/ml of MITO-ID® Green and 0.25 μl/ml of Hoescht 33342 Nuclear Stain. Cells were incubated in the dark for 30 minutes at 37oC in 5% CO2 in phenol-red free DMEM with 4.5 g/L D-Glucose, no glutamine or pyruvate. Mean fluorescence intensity of each cell was detected using a 5-laser LSRll flow cytometer. The FlowJo software package was utilized to analyze the mean fluorescence intensity of each sample. Cell sorting within FlowJo allowed isolation of fibroblasts from cell debris and dead cells. The software plots the side scatter of single cells (SSC) based on granularity (Y-axis of Figure 1A) as a function of the level of FITC fluorescence (FITC on X-axis) within each cell. Single cell mitochondrial density was obtained from the level of fluorescence intensity from each cell. Statistical analysis was performed using one-way analysis of variance (ANOVA).
Figure 1. Human fibroblasts expressing NKCC1-DFX have increased mitochondrial density.
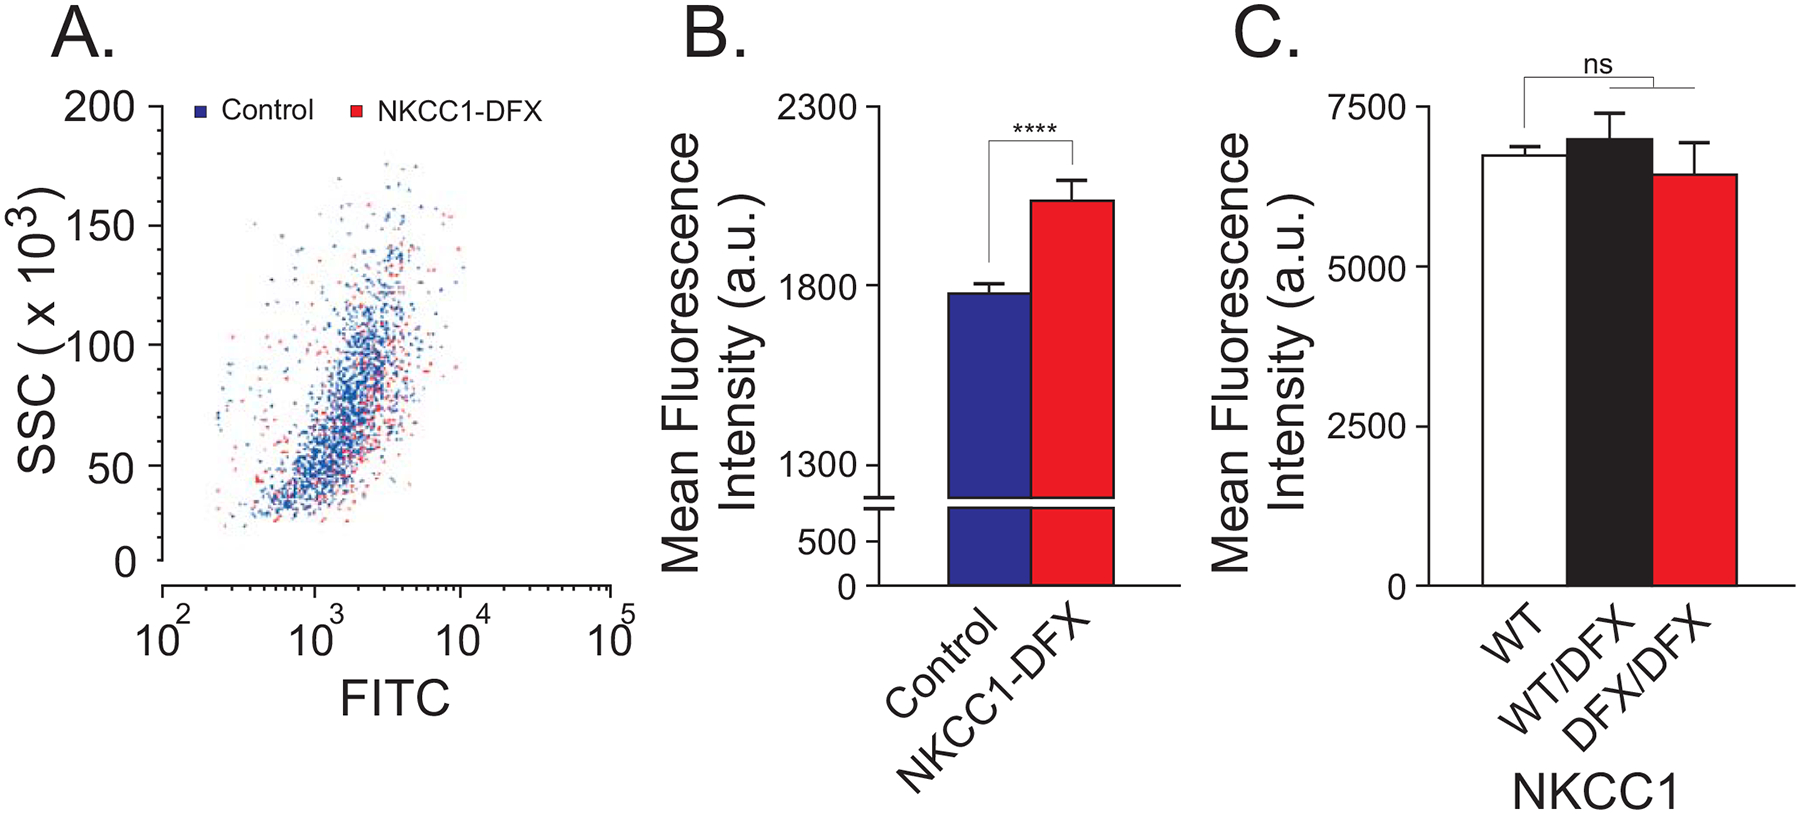
(A) Flow cytometry analysis of mitochondria in fibroblasts stained with MITO-ID green in control fibroblasts (blue) and NKCC1-DFX fibroblasts (red). Y-axis = Side Scatter (SSC) of single cells; X-axis = level of FITC fluorescence (FITC) from mitochondria. (B) Mean fluorescence intensity of mitochondria in control (n = 1440 cells) and NKCC1-DFX (n = 523 cells) fibroblasts, 3 biological replicates. Unpaired t-test, ****p < 0.0001. (C) Mean fluorescence intensity of mitochondria from WT (n = 30,000 cells), NKCC1WT/DFX (n = 30,000 cells) and NKCC1DFX/DFX (n = 20,000 cells) fibroblasts, one-way ANOVA, P > 0.05, ns = non-significant.
Isolation of mouse tail fibroblasts –
The generation of the NKCC1-DFX mouse was reported in a previous publication (Koumangoye, Omer, & Delpire, 2018). Experiments with mice were approved by the Vanderbilt University Medical Center Institutional Animal Care and Use Committee. To isolate fibroblasts, the tip of the tail (< 5 mm) of a mouse was minced with a sharp razor blade in 35-mm tissue culture dish containing 2 ml DMEM supplemented with 10 mM HEPES, penicillin/streptomycin, and 2 mg/ml collagenase D. The 2 ml medium with minced tissue was then added to 3 ml identical medium in a 15 ml conical tube, rotated overnight at room temperature. The next day, 5 ml of complete medium (DMEM/F12 + 10% fetal bovine serum + penicillin/streptomycin) was added to the tube, which was mixed by inversion, and the large undigested tissue fragments were allowed to sediment to the bottom of the tube by gravity (20–30 sec). The majority of the supernatant was then pipetted out, placed in a fresh tube, and spun at 900 rpm for 5 min. The supernatant was discarded and the pellet was resuspended into 500 μl of complete medium, which was plated in a 24-well plate for expansion. The total number of passages did not exceed 3 passages.
Transmission electron microscopy –
Pelleted human fibroblasts and mouse intestinal sections were fixed with 2.5% glutaraldehyde in 0.1 M sodium cacodylate buffer, in water for 1 hour at room temperature (RT) and then at 4°C overnight. The Vanderbilt Electron Microscopy core further processed the fibroblast samples by washing them and fixing in 1% osmium tetroxide solution for 1 hour at RT and then with 0.5% osmium for 24 hours. The tissue samples underwent a series of ethanol dehydration steps (50% for 5 min, 75% for 15 min, 95% two times for 15 min, 100% three times for 20 min) before they were embedded in Spurr resin at 60°C for 24 to 48 hours. Semi-thin sections (500 nm) were stained with toluidine blue and examined for positioning. Ultra-thin sections (80 nm) were then stained with uranyl acetate and lead citrate and placed on copper grids. Images were observed using a Philips/FEI T-12 transmission electron microscope
Horseradish peroxidase assay –
Peroxidase activity in cell lysates was determined using the Amplex® red hydrogen peroxide/peroxidase assay kit (Invitrogen, Carlsbad, CA). Briefly, fibroblasts from WT, NKCC1WT/DFX and NKCC1DFX/DFX mice were lysed with a hypotonic lysis buffer (10 mM Tris·HCl pH 7.5) supplemented with protease inhibitors (Roche Applied Science, Indianapolis, IN), and diluted in 1x reaction buffer composed of 28 ml of 0.25 M sodium phosphate at pH 7.4, to a final protein concentration of 5 μg/μl, measured by Biorad protein assay. 50 μl H2O2 mixture (4.45 ml of 1x Reaction Buffer + 500 μl 20 mM H2O2 + 50 μl Amplex® Red reagent) were then added to 50 μl cell lysates placed into individual wells of a 96-well plate. The same amount of mixture was added to 50 μl of a standard curve containing 0, 0.25, 0.5, 1, and 2 mU/ml horse radish peroxidase. Reactions, protected from light, were incubated at RT for 30 min before reading the fluorescence using a microplate reader with excitation at 530–560 nm and emission at 590 nm. Readings were corrected for background fluorescence by subtracting the values derived from the no-HRP control well from the raw fluorescence values. Statistical analysis was performed using one way analysis of variance (ANOVA).
Hydrogen Peroxide Assay –
The amount of hydrogen peroxide in cells was determined using the same red hydrogen peroxide/peroxidase assay kit (Invitrogen). Supernatant was obtained from fibroblasts of WT, NKCC1WT/DFX and NKCC1DFX/DFX mice. 50 μl HRP mixture (4.85 ml of 1x Reaction Buffer + 100 μl HRP stock (10 U/ml) + 50 μl Amplex® Red reagent) were then added to 50 μl of sample placed into individual wells of a 96-well plate. The same amount of mixture was added to 50 μl of a standard curve containing 0, 2, 4, 6, 8, and 10 mM H2O2. Reactions, protected from light, were incubated at RT for 30 min before reading the fluorescence using a microplate reader with excitation at 530–560 nm and emission at 590 nm. Readings were corrected for background fluorescence by subtracting the values derived from the no-HRP control wells from the raw fluorescence values. Statistical analysis was performed using one way analysis of variance (ANOVA).
Quantitative reverse transcription PCR (RT-qPCR) –
Expression of ER-stress markers BiP, Xbp1 and Dcnajc3 was quantitated by RT-qPCR. Fibroblasts were isolated from WT, NKCC1WT/DFX and NKCC1DFX/DFX mice and 20–30 mg tissue was lysed and processed using the RNeasy mini kit (Qiagen). RNA quality and quantity were assessed by measuring absorbance at 260, 280, and 320 nm. Reverse-Transcription was performed by incubating 1 μg RNA with random hexamers, dNTPs, and SuperScript II (Invitrogen), for 1 hour at 37oC, followed by denaturation for 5 min at 95oC. Quantitative PCR reactions contained SYBR™ Green PCR master mix (Applied Biosystems, Foster City, CA), each primer at 40 nM and 1 μl cDNA. mRNA expression is represented as the fold change normalized to WT, calculated using the ΔΔCt method. Statistical analysis was performed using one way analysis of variance (ANOVA).
Primers:
| Target | Forward primer (5’−3’) | Reverse primer (5’−3’) |
|---|---|---|
| Xbp1 | TCAAATGTCCTTCCCCAGAG | AAAGGGAGGCTGGTAAGGAA |
| BiP | TGCAGCAGGACATCAAGTTC | TTTCTTCTGGGGCAAATGTC |
| Dnajc3 | GACAGCTAGCCGACGCCTTA | GTCACCATCAACTGCAGCGT |
| NKCC1 | AGTGGACACCACCAGCAGTACTA | GTGTGCCGGTAGTGGTCGAT |
| GAPDH | AGGTCGGTGTGAACGGATTTG | GGGGTCGTTGATGGCAACA |
RESULTS
Fibroblasts isolated from the NKCC1-DFX patient show increased mitochondrial density
Laboratory tests conducted on the NKCC1-DFX patient muscle cells identified an increase in mitochondrial DNA copy number, compared to normal range (Delpire et al., 2016). Clinical cases of patients suffering from mitochondrial diseases also exhibit an increase in mitochondria number (Pfeffer & Chinnery, 2013). To confirm that the increase in mitochondrial DNA copy number found in the UDP patient was due to the number of mitochondria, we quantified mitochondrial density in fibroblasts isolated from the patient, compared to fibroblasts from two healthy individuals (Figure 1). Fibroblasts from the NKCC1-DFX patient demonstrated an increase in mitochondrial density compared to control human fibroblasts, confirming the patient lab reports. To assess whether this increase was due to the NKCC1 mutation, we used fibroblasts isolated from a mouse model that recapitulates the patient 11 bp deletion in the SLC12A2 (NKCC1) gene. The mice were backcrossed for several generations to C57BL/6J mice to ensure that possible off target events due to CRISPR/cas9 were eliminated through breeding. We measured mitochondrial density in fibroblasts isolated from WT, NKCC1WT/DFX, and NKCC1DFX/DFX mice and observed no difference between the groups (Figure 1C). Thus, mutation of NKCC1 or loss of NKCC1 per se was not enough to explain the patient’s increase in mitochondria number.
Fibroblasts isolated from the NKCC1-DFX patient demonstrate deficits in energy homeostasis
Since an increase in mitochondrial density was observed in the NKCC1-DFX patient fibroblasts, we were interested in investigating whether this increase affected mitochondrial function and glycolysis. Fibroblasts isolated from the patient as well as from two healthy individuals were subjected to seahorse mitochondrial and glycolysis stress tests. The seahorse mitochondrial stress & glycolysis stress tests measure mitochondrial function in cells through the measurement of key parameters such as oxygen consumption rate (OCR) or extracellular acidification rate (ECAR), respectively. The patient fibroblasts demonstrated elevated levels of basal and maximal mitochondrial respiration, as quantified by OCR (Figure 2A, 2B). By measuring the rate of extracellular acidification, we show that the patient fibroblasts demonstrated a significant decrease in glycolysis when compared to control fibroblasts (Figure 2C, 2D). These data indicate that the increased respiration is fueled by a substrate other than glucose.
Figure 2. Human fibroblasts expressing NKCC1-DFX result in elevated mitochondrial respiration and decreased glycolytic respiration.
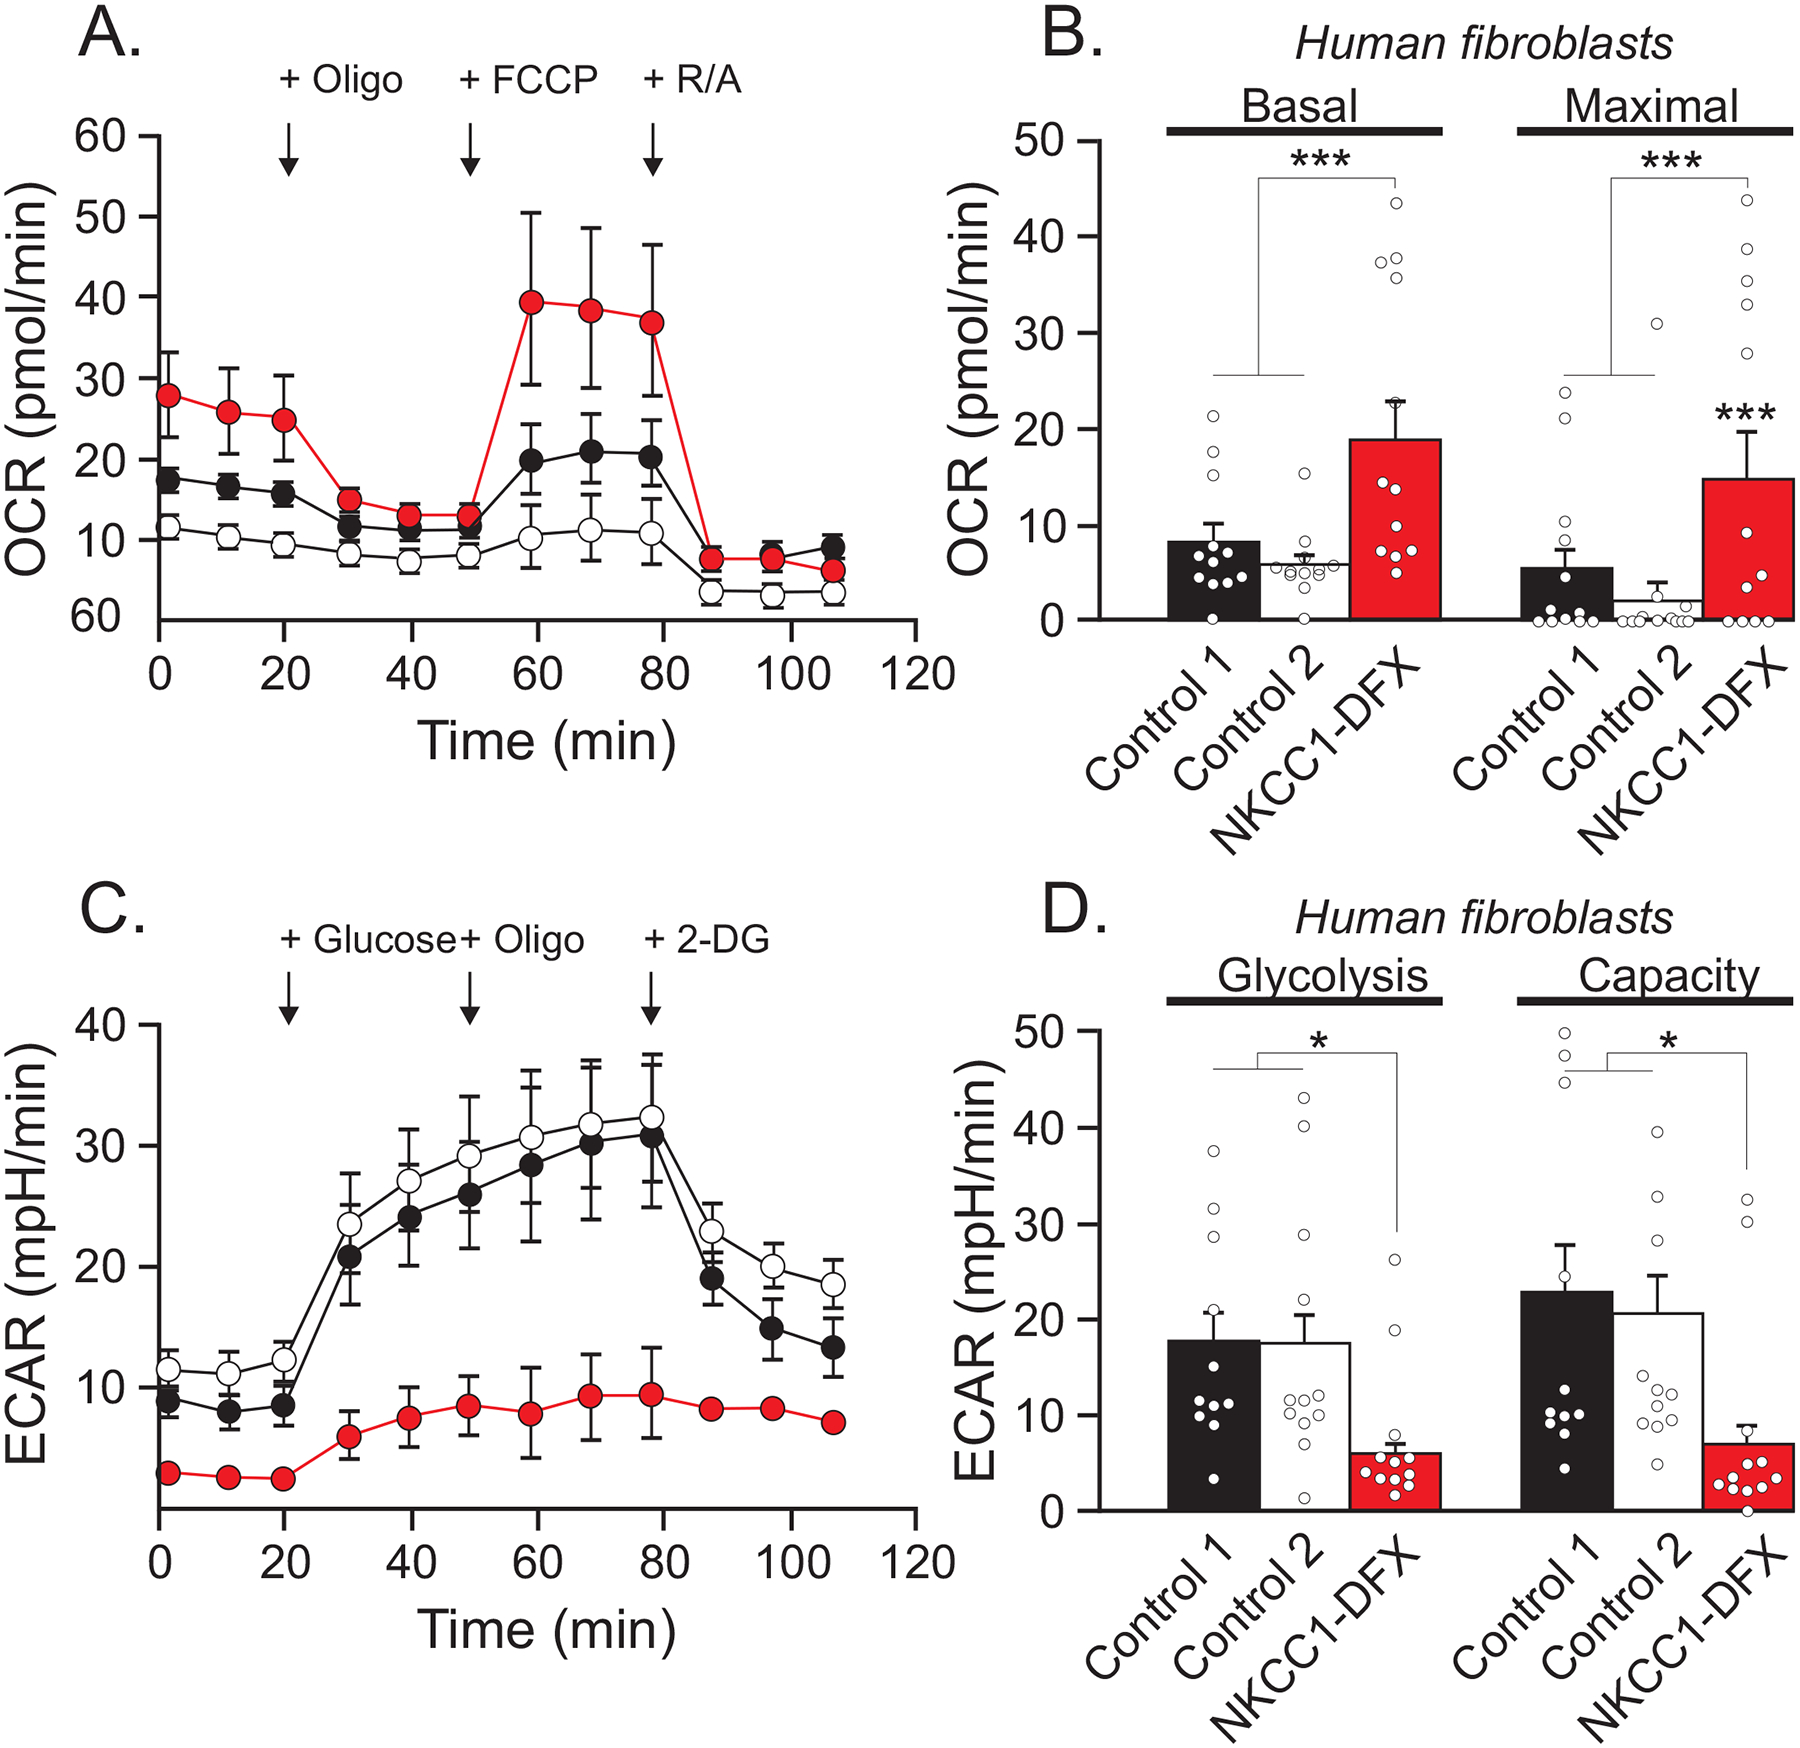
(A) Seahorse assay mitochondrial stress test results for oxygen consumption rate (OCR) of fibroblasts isolated from healthy individuals (black n = 12, and white n = 12) and patient expressing NKCC1-DFX (red n = 12) at 3.5 × 10⁴ cells/well, in real time under basal conditions in response to mitochondrial inhibitors as indicated (oligo = oligomycin injected at 20 min, FCCP injected at 60 min, AA&R = Antimycin and Rotenone injected at 80 min). (B) Basal respiration is the value just before oligomycin injection, and maximal respiration is the highest value after FCCP injection. (C) Cellular glycolytic activity as shown by the Seahorse assay glycolysis stress test in fibroblasts isolated from healthy individuals (n = 12), and patient expressing NKCC1-DFX (n = 12). Extracellular acidification rate (ECAR) was measured in real time under basal conditions in response to sequential use of glucose, oligomycin (to block mitochondrial respiration and force the cells to rely on glycolysis for ATP production), and 2-deoxyglucose (2-DG), a glucose analog and inhibitor of glycolytic ATP production). Glucose is injected at 20 min, oligomycin at 60 min, and 2-DG at 80 min. (D) Quantification of glycolysis (the value after glucose injection) and glycolytic capacity of (the value after oligomycin injection) (C). One-way ANOVA *p < 0.05, ***p < 0.001, ****p < 0.0001.
MDCK cells expressing the non-functional NKCC1 mutation also exhibit increased mitochondrial respiration but no change in glycolysis
Since the patient fibroblasts carry additional mutations, we needed to explore more directly the role of NKCC1 on mitochondrial respiration and glycolysis. In our previous study of NKCC1 polarity and trafficking in epithelial cells, we created MDCK cell lines overexpressing GFP-tagged wild-type and GFP-tagged NKCC1-DFX transporters (Koumangoye, Omer, & Delpire, 2018). The presence of the fluorescent tags did not affect expression, trafficking, and function of the transporter but was useful in visualizing the location of the transporter within cells. We used these cells to conduct mitochondrial stress tests and assess basal respiration and maximal respiration. Cells expressing NKCC1-DFX showed increased basal and maximal respiration relative to untransfected cells, whereas cells overexpressing wild-type NKCC1 did not exhibit such an increase (Figure 3A, 3B). These data indicate that the presence of the mutant transporter affected mitochondrial respiration and it was not a result of protein overexpression per se as this was not observed with overexpression of the wild-type cotransporter. There was no change in glycolysis, as demonstrated from the similar extracellular acidification rates following an increase in the glucose concentration (Figure 3C, 3D).
Figure 3. MDCK cells expressing transfected NKCC1-DFX display increased mitochondrial respiration.
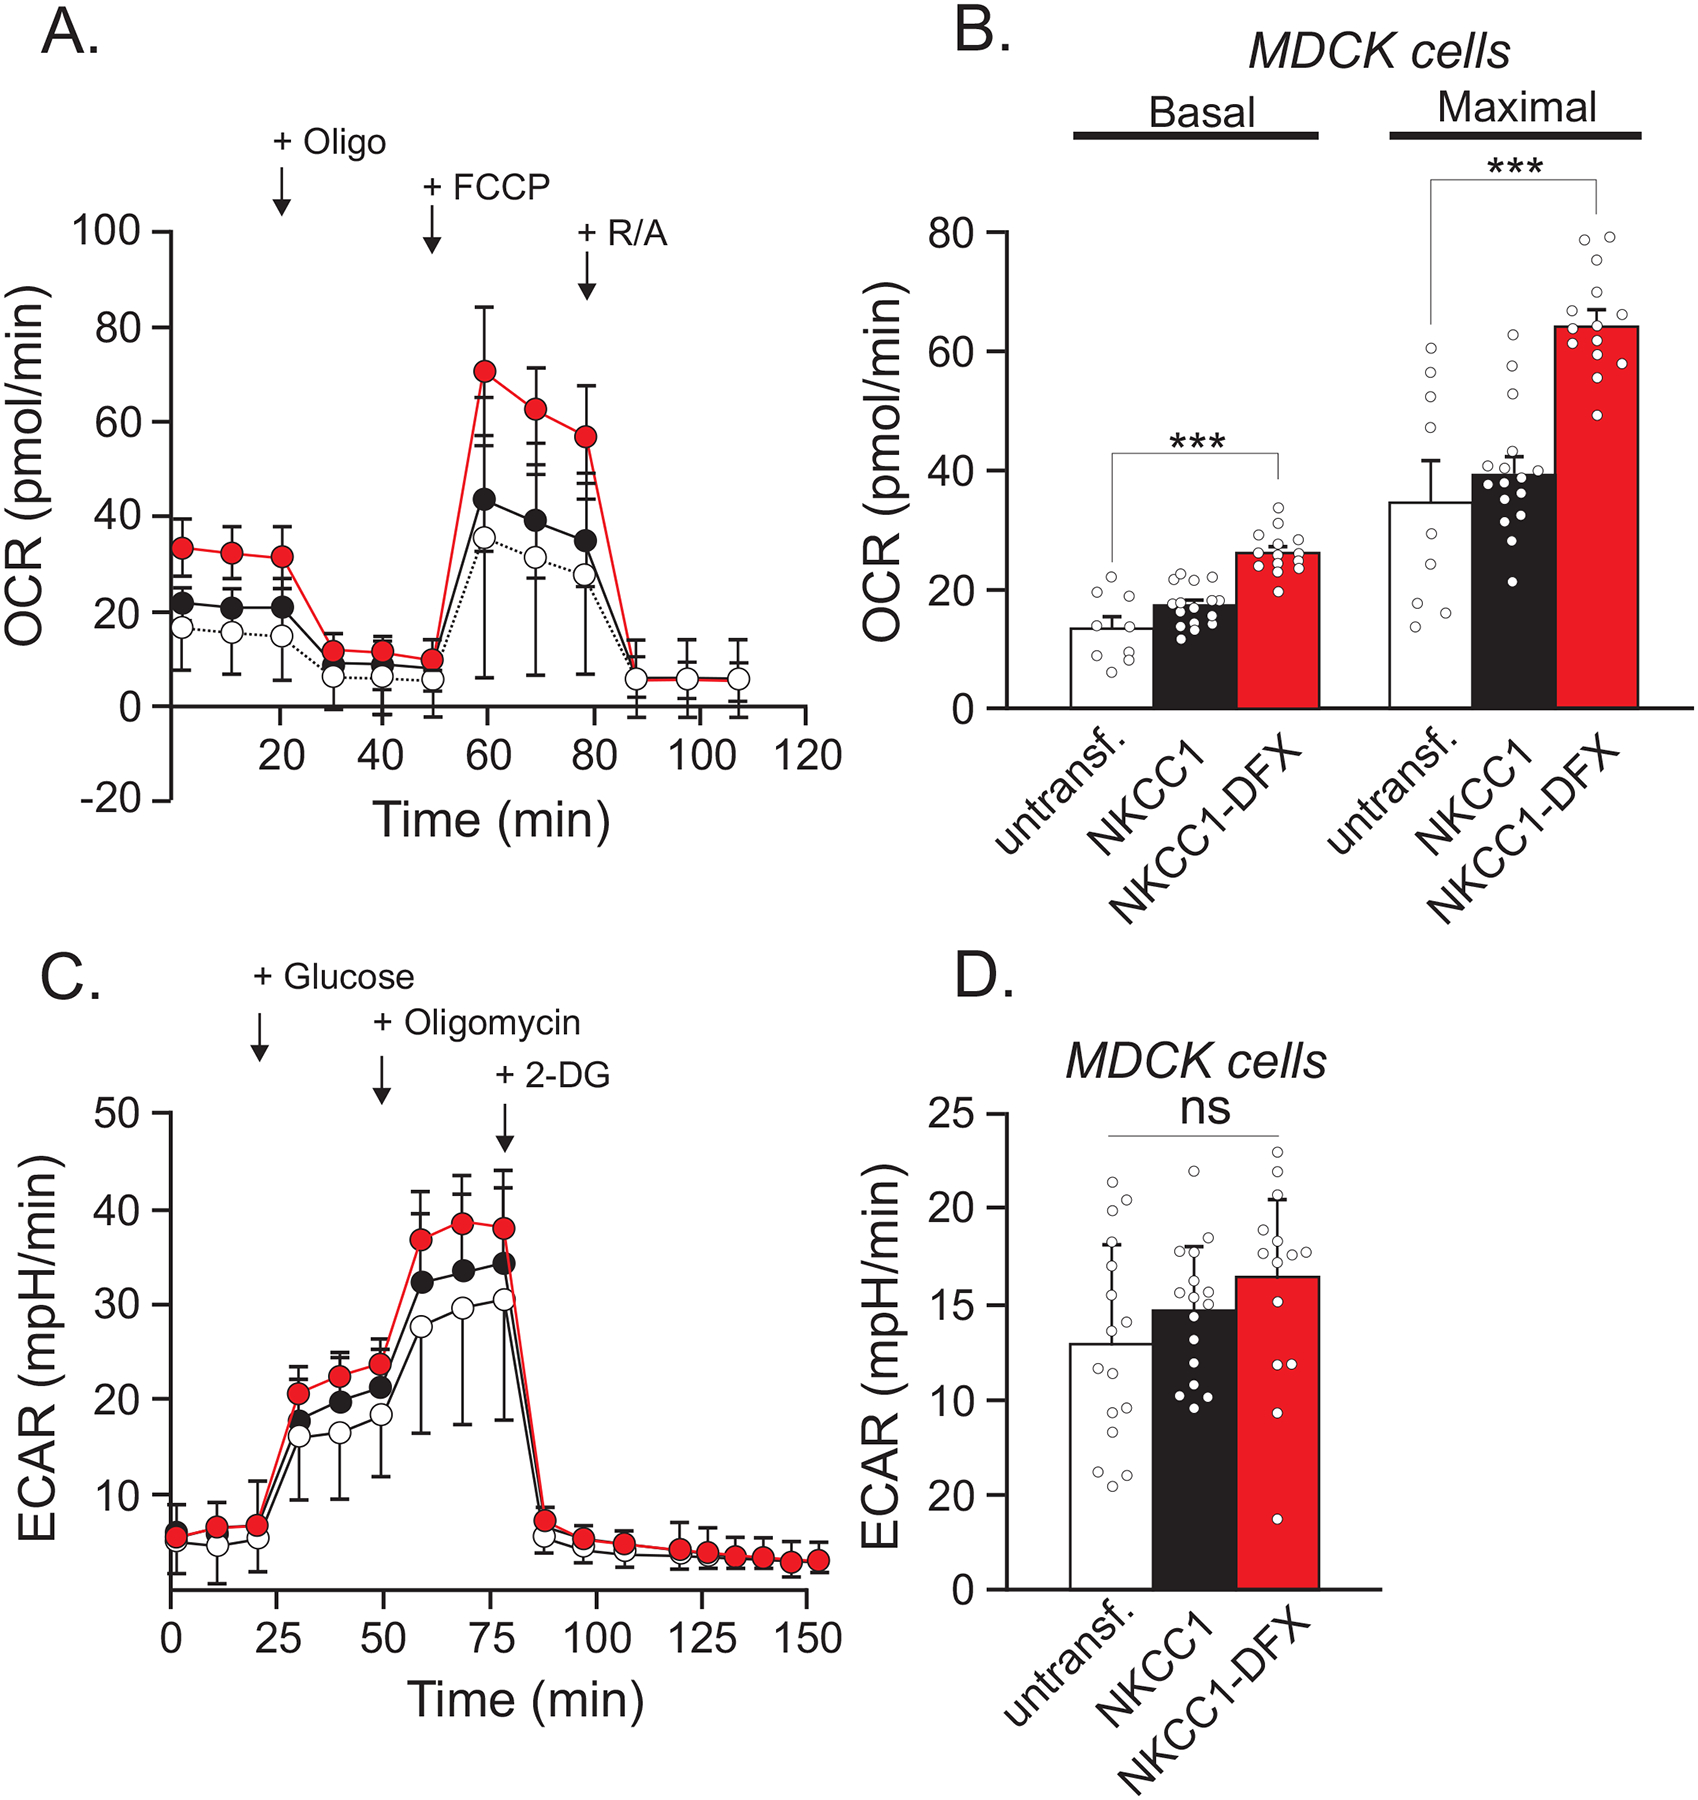
(A) Seahorse assay mitochondrial stress test shows OCR in untransfected MDCK cells (black, n = 10) and MDCK cells transfected with NKCC1-DFX (red, n = 29). (B) Quantification of basal and maximal respiration. (C) Seahorse assay glycolysis stress test in untransfected MDCK cells (white, n = 16), MDCK cells over-expressed with WT NKCC1 (black, n = 16), and MDCK cells expressing NKCC1-DFX (n = 14). (D) Quantification of glycolysis and glycolytic capacity of (C). One-way ANOVA, ***p < 0.001.
Bumetanide treatment does not affect basal mitochondrial respiration or glycolysis
As the patient fibroblasts have reduced NKCC1 activity as well as expression of a mutant protein, we assessed whether the increase in mitochondrial respiration could be attributable to one or both of these factors. Experiments with transfected MDCK cells indicate that expression of the mutant transporter leads to increased mitochondrial respiration. Here, we use a pharmacological approach to assess mitochondrial respiration in MDCK cells treated with a NKCC1-specific inhibitor. Native untransfected MDCK cells were treated with DMSO (vehicle for bumetanide) or DMSO + 20 μM of bumetanide. Upon addition of bumetanide, we observed no change in basal respiration, but a significant increase in maximal respiration, similar to the mitochondrial respiration of MDCK cells overexpressing NKCC1-DFX protein (Figure 4A, 3B). Absence of a change in basal respiration indicates that the cells under bumetanide treatment have no need for additional ATP. The increase in maximal respiration suggests that substrate availability was increased or substrate oxidation upstream of the proton circuit was affected upon addition of bumetanide. The mechanism is unknown. Application of bumetanide also did not affect the rate of acidification induced by addition of glucose, i.e. glycolytic respiration (Figure 4C, D).
Figure 4. Bumetanide leads to an increase in mitochondrial respiration capacity in MDCK cells.
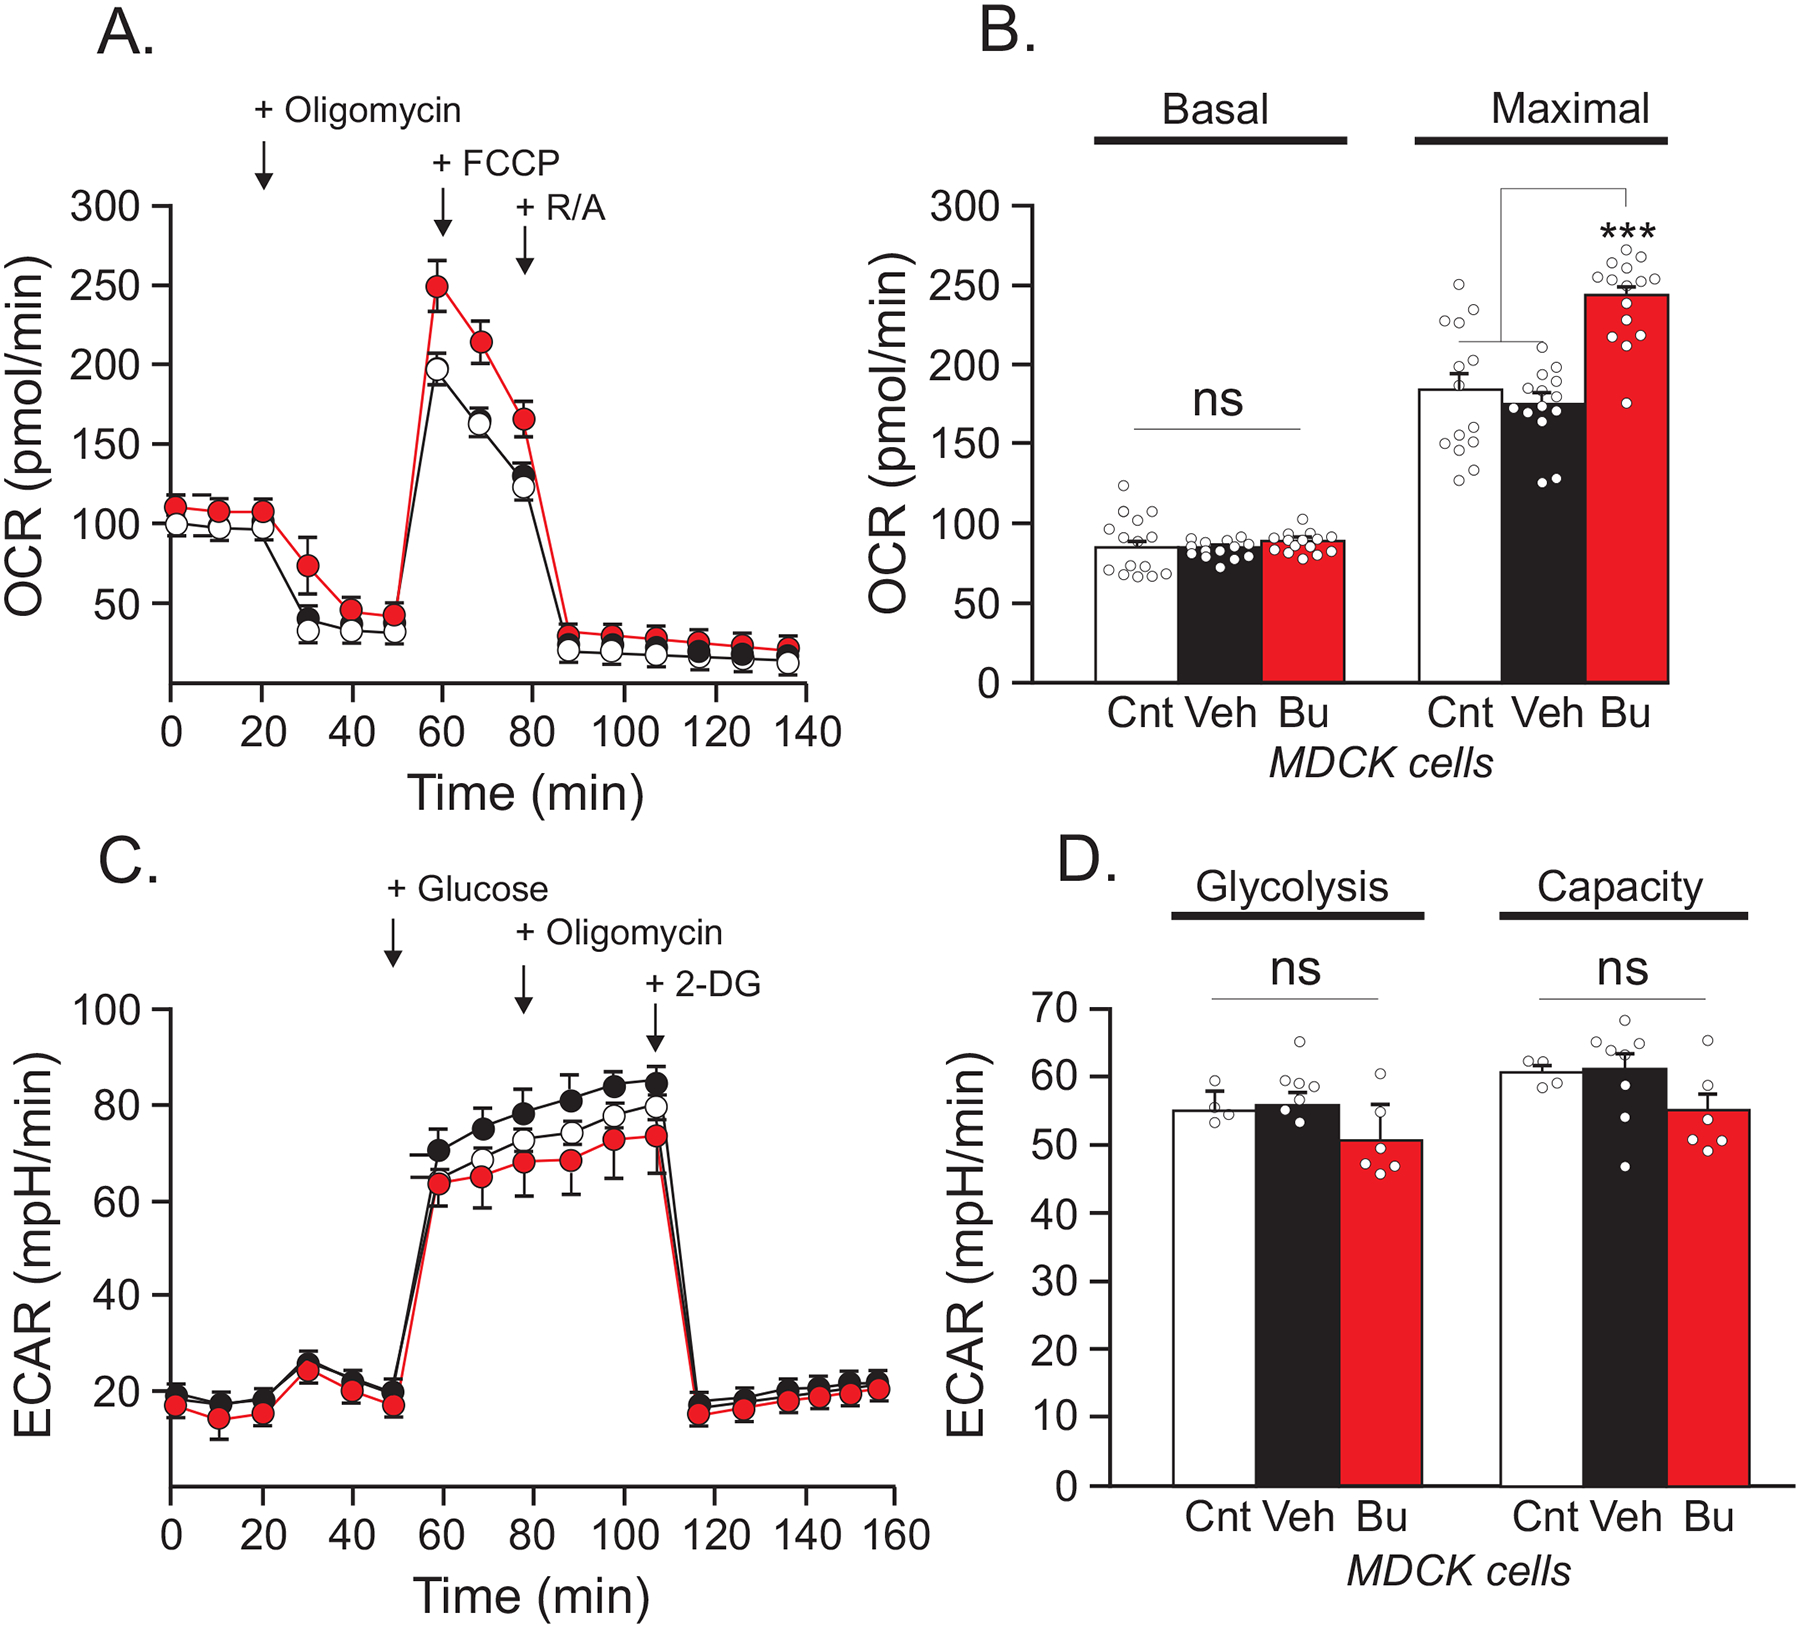
(A) Seahorse assay mitochondrial stress test shows OCR in native untreated MDCK cells (white, n = 14), treated with DMSO as vehicle (black, n = 14), and treated with 20 μM bumetanide (red n = 15). (B) Quantification of basal respiration and maximal respiration. (C) Seahorse assay glycolysis stress test results of untransfected and untreated MDCK cells (white, n = 4), treated with DMSO as vehicle (black, n = 8), and treated with 20 μM bumetanide (red, n = 6). (D) Quantification of glycolysis and glycolytic capacity. One-way ANOVA, ***p < 0.001.
Fibroblasts isolated from NKCC1WT/DFX and NKCC1DFX/DFX also show increased mitochondrial respiration
To further establish the connection between the cotransporter and mitochondrial respiration we also utilized fibroblasts isolated from a mouse model that reproduced the unique mutation in NKCC1 without carrying the additional mutations of the patient (Delpire et al., 2016). Mitochondrial stress tests were performed on fibroblasts isolated from WT, NKCC1WT/DFX, and NKCC1DFX/DFX mice. Fibroblasts expressing mutant NKCC1-DFX also showed increased basal respiration and maximal respiration compared to fibroblasts isolated from wild-type mice (Figure 5). This demonstrated increase was consistent with the increase in mitochondrial respiration that we observed in human fibroblasts. These results therefore suggest that NKCC1-DFX is solely responsible for the increase in mitochondrial respiration observed in the NKCC1-DFX patient fibroblasts.
Figure 5. NKCC1WT/DFX, and NKCC1DFX/DFX mouse fibroblasts display elevated mitochondrial respiration.
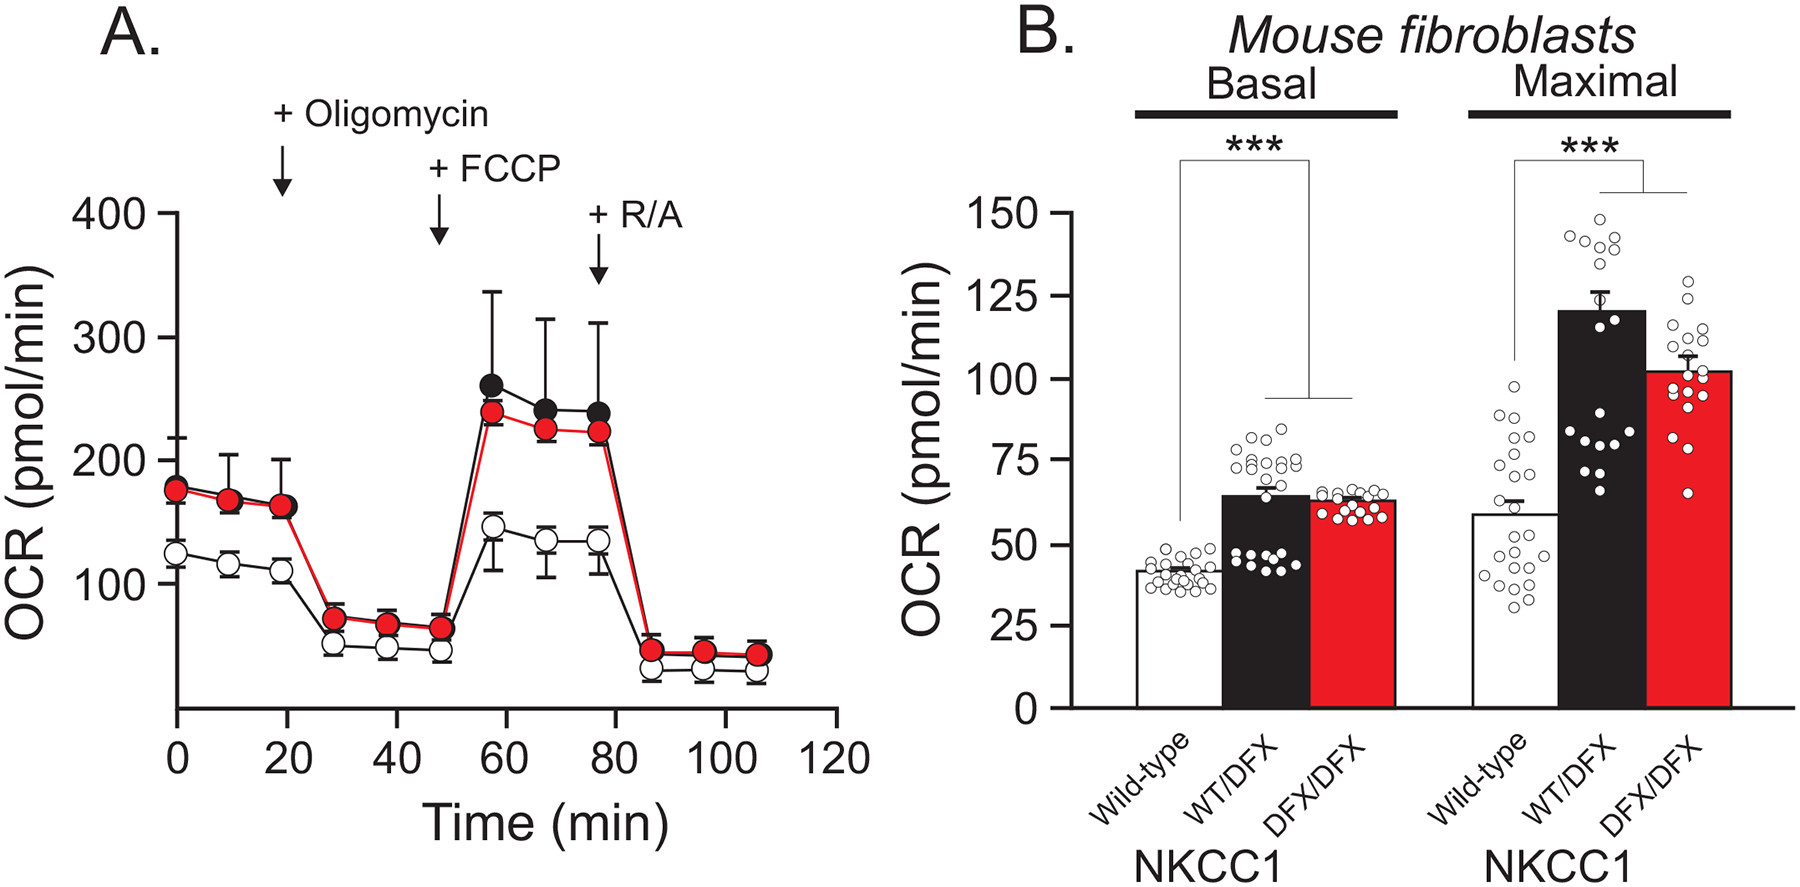
(A) Seahorse assay mitochondrial stress test shows OCR in fibroblasts isolated from WT (white, n = 24), NKCC1WT/DFX(black, n = 26), and NKCC1DFX/DFX (red, n = 19) mice. (B) Quantification of basal and maximal respiration. One-way ANOVA ***p < 0.001, ns = non-significant.
Mouse fibroblasts expressing NKCC1DFX/DFX have increased hydrogen peroxide levels and peroxidase activity
An increase in mitochondrial respiration leads to changes in key cellular functions, including release of reactive oxygen species (ROS) (Brown, 1992, 1995; Chance & Williams, 1955; Murphy, 2009; Wallace, Fan, & Procaccio, 2010). Reactive oxygen species take several forms, such as hydroxyl radicals, superoxide (O2.-), and hydrogen peroxide (H2O2) (Cadenas & Davies, 2000). Excess hydrogen peroxide in cells can lead to an increase in hydroxyl radicals. In turn, peroxidase catalyzes the oxidation of organic compounds using hydrogen peroxide. This chemical reaction can be utilized to investigate the level of hydrogen peroxide present in cells. Both hydrogen peroxide levels and peroxidase activity were measured in fibroblasts isolated from WT, NKCC1WT/DFX, and NKCC1DFX/DFX (Figure 6). Fibroblasts expressing NKCC1DFX/DFX showed an increase in hydrogen peroxide levels as well as peroxidase activity compared to WT and NKCC1WT/DFX fibroblasts. These results indicate that the increase in hydrogen peroxide levels and peroxidase activity cannot be attributed to increased mitochondrial respiration as it was not observed in cells expressing one copy of the mutant transporter, while these cells demonstrated similar increase in mitochondrial respiration.
Figure 6. NKCC1DFX/DFX mouse fibroblasts elicit increase in hydrogen peroxide levels and in peroxidase activity.
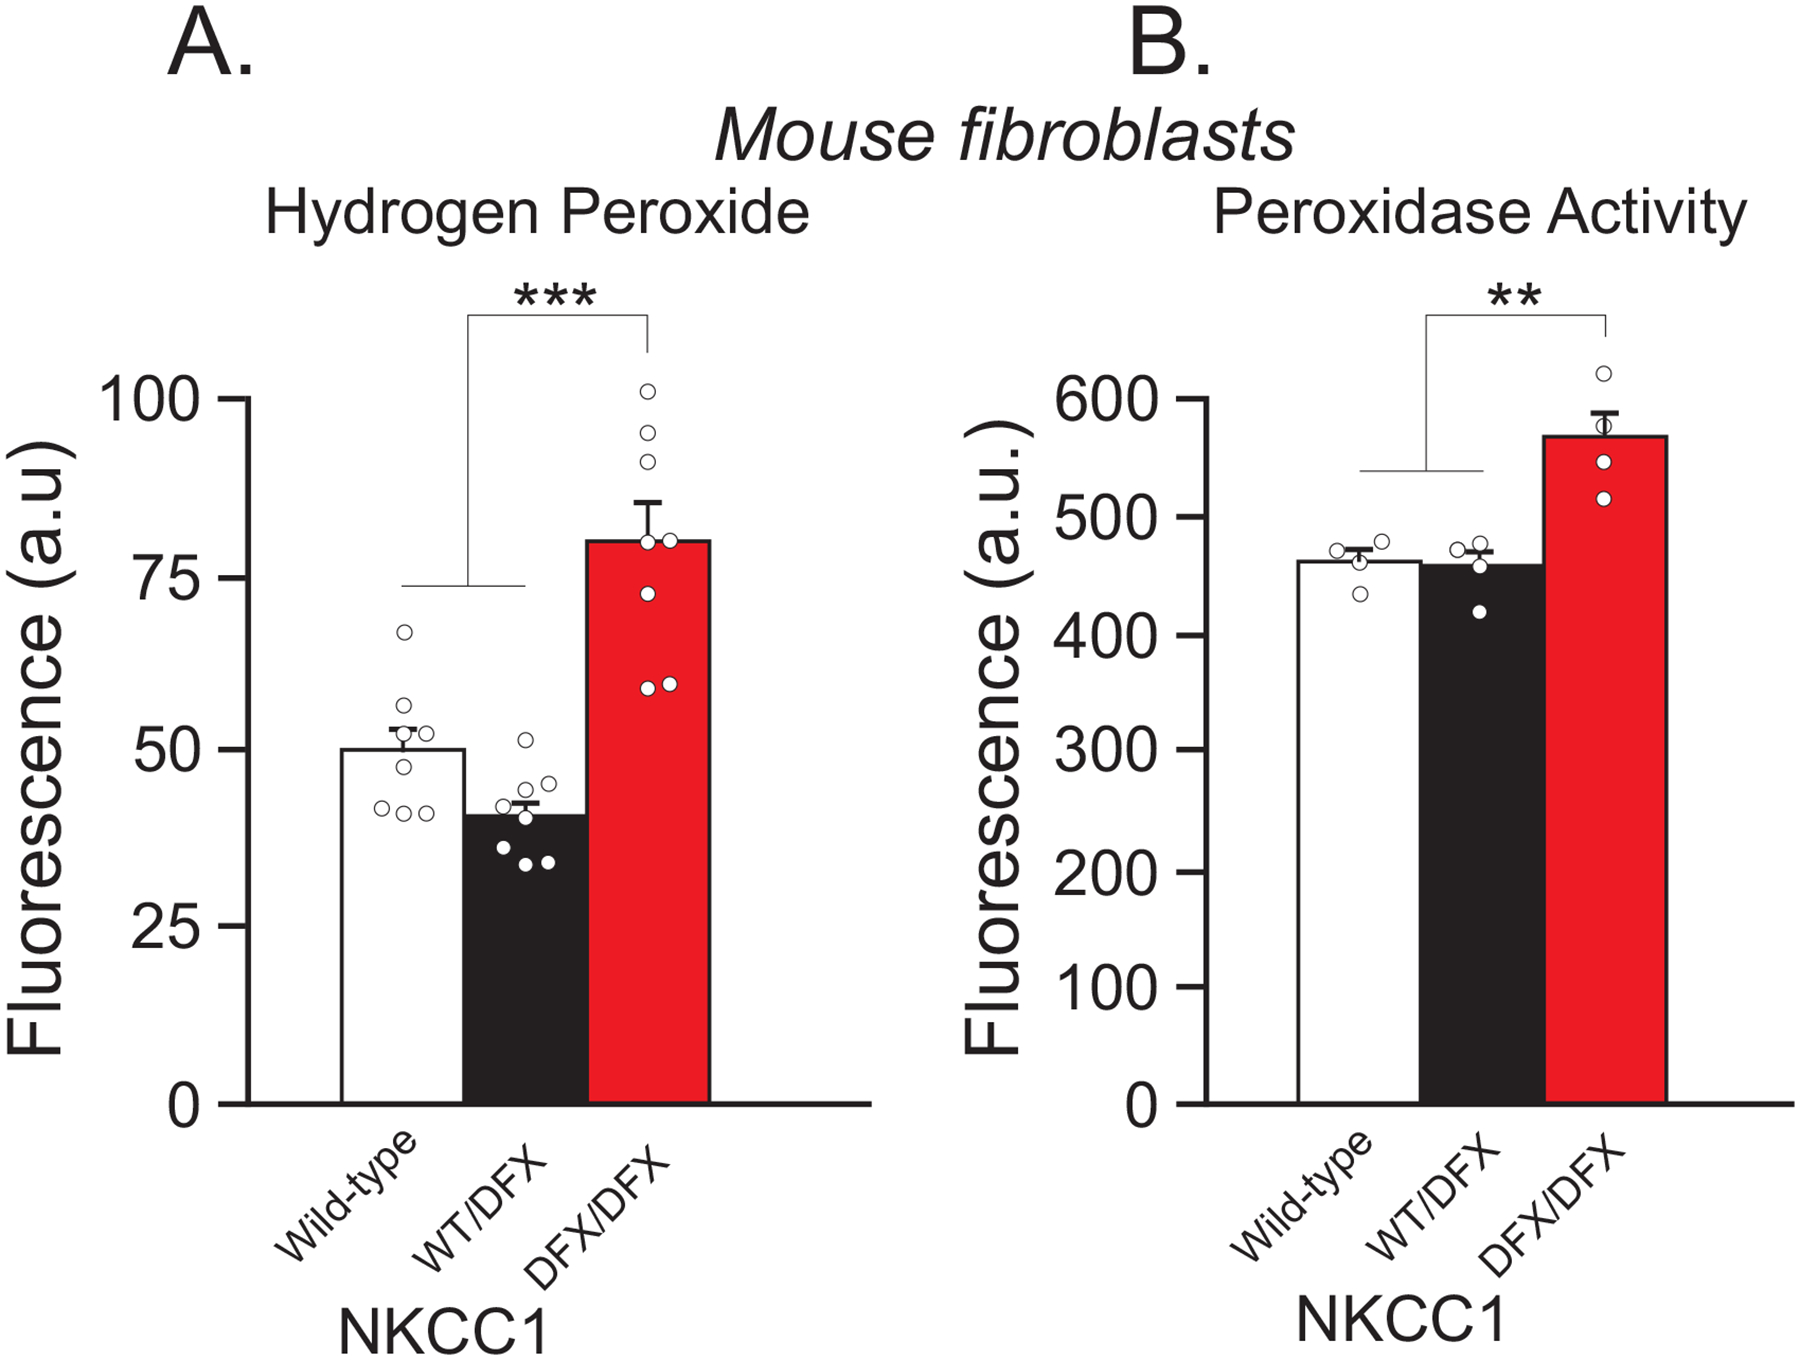
(A) Fluorescence intensity of extracellular hydrogen peroxide of fibroblasts isolated from WT (white, n = 4 wells), NKCC1WT/DFX (black, n = 4 wells), and NKCC1DFX/DFX (red, n = 4 wells) mice. (B) Fluorescence intensity of intracellular peroxidase activity in fibroblasts isolated from WT (white, n = 4 wells), NKCC1WT/DFX (black, n = 4 wells), and NKCC1DFX/DFX (red, n = 4 wells) mice. One-way ANOVA, **p < 0.01, ***p < 0.001.
The NKCC1-DFX mutant allele decreases expression of ER stress proteins
In a previous study, we showed that the NKCC1-DFX protein is cleared from the ER and accumulated in the lysosome (Koumangoye, Omer, & Delpire, 2019). Although the mutant protein was seemingly cleared from the endoplasmic reticulum (ER), we sought to investigate whether its transit through the endoplasmic reticulum led to ER stress. Typically, accumulation of misfolded proteins in the ER causes ER stress leading to the increased expression of a variety of protein involved in the unfolded protein response (UPR) pathway (Bertolotti, Zhang, Hendershot, Harding, & Ron, 2000; Schröder & Kaufman, 2005; Walter & Ron, 2011; Yoshida, Haze, Yanagi, Yura, & Mori, 1998). These proteins are tasked with relieving ER stress through a variety of means. Some proteins serve as chaperones where they assist with proper folding; others clear mis-folded protein aggregates from the ER and send them to the proteasome for degradation; while others prevent further protein synthesis to prevent additional aggregation in the ER (Hetz & Saxena, 2017). The proteins involved in the UPR can be utilized as markers for ER stress, and an elevation of expression in any one or all of these proteins is indicative of ER stress (Estébanez, de Paz, Cuevas, & González-Gallego, 2018). We analyzed the level of mRNA expression of BiP, Dnajc3, and Xbp1 in fibroblasts isolated from WT, NKCC1WT/DFX, and NKCC1DFX/DFX mice (Figure 7). Interestingly, we observed a decrease in mRNA expression of BiP, Dnajc3 and Xbp1 in NKCC1WT/DFX and NKCC1DFX/DFX mouse fibroblasts, compared to wild-type fibroblasts.
Figure 7. mRNA expression of ER stress markers and NKCC1 are decreased in NKCC1WT/DFX, and NKCC1DFX/DFX fibroblasts.
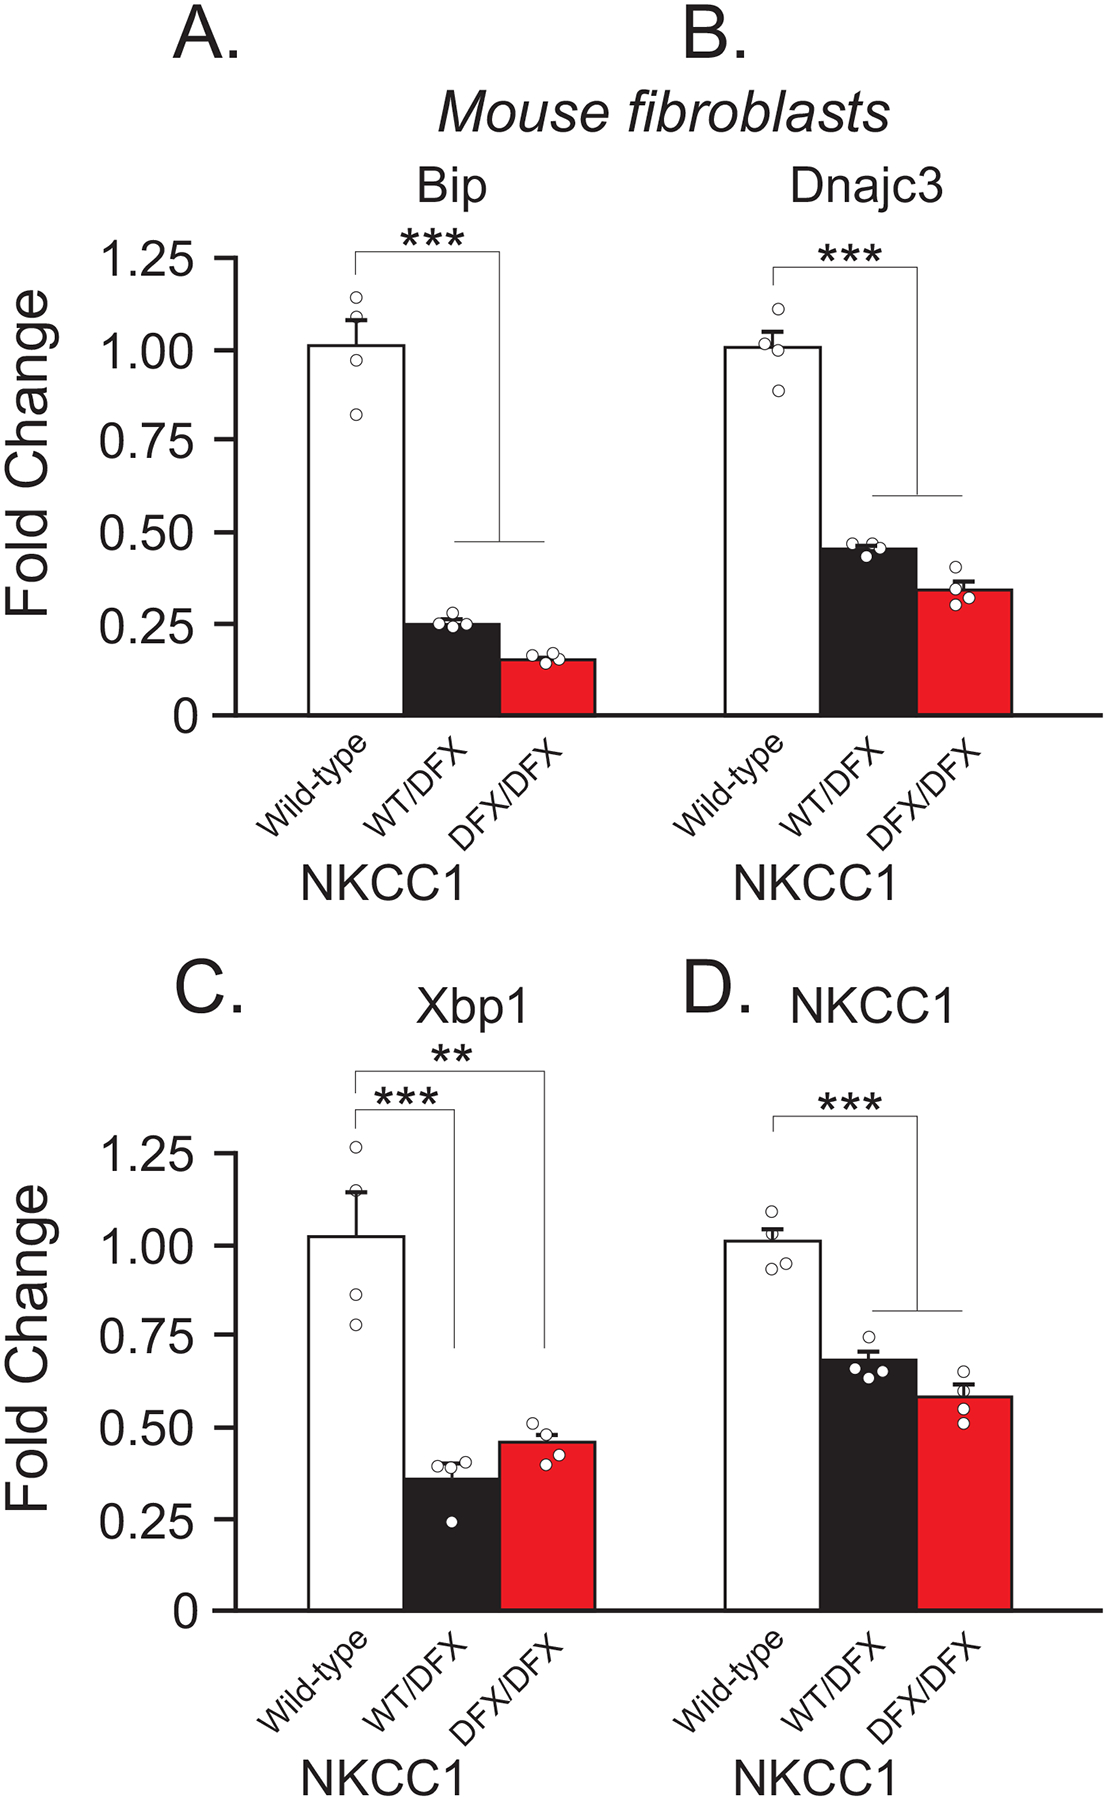
(A-C) Fold change of mRNA expression levels in fibroblasts of WT (white, n = 4), NKCC1WT/DFX(black, n = 4), and NKCC1DFX/DFX (red, n = 4). (D) mRNA expression of NKCC1 in same genotypes. One-way ANOVA **p < 0.01, ***p < 0.001, ns = non-significant. Fold change is normalized to WT and is calculated by the ΔΔCt method.
Expression of NKCC1-DFX alters the morphology of mitochondria in intestinal cells
The effect of NKCC1-DFX on mitochondrial respiration led to the investigation of mitochondrial morphology in cells expressing NKCC1-DFX. We utilized transmission electron microscopy to analyze the morphology of mitochondria in tissues from wild-type, NKCC1WT/DFX, and NKCC1DFX/DFX mice. As indicated in Figure 8, we observed the presence of large dense inclusion bodies in the colon of both mutant mice, compared to wild-type mice. Only droplets of very small sizes were observed in the colon of wild-type mice. Quantitation revealed a significant increase in the number of droplets in mitochondria from heterozygote mice (108/382 mitochondria, 15 fields, 3 mice, P < 0.01) and homozygote mice (125/356, 15, 3, P < 0.001), compared to mitochondria from wild-type mice (59/447, 15, 3). Note that these structures were not present in the mitochondria of fibroblasts isolated from the NKCC1-DFX patient or healthy individuals (Figure 8G–I), indicating that this abnormality might be tissue-specific.
Figure 8. Loss of NKCC1 function alters the morphology of mitochondria.
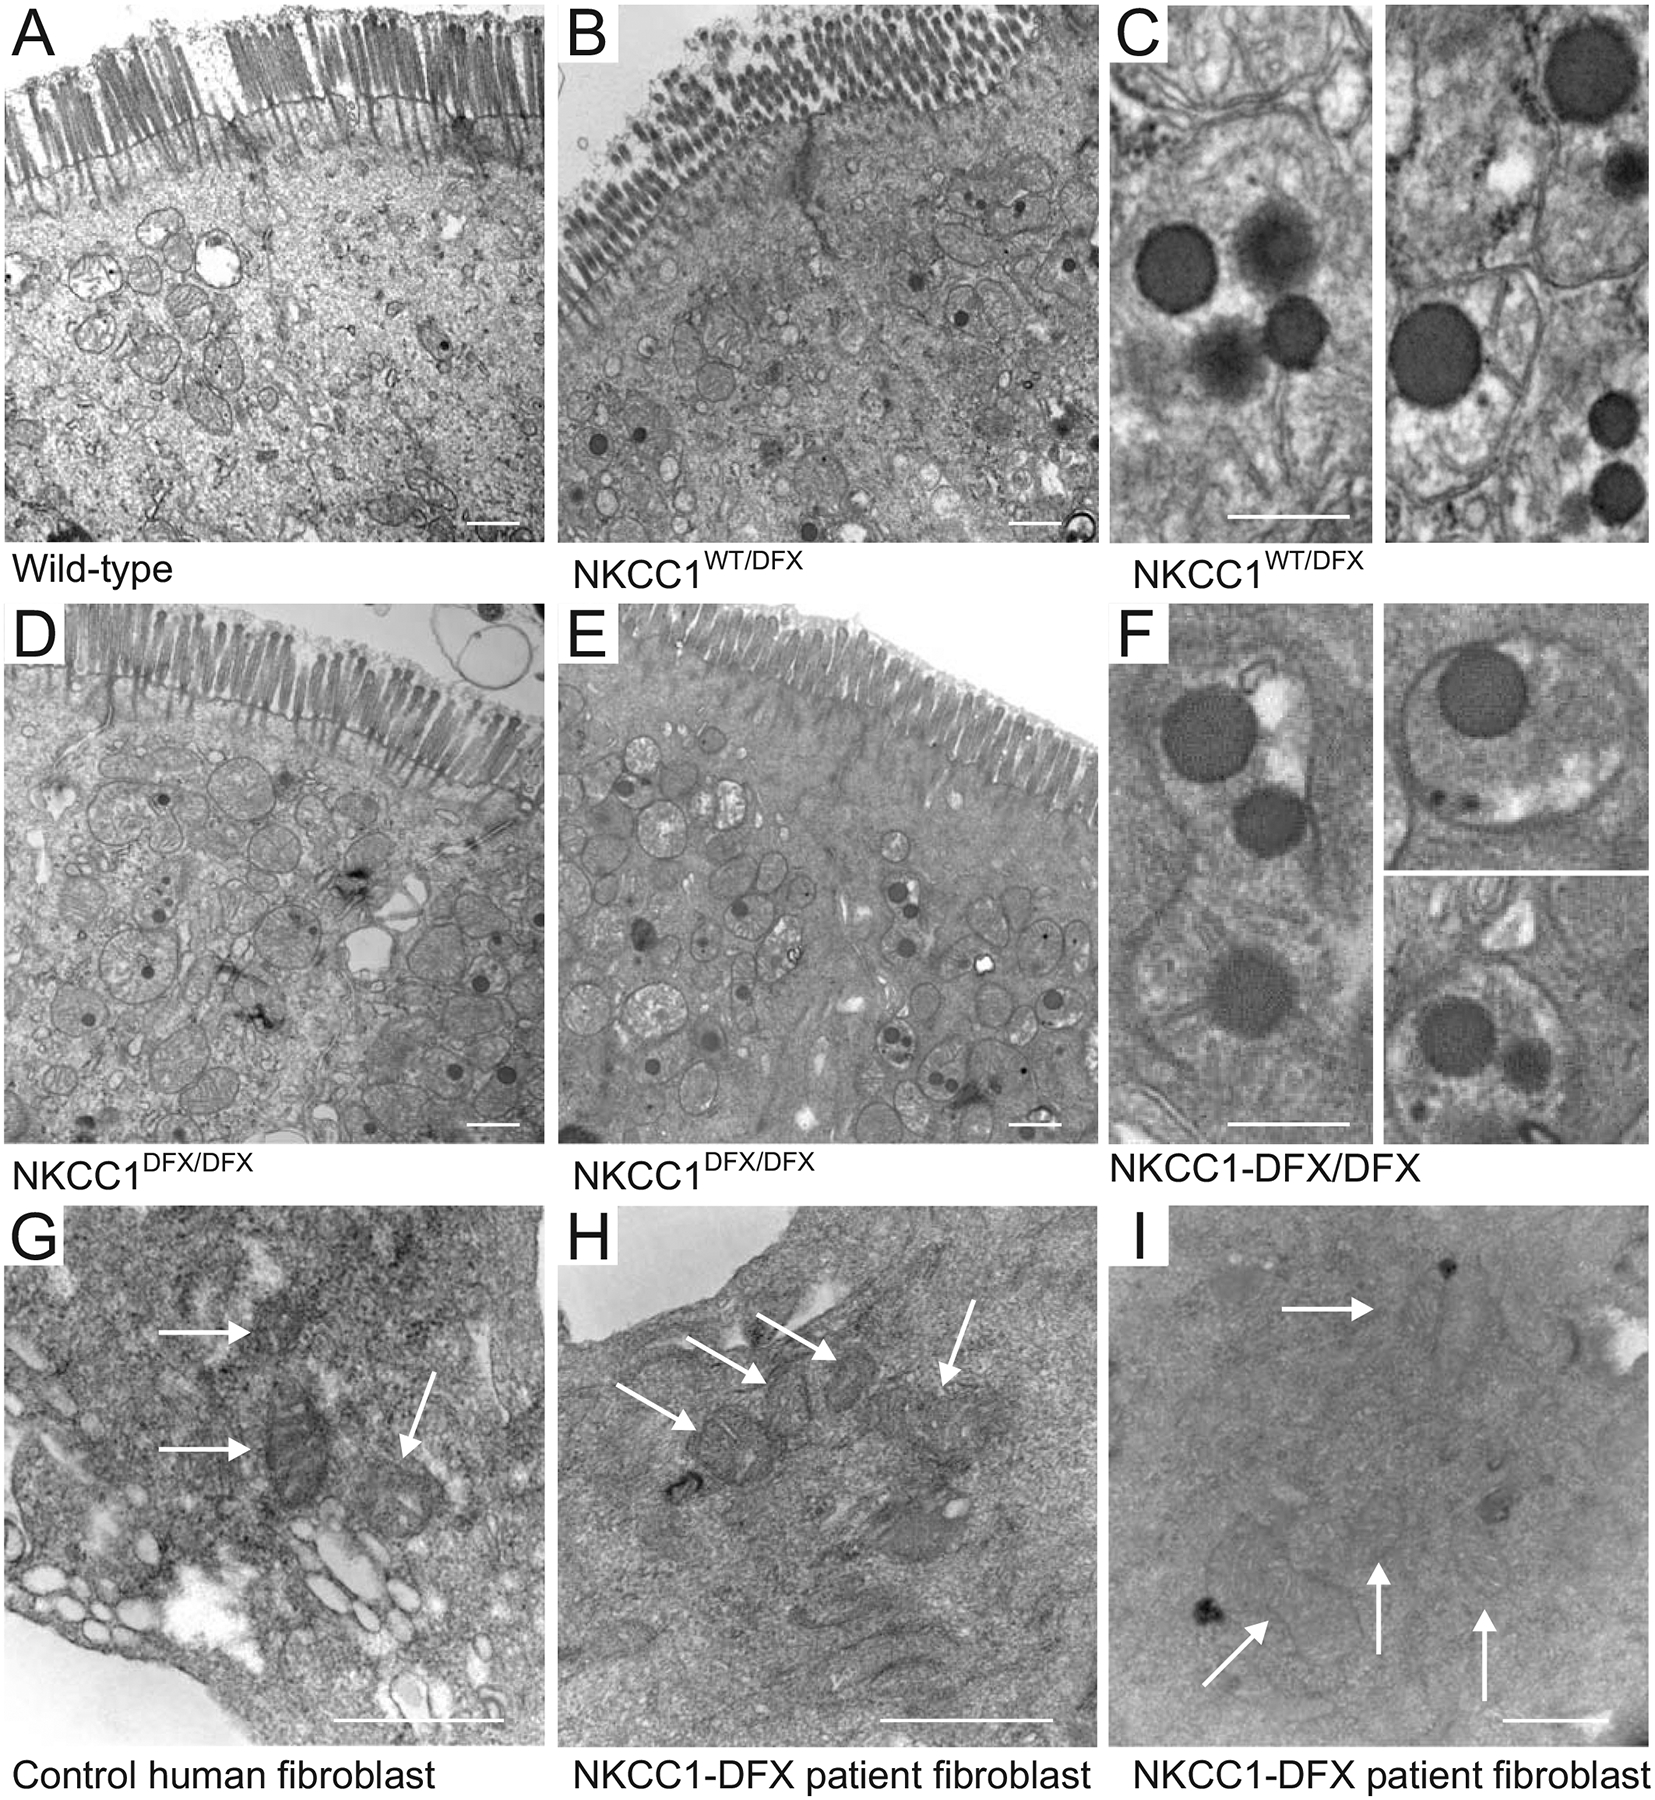
Typical transmission electron microscopy images of (A) WT, (B, C) NKCC1WT/DFX and (D, E and F) NKCC1DFX/DFX mouse colon sections. In this experiment, 3 mice per group and 20–50 micrographs per mouse section were analyzed. Dense inclusion bodies could be seen in panels B (NKCC1WT/DFX) and in D-E (NKCC1DFX/DFX). Bars = 500 μm. Higher magnification of the dense bodies in (C) NKCC1WT/DFX and (F) NKCC1DFX/DFX mouse colon sections. Bars = 250 μm. Electron microscopy images of (G) human fibroblasts from healthy individual, and (H-I) Human patient with NKCC1-DFX mutation. Bars = 500 μm.
DISCUSSION
This study was undertaken to establish a possible connection between the Na-K-2Cl cotransporter, NKCC1, and cellular energy metabolism. As mentioned above, an undiagnosed diseases program patient with a truncation mutation in NKCC1 was first diagnosed with mitochondrial disease. Liver and muscle biopsies revealed increased glycogen levels and mitochondria DNA copy number (173% of the mean value of age and tissue matched controls). The increase in mtDNA content possibly indicated a compensatory amplification due to mitochondrial dysfunction. This was substantiated by her co-enzyme Q10 levels in skeletal muscle, which were 222% of the normal reference mean, and 7.1 standard deviations above the mean. Because the patient carries mutations in additional genes (Delpire et al., 2016), we sought to address directly the role of NKCC1 in the metabolism deficit. Our data clearly establish that the mutation in NKCC1 affects mitochondrial respiration, as expression of the mutant transporter in MDCK cells and mouse fibroblasts resulted in elevated mitochondrial respiration. In contrast, we demonstrated that while the patient fibroblasts have lower glycolysis rates than fibroblasts isolated from control individuals, this difference was not reproduced in our NKCC1 manipulation experiments. The lower glycolysis rate and capacity measured in the patient fibroblasts are consistent with the elevated glycogen levels measured in her muscle and liver cells, as glycolysis leads to the breakdown of glycogen (Delpire et al., 2016). However, as the fibroblasts are isolated and cultured in vitro for several passages, their properties are intrinsic to the cells and therefore no longer dependent of events that occur in other tissues in the patient. Thus, the decrease in glycolysis rate and capacity that we measured in Figure 2 are intrinsic properties of the fibroblasts of the UDP patient. It is unclear why the manipulation of NKCC1 function did not reproduce these findings, but this suggests that the decreased glycolysis is possibly due to other genetic factors. The fact that glycolysis in the patient cells is reduced while mitochondrial respiration is increased suggests that the mitochondria in that case utilize substrates other than glucose. Examples could be long chain fatty acids or glutamine oxidation.
Elevated basal mitochondrial respiration was observed in cells expressing the mutant transporter but not in cells exposed to bumetanide, the cotransporter inhibitor. This indicates that the function of the transporter per se is not linked to mitochondrial respiration. This is consistent with the electroneutral transport function of Na+, K+ and Cl− ions at the plasma membrane of cells, a process that is unrelated to Ca2+ homeostasis. On the other hand, expression of a mutant protein can affect the endoplasmic reticulum of the cell and stimulate the unfolded protein response (UPR). Many studies have shown that mitochondrial respiration is often increased upon UPR activation, thus promoting survival from endoplasmic reticulum stress (Bravo et al., 2011; J. Knupp, P. Arvan, & A. Chang, 2019; Senft & Ronai, 2015). This enhanced mitochondrial respiration is likely due to the release of Ca2+ from the ER and increased influx of the divalent cation in mitochondria (Peng & Jou, 2010).
Expression of a mutant protein, particularly a truncated protein, is anticipated to affect the endoplasmic reticulum (Ellgaard, Molinari, & Hardingham, 1999). In fact, expression of C-terminal truncated NKCC1 was previously shown to result in accumulation of the mutant transporter in the ER (Nezu et al., 2009). In this case, however, to assess trafficking, the mutant transporter was expressed in HEK-293 cells and co-localization with ER markers could have been due to microscopy resolution issues due to HEK293 cells being flat. We recently demonstrated that in polarized MDCK cells, the NKCC1-DFX protein readily clears the ER and is trafficked to the apical plasma membrane, rab5 early endosomes, and lysosomes (Koumangoye, Omer, & Delpire, 2019). As one has to worry that over-expression of mutant proteins in cells might result in ER stress, we did not only measure the effect of expressing the NKCC1-DFX in MDCK cells, but we also measured the effect of mutant transporter in mouse fibroblasts where expression of the transporter is driven by the native slc12a2 (NKCC1) promoter. In both cases, we measured similar increases in mitochondrial respiration (Figures 3 &5). The fact that the transporter clears the ER and proceeds to downstream compartments, does not exclude the fact that the cells might have needed additional energy to process the transporter through the ER.
Increased ER stress is typically demonstrated through the activation of the unfolded protein response and increased expression of a variety of proteins, such as BiP1, Dnac3j, Xbp1 (Gülow, Bienert, & Haas, 2002; Lee, Iwakoshi, & Glimcher, 2003; Yan et al., 2002). BiP is one of the most abundant proteins in the ER where it is the major chaperone (Bakunts et al., 2017). Several studies have identified its role in its recruitment of misfolded proteins in attempts to correct misfolded proteins (Behnke, Feige, & Hendershot, 2015; Hartl, Bracher, & Hayer-Hartl, 2011; Kampinga & Craig, 2010). This recruitment in turn leads to activation of the UPR pathway where BiP has been suggested to act as a direct ER stress sensor. However, consistent with the clearance of NKCC1-DFX from the ER, we did not observe activation of the unfolded protein response in mouse fibroblasts expressing NKCC1-DFX. Instead, we saw a significant decrease in BiP, Xbp1, and Dnac3j mRNA levels. A significant decrease in BiP expression has been observed in the liver of calorie restricted mice as well as mouse embryonic fibroblasts deprived of serum (Pfaffenbach et al., 2012). Similarly, BiP expression is markedly decreased in the liver of diabetic mice (Yamagishi, Ueda, Mori, Saito, & Hatayama, 2012). In a recent paper, Daniela Rotin demonstrated that NKCC1 through an interaction with the leucine transporter LAT1 was a negative regulator of the PI3K/AKT/mTOR pathway in colonic organoids and colon. She showed that suppression of NKCC1 resulted in the activation of Akt, Erk, and mTORC1 (Demian et al., 2019). Thus, there seems to be a relationship between the cotransporter and the PI3K/AKT/mTORC1 pathway. This is relevant because BiP function was also shown to be regulated by the PI3K/AKT/mTORC1 axis, independently of the canonical UPR (Pfaffenbach et al., 2012). Our data showing decreased BiP expression indicate that cells expressing the mutant transporter might be in a state of starvation, which could explain why the NKCC1-DFX patient is in a constant state of fatigue and explain the belief from the physicians treating the patient that her cells behave like starving cells. Additionally, lysosomal degradation is activated during states of cell starvation (Yu et al., 2010; Zhou et al., 2013), consistent with the increase in NKCC1 lysosomal degradation that we observed in MDCK cells (Koumangoye, Omer, & Delpire, 2019), and the measured increased respiration rate that we observed in this study with cells expressing the NKCC1-DFX mutant protein. As glycolysis was not decreased in MDCK cells or in mouse fibroblasts expressing the mutant transporter, we hypothesize that access to glucose is not affected in the cells. This likely means that cells have the capacity to increase their energy production by using energy sources independent of glucose. The fact that fibroblasts isolated from NKCC1DFX/DFX mice but not NKCC1WT/DFX mice show increased hydrogen peroxide production and peroxidase activity while they both demonstrate increase in mitochondrial respiration suggests that the increased ROS measured does not originate in the mitochondria. As we demonstrated previously that NKCC1-DFX accumulates in rab5-positive endosomes and lysosomes (Koumangoye, Omer, & Delpire, 2019), and increased substrate load in lysosomes is known to induce oxidative stress (Martínez-Fábregas et al., 2018), one possible explanation for the increase in hydrogen peroxide production and peroxidase activity would be lysosomal overload in cells expressing NKCC1-DFX from two mutant alleles.
One additional observation that we made by electron microscopy while we were studying intestinal epithelial cells from NKCC1-DFX heterozygote and homozygote mice, was the presence of large electron-dense particles or vesicles within mitochondria. These structures were only seen in very small sizes and lower numbers in the intestine of wild-type animals and not present in fibroblasts of the patient. At this point, we have no information on the composition of these particles, whether they are surrounded by a membrane, and what their role is in mitochondrial function, or whether it is a result of oxidative stress (lipid peroxidation?). These particles, however, have been previously described in the intestinal cells of NLRP6 knockout mice which like the NKCC1-DFX mice (Koumangoye, Omer, Kabeer, & Delpire, 2020) have a deficit in goblet cell-mediated mucus secretion and increased susceptibility to bacterial infection (Wlodarska, Kostic, & Xavier, 2015). These structures might thus be related to the inflammatory response of the epithelium to bacterial infection.
ACKNOWLEDGEMENTS
The sea horse assays were conducted at the VUMC Cell Imaging Shared Resource. Flow cytometry assays were carried out at the VUMC Flow Cytometry Shared Resource Core with the help of David Flaherty. Electron microscopy was performed in part through the use of the VU Cell Imaging Shared (supported by NIH grants CA68485, DK20593, DK58404, DK59637 and EY08126). The authors declare no conflict of interest.
FUNDING
This work was supported by NIH grants GM118944 and DK93501 to E. Delpire.
Research data are not shared.
REFERENCES
- Bakunts A, Orsi A, Vitale M, Cattaneo A, Lari F, Tadè L, … van Anken E. (2017). Ratiometric sensing of BiP-client versus BiP levels by the unfolded protein response determines its signaling amplitude. Elife, 6, e27518. [DOI] [PMC free article] [PubMed] [Google Scholar]
- Behnke J, Feige MJ, & Hendershot LM (2015). BiP and its nucleotide exchange factors Grp170 and Sil1: mechanisms of action and biological functions. J. Mol. Biol, 427(7), 1589–1608. [DOI] [PMC free article] [PubMed] [Google Scholar]
- Bertolotti A, Zhang Y, Hendershot LM, Harding HP, & Ron D (2000). Dynamic interaction of BiP and ER stress transducers in the unfolded-protein response. Nat. Cell Biol, 2(6), 326–332. [DOI] [PubMed] [Google Scholar]
- Bravo R, Vicencio JM, Parra V, Troncoso R, Munoz JP, Bui M, … Lavandero S. (2011). Increased ER-mitochondrial coupling promotes mitochondrial respiration and bioenergetics during early phases of ER stress. J. Cell Sci, 124(P t13), 2143–2152. [DOI] [PMC free article] [PubMed] [Google Scholar]
- Brown GC (1992). Control of respiration and ATP synthesis in mammalian mitochondria and cells. Biochem. J, 284((Pt 1)), 1–13. [DOI] [PMC free article] [PubMed] [Google Scholar]
- Brown GC (1995). Nitric oxide regulates mitochondrial respiration and cell functions by inhibiting cytochrome oxidase. FEBS Lett, 369((2–3)), 136–139. [DOI] [PubMed] [Google Scholar]
- Cadenas E, & Davies KJ (2000). Mitochondrial free radical generation, oxidative stress, and aging. Free Radic Biol Med, 29(3–4), 222–230. [DOI] [PubMed] [Google Scholar]
- Chance B, & Williams GR (1955). Respiratory enzymes in oxidative phosphorylation. III The steady state. J. Biol. Chem, 217(1), 409–427. [PubMed] [Google Scholar]
- Delpire E, Wolfe L, Flores B, Koumangoye R, Schornak CC, Omer S, … Adams DR. (2016). A patient with multisystem dysfunction carries a truncation mutation in human SLC12A2, the gene encoding the Na-K-2Cl cotransporter, NKCC1. Cold Spring Harb. Mol. Case Studies, 2, a001289. [DOI] [PMC free article] [PubMed] [Google Scholar]
- Demian WL, Persaud A, Jiang C, Coyaud É, Liu S, Kapus A, … Rotin D. (2019). The Ion Transporter NKCC1 Links Cell Volume to Cell Mass Regulation by Suppressing mTORC1. Cell Rep ., 27(6), 1886–1896. [DOI] [PubMed] [Google Scholar]
- Ellgaard L, Molinari M, & Hardingham TE (1999). Setting the Standards: Quality Control in the Secretory Pathway. Science, 286, 1882–1888. [DOI] [PubMed] [Google Scholar]
- Estébanez B, de Paz JA, Cuevas MJ, & González-Gallego J (2018). Endoplasmic Reticulum Unfolded Protein Response, Aging and Exercise: An Update. Front. Physiol., 9, 1744. [DOI] [PMC free article] [PubMed] [Google Scholar]
- Gagnon KB, England R, & Delpire E (2006). Volume sensitivity of cation-chloride cotransporters is modulated by the interaction of two kinases: SPAK and WNK4. Am. J. Physiol. Cell Physiol, 290, C134–C142. [DOI] [PubMed] [Google Scholar]
- Gülow K, Bienert D, & Haas IG (2002). BiP is feed-back regulated by control of protein translation efficiency. J. Cell. Sci, 115(Pt 11), 2443–2452. [DOI] [PubMed] [Google Scholar]
- Hartl FU, Bracher A, & Hayer-Hartl M (2011). Molecular chaperones in protein folding and proteostasis. Nature, 475(7356), 324–332. [DOI] [PubMed] [Google Scholar]
- Hetz C, & Saxena S (2017). ER stress and the unfolded protein response in neurodegeneration. Nat. Rev. Neurol, 13(8), 477–491. [DOI] [PubMed] [Google Scholar]
- Kampinga HH, & Craig EA (2010). The HSP70 chaperone machinery: J proteins as drivers of functional specificity. Nat. Rev. Mol. Cell. Biol, 11(8), 579–592. [DOI] [PMC free article] [PubMed] [Google Scholar]
- Knupp J, Arvan P, & Chang A (2019). Increased mitochondrial respiration promotes survival from endoplasmic reticulum stress. Cell Death & Differentiation, 26, 487–501. [DOI] [PMC free article] [PubMed] [Google Scholar]
- Knupp J, Arvan P, & Chang A (2019). Increased mitochondrial respiration promotes survival from endoplasmic reticulum stress. Cell Death & Differentiation, 26(487–501). [DOI] [PMC free article] [PubMed] [Google Scholar]
- Koumangoye R, Omer S, & Delpire E (2018). Mistargeting of a truncated Na-K-2Cl cotransporter in epithelial cells. Am. J. Physiol. Cell Physiol, 315(2), C258–C276. [DOI] [PMC free article] [PubMed] [Google Scholar]
- Koumangoye R, Omer S, & Delpire E (2019). A dileucine motif in the C-terminal domain of NKCC1 targets the cotransporter to the plasma membrane. Am. J. Physiol. Cell Physiol, 316(4), C545–C558. [DOI] [PMC free article] [PubMed] [Google Scholar]
- Koumangoye R, Omer S, Kabeer MH, & Delpire E (2020). Novel human NKCC1 mutations cause defects in goblet cells mucus secretion and chronic inflammation Cell. Mol. Gastroenterol. Hepatol, Submitted. [DOI] [PMC free article] [PubMed] [Google Scholar]
- Lee AH, Iwakoshi NN, & Glimcher LH (2003). XBP-1 regulates a subset of endoplasmic reticulum resident chaperone genes in the unfolded protein response. Mol. Cell. Biol, 23(21), 7448–7459. [DOI] [PMC free article] [PubMed] [Google Scholar]
- Martínez-Fábregas J, Prescott A, van Kasteren S, Pedrioli DL, McLean I, Moles A, … Watts C. (2018). Lysosomal protease deficiency or substrate overload induces an oxidative-stress mediated STAT3-dependent pathway of lysosomal homeostasis. Nature Commun, 9, 5343. [DOI] [PMC free article] [PubMed] [Google Scholar]
- Murphy MP (2009). How mitochondria produce reactive oxygen species. Biochem. J, 417(Pt. 1), 1–13. [DOI] [PMC free article] [PubMed] [Google Scholar]
- Nezu A, Parvin MN, & Turner RJ (2009). A conserved hydrophobic tetrad near the C terminus of the secretory Na+-K+−2Cl- cotransporter (NKCC1) is required for its correct intracellular processing. J. Biol. Chem, 284(11), 6869–6876. [DOI] [PMC free article] [PubMed] [Google Scholar]
- Peng TI, & Jou MJ (2010). Oxidative stress caused by mitochondrial calcium overload. Ann. N.Y. Acad. Sci, 1201, 183–188. [DOI] [PubMed] [Google Scholar]
- Pfaffenbach KT, Pong M, Morgan TE, Wang H, Ott K, Zhou B, … Lee AS. (2012). GRP78/BiP is a novel downstream target of IGF-1 receptor mediated signaling. J. Cell Physiol, 227(12), 3803–3811. [DOI] [PMC free article] [PubMed] [Google Scholar]
- Pfeffer G, & Chinnery PF (2013). Diagnosis and treatment of mitochondrial myopathies. Ann. Med, 45(1), 4–16. [DOI] [PMC free article] [PubMed] [Google Scholar]
- Schröder M, & Kaufman RJ (2005). The mammalian unfolded protein response. Annu. Rev. Biochem, 74(739–789). [DOI] [PubMed] [Google Scholar]
- Senft D, & Ronai ZA (2015). UPR, autophagy, and mitochondria crosstalk underlies the ER stress response. Trends Biochem Sci, 40(3), 141–148 [DOI] [PMC free article] [PubMed] [Google Scholar]
- Wallace DC, Fan W, & Procaccio V (2010). Mitochondrial energetics and therapeutics. Annu. Rev. Pathol, 5, 297–348. [DOI] [PMC free article] [PubMed] [Google Scholar]
- Walter P, & Ron D (2011). The unfolded protein response: from stress pathway to homeostatic regulation. Science, 334, 1081–1086. [DOI] [PubMed] [Google Scholar]
- Wlodarska M, Kostic AD, & Xavier RJ (2015). An integrative view of microbiome-host interactions in inflammatory bowel diseases. Cell Host Microbe, 17(5), 577–591. [DOI] [PMC free article] [PubMed] [Google Scholar]
- Yamagishi N, Ueda T, Mori A, Saito Y, & Hatayama T (2012). Decreased expression of endoplasmic reticulum chaperone GRP78 in liver of diabetic mice. Biochem. Biophys. Res. Commun, 417(1), 364–370. [DOI] [PubMed] [Google Scholar]
- Yan W, Frank CL, Korth MJ, Sopher BL, Novoa I, Ron D, & Katze MG (2002). Control of PERK eIF2alpha kinase activity by the endoplasmic reticulum stress-induced molecular chaperone P58IPK. Proc. Natl. Acad. Sci. USA, 99(25), 15920–15925. [DOI] [PMC free article] [PubMed] [Google Scholar]
- Yoshida H, Haze K, Yanagi H, Yura T, & Mori K (1998). Identification of the cis-acting endoplasmic reticulum stress response element responsible for transcriptional induction of mammalian glucose-regulated proteins. Involvement of basic leucine zipper transcription factors. J. Biol. Chem, 273(50), 33741–33749. [DOI] [PubMed] [Google Scholar]
- Yu L, McPhee CK, Zheng L, Mardones GA, Rong Y, Peng J, … Lenardo MJ. (2010). Termination of autophagy and reformation of lysosomes regulated by mTOR. Nature, 465(7300), 942–946. [DOI] [PMC free article] [PubMed] [Google Scholar]
- Zhou J, Tan SH, Nicolas V, Bauvy C, Yang ND, Zhang J, … Shen HM. (2013). Activation of lysosomal function in the course of autophagy via mTORC1 suppression and autophagosome-lysosome fusion. Cell Res, 23(4), 508–523. [DOI] [PMC free article] [PubMed] [Google Scholar]