

Abstract
Mechanism-based strategies to overcome resistance to programmed cell death-1 (PD-1) blockade therapy are urgently needed. We developed genetic acquired resistant models of JAK1, JAK2 and B2M loss of function mutations by gene knockout in human and murine cell lines. Human melanoma cell lines with JAK1/2 knockout became insensitive to interferon (IFN)-induced antitumor effects, while B2M knockout were no longer recognized by antigen-specific T cells and hence resistant to cytotoxicity. All of these mutations led to resistance to anti-PD-1 therapy in vivo. JAK1/2 knockout resistance could be overcome with the activation of innate and adaptive immunity by intratumoral Toll-like receptor 9 (TLR9) agonist administration together with anti-PD-1, mediated by natural killer (NK) and CD8 T cells. B2M knockout resistance could be overcome by NK and CD4 T cell activation using the CD122 preferential interleukin 2 (IL-2) agonist bempegaldesleukin. Therefore, mechanistically-designed combination therapies can overcome genetic resistance to PD-1 blockade therapy.
Introduction
Therapeutic efficacy of blocking negative immune regulation through the PD-1 checkpoint is limited by primary and acquired resistance (1–3). Understanding the underlying mechanisms of resistance may allow rational design of combinatorial therapies to overcome resistance. There is emerging data pointing to the loss of function mutations in the Janus kinases 1 (JAK1) and 2 (JAK2) from the IFN signaling pathway, and in beta-2-microglobulin (B2M) from the antigen presentation pathway in patients who become resistant to immune checkpoint blockade therapy (4–10). The frequency of such mutations is low in the limited studies to date (11,12), but these are defined mechanisms that provide biological evidence of how cancer cells try to escape from the antitumor immune response induced by anti-PD-1/L1 therapies. Furthermore, five preclinical models based on CRISPR screens to study mechanisms of cancer escape from immune response also point to alterations in the antigen presenting machinery and IFN signaling as the two dominant pathways involved in resistance (13–17). We acknowledge that the biology of these loss of function mutations is not straightforward, as several well-documented cases of patients with metastatic melanoma with B2M mutations at baseline were reported to respond to anti-PD-1 or anti-CTLA4 therapy (9,18–21). In addition, it is envisioned that a subset of cases with primary and acquired resistance to PD-1 blockade therapy can obtain the similar resistant phenotypes through epigenetic changes in the same pathways, which are harder to study in patient-derived biopsies (1,21–23). Based on this knowledge, we postulate that the full mechanistic understanding of these genetic acquired resistance mutations will allow the design of strategies aimed to overcome resistance.
The convergence of data on the IFN-gamma receptor-signaling pathway suggests that the use of combinatorial approaches to re-activate the IFN pathway could overcome resistance driven by JAK mutations (24). For instance, Toll-like receptor 9 (TLR9) agonists that mimic bacterial DNA sequences stimulate both innate and adaptive immune responses by inducing the production of type I IFNs, in particular by plasmacytoid dendritic cells, a cell type with exquisite sensitivity to TLR9 agonists (25). On the other hand, it is well-known that MHC class I-deficient tumors are susceptible to NK cell-dependent cytotoxicity (26–28). Without B2M on the tumor cell surface, HLA-class I molecules are not stable and unable to present antigen to CD8+ T cells. Hence, NK cells may be activated to recognize “missing self” (27).
To define the IFN signaling and antigen presentation mechanisms of resistance by JAK1, JAK2 and B2M loss of function mutations, we developed in vitro and in vivo models and studied the biological significance of these mutations leading to resistance to PD-1 blockade therapy. Using CRISPR/Cas9 genome editing, we created sublines lacking JAK1, JAK2 and B2M expression in four human melanoma cell lines and in the murine MC38 colon carcinoma, which is a well-characterized model with high mutational burden that responds well to anti-PD-1 therapy (29,30), and validated key results in the widely used primary anti-PD-1 blockade-resistant B16 murine melanoma model (29). Based on the molecular understanding of these pathways, we hypothesized that a TLR9 agonist could initiate a potent type I IFN systemic response overcoming anti-PD-1 resistance in JAK1/2 deficient models and that a CD122 preferential IL-2 pathway agonist could overcome resistance in B2M deficient tumors by enhancing NK and CD4 T cell antitumor activity.
Results
Functional effects of JAK1/2 and B2M knockout mutations in human melanoma cell lines
We generated and validated JAK1 and JAK2 knockout sublines of four human melanoma cell lines (M202, M233, M407 and M420), and B2M knockout sublines of two human melanoma cell lines (M202 and M233) using CRISPR/Cas9 gene editing (Figure S1 and S2A). Next, we characterized the biology of JAK1/2 knockout cells in terms of response to IFN-alpha, -beta and -gamma stimulation. Three of these four parental melanoma cell lines showed growth inhibition in response to direct in vitro treatment with the three IFNs, while M202 was mostly resistant with only a small amount of growth inhibition with IFN-beta. All JAK1 knockout sublines were insensitive to all three IFNs, which is in line with the role that JAK1 plays in signaling downstream of both type I and II IFN receptors (31). As expected, since JAK2 is only involved in type II IFN receptor signaling, JAK2 knockout sublines were insensitive to IFN-gamma but remained sensitive to IFN-alpha and -beta (Figure 1A). We also evaluated the surface expression of PD-L1 and MHC class I after exposure to IFNs. In all JAK1 knockout sublines, PD-L1 and MHC class I surface expression did not increase after exposure to the three IFNs, while, as expected (5), the JAK2 knockout sublines did not respond to IFN-gamma but still responded to IFN-alpha and -beta (Figure 1B). In contrast, B2M knockout in the M202 and M233 cell lines did not affect the sensitivity to any of the three IFNs on cell growth inhibition and PD-L1 surface expression compared to the wild-type counterpart, but instead led to the loss of surface expression of MHC class I (Figure S2 B–D). Therefore, JAK1 knockout cell lines lose the ability to respond to type I and II IFNs, JAK2 knockout cell lines lose the ability to respond to type II IFN, and B2M knockout cell lines continue to respond to all three IFNs and loss the expression of MHC-class I.
Figure 1: JAK1/2 knockout in human melanoma cells result in insensitivity to IFN-gamma, while B2M knockout results in lack of antigen presentation to T cells.
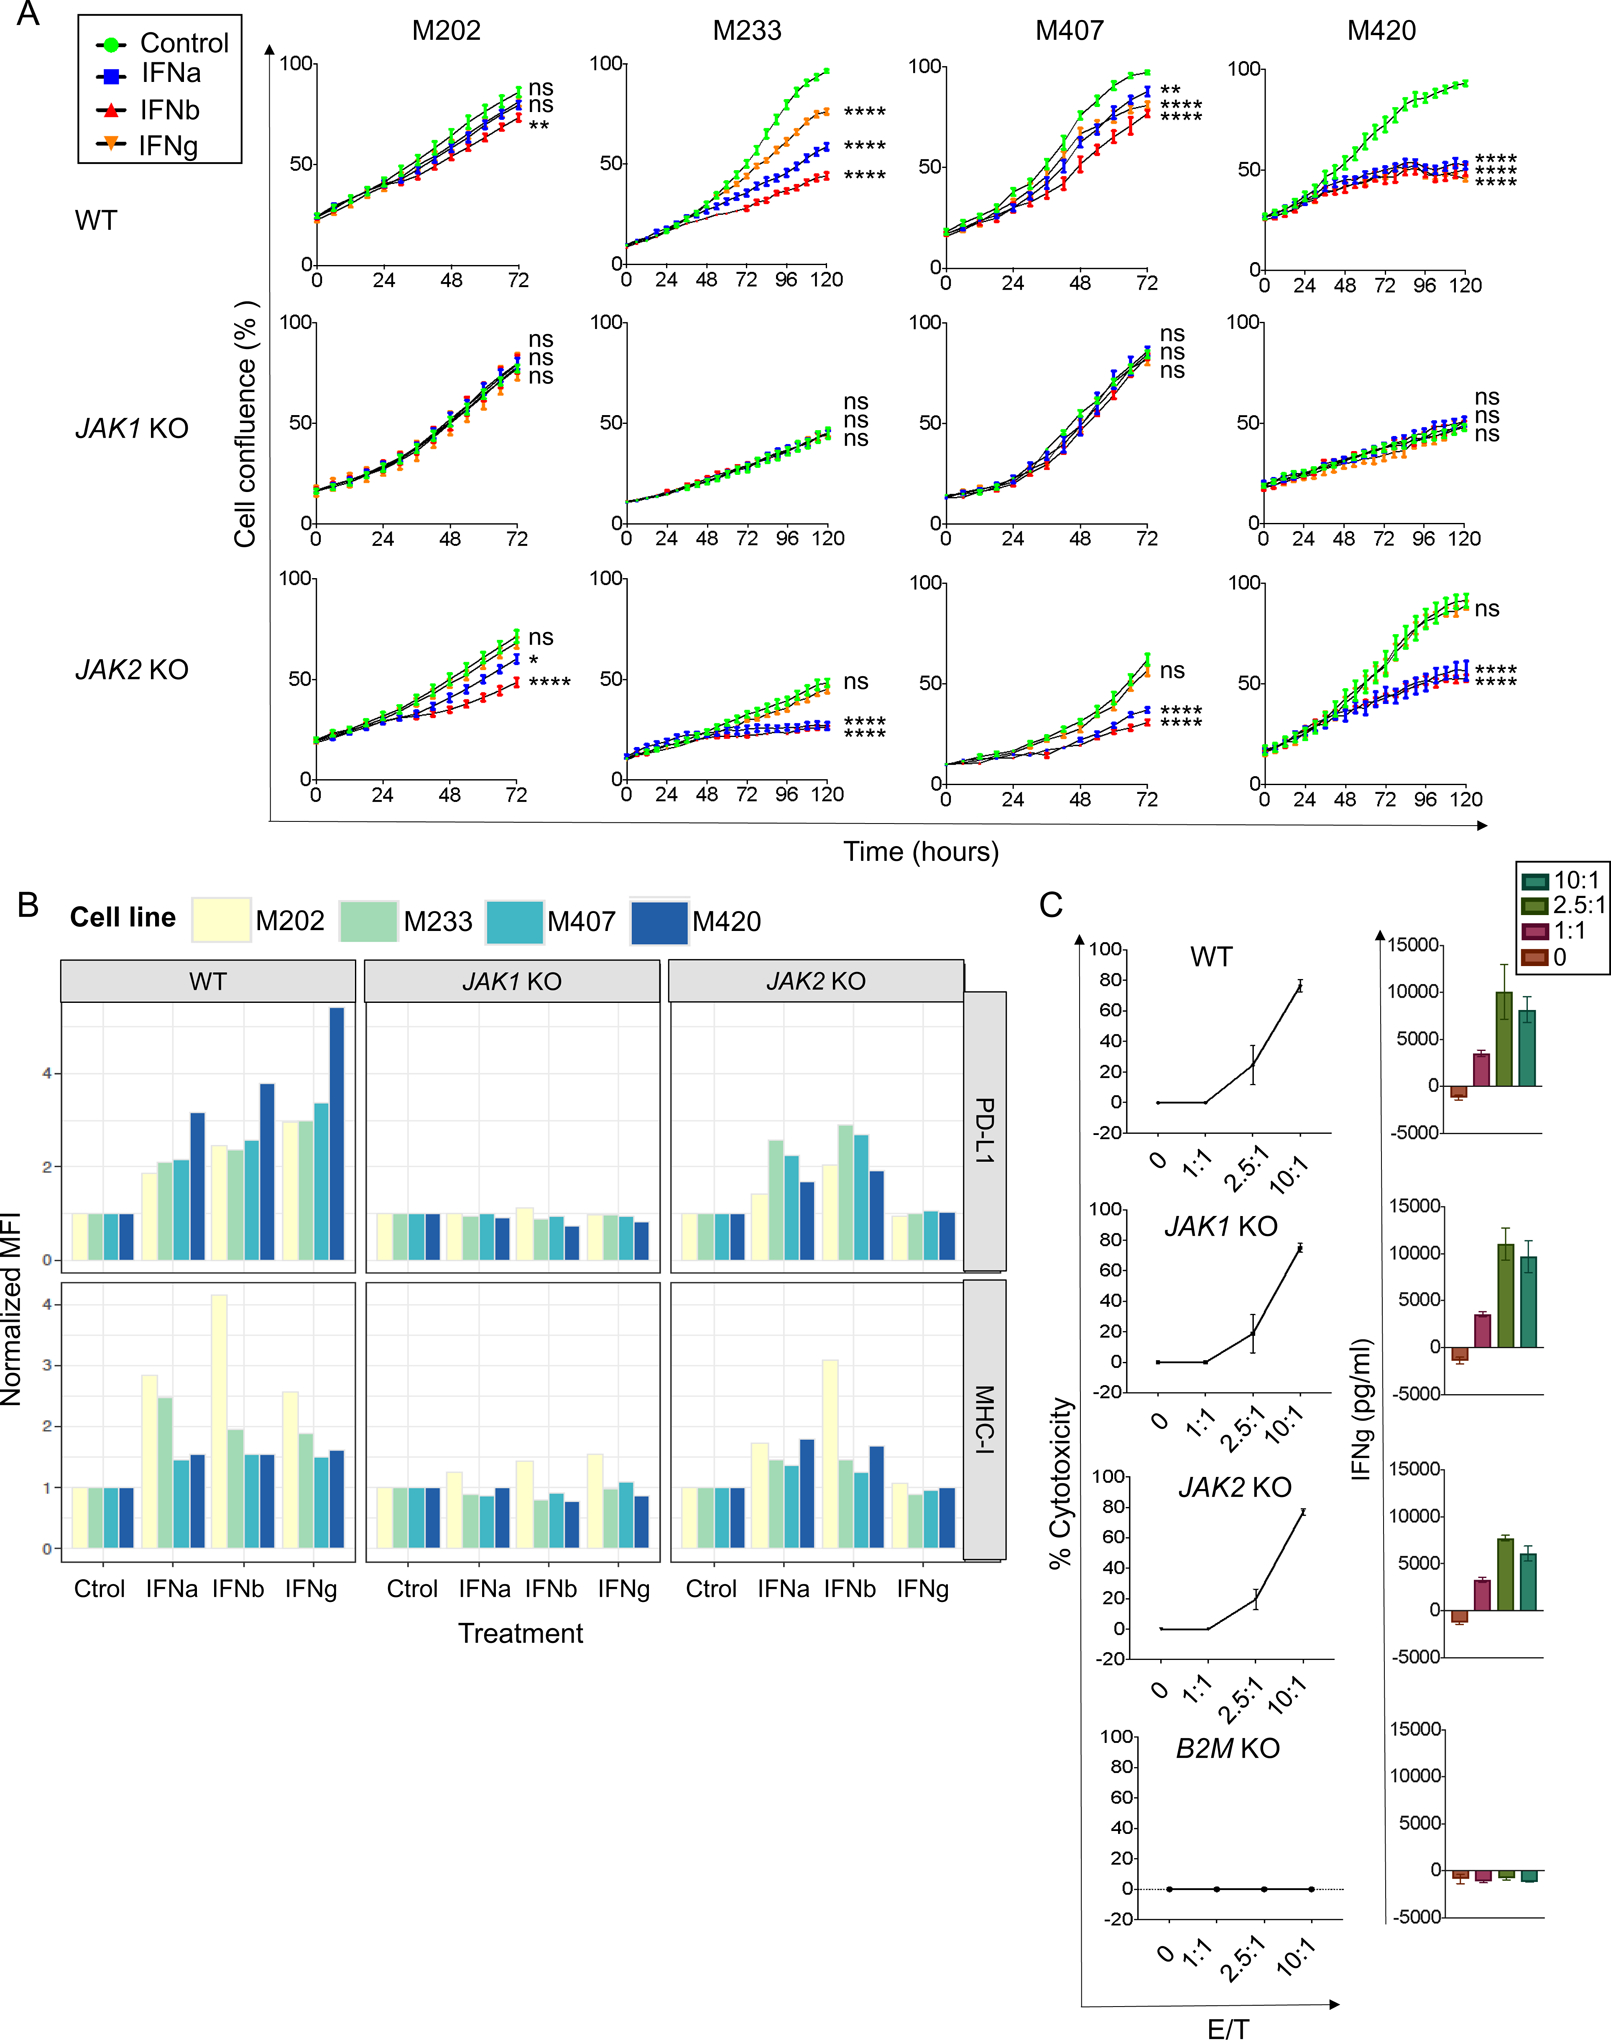
(A) M233, M407 and M420 melanoma cell lines showed growth inhibition in response to direct in vitro treatment with IFN-alpha, -beta or -gamma (p<0.0001, IFN-gamma compared to baseline). All JAK1 knockout sublines were insensitive to all three interferons (p ns, IFNs compared to baseline) and JAK2 knockout sublines were only insensitive to IFN-gamma (p ns, IFN-gamma versus baseline; p<0.0001, IFN-alpha and -beta compared to baseline in M233, M407 and M420). Growth curves represent the percent in the confluence of cells (y-axis) over time (x-axis), treated with IFN-alpha, -beta or -gamma (fill color) as measured by IncuCyte continuous live-cell imaging. Error bars reflecting the standard error of the mean across six replicates of each cell line and treatment combination. ns, not significant; *p<0.05; **p<0.01; ***p<0.001; ****p<0.0001 for the percent in growth with the treatment shown at the 72-hour (in M202 and M407) or 120-hour (in M233 and M420) endpoint as compared to the untreated control, with Dunnett’s multiple-comparison test. One representative experiment of three independently conducted experiments is shown (B) PD-L1 and MHC class I surface expression were measured by flow cytometry on cell lines (fill color) treated with IFN-alpha, -beta or -gamma (x-axis). Expression (y-axis) is summarized by the mean fluorescence intensity (MFI) normalized to the corresponding control-treated cell lines and genotype. (C) M202 MART-1 positive parental, as well as the M202 JAK1 (sgRNA2 c6) and JAK2 (sgRNA1 c41) knockout sublines were recognized and killed by MART-1 TCR transgenic T cells (effector/target 10:1; 77% compared to 75% and 77% cytotoxicity respectively, p=0.9, Dunnett’s multiple-comparison test). Whereas, B2M (sgRNA3 c5) knockout sublines resulted in the loss of selective killing (effector/target 10:1; B2M knockout 0% versus parental 77% cytotoxicity, p<0.0001). Target cancer cells were stably transfected with a nuclear localizing RFP (NucLight Red Lentivirus EF1a Reagent, Essen Biosciences) and cocultured with MART-1 specific TCR engineered T cells. The percent of cytotoxicity (y-axis) was measured after 24 hours of coculture at E:T ratio between 1:1 and 10:1 (x-axis) and the IFN-gamma production (y-axis)) after 24 hours of in vitro coculture at different E:T ratios.
In order to assess the impact of JAK1/2 and B2M knockout mutations in the ability of T cells to recognize and attack tumor cells, we used HLA-A*02:01 MART-1 positive M202 melanoma cells and set up a co-culture using human T cells that were retrovirally transduced to express the F5 transgenic TCR specific for MART-1 (32,33). MART-1 TCR transgenic T cells had strong in vitro antitumor cytotoxicity against both JAK1/2 knockout MART-1-positive melanoma cells comparable to the parental cells, with intact IFN-gamma production by these T cells in co-culture experiments (Figure 1C). This observation was consistent across different clones of the JAK1/2 knockout cell lines with similar ability to be recognized and killed by antigen-specific T cells (Figure S2 E–G). On the other hand, B2M knockout MART-1-positive melanoma cells were not recognized by MART-1 TCR transgenic T cells, exemplified by the lack of IFN-gamma production and cell killing when co-cultured (Figure 1C). Taken together, JAK1/2 knockout cell lines have intact T cell cytotoxicity likely due to sufficient baseline levels of MHC class I expression allowing T cell recognition. However, both T cell recognition and cytotoxicity are lost when B2M was knocked out.
Downstream signaling alterations in human cell lines exposed to IFN-gamma
In order to investigate the change in response to IFN-gamma exposure, we cultured the four cell lines with and without JAK1/2 or B2M knockout mutations with IFN-gamma. We harvested RNA after 6 hours of IFN-gamma stimulation for genome-wide transcriptome comparison to baseline by RNA-seq. We then filtered for gene sets involved in immune response and IFN-gamma signaling and obtained a total of 61 genes that had greater than a two-fold change difference in expression in all parental cell lines upon IFN-gamma treatment. These genes were also upregulated in B2M knockout sublines upon IFN-gamma exposure, but not in sublines with JAK1/2 knockout (Figure 2). Overall, wild-type cell lines generally increased gene expression involved in antigen presentation machinery (such as B2M, HLA-A, HLA-B, HLA-C, HLA-F HLA-G, HLA-DRB1, HLA-DRB5, CIITA, TAP1, TAP2, PSMB8, PSMB9 and PSMB10), IFN-gamma signaling (such as JAK1, JAK2, SOCS1, SOCS3, STAT1, STAT2, IRF1, IRF2, IRF7 and IRF9) and chemokines (CXCL9 and CXCL10). These changes were also observed in B2M knockout sublines. However, the ability to upregulate these genes by IFN-gamma was lost in both JAK1/2 knockout sublines (Figure S3).
Figure 2: Altered IFN-gamma-induced gene transcription in JAK1/2 knockout melanoma cell lines.
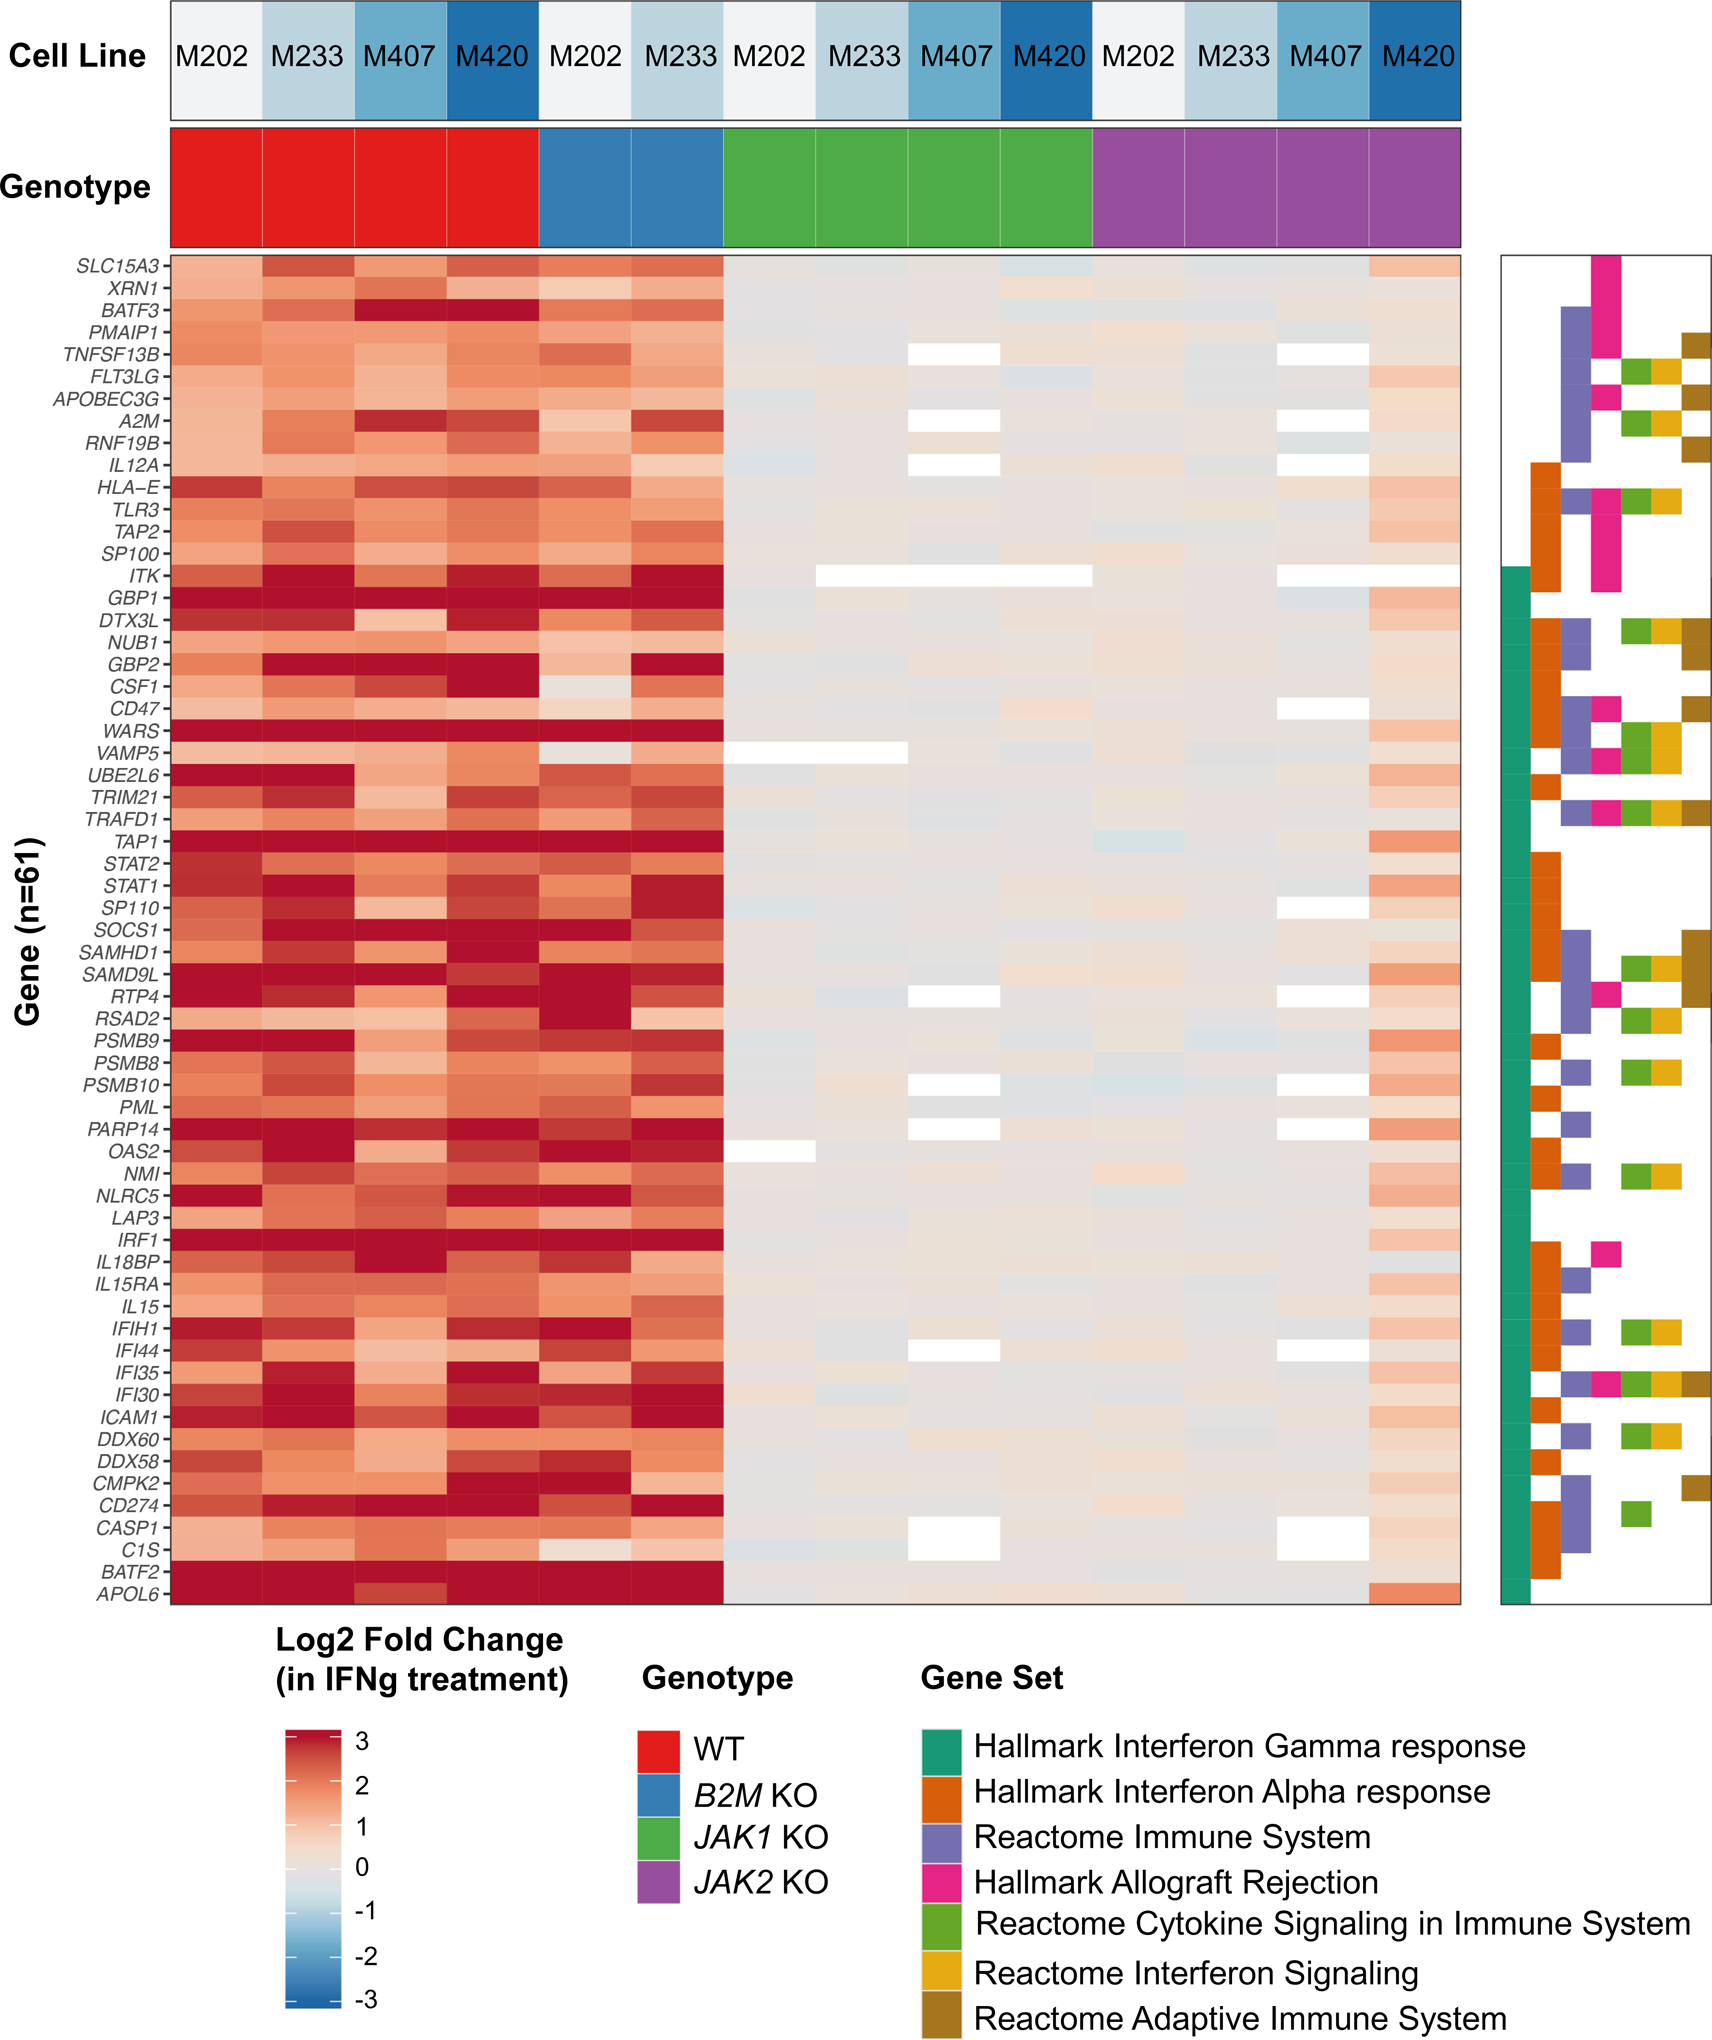
Heatmap displaying the change in gene expression due to IFN-gamma treatment. Genes were filtered to those that had at least 2-fold change in expression in all four groups of melanoma cell lines: M202 (MART-1-positive), M233, M407 (NY-ESO-1 positive) and M420. Associated cell line (top row panel) and Genotype (second row panel) are indicated. Hallmark, KEGG, and Reactome gene sets were filtered to those with at least 10 genes differentially expressed (right plot). Genes were sorted by the most highly enriched pathways.
In summary, human melanoma cell lines with JAK1/2 knockout mutations do not respond to IFNs, as determined by upregulation of corresponding IFN-response target genes as well as surface expression of PD-L1 and MHC class I, but they can still be recognized by antigen-specific T cells leading to specific cytotoxicity provided they have constitutive baseline MHC class I expression. On the contrary, human melanoma cell lines with B2M knockout mutations respond to IFNs with expression of corresponding IFN-response genes, but they are not recognized by antigen-specific T cells due to lack of surface MHC class I expression, and therefore are resistant to specific cytotoxicity.
Modeling resistance to PD-1 blockade in MC38 murine carcinoma
There are very few syngeneic animal models that respond to PD-1 blockade therapy. The murine colon adenocarcinoma MC38 has been previously shown to partially respond to PD-1 blockade therapy (29,30,34). It is a carcinogen-induced cell line with high mutational burden which shows increase in CD8+ T cell infiltration after PD-1 blockade, and therefore it recapitulates highly mutated human cancers that respond to this therapy. To generate a mouse model of anti-PD-1 resistance, we created JAK1, JAK2 and B2M knockout sublines of MC38 (Figure S4 A–C). Once multiple knockout clones were selected and validated for each gene, we characterized their individual in vitro and in vivo growth curves, as well as the basal surface expression of PD-L1 and MHC class I, in order to select only the sublines (JAK1 sgRNA1 c5, JAK2 sgRNA2 c3 and B2M sgRNA2 c6) that behaved similarly to the parental cell line (Figure S4 D–E). We found that the functional effects of IFNs exposure in terms of growth inhibition, PD-L1 and MHC class I surface expression were broadly comparable to that of the human cell lines with the corresponding knockout genes. MC38 JAK1 knockout was insensitive to all three IFNs and MC38 JAK2 knockout was insensitive to only IFN-gamma (Figure 3 A–C).
Figure 3: CRISPR/Cas9 knockout tumors of JAK1/2 and B2M result in resistance to anti-PD-1 in the MC38 model.
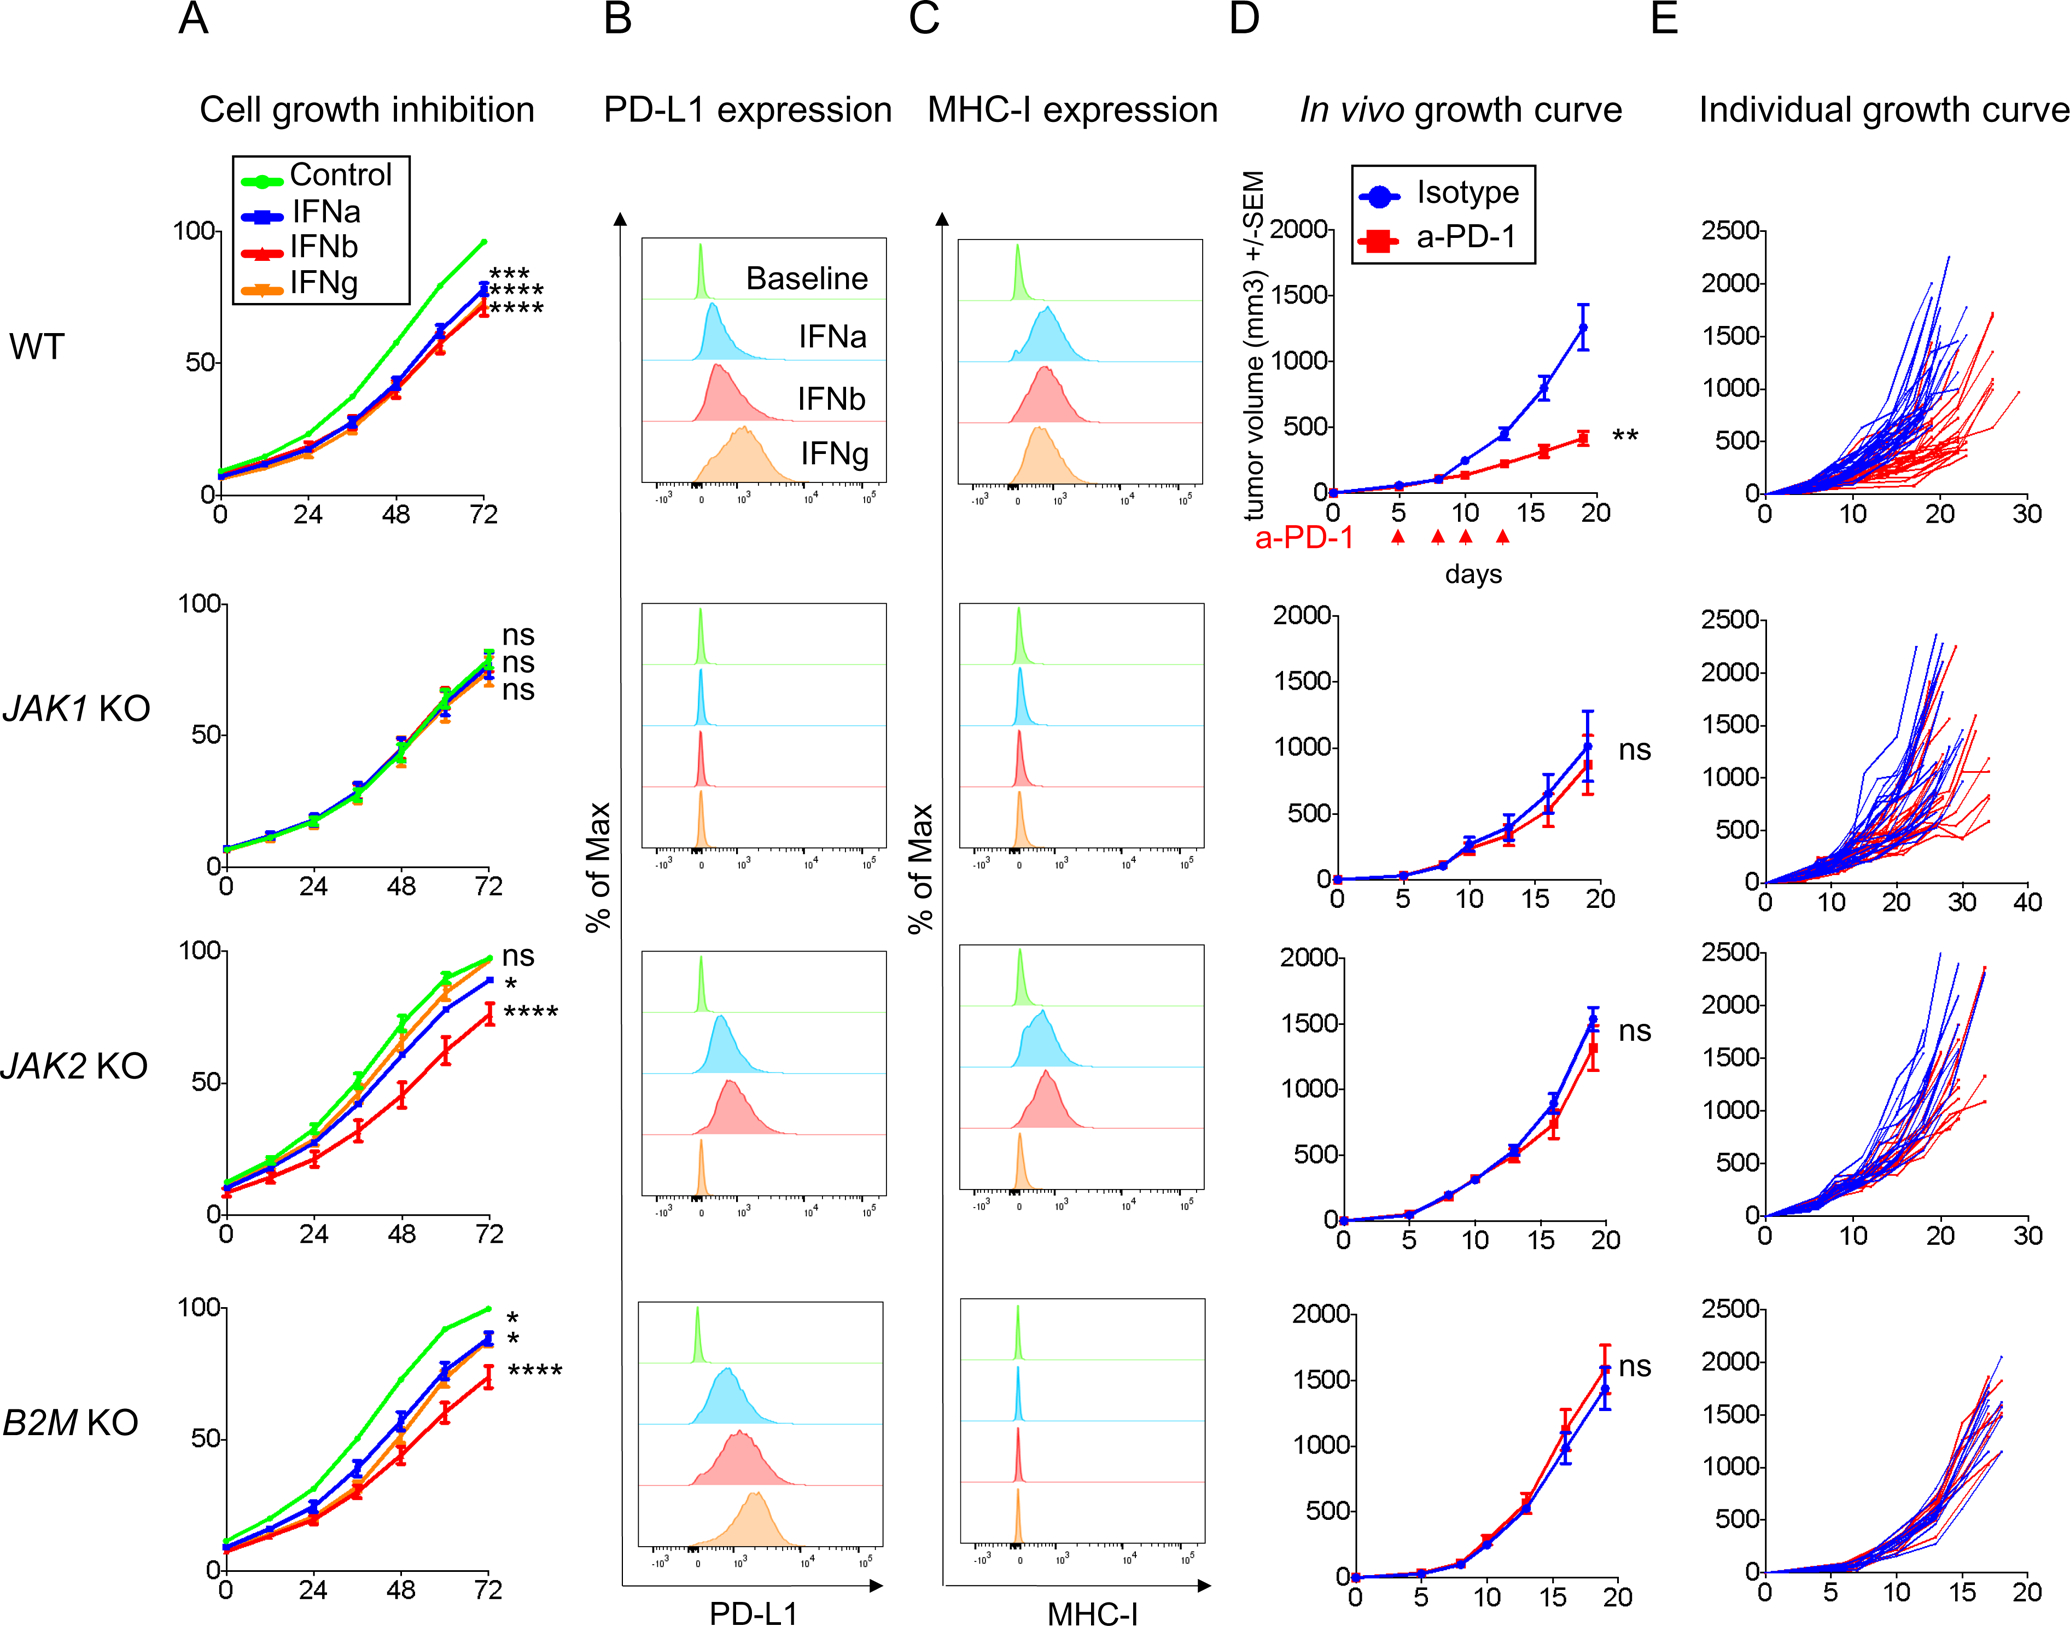
(A) Growth inhibition in response to direct in vitro treatment with IFN-alpha, -beta, or -gamma in MC38 wild-type (WT) and knockout cell lines. Growth curves represent the percent in the confluence of cells (y-axis) over time (x-axis) as measured by IncuCyte continuous live-cell imaging. ns, not significant; *p<0.05; **p<0.01; ***p<0.001; ****p<0.0001 for the percent in growth with the treatment shown at the 72-hour as compared with the untreated control, with Dunnett’s multiple-comparison correction. One representative experiment of three independently conducted experiments is shown. The measure of (B) PD-L1 and (C) MHC class I surface expression by flow cytometry after IFNs stimulation. Histograms represent changes in mean fluorescence intensity by flow cytometry compared to baseline. (D) In vivo tumor growth curves and of JAK1 or JAK2, or B2M knockout cell lines with 5 mice in each group (mean ± SEM) after anti-PD-1 or isotype control. The arrow indicates the days of treatment with anti-PD-1 or isotype control was started. p value was determined by unpaired t test on day 19, anti-PD-1 versus isotype control. ns, not significant; **p<0.01. One representative experiment of three independently conducted experiments is shown. (E) In vivo tumor growth curves of individual mice after anti-PD-1 (red) or isotype control (blue): MC38 wild-type (n=28 per group), JAK1 knockout clone 5 (n=22 per group), JAK2 knockout clone 3 (n=15 per group) and B2M knockout clone 6 (n=10 per group). Treated tumors received four doses of anti-PD-1 in total.
To model in vivo resistance to PD-1 blockade, we injected MC38 wild-type or genetically modified MC38 sublines subcutaneously in the lower flank of the mice. When tumors became palpable (at day 5), mice received the first out of four systemic injections of anti-PD-1 therapy or isotype control. In three replicate studies we demonstrated that JAK1, JAK2 and B2M knockout mutations result in the complete abrogation of the benefit of anti-PD-1 therapy (Figure 3D–E and S5A), as has been shown in patient biopsy based studies (4–10,35), and prior mouse models of B2M knockout (8).
Characterization of the tumor immune contexture by CyTOF
To characterize the tumor-infiltrating immune cell populations in both MC38 wild-type and resistant tumors treated with either isotype or anti-PD-1 therapy, we performed cytometry by time-of-flight (CyTOF) analysis. A total of 19 independent cell clusters were identified using a panel with 28 markers (Figure 4A and S5 B–D). The T cell population was defined by four clusters, including a CD4 T cell cluster positive for CD3e, CD4 and CD25, and three CD8 T cell clusters positive for CD3e, CD8e, Tbet and PD-1. A NK cell cluster positive for CD335 and CD161 was also identified (Figure 4 A–B). Using this approach, we analyzed MC38 tumors from mice after three doses of isotype or anti-PD-1 (day 13). Anti-PD-1 treated wild-type control MC38 tumors presented increased T cell infiltration (p=0.04) and a trend toward statistical significance (p=0.07) of increased CD8+ T infiltration compared to isotype control antibody treated tumors, which is in line with data from prior studies (34). We did not observe significant changes in the CD4+ and NK cell infiltration (Figure 4C–D). However, anti-PD1 did not induce any significant changes in T, CD4+ T, CD8+ T, and NK immune cell populations in MC38 JAK1, JAK2 and B2M knockout tumors (Figure 4C–D).
Figure 4: Identification of MC38 tumor CD8+ T immune cell population by CyTOF.
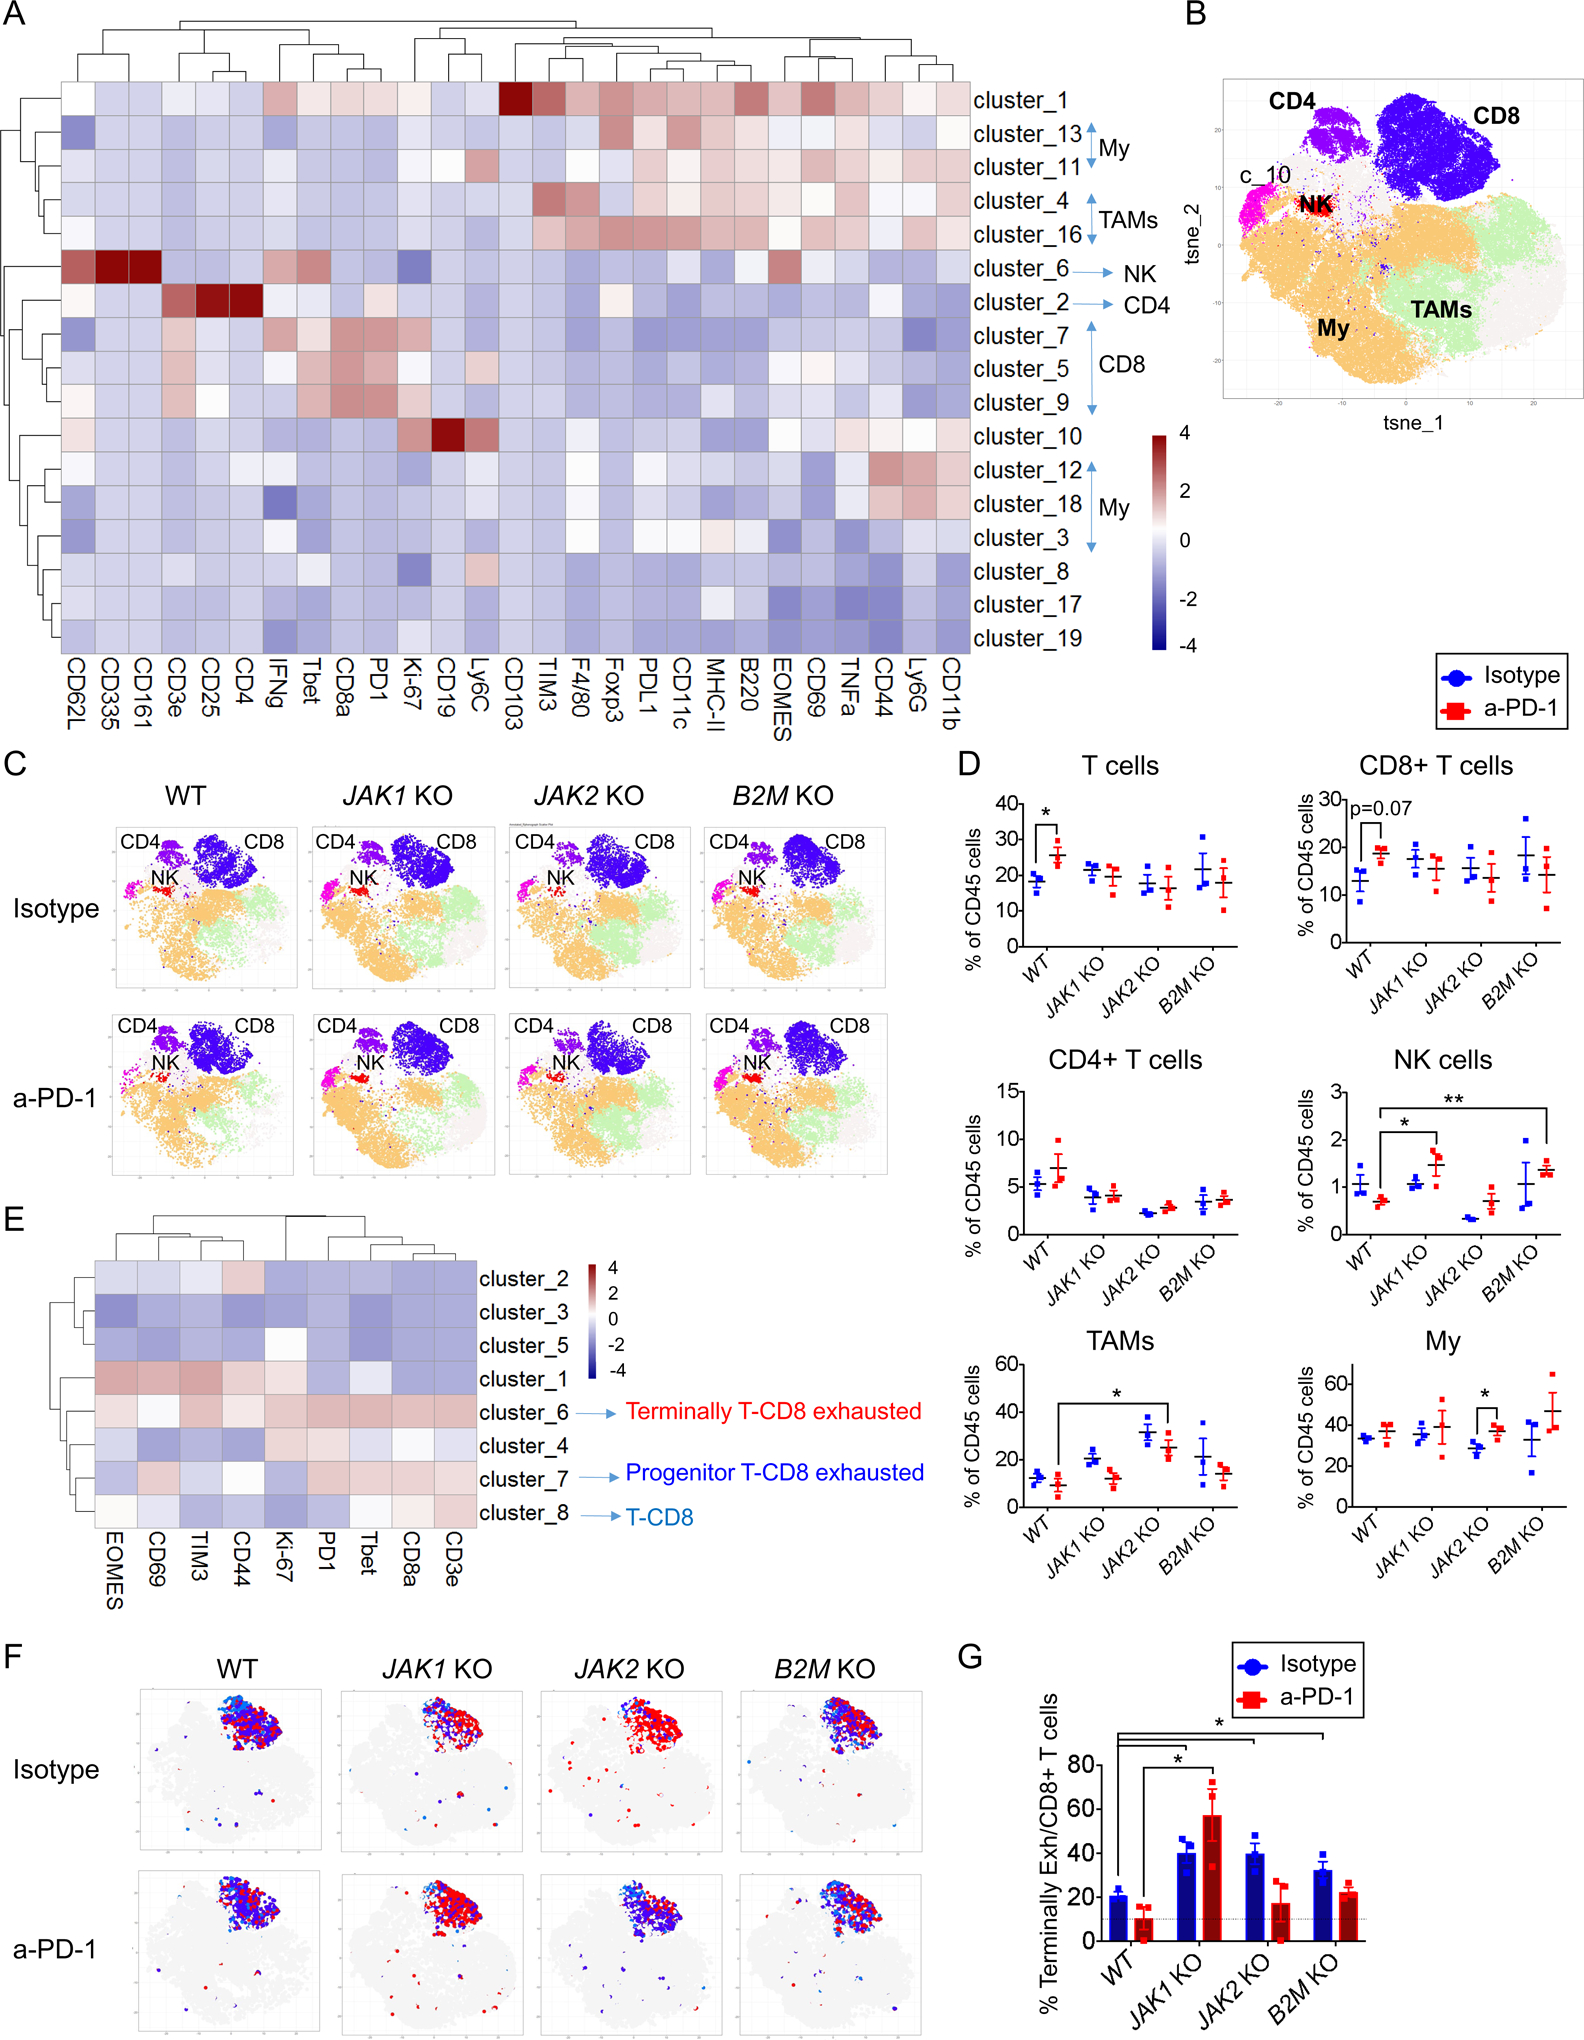
(A) Heatmap with the normalized median percentages for each of the immune-markers. Clusters >0.5% frequency were analyzed. (B) t-SNE plot of total CD45+ cells from all samples and (C) groups of treatment overlaid with color-coded clusters and subsequent classification in immune cell populations. (D) Percentage of T, CD8+ T, CD4+ T, NK, Tumor-associated macrophages (TAMs) and myeloid cells (My) from CD45+ cells in MC38 wild-type, JAK1, JAK2 and B2M knockout tumors treated with anti-PD-1 or isotype mAb. (E) Heatmap with the normalized median percentage for each cluster obtained with FlowSOM on CD8+ T cells markers. Clusters with >0.5% frequency were analyzed. (F) t-SNE plot of MC38 CD8+ T infiltrating population cells overlaid with color-coded clusters and the differentiation of exhausted T cells, representing of terminally CD8+ T exhausted in red and progenitor CD8+ T exhausted or CD8+ T cells in blue. (G) Percentage of terminally CD8+ T exhausted cells from CD8+ cells in MC38 wild-type, JAK1, JAK2 and B2M knockout tumors treated with anti-PD-1 or isotype mAb. In (D) and (G), mean ± SEM, unpaired t test, n=3, *p<0.05; **p<0.01.
Given the limited change in the number of tumor-infiltrating CD8+ T cells with anti-PD-1 therapy in this model (34), we analyzed the change in functional phenotype of the CD8+ T cells including terminally CD8+ T exhausted (CD3e+, CD8a+, PD1+, TIM3+, EOMES+, Tbet+) and progenitor CD8+ T exhausted (CD3e+, CD8a+, PD1+, Tbet+, CD69+), within the CD8+ T cluster (CD3+CD8+) (Figure 4E). Interestingly, JAK1/2 and B2M knockout tumors were enriched in terminally CD8+ T exhausted cells, which have been reported to be unable to respond to anti-PD-1 therapy (36–38), compared to MC38 wild-type tumors (Figure 4 F–G), in line with the observed lack of response to anti-PD-1 therapy in vivo.
Intratumoral TLR-9 agonist administration overcomes resistance to anti-PD-1 therapy in JAK1/2 knockout tumors
Our results thus far demonstrate that the major effect of JAK1/2 knockout is the inability of cancer cells to respond and express an IFN-induced transcriptional profile that leads to downstream immune activation. Additionally, JAK1/2 knockout tumors were less immune infiltrated with functional CD8 T cells compared to wild-type tumors after anti-PD-1 treatment. Therefore, we investigated whether upstream activation with agents that trigger a type I IFN response in the tumor microenvironment could overcome resistance mediated by JAK1 and JAK2 loss. Type I IFN responses could be triggered by recognition of foreign DNA sequences through pattern recognition receptors such as TLR9 signaling. TLR9 stimulation of plasmacytoid dendritic cells (pDC), which are high producers of IFN-alpha, could initiate a strong antitumor immune response (25) in tumors lacking JAK signaling since they can still be recognized and killed by antigen-specific T cells, as shown in Figure 1. To this end, we bilaterally injected wild-type control and JAK1/2 knockout cells into mice and when tumors became detectable, mice were treated with intratumoral TLR9 agonist SD-101 injections into the right flank tumors. We observed antitumor effects in both the injected and contralateral non-injected left flank tumors, with or without systemic anti-PD-1 therapy. In three replicate experiments, the combined therapy of SD-101 and anti-PD-1 provided superior antitumor activity against JAK1 and JAK2 knockout tumors, overcoming resistance both in injected and contralateral non-injected sites (Figure 5A and S6A), as well as increased survival (Figure 5B). The antitumor effect of intratumoral SD-101 was consistent when replicated using tumors from additional MC38 JAK1/2 CRISPR/Cas9 knockout sublines (Figure S6B).
Figure 5: Intratumoral TLR-9 agonist (SD-101) administration to reverse resistance to anti-PD-1 in JAK1/2 knockout resistant tumors.
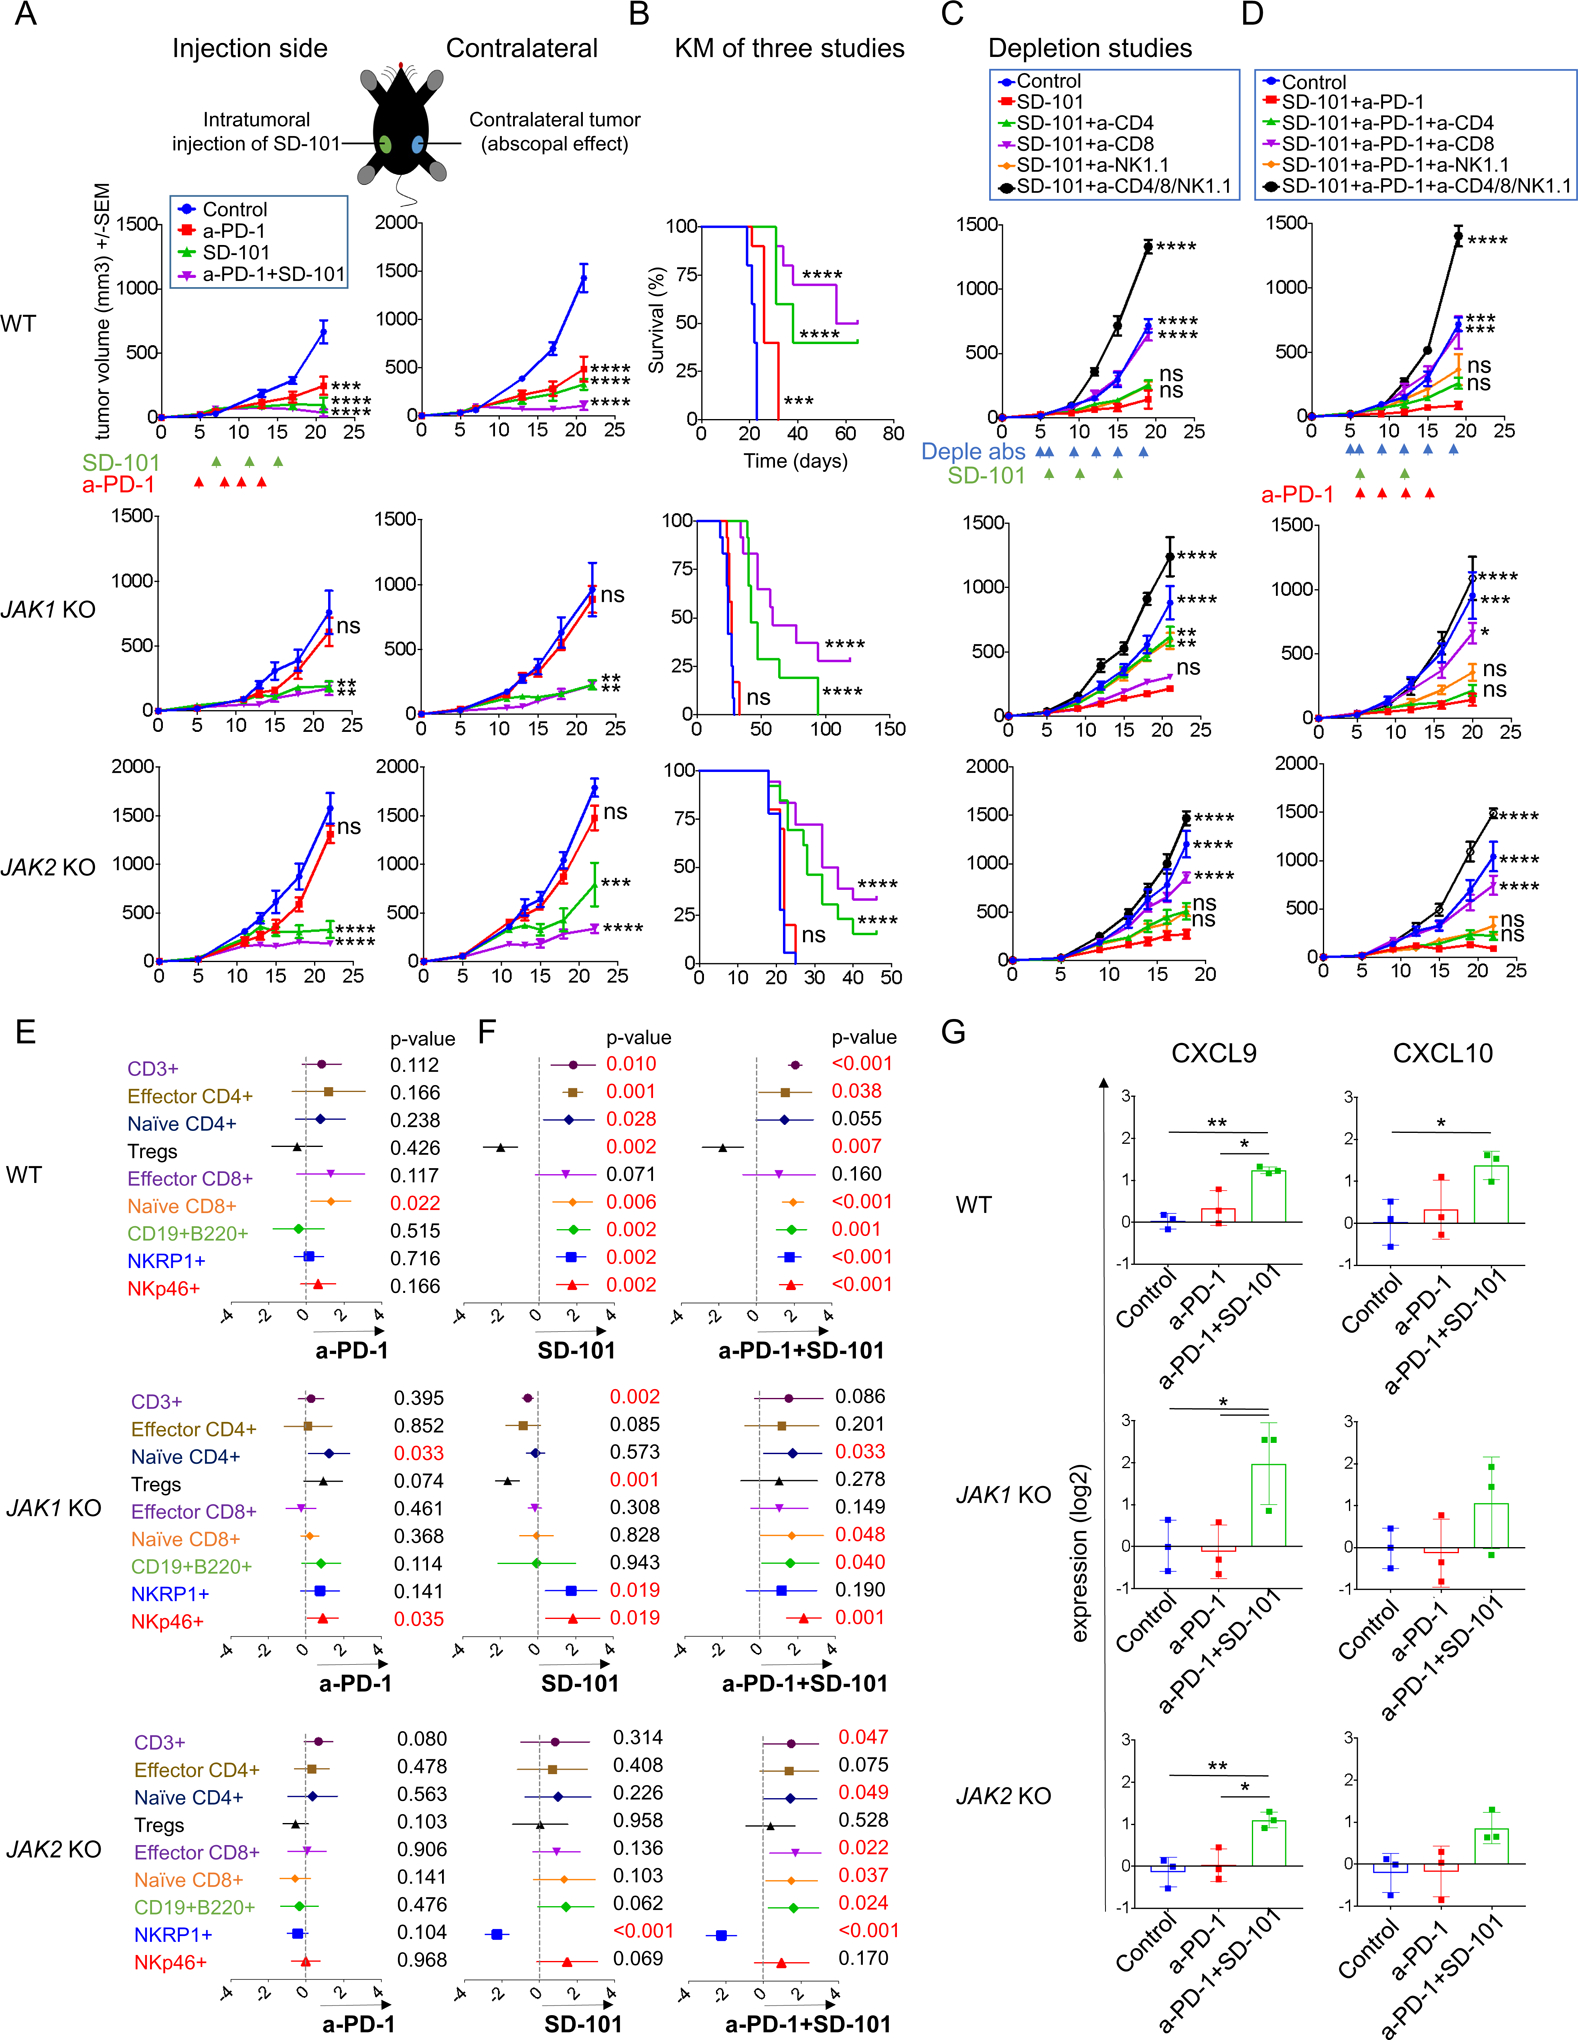
(A) Effect of intratumoral (i.t) SD-101 on tumor growth at treated and non-treated contralateral sites. Date represented as mean +/− SEM from an n of 5. Dunnett’s multiple comparison tests for control versus anti-PD-1 or SD-101 or anti-PD-1 plus SD-101. One representative experiment of three independent experiments is shown. (B) Long-term survival for mice inoculated with wild-type and JAK 1/2 knockout tumor cells in one flank. Effect of intratumoral (i.t) SD-101 at treated sites, MC38 wild-type (n=10 per group), JAK1 knockout (n=12 per group) and JAK2 knockout (Control, n=18; anti-PD-1, n=10; SD-101, n=13; and SD-101 plus anti-PD-1, n=18). Differences in survival were examined using Log-rank (Mantel-Cox) test. (C) Tumor growth curves for wild-type control and JAK1/2 knockout resistant tumors with anti-CD4, anti-CD8 and anti-NK1.1 depletion studies after intratumoral (i.t) SD-101 treatment (one-side). Date represented as mean +/− SEM. In MC38 wild-type, n=5 per group. In JAK1 KO depletion: Control, n=10; SD-101, n=12; SD-101 plus anti-CD4, n=10; SD-101 plus anti-CD8, n=12, SD-101 plus anti-NK1.1, n=12 and SD-101 plus anti-CD4/8/NK1.1, n=6. In JAK2 KO depletion: n=8 per group. (D) Tumor growth curves for wild-type control and JAK1/2 knockout resistant tumors with anti-CD4, anti-CD8 and anti-NK1.1 depletion studies after intratumoral (i.t) SD-101 plus anti-PD-1 treatment. Date represented as mean +/− SEM, n=5 per group. In (C) and (D) Dunnett’s multiple comparison tests for SD-101 or SD-101 plus anti-PD-1 versus control or depletion with anti-CD4 or anti-CD8 or anti-NK1.1 or anti-CD4/8/NK1.1. (E) Meta-analysis of CyTOF data using MetaCyto in MC38 wild-type and JAK1/2 knockout tumors. Plots showing the effect size of treatments: Control-Isotype versus anti-PD-1 or (F) Control-Isotype versus SD-101 or combination SD-101 plus anti-PD-1 therapy in wild-type and JAK1/2 knockout tumors (effect of injected sites). Dots and whiskers represent the means and 95% confidence intervals. The p value is calculated using a random effect model, adjusted using Benjamini-Hochberg correction. (G) RT-PCR for CXCL9 and CXCL10 expression show that SD-101 plus anti-PD-1 increase the expression levels of these genes. Showing means +/− SD. Results are normalized to Control-Isotype level in each group and then log2 transformed (n= 3). In (A), (B), (C), (D) and (G): ns, not significant; *p<0.05; **p<0.01; ***p<0.001; ****p<0.0001.
To analyze the role of T and NK cells, we performed antibody-mediated CD4+ T-cell, CD8+ T-cell and NK1.1+ cell depletion studies in mice with JAK1/2 knockout tumors treated unilaterally with intratumoral SD-101 or combination therapy with systemic anti-PD-1 therapy. Antibody-mediated depletion was confirmed by flow cytometric analysis of splenocytes (Figure S7A). In JAK1 knockout tumors, depletion of NK and CD4+ T, but not CD8+ T cells, partially abrogated the SD-101 antitumor activity (Figure 5C and S7B). In contrast, the CD8+ T cell depletion completely ablated the effect of the combination therapy (Figure 5D and S7C). In JAK2 knockout tumors, depletion of CD4+ and NK cells resulted in a partial abrogation of antitumor activity while CD8+ T cell depletion resulted in complete abrogation of the antitumor efficacy of SD-101 alone and in combination with anti-PD-1 (Figure 5C–D and S7B–C).
To have the power to distinguish tumor-specific immune cell changes from combinatorial treatments, we integrated data from replicate mass cytometry experiments using an automated meta-analysis of CyTOF data, Metacyto (39). We merged cytometry data across a wide range of cell surface and intracellular markers (Table S1 and S2) and identified immune cell populations using pre-defined cluster analysis (Table S3). Anti-PD-1 therapy did not change the frequency of CD4+ and CD8+ T-effector subsets in both JAK1/2 knockout tumors (Figure 5E). These results are in line with Figure 4, and suggest a lack of maintained T cell activation in JAK1/2 knockout tumors. Treatment with single agent SD-101 increased NK cells mobilization in JAK1 knockout and also CD8+ and CD4+ T cells in JAK2 knockout tumors. Interestingly, the addition of anti-PD-1 treatment improved immune responses and increased the levels of CD3+ T, CD4+ T, CD8+ T and B cells compared to SD-101 alone (Figure 5F and S8) in line with our depletion experiments (Figure 5C–D).
As we documented the increase in T cell infiltration when adding anti-PD-1 to intratumoral TLR9 administration, we next wanted to elucidate whether the combinatorial treatment increase expression of the T-cell chemoattracting chemokines CXCL9 and CXCL10 within tumor microenvironment. Therefore, we performed qRT-PCR from MC38 wild-type control and knockout tumors after two doses of intratumoral SD-101 and three doses of anti-PD-1 compared to anti-PD-1 or isotype control. No differential expression of CXCL9 or CXCL10 was detected in JAK1/2 knockout tumors treated with anti-PD-1 comparable to isotype control. Interestingly, combination of SD-101 with anti-PD-1 treatment produced higher levels of CXCL9 and CXCL10 than did tumors treated with anti-PD-1 or isotype control, in wild-type and JAK1/2 knockout tumors (Figure 5G). Taken together, our results demonstrate that SD-101 is able to overcome resistance in both JAK1 and JAK2 knockout models by increasing infiltration of T cells and NK cells as a result of markedly increased levels of both CXCL9 and CXCL10 in the tumor microenvironment.
The CD122 preferential IL-2 pathway agonist bempegaldesleukin overcomes resistance in B2M knockout tumors
We reasoned that the absence of B2M and subsequent lack of surface expression of MHC class I may sensitize cancer cells to NK cells, as MHC class I is the major inhibitory ligand for NK cell function (26–28). Therefore, we tested the CD122 preferential IL-2 pathway agonist bempegaldesleukin (also known as NKTR-214) (40,41), administered either alone or in combination with anti-PD-1. In two replicate experiments, the systemic administration of bempegaldesleukin overcame therapeutic resistance to anti-PD-1 in B2M knockout tumors (Figure 6A and S9A), with significantly longer survival compared to the control groups (Figure 6B).
Figure 6: Bempegaldesleukin to reverse resistance in B2M- deficient tumors.
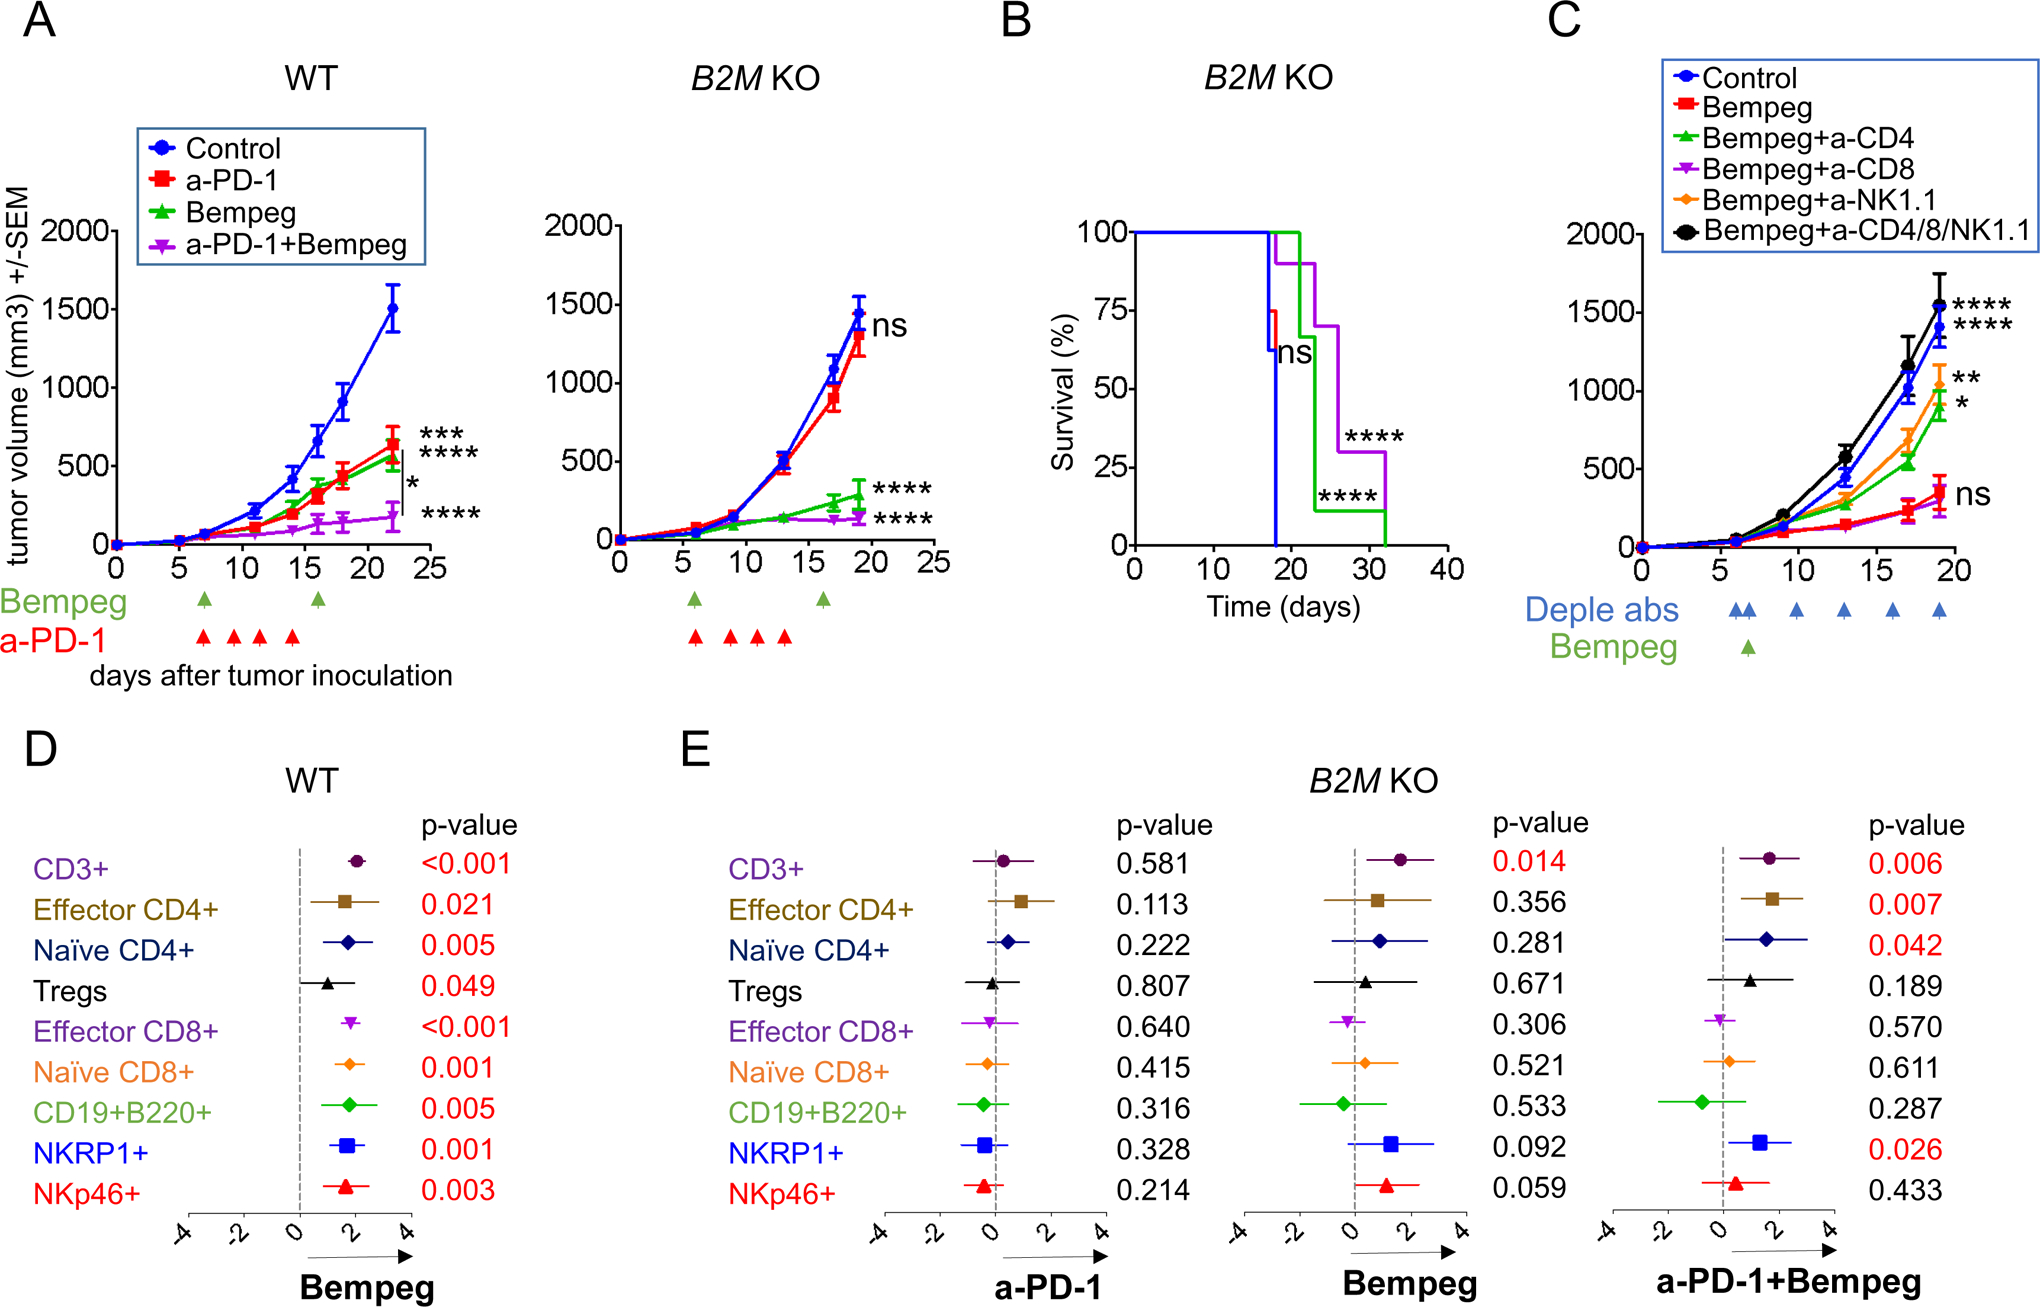
(A) Effect of bempegaldesleukin on tumor growth of MC38 wild-type and B2M knockout tumors. In MC38 wild-type, Control, n=6; anti-PD-1, n=5; bempeg, n=8; and anti-PD-1 plus bempeg n=9. In B2M KO: Control, n=10; anti-PD-1, n=8; bempeg, n=10; and anti-PD-1 plus bempeg, n=9. Dunnett’s multiple comparison tests for control versus anti-PD-1 or bempeg or anti-PD-1 plus bempeg. (B) Long-term survival for mice inoculated with wild-type and B2M knockout tumors. n=9 mice per group. Differences in survival were examined using Log-rank (Mantel-Cox) test. (C) Tumor growth curves for B2M knockout resistant tumors with anti-CD4, anti-CD8 and anti-NK1.1 depletion studies after 0.8 mg/kg IV bempegaldesleukin. Date represented as mean +/− SEM from an n of 8 per group, except bempegaldesleukin plus anti-CD4/8/NK1.1, n=6. Dunnett’s multiple comparison tests for bempegaldesleukin versus control or bempegaldesleukin plus anti-CD4 or bempegaldesleukin plus anti-CD8 or bempegaldesleukin plus anti-NK1.1 or bempegaldesleukin plus anti-CD4/8/NK1.1. (D) Meta-analysis of CyTOF data using MetaCyto: Plots showing the effect size of treatments: Control-Isotype versus bempeg in wild-type tumors and (E) Control-Isotype versus anti-PD-1, bempeg or combination of bempeg plus anti-PD-1 in B2M knockout tumors. Dots and whiskers represent the means and 95% confidence intervals. The p value is calculated using a random effect model, adjusted using Benjamini-Hochberg correction. In (A), (B) and (C): ns, not significant, *p<0.05; **p<0.01; ***p<0.001; ****p<0.0001. Bempeg, bempegaldesleukin.
To assess the influence of T and NK cells in the bempegaldesleukin response, depletion studies were performed and confirmed by spleenocyte flow cytometric analysis (Figure S7A). Depletion of CD8+ T cells did not affect the antitumor effect, as expected from the low MHC-I expression on the tumors. However, the depletion of either CD4+ T or NK cells abrogated the antitumor effect of bempegaldesleukin in the MC38 B2M knockout tumors (Figure 6C and S9B).
Applying MetaCyto across a set of mass cytometry data, knockout of B2M in tumors resulted in the loss of MHC class I and the reduction of CD8+ T cell infiltration (Figure 6 D–E). However, treatment with bempegaldesleukin was able to overcome resistance through increased infiltration of CD4+ T as well as NK cells, resulting in the rejection of B2M knockout tumors (Figure 6E). Taken together, our combined meta-analysis and depletion studies suggests that the immune compartment is distinct in the B2M knockout and wild-type tumors due to the lack of MHC-I expression. However, an effective anti-tumor immune response, consisting of CD4+ T cells and NK cells, can still be mounted in these tumors by treatment with bempegaldesleukin.
Overcoming JAK1/2 and B2M resistant tumors in an aggressive B16 murine melanoma model
To validate the concepts underlying the combinatorial strategies to overcome resistance in JAK1/2 and B2M knockout tumors, we used a second mouse tumor model, the B16 melanoma model, which exhibits primary resistance to PD-1 blockade (30). Functional effects of IFNs exposure were consistent with their defective signaling: B16 JAK1 knockout did not upregulate PD-L1 and MHC class I surface expression to all three IFNs, and B16 JAK2 knockout to only IFN-gamma (Figure 7A).
Figure 7: Overcoming JAK1/2 and B2M resistant tumors in an aggressive B16 murine melanoma model.
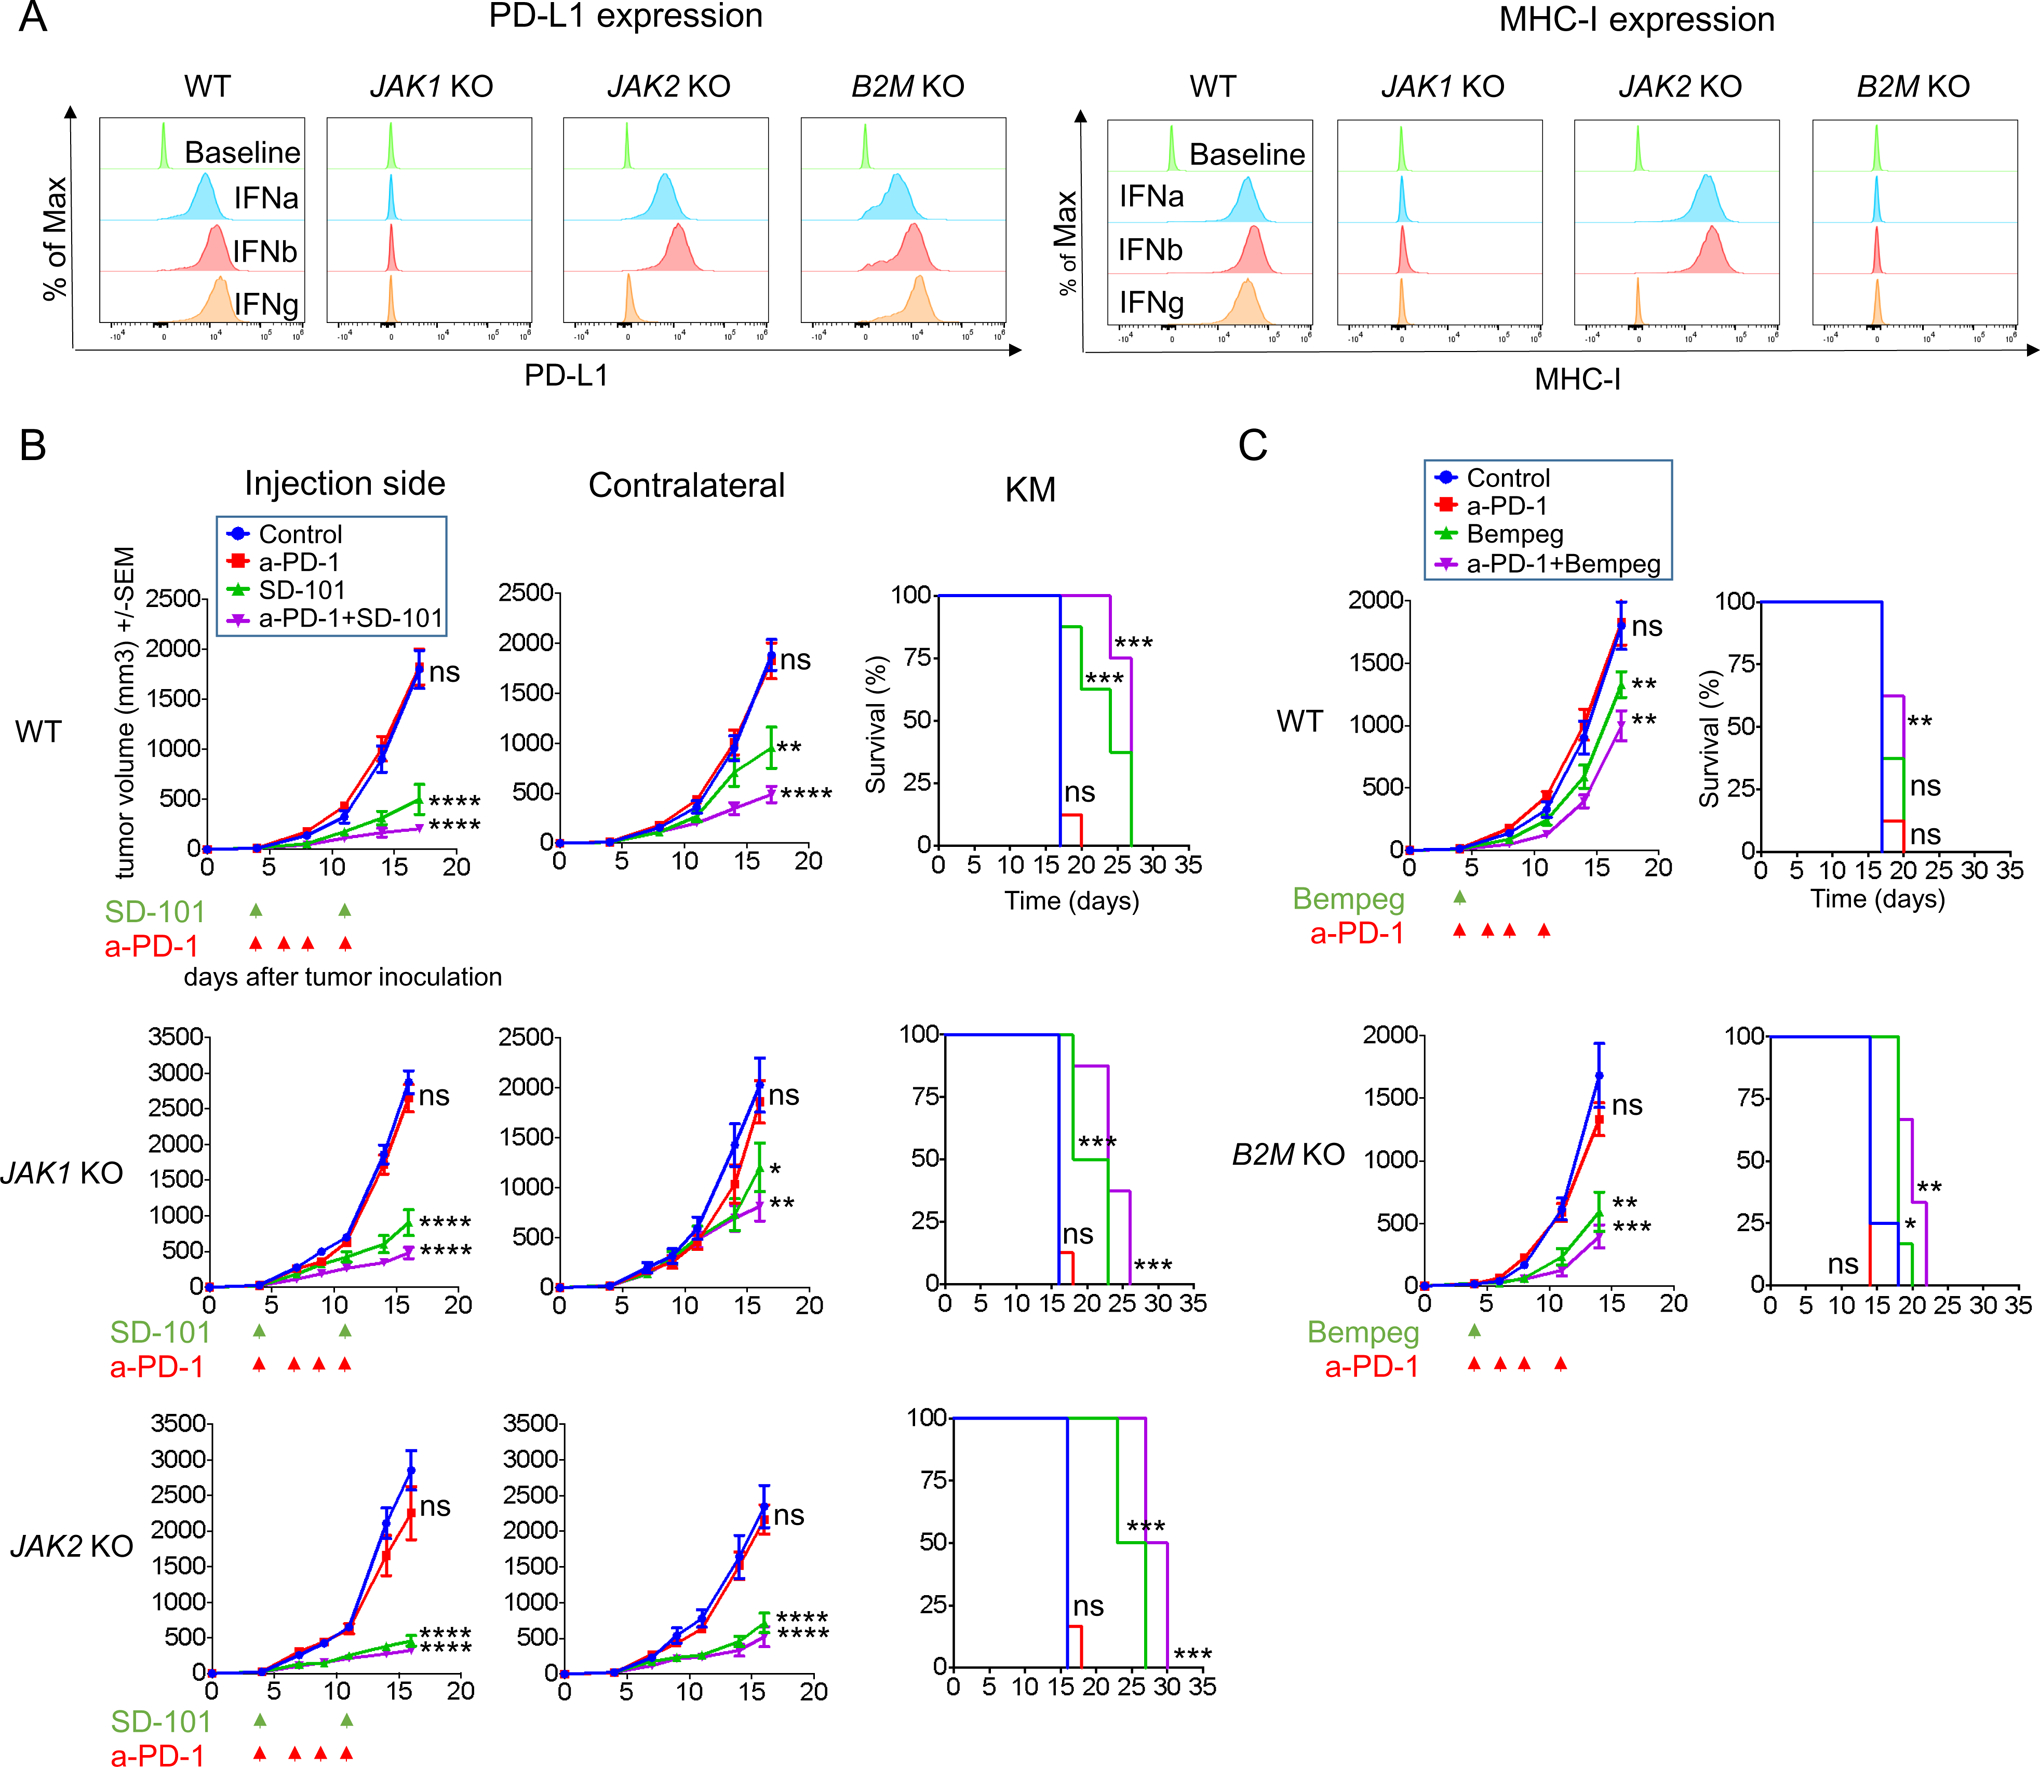
(A) PD-L1 and MHC class I surface expression by flow cytometry after IFNs stimulation. Histograms represent changes in mean fluorescence intensity by flow cytometry compared to baseline. (B) Effect of intratumoral SD-101 on tumor growth at treated and non-treated contralateral sites and long-term survival. Date represented as mean +/− SEM. In B16 wild-type and JAK1 knockout tumors, n=8 per group. In B16 JAK2 knockout tumors, Control, n=6; anti-PD-1, n=6; SD-101, n=8; and SD-101 plus anti-PD-1, n=8. Dunnett’s multiple comparison tests for control versus anti-PD-1 or SD-101 or anti-PD-1 plus SD-101. (C) Effect of bempegaldesleukin on tumor growth of B16 wild-type and B2M knockout tumors and long-term survival. In B16 wild-type, n=8 per group. In B16 B2M KO: Control, n=4; anti-PD-1, n=4; bempeg, n=6; and anti-PD-1 plus bempeg, n=6. Dunnett’s multiple comparison tests for control versus anti-PD-1 or bempeg or anti-PD-1 plus bempeg. In (B) and (C): Differences in survival were examined using Log-rank (Mantel-Cox) test. ns, not significant, *p<0.05; **p<0.01; ***p<0.001; ****p<0.0001. Bempeg, bempegaldesleukin.
To evaluate the impact of the combinatorial treatment TLR-9 agonist plus anti-PD-1 in this model, we bilaterally implanted B16 wild-type control and JAK1/2 knockout cells into mice and treated with intratumoral SD-101 with or without systemic anti-PD-1 therapy, as we had done with the MC38 experiments. Combination of SD-101 with anti-PD-1 resulted in a significant growth delay in JAK1 and JAK2 knockout tumors, overcoming resistance in both, injected and contralateral non-injected sites (Figure 7B and S10A). We also examined the effect of bempegaldesleukin alone or in combination with anti-PD-1 in B16 B2M knockout tumors. Consistent with the results in the MC38 model, combination of bempegaldesleukin with anti-PD-1 overcame therapeutic resistance to anti-PD-1 in B2M knockout tumors (Figure 7C and S10B), with a significant improved survival in B2M knockout tumors compared to wild-type control.
Discussion
Targeting mechanisms of resistance to immune checkpoint blockade is an area of high clinical need. In this study we characterized the significance of JAK1/2 and B2M loss of function mutations in tumor cells as resistance mechanisms to anti-PD-1 therapy. Our functional data showed that JAK1/2 knockout mutations resulted in insensitivity to IFN gamma-induced antitumor effects while maintaining the ability to be recognized and killed by T cells, and B2M knockout led to the lack of antigen presentation, cancer cell recognition and cytotoxicity by T cells. This information allowed us to design combinatorial strategies to successfully overcome these anti-PD-1 resistance mechanisms in mouse models.
Defects leading to lack of sensitivity to the IFN signaling pathway have been described as a mechanism of tumor escape and immunoresistance (42–46). Baseline JAK1 or JAK2 mutations are infrequent in human cancers, representing less than 1% of all cases (4), with an increase in incidence in JAK1 mutations in endometrial carcinomas with microsatellite instability (7,47,48). Upon pressure from the immune system, some cancer cells may escape by developing an inactivating mutation in one JAK allele and losing the second wild-type allele, resulting in a homozygous loss of function mutation in the IFN-gamma response pathway. Such events have been documented in patients with melanoma treated with immune checkpoint blockade therapy with acquired resistance induced by mutations in JAK1 or JAK2 (5,6), and in patients with metastatic cervical cancer receiving adoptive cell transfer therapy with a TCR specific for the E6 viral antigen mediated by the development of mutations in the IFN-gamma receptor 1 (46). These mechanisms of resistance have been modeled pre-clinically with different readouts. Using shRNA knockdown in human and murine melanoma cell lines, Luo et al. (49) concluded that silencing of JAK1 but not JAK2 was critical for the effects of IFN-gamma and anti-PD-1. However, given the longstanding evidence that both JAK1 and JAK2 are required for IFN-gamma receptor signaling (43,45), it is likely that the differences in results may be due to the shRNA partial silencing approach. Furthermore, Williams et al. (50) used a murine model of melanoma expressing a strong foreign antigen to study the effects of JAK1 knockout in tumor implantation, showing that it resulted in decreased tumor outgrowth. This result is likely from the inability to express PD-L1 by the JAK1 knockout tumors, resulting in loss of adaptive immune resistance, and increased their clearance at the time of tumor implantation. Our data suggest that once the tumor cells with JAK1 knockout grow in vivo past the point of tumor implantation, then they become resistant to anti-PD-1 therapy due to the inability to respond to IFN-gamma and amplify the antitumor immune response.
The realization that IFN signaling by cancer cells is critical for anti-PD-1 response led us to hypothesize that changing the tumor microenvironment to have a strong IFN response by triggering pattern recognition receptors may overcome resistance due to lack of IFN-gamma signaling, and may improve the antitumor activity of immune checkpoint blockade therapy. Synthetic CpG-ODN agonists of TLR9 are being tested in the clinic in combination with the human anti-PD-1 antibody therapy. The combination of intratumoral SD101 with pembrolizumab resulted in antitumor responses in patients with advanced melanoma who were refractory or resistant to prior anti-PD-1 therapy (51). In the same way, early clinical trials using two other TLR9 agonists, CMP-001 (52) and IMO-2125 (53), or the double-stranded RNA (poly I:C) BO-112 (54), in combination with immune checkpoint inhibitors, resulted in objective antitumor responses in patients who had previously progressed on treatment with anti-PD-1. Together, these clinical data validate our mouse model findings and suggest a strategic approach for overcoming resistance to PD-1 blockade therapy. We observed that the JAK1/2 knockout tumors were still being recognized by antigen-specific T cells and could lead to specific cytotoxicity independent of IFN-gamma signaling, which provides evidence that if a TLR-9 agonist could re-activate type I IFN signaling in tumor microenvironment cells despite the cancer cells not being able to signal through the IFN receptor, then T cells will be able to exert antitumor activity.
Both JAK1/2 knockout tumors respond according to the mechanistic mode of action of SD-101 (55). Antitumor immune response involved in JAK1 knockout tumors were NK and CD4 T cell-dependent when treated with single SD-101, but the addition of anti-PD-1 recovers the central role of CD8 T cell effector demonstrating that these tumors may sensitize to synergistic effect of combined therapy. In contrast, JAK2 knockout tumors required mainly CD8+ T cells for tumor suppression, suggesting that JAK2 loss is a more favorable scenario for CD8+ T-cell responses.
Loss of function B2M mutations have been reported in microsatellite stable and MSI-high colorectal (56), melanoma (9,57) and lung cancers (58), and promote resistance to immunotherapy mediated by loss of antigen presentation (5,8–10,35). Some studies have found the loss of B2M in biopsies from patients who respond to anti-PD-1 (20,21), with corresponding supportive results when knocking out B2M in mouse models of immunotherapy (8), indirectly suggesting to us that activation of MHC class I-independent CD4+ T cells or innate immune cells such as NK cells may contribute to clinical response (18). Bempegaldesleukin is a CD122-preferential IL-2 pathway agonist that activates and expands effector CD4+ T, CD8+ T and NK cells (40,59). Combination therapy with bempegaldesleukin and nivolumab has shown encouraging objective responses in patients with treatment-naive melanoma with PD-L1 negative tumors (60,61). Consistent with our hypothesis, we obtained durable tumor responses with this combination in B2M knockout tumors. In line with the lack of MHC class I antigen presentation, depletion studies suggested that NK and CD4+ T cells, which are not restricted by MHC class I, play a key role in the antitumor immunity in B2M knockout tumors. Furthermore, Ardolino et al. (62) had also previously described that IL-2 therapy could induce antitumor responses in a model of MHC class I deficient mouse tumor. These studies provide strong mechanistic support for this a strategy of IL-2-based therapy with anti-PD-1 for treating patients with MHC class I deficient tumors who have progressed on prior anti-PD1-therapy, and may also enhance the antitumor activity in previously untreated tumors.
In conclusion, our study links the disruption of genes in the IFN receptor and antigen presentation pathways with mechanisms of resistance to PD-1 blockade therapy and may guide the design of effective combination therapies to overcome resistance. Even in the extreme setting of genetic resistance to PD-1 blockade by JAK1/2 loss of function mutations, resistance can be overcome by the intratumoral injection of a TLR9 agonist, while resistance through B2M loss can be overcome by an IL-2 pathway agonist potently activating an antitumor CD4+ T cell and NK response. Our findings strongly support the testing of these rational combinatorial strategies in patients with such mechanisms of anti-PD-1 resistance.
Methods
Human melanoma cell lines, cell culture and conditions:
Patient-derived melanoma cell lines were thawed and cultured at 37° C with 5% CO2 in RPMI-1640 medium supplemented with 10 % fetal bovine serum, 100 units/ml penicillin, 100 μg/ml streptomycin and 0.25 μg/ml amphotericin B. Cells were maintained and confirmed mycoplasma negative using MycoAlert Mycoplasma Detection Kit (Lonza). Cell lines were periodically sampled and used the GenePrint® 10 System for cellular authentication, and matched with the earliest passage cell lines. Cell lines were subject to experimental conditions after reaching two passages from thawing.
CRISPR/Cas9-Mediated knockout
The human melanoma cell lines M202, M233, M407 and M420 were subjected to CRISPR/Cas9-mediated knockout of JAK1, JAK2, and B2M. MC38 and B16 murine cell line were subjected to CRISPR/Cas9-mediated knockout of JAK1, JAK2, and B2M. Using the CRISPR design tool at http://www.deskgen.com, the sgRNAs targeting were designed (Table S4).
Human melanoma M407 with CRISPR/Cas9 mediated JAK1 and JAK2 knockouts were generated by lentiviral transduction using particles encoding guide RNAs, a fully functional CAS9 cassette, GFP, and puromycin as selectable markers (Sigma-Aldrich), as previously described (5). All other sgRNAs were cloned into the pSpCas9(BB)-2A-GFP vector (Addgene, Cambridge, MA) (63) and then transformed into One Shot® Stbl3™ Chemically Competent E. coli (Invitrogen) and cultured overnight in LB with ampicillin plates. Selected colonies were grown in LB overnight and DNA was isolated using the QIAprep midiprep kit (QIAGEN). Plasmids were then sequence-verified using a U6 promoter primer forward 5-GCCTATTTCCCATGATTCCTTC–3. Cells were transfected using lipofectamine 3000 manufacturer’s protocol (Thermo Fisher Scientific, Waltham, MA) and GFP positive cells were collected and single-cell sorted 48–72 hours after transfection at the UCLA Flow Cytometry core. Genomic DNA was isolated for each clone (NucleoSpin Tissue XS, Macherey-Nagel, Düren, Germany) and after a 700 base pair (bp) region containing the sgRNA was amplified by PCR using the HotStarTaq Master Mix (QIAGEN). Disruption was confirmed by Sanger sequencing with Tracking of Indels by Decomposition (64) (TIDE) web tool and finally confirmed by western blot.
Cell-Proliferation and growth-inhibition assays
Cell-proliferation and growth-inhibition assays were performed by real-time live cell imaging in an Incucyte ZOOM (Essen Biosciences, Ann Arbor, MI). 2000–5000 cells were seeded in 96-wells plates and cultured at 37° C. 24 hours after plating, culture media was replaced with fresh media with or without 5000 IU/ml IFN-alpha (Merck Millipore, Cat# IF007), 500 IU/ml IFN-beta (Merck Millipore, Cat# IF014) and 100 ng/ml IFN-gamma (BD Pharmingen, Cat# 554616) in human melanoma cell lines and IFN-alpha (Merck Millipore, Cat# IF009), IFN-beta (Merck Millipore, Cat# IF011) and IFN-gamma (Peprotech, Cat# 315–05) in mouse cell lines at the same concentrations. IFN concentrations were defined after dose-dependent growth inhibition optimization processes for all three IFNs (5).
Surface Flow Cytometry Analysis of PD-L1 and MHC Class I
Melanoma and murine cell lines were seeded into 6-well plates during day 1, targeting 70–80% of confluence on the day of surface staining. Following day, culture media was replaced with fresh media with or without IFN-alpha 5000 IU/ml, -beta 500 IU/ml, or -gamma 100 ng/ml (same conditions as above) for 18 hours. During day 3, after incubation time, cells were trypsinized and incubated at 37°C for 2 hours with media containing the same concentrations of IFN-alpha, -beta, or -gamma. Then media were removed by centrifugation and cells were resuspended with 100% FBS and stained with APC anti-PD-L1 and PE-Cy™7 anti-HLA-ABC in human melanoma cell lines or PE anti-PD-L1 and APC anti-MHC I in mice cell lines, on ice for 20 minutes. To continue, cells were washed once with 3 ml PBS and resuspended in 300 μL of PBS. Dead cell discriminator, 7-AAD, was added to samples prior to data acquisition by LSRII (Becton, Dickinson and Company). Data were analyzed using Flowjo software (version 10.0.8r1, Tree Star Inc., Ashland, OR). Experiments were performed at least twice for each cell line.
Functional Coculture Assays and IFN-gamma production by ELISA
Parental human M202 melanoma cell line and established JAK1, JAK2 and B2M knock-out sublines are HLA-A*0201+MART1+ cell lines used to analyze recognition by T-cell receptor transgenic T cells with the use of in vitro coculture assays. Cells were co-cultured with effector PBMCs (untransduced and MART-1 F5 specific TCR) at an effector/target ratio of 1:1, 2.5:1 and 10:1. Supernatants from six replicate wells for each condition were collected 24 hours postcoculturing and measured IFN-gamma release by ELISA (eBioscience, San Diego, CA). Cytotoxicity assay were conducted by real-time live cell imaging in an IncuCyte ZOOM (Essen Biosciences) and expressed as percentage of cells that were killed by effector cells over period of coculture. Cell lines were stably transfected with a nuclear localizing RFP (NucLight Red Lentivirus EF1a Reagent, Essen Biosciences) to facilitate cell counts. All experiments were performed in a minimum of three independent runs. Graph production and statistical data were analyzed via Prism software (Graphpad, La Jolla, CA).
RNA isolation and RNA-seq analysis of human melanoma cell lines
Melanoma cell lines were plated at 1.5–2.0 × 10⁶ cells per 10 cm dish or 2×10⁵ per 6-well plate well for IFN-gamma treatment. 24 hours after plating, culture media was replaced with fresh media with or without 100 ng/ml IFN-gamma (BD Pharmingen, Cat# 554616). Cells were harvested 6 hours after the start of IFN-gamma treatment, pellets were lysed in TRIzol reagent (Invitrogen, Cat# 15596018) and stored at −80°C before RNA extraction.
Total RNA was extracted using a protocol that combined the TRIzol method and the RNeasy mini kit (Qiagen Cat# 74104). Briefly, the aqueous phase containing RNA from the TRIzol extraction method was mixed with an equal amount of 70% Ethanol and loaded on a RNeasy mini column. The column was washed according to the kit manual and total RNA was eluted in 60 ul RNase free water. RNasin RNase inhibitor (Promega, Cat# N2511) was added to a final concentration of 2 U/ul. Total RNA was submitted for RNA-seq to the UCLA Technology Center for Genomics & Bioinformatics.
Single-end reads 50bp in length were mapped using HISAT2 (65) version 2.0.4 and aligned to the hg19 genome using default parameters. Reads were quantified using HTSeq (66) version 0.6.1 with the intersection-nonempty mode and counting ambiguous reads if fully overlapping. Raw counts were then normalized to fragments per kilobase of exon per million fragments mapped (FPKM) expression values. FPKM values were log2 transformed with an offset of 1, and normalized by gene for heatmap visualization. Change in gene expression was quantified by calculating the log2 fold change, comparing IFN-gamma treated to untreated cell lines. Genes were annotated as processes and pathways using the MSigDB (67), KEGG (68), and Reactome (69) gene sets. Heatmaps were created using the R statistical language (https://www.R-project.org) and the ggplot2 (70) package.
Western blots
Selected cell lines were maintained in 10 cm culture dishes and analyzed when 70–80% confluent. Western blot was performed as previously described(71). Primary antibodies included JAK1, JAK2, B2M and GAPDH (all were obtained from Cell Signaling Technology, Danvers, MA). Immuno-reactivity was analyzed with the ECL-Plus kit (Amersham Biosciences Co, Piscataway, NJ), using the ChemiDoc MP system (Bio-Rad Laboratories, Hercules, CA). Experiments were performed at least twice for each cell line.
Mice, cell lines and reagents
C57BL/6 mice were bred and kept under defined-flora pathogen-free conditions at the Association for the Assessment and Accreditation of Laboratory Animal Care approved animal facility of the Division of Experimental Radiation Oncology, University of California, Los Angeles (UCLA), and used under the UCLA Animal Research Committee protocol #2004-159-43I. The MC38 cell line was originally generated at the NCI Surgery Branch (originally labeled as Colo38), and was obtained from UCLA Department of Neurosurgery (Dr. Robert Prins). The B16-F10 mouse melanoma cell line were purchased from ATCC. The MC38 cell line, B16-F10 mouse melanoma cell line and established knockout cell lines were cultured at 37° C with 5% CO2 in DMEM medium (Invitrogen, Carlsbad, CA) supplemented with 10 % fetal bovine serum, 100 units/ml penicillin, 100 μg/ml streptomycin and 0.25 μg/ml amphotericin B. Cell lines were confirmed mycoplasma negative using MycoAlert Mycoplasma Detection Kit (Lonza), and periodically tested for authentication. For in vivo experiments, early passage cell lines were used (less than ten passages).
Antibodies for in vivo experiments: anti-mouse-PD-1 (clone RMP1–14), anti-mouse CD8 (clone YTS 169.4, BE0117), anti-mouse CD4 (clone GK1.5, BE0003), anti-mouse NK1.1 (clone PK136, BE0036) and isotype control antibody (clone 2A3, BE0089), all from BioXCell (West Lebanon, NH). The CpG-C oligodeoxynucleotide SD-101 were obtained under a material transfer agreement (MTA) with Dynavax. SD-101 was synthesized and purified by standard techniques as previously described (72). Bempegaldesleukin (NKTR-214 (40)) was provided by Nektar Therapeutics. Both are diluted in the recommended product formulation buffer for in vivo studies.
Antitumor studies in mouse models
To establish subcutaneous (s.c.) tumors, 0.3×10⁶ of MC38 wild-type or established JAK1, JAK2, B2M knockout cells per mouse were injected into the flanks of C57BL/6 mice. When tumors became palpable (day 5 or 6), four doses of 300 μg of anti–PD-1 or isotype control antibody were injected intraperitoneally (i.p.) every 3 days. Intratumoral treatment of SD-101 was used at 50 μg per injection. Bempegaldesleukin (NKTR-214) was used at 0.8 mg/kg every 9 days x 2 doses, intravenous (tail vein). For depletion studies, 300 μg of anti-CD8, 300 μg of anti-CD4, 300 μg of anti-NK1.1, or the combination were administered every 3 days starting the day before SD-101 or bempegaldesleukin until the end of the experiment. Splenocytes from control and depleted corresponding mice were taken to validate depletion efficacy. Tumors were followed from caliper measurements two or three times per week and tumor volume was calculated using the following formula: tumor volume= ((width)2 × length)/2. Mean and error standard of the tumor volumes per group was calculated.
Mass Cytometry (CyTOF) analysis
MC38 wild-type or established JAK1, JAK2 and B2M knockout tumor cells (0.3×10⁶) were implanted into the flanks of C57BL/6 mice. On day 13 following inoculation, tumors were harvested from mice at pre-defined treatment. Tumors were digested using the tumor dissociation kit mouse (Miltenyi, Bergisch Gladbach, Germany). Spleens were dissociated and filtered with a 70-micrometer filter following digestion with the ACK lysis buffer (Lonza, Basel, Switzerland). Samples staining and data acquisition were performed as previously described (34) except that used 3% paraformaldehyde and samples were not barcoded. A full list of immune markers used was described in Table S2. Samples were analyzed using Fluidigm® Helios™ (San Francisco, CA) mass cytometry system at the UCLA Flow Cytometry core. Samples were manually gated for cells, singlets and double expression of the viable CD45 single-cell-positive population (Figure S5b) using FlowJo software (version 10.4.2) and data files were analyzed using Cytofkit package (73) (R version 3.5.1). To identify and annotate each of the clusters obtained, cluster median data were normalized, and a threshold of >0.5 was used to define positive immune markers. T-distributed stochastic neighbor embedding plots were generated by PhenoGraph clustering through cytofkiyShinyAPP from Cytofkit. We used FlowSom, an unsupervised automated algorithm which orders cells according to their phenotypic similarities. FlowSom clustered the T-CD8 cells into three branches and thus distinguished exhausted T-CD8 populations.
MetaCyto analyses
MetaCyto was performed using the default workflow for both flow and mass cytometry (CyTOF) data as previously described (39). By combining and clustering the markers for all datasets, MetaCyto is able to identify and track specific immune cell populations present across heterogeneous studies. We included the MetaCyto automated unsupervised clusters determined from the aggregated experiments and additionally supplied a list of pre-determined functional clusters as listed Table S3 for the analysis. For each phenotype, we performed a regression analysis to estimate effect sizes and p-values of the treatment relative to isotype in each immune cluster. Results were plotted via Prismv8 software (Graphpad, La Jolla, CA). MetaCyto is available as an R package on Bioconductor: (http://bioconductor.org/packages/release/bioc/html/MetaCyto.html).
Gene Expression Assays
Total RNAs were extracted using the PureLink RNA Mini Kit (Invitrogen). CXCL9 and CXCL10 expression was measured by reverse transcription PCR following manufacturer’s protocol for the Power SYBR Green RNA-to-CT 1-Step Kit (Applied Biosystems) and using the following primers: CXCL9: 5′- CCCAATTGCAACAAAACTGA-3′ and 5′- AGTCCGGATCTAGGCAGGTT-3′ and CXCL10: 5′-AATCATCCCTGCGAGCCTAT-3′ and 5′-TTTTTGGCTAAACGCTTTCAT-3′.
Supplementary Material
Statement of Significance.
The activation of IFN signaling through pattern recognition receptors and the stimulation of NK cells overcome genetic mechanisms of resistance to PD-1 blockade therapy mediated through deficient IFN receptor and antigen presentation pathways. These approaches are being tested in the clinic to improve the antitumor activity of PD-1 blockade therapy.
Acknowledgments
This study was funded in part by the Parker Institute for Cancer Immunotherapy, NIH grants R35 CA197633 and P01 CA244118, the Ressler Family Fund and the support from Ken and Donna Schultz (to A.R.). D.Y.T was supported by a Young Investigator Award from ASCO, a grant from the Spanish Society of Medical Oncology for Translational Research in Reference Centers and the V Foundation-Gil Nickel Family Endowed Fellowship in Melanoma Research. It has been developed within the framework of a medical doctorate at the Autonomous University of Barcelona. G.A-R. was supported by the Isabel & Harvey Kibel Fellowship Award and the Alan Ghitis Fellowship Award for Melanoma Research. J.T. and K.C. were supported by the NIH Ruth L. Kirschstein Institutional National Research Service Award #T32-CA009120 and the UCLA Tumor Immunology Training Grant (T32CA009120). G.P. was supported by the V Foundation-Gil Nickel Family Endowed Fellowship in Melanoma Research. J.M.Z. was in the UCLA Medical Scientist Training Program supported by NIH training grant GM08042. S.H-L. was supported by a Conquer Cancer Foundation ASCO Career Development Award, a UCLA KL2 Translational Research Award, and a Melanoma Research Alliance Young Investigator Award. Flow and mass cytometry were performed in the UCLA Jonsson Comprehensive Cancer Center (JCCC) and Center for AIDS Research Flow Cytometry Core Facility that is supported by NIH awards P30 CA016042 and 5P30 AI028697, and by the JCCC, the UCLA AIDS Institute, and the David Geffen School of Medicine at UCLA. The purchase of the Helios mass cytometer that was used in this work was supported, in part, by the funds provided by the James B. Pendleton Charitable Trust. We want to thank Dr. Cristiana Guiducci from Dynavax and Drs. Deborah Charych and Willem Overwijk from Nektar Therapeutics for helpful guidance in the performance of in vivo studies with SD101 and bempegaldesleukin, respectively.
Footnotes
Disclosure of Potential Conflicts of Interests: A.R. has received honoraria from consulting with Amgen, Bristol-Myers Squibb, Chugai, Dynavax, Genentech, Merck, Nektar, Novartis, Roche and Sanofi, is or has been a member of the scientific advisory board and holds stock in Advaxis, Arcus Biosciences, Bioncotech Therapeutics, Compugen, CytomX, Five Prime, RAPT, ImaginAb, Isoplexis, Kite-Gilead, Lutris Pharma, Merus, PACT Pharma, Rgenix and Tango Therapeutics. S.H.L. is a consultant/advisory board member for Amgen, Merck, Genmab, Xencor and BMS. Research support for BMS, Merck and Vaccinex and Contracted research for Pfizer, Plexxikon, Genentech, Neon Therapeutics, Nektar, Astellas, F Star and Xencor. D.Y.T. and A.R. are inventors in patent application covering the use of combinations of TLR9 agonists and NK activators with PD-1 blockade therapy for the treatment of cancer. No potential conflicts of interest were disclosed by the other authors.
References
- 1.Sharma P, Hu-Lieskovan S, Wargo JA, Ribas A. Primary, Adaptive, and Acquired Resistance to Cancer Immunotherapy. Cell. 2017;168:707–23. [DOI] [PMC free article] [PubMed] [Google Scholar]
- 2.Jenkins RW, Barbie DA, Flaherty KT. Mechanisms of resistance to immune checkpoint inhibitors. Br J Cancer. 2018;118:9–16. [DOI] [PMC free article] [PubMed] [Google Scholar]
- 3.Gide TN, Wilmott JS, Scolyer RA, Long GV. Primary and Acquired Resistance to Immune Checkpoint Inhibitors in Metastatic Melanoma. Clin Cancer Res. 2018;24:1260–70. [DOI] [PubMed] [Google Scholar]
- 4.Shin DS, Zaretsky JM, Escuin-Ordinas H, Garcia-Diaz A, Hu-Lieskovan S, Kalbasi A, et al. Primary Resistance to PD-1 Blockade Mediated by JAK1/2 Mutations. Cancer Discov. 2017;7:188–201. [DOI] [PMC free article] [PubMed] [Google Scholar]
- 5.Zaretsky JM, Garcia-Diaz A, Shin DS, Escuin-Ordinas H, Hugo W, Hu-Lieskovan S, et al. Mutations Associated with Acquired Resistance to PD-1 Blockade in Melanoma. N Engl J Med. 2016;375:819–29. [DOI] [PMC free article] [PubMed] [Google Scholar]
- 6.Sucker A, Zhao F, Pieper N, Heeke C, Maltaner R, Stadtler N, et al. Acquired IFNγ resistance impairs anti-tumor immunity and gives rise to T-cell-resistant melanoma lesions. Nat Commun. 2017;8:15440. [DOI] [PMC free article] [PubMed] [Google Scholar]
- 7.Albacker LA, Wu J, Smith P, Warmuth M, Stephens PJ, Zhu P, et al. Loss of function JAK1 mutations occur at high frequency in cancers with microsatellite instability and are suggestive of immune evasion. Reis RM, editor. PLoS ONE. 2017;12:e0176181. [DOI] [PMC free article] [PubMed] [Google Scholar]
- 8.Gettinger S, Choi J, Hastings K, Truini A, Datar I, Sowell R, et al. Impaired HLA Class I Antigen Processing and Presentation as a Mechanism of Acquired Resistance to Immune Checkpoint Inhibitors in Lung Cancer. Cancer Discov. 2017;7:1420–35. [DOI] [PMC free article] [PubMed] [Google Scholar]
- 9.Sade-Feldman M, Jiao YJ, Chen JH, Rooney MS, Barzily-Rokni M, Eliane J-P, et al. Resistance to checkpoint blockade therapy through inactivation of antigen presentation. Nat Commun. 2017;8:1136. [DOI] [PMC free article] [PubMed] [Google Scholar]
- 10.Huang AC, Orlowski RJ, Xu X, Mick R, George SM, Yan PK, et al. A single dose of neoadjuvant PD-1 blockade predicts clinical outcomes in resectable melanoma. Nat Med. 2019;25:454–61. [DOI] [PMC free article] [PubMed] [Google Scholar]
- 11.Hellmann MD, Nathanson T, Rizvi H, Creelan BC, Sanchez-Vega F, Ahuja A, et al. Genomic Features of Response to Combination Immunotherapy in Patients with Advanced Non-Small-Cell Lung Cancer. Cancer Cell. 2018;33:843–852.e4. [DOI] [PMC free article] [PubMed] [Google Scholar]
- 12.Riaz N, Havel JJ, Makarov V, Desrichard A, Urba WJ, Sims JS, et al. Tumor and Microenvironment Evolution during Immunotherapy with Nivolumab. Cell. 2017;171:934–949.e16. [DOI] [PMC free article] [PubMed] [Google Scholar]
- 13.Manguso RT, Pope HW, Zimmer MD, Brown FD, Yates KB, Miller BC, et al. In vivo CRISPR screening identifies Ptpn2 as a cancer immunotherapy target. Nature. 2017;547:413–8. [DOI] [PMC free article] [PubMed] [Google Scholar]
- 14.Patel SJ, Sanjana NE, Kishton RJ, Eidizadeh A, Vodnala SK, Cam M, et al. Identification of essential genes for cancer immunotherapy. Nature. 2017;548:537–42. [DOI] [PMC free article] [PubMed] [Google Scholar]
- 15.Pan D, Kobayashi A, Jiang P, Ferrari de Andrade L, Tay RE, Luoma AM, et al. A major chromatin regulator determines resistance of tumor cells to T cell–mediated killing. Science. 2018;359:770–5. [DOI] [PMC free article] [PubMed] [Google Scholar]
- 16.Kearney CJ, Vervoort SJ, Hogg SJ, Ramsbottom KM, Freeman AJ, Lalaoui N, et al. Tumor immune evasion arises through loss of TNF sensitivity. Sci Immunol. 2018;3:eaar3451. [DOI] [PubMed] [Google Scholar]
- 17.Vredevoogd DW, Kuilman T, Ligtenberg MA, Boshuizen J, Stecker KE, de Bruijn B, et al. Augmenting Immunotherapy Impact by Lowering Tumor TNF Cytotoxicity Threshold. Cell. 2019;178:585–599.e15. [DOI] [PubMed] [Google Scholar]
- 18.Benci JL, Johnson LR, Choa R, Xu Y, Qiu J, Zhou Z, et al. Opposing Functions of Interferon Coordinate Adaptive and Innate Immune Responses to Cancer Immune Checkpoint Blockade. Cell. 2019;178:933–948.e14. [DOI] [PMC free article] [PubMed] [Google Scholar]
- 19.Liu D, Schilling B, Liu D, Sucker A, Livingstone E, Jerby-Amon L, et al. Integrative molecular and clinical modeling of clinical outcomes to PD1 blockade in patients with metastatic melanoma. Nat Med. 2019;25:1916–27. [DOI] [PMC free article] [PubMed] [Google Scholar]
- 20.Rizvi H, Sanchez-Vega F, La K, Chatila W, Jonsson P, Halpenny D, et al. Molecular Determinants of Response to Anti–Programmed Cell Death (PD)-1 and Anti–Programmed Death-Ligand 1 (PD-L1) Blockade in Patients With Non–Small-Cell Lung Cancer Profiled With Targeted Next-Generation Sequencing. JCO. 2018;36:633–41. [DOI] [PMC free article] [PubMed] [Google Scholar]
- 21.Rodig SJ, Gusenleitner D, Jackson DG, Gjini E, Giobbie-Hurder A, Jin C, et al. MHC proteins confer differential sensitivity to CTLA-4 and PD-1 blockade in untreated metastatic melanoma. Sci Transl Med. 2018;10:eaar3342. [DOI] [PubMed] [Google Scholar]
- 22.Blank CU, Rozeman EA, Fanchi LF, Sikorska K, van de Wiel B, Kvistborg P, et al. Neoadjuvant versus adjuvant ipilimumab plus nivolumab in macroscopic stage III melanoma. Nat Med. 2018;24:1655–61. [DOI] [PubMed] [Google Scholar]
- 23.Paulson KG, Voillet V, McAfee MS, Hunter DS, Wagener FD, Perdicchio M, et al. Acquired cancer resistance to combination immunotherapy from transcriptional loss of class I HLA. Nat Commun. 2018;9:3868. [DOI] [PMC free article] [PubMed] [Google Scholar]
- 24.Patel SA, Minn AJ. Combination Cancer Therapy with Immune Checkpoint Blockade: Mechanisms and Strategies. Immunity. 2018;48:417–33. [DOI] [PMC free article] [PubMed] [Google Scholar]
- 25.Siegal FP. The Nature of the Principal Type 1 Interferon-Producing Cells in Human Blood. Science. 1999;284:1835–7. [DOI] [PubMed] [Google Scholar]
- 26.Rezvani K, Rouce R, Liu E, Shpall E. Engineering Natural Killer Cells for Cancer Immunotherapy. Molecular Therapy. 2017;25:1769–81. [DOI] [PMC free article] [PubMed] [Google Scholar]
- 27.Kärre K, Ljunggren HG, Piontek G, Kiessling R. Selective rejection of H–2-deficient lymphoma variants suggests alternative immune defence strategy. Nature. 1986;319:675–8. [DOI] [PubMed] [Google Scholar]
- 28.Bix M, Liao N-S, Zijlstra M, Loring J, Jaenisch R, Raulet D. Rejection of class I MHC-deficient haemopoietic cells by irradiated MHC-matched mice. Nature. 1991;349:329–31. [DOI] [PubMed] [Google Scholar]
- 29.Homet Moreno B, Zaretsky JM, Garcia-Diaz A, Tsoi J, Parisi G, Robert L, et al. Response to Programmed Cell Death-1 Blockade in a Murine Melanoma Syngeneic Model Requires Costimulation, CD4, and CD8 T Cells. Cancer Immunology Research. 2016;4:845–57. [DOI] [PMC free article] [PubMed] [Google Scholar]
- 30.Mosely SIS, Prime JE, Sainson RCA, Koopmann J-O, Wang DYQ, Greenawalt DM, et al. Rational Selection of Syngeneic Preclinical Tumor Models for Immunotherapeutic Drug Discovery. Cancer Immunol Res. 2017;5:29–41. [DOI] [PubMed] [Google Scholar]
- 31.Parker BS, Rautela J, Hertzog PJ. Antitumour actions of interferons: implications for cancer therapy. Nat Rev Cancer. 2016;16:131–44. [DOI] [PubMed] [Google Scholar]
- 32.Chodon T, Comin-Anduix B, Chmielowski B, Koya RC, Wu Z, Auerbach M, et al. Adoptive Transfer of MART-1 T-Cell Receptor Transgenic Lymphocytes and Dendritic Cell Vaccination in Patients with Metastatic Melanoma. Clinical Cancer Research. 2014;20:2457–65. [DOI] [PMC free article] [PubMed] [Google Scholar]
- 33.Johnson LA, Morgan RA, Dudley ME, Cassard L, Yang JC, Hughes MS, et al. Gene therapy with human and mouse T-cell receptors mediates cancer regression and targets normal tissues expressing cognate antigen. Blood. 2009;114:535–46. [DOI] [PMC free article] [PubMed] [Google Scholar]
- 34.Wei SC, Levine JH, Cogdill AP, Zhao Y, Anang N-AAS, Andrews MC, et al. Distinct Cellular Mechanisms Underlie Anti-CTLA-4 and Anti-PD-1 Checkpoint Blockade. Cell. 2017;170:1120–1133.e17. [DOI] [PMC free article] [PubMed] [Google Scholar]
- 35.Miao D, Margolis CA, Gao W, Voss MH, Li W, Martini DJ, et al. Genomic correlates of response to immune checkpoint therapies in clear cell renal cell carcinoma. Science. 2018;359:801–6. [DOI] [PMC free article] [PubMed] [Google Scholar]
- 36.Thommen DS, Schumacher TN. T Cell Dysfunction in Cancer. Cancer Cell. 2018;33:547–62. [DOI] [PMC free article] [PubMed] [Google Scholar]
- 37.Miller BC, Sen DR, Al Abosy R, Bi K, Virkud YV, LaFleur MW, et al. Subsets of exhausted CD8+ T cells differentially mediate tumor control and respond to checkpoint blockade. Nat Immunol. 2019;20:326–36. [DOI] [PMC free article] [PubMed] [Google Scholar]
- 38.Pauken KE, Wherry EJ. SnapShot: T Cell Exhaustion. Cell. 2015;163:1038–1038.e1. [DOI] [PubMed] [Google Scholar]
- 39.Hu Z, Jujjavarapu C, Hughey JJ, Andorf S, Lee H-C, Gherardini PF, et al. MetaCyto: A Tool for Automated Meta-analysis of Mass and Flow Cytometry Data. Cell Reports. 2018;24:1377–88. [DOI] [PMC free article] [PubMed] [Google Scholar]
- 40.Charych DH, Hoch U, Langowski JL, Lee SR, Addepalli MK, Kirk PB, et al. NKTR-214, an Engineered Cytokine with Biased IL2 Receptor Binding, Increased Tumor Exposure, and Marked Efficacy in Mouse Tumor Models. Clinical Cancer Research. 2016;22:680–90. [DOI] [PubMed] [Google Scholar]
- 41.Parisi G, Saco JD, Salazar FB, Tsoi J, Krystofinski P, Puig-Saus C, et al. Persistence of adoptively transferred T cells with a kinetically engineered IL-2 receptor agonist. Nat Commun 2020;11:660. [DOI] [PMC free article] [PubMed] [Google Scholar]
- 42.Dunn GP, Bruce AT, Ikeda H, Old LJ, Schreiber RD. Cancer immunoediting: from immunosurveillance to tumor escape. Nat Immunol. 2002;3:991–8. [DOI] [PubMed] [Google Scholar]
- 43.Kaplan DH, Shankaran V, Dighe AS, Stockert E, Aguet M, Old LJ, et al. Demonstration of an interferon -dependent tumor surveillance system in immunocompetent mice. Proceedings of the National Academy of Sciences. 1998;95:7556–61. [DOI] [PMC free article] [PubMed] [Google Scholar]
- 44.Dunn GP, Sheehan KCF, Old LJ, Schreiber RD. IFN Unresponsiveness in LNCaP Cells Due to the Lack of JAK1 Gene Expression. Cancer Res. 2005;65:3447–53. [DOI] [PubMed] [Google Scholar]
- 45.Fish EN, Platanias LC. Interferon Receptor Signaling in Malignancy: A Network of Cellular Pathways Defining Biological Outcomes. Molecular Cancer Research. 2014;12:1691–703. [DOI] [PMC free article] [PubMed] [Google Scholar]
- 46.Doran SL, Stevanović S, Adhikary S, Gartner JJ, Jia L, Kwong MLM, et al. T-Cell Receptor Gene Therapy for Human Papillomavirus–Associated Epithelial Cancers: A First-in-Human, Phase I/II Study. JCO. 2019;37:2759–68. [DOI] [PMC free article] [PubMed] [Google Scholar]
- 47.Ren Y, Zhang Y, Liu RZ, Fenstermacher DA, Wright KL, Teer JK, et al. JAK1 truncating mutations in gynecologic cancer define new role of cancer-associated protein tyrosine kinase aberrations. Sci Rep. 2013;3:3042. [DOI] [PMC free article] [PubMed] [Google Scholar]
- 48.Stelloo E, Versluis MA, Nijman HW, de Bruyn M, Plat A, Osse EM, et al. Microsatellite instability derived JAK1 frameshift mutations are associated with tumor immune evasion in endometrioid endometrial cancer. Oncotarget. 2016;7:39885–93. [DOI] [PMC free article] [PubMed] [Google Scholar]
- 49.Luo N, Formisano L, Gonzalez-Ericsson PI, Sanchez V, Dean PT, Opalenik SR, et al. Melanoma response to anti-PD-L1 immunotherapy requires JAK1 signaling, but not JAK2. OncoImmunology. 2018;7:e1438106. [DOI] [PMC free article] [PubMed] [Google Scholar]
- 50.Williams JB, Li S, Higgs EF, Cabanov A, Wang X, Huang H, et al. Tumor heterogeneity and clonal cooperation influence the immune selection of IFN-γ-signaling mutant cancer cells. Nat Commun. 2020;11:602. [DOI] [PMC free article] [PubMed] [Google Scholar]
- 51.Ribas A, Medina T, Kummar S, Amin A, Kalbasi A, Drabick JJ, et al. SD-101 in Combination with Pembrolizumab in Advanced Melanoma: Results of a Phase Ib, Multicenter Study. Cancer Discov. 2018;8:1250–7. [DOI] [PMC free article] [PubMed] [Google Scholar]
- 52.Milhem MM, Zarour HM, Gabrail NY, Mauro DJ, Greenberg NM, Slichenmyer WJ, et al. Phase Ib trial of the CpG-A Oligonucleotide CMP-001 combined with pembrolizumab (Pembro) in patients with advanced melanoma. JCO. 2016;34:TPS9593–TPS9593. [Google Scholar]
- 53.Diab A, Rahimian S, Haymaker CL, Bernatchez C, Andtbacka RHI, James M, et al. A phase 2 study to evaluate the safety and efficacy of Intratumoral (IT) injection of the TLR9 agonist IMO-2125 (IMO) in combination with ipilimumab (ipi) in PD-1 inhibitor refractory melanoma. JCO. 2018;36:9515–9515. [Google Scholar]
- 54.Marquez Rodas I, Longo F, Rodriguez-Ruiz M, Calles A, Pérez-Gracia JL, Gomez-Rueda A, et al. Intratumoral BO-112, a double-stranded RNA (dsRNA), alone and in combination with systemic anti-PD-1 in solid tumors. Annals of Oncology. 2018;29:viii732. [Google Scholar]
- 55.Wang S, Campos J, Gallotta M, Gong M, Crain C, Naik E, et al. Intratumoral injection of a CpG oligonucleotide reverts resistance to PD-1 blockade by expanding multifunctional CD8 + T cells. Proc Natl Acad Sci USA. 2016;113:E7240–9. [DOI] [PMC free article] [PubMed] [Google Scholar]
- 56.Grasso CS, Giannakis M, Wells DK, Hamada T, Mu XJ, Quist M, et al. Genetic Mechanisms of Immune Evasion in Colorectal Cancer. Cancer Discov. 2018;8:730–49. [DOI] [PMC free article] [PubMed] [Google Scholar]
- 57.del Campo AB, Kyte JA, Carretero J, Zinchencko S, Méndez R, González-Aseguinolaza G, et al. Immune escape of cancer cells with beta2-microglobulin loss over the course of metastatic melanoma: Immune escape of cancer cells. Int J Cancer. 2014;134:102–13. [DOI] [PubMed] [Google Scholar]
- 58.McGranahan N, Rosenthal R, Hiley CT, Rowan AJ, Watkins TBK, Wilson GA, et al. Allele-Specific HLA Loss and Immune Escape in Lung Cancer Evolution. Cell. 2017;171:1259–1271.e11. [DOI] [PMC free article] [PubMed] [Google Scholar]
- 59.Charych D, Khalili S, Dixit V, Kirk P, Chang T, Langowski J, et al. Modeling the receptor pharmacology, pharmacokinetics, and pharmacodynamics of NKTR-214, a kinetically-controlled interleukin-2 (IL2) receptor agonist for cancer immunotherapy. Tsirka SE, editor. PLoS ONE. 2017;12:e0179431. [DOI] [PMC free article] [PubMed] [Google Scholar]
- 60.Hurwitz ME, Cho DC, Balar AV, Curti BD, Siefker-Radtke AO, Sznol M, et al. Baseline tumor-immune signatures associated with response to bempegaldesleukin (NKTR-214) and nivolumab. JCO. 2019;37:2623–2623. [Google Scholar]
- 61.Sharma M, Khong H, Fa’ak F, Bentebibel S-E, Janssen LME, Chesson BC, et al. Bempegaldesleukin selectively depletes intratumoral Tregs and potentiates T cell-mediated cancer therapy. Nat Commun. 2020;11:661. [DOI] [PMC free article] [PubMed] [Google Scholar]
- 62.Ardolino M, Azimi CS, Iannello A, Trevino TN, Horan L, Zhang L, et al. Cytokine therapy reverses NK cell anergy in MHC-deficient tumors. J Clin Invest. 2014;124:4781–94. [DOI] [PMC free article] [PubMed] [Google Scholar]
- 63.Ran FA, Hsu PD, Wright J, Agarwala V, Scott DA, Zhang F. Genome engineering using the CRISPR-Cas9 system. Nat Protoc. 2013;8:2281–308. [DOI] [PMC free article] [PubMed] [Google Scholar]
- 64.Brinkman EK, Chen T, Amendola M, van Steensel B. Easy quantitative assessment of genome editing by sequence trace decomposition. Nucleic Acids Research. 2014;42:e168–e168. [DOI] [PMC free article] [PubMed] [Google Scholar]
- 65.Kim D, Langmead B, Salzberg SL. HISAT: a fast spliced aligner with low memory requirements. Nat Methods. 2015;12:357–60. [DOI] [PMC free article] [PubMed] [Google Scholar]
- 66.Anders S, Pyl PT, Huber W. HTSeq--a Python framework to work with high-throughput sequencing data. Bioinformatics. 2015;31:166–9. [DOI] [PMC free article] [PubMed] [Google Scholar]
- 67.Subramanian A, Tamayo P, Mootha VK, Mukherjee S, Ebert BL, Gillette MA, et al. Gene set enrichment analysis: A knowledge-based approach for interpreting genome-wide expression profiles. Proceedings of the National Academy of Sciences. 2005;102:15545–50. [DOI] [PMC free article] [PubMed] [Google Scholar]
- 68.Kanehisa M KEGG: Kyoto Encyclopedia of Genes and Genomes. Nucleic Acids Research. 2000;28:27–30. [DOI] [PMC free article] [PubMed] [Google Scholar]
- 69.Fabregat A, Jupe S, Matthews L, Sidiropoulos K, Gillespie M, Garapati P, et al. The Reactome Pathway Knowledgebase. Nucleic Acids Research. 2018;46:D649–55. [DOI] [PMC free article] [PubMed] [Google Scholar]
- 70.Wickham H ggplot2 [Internet]. Cham: Springer International Publishing; 2016. [cited 2019 Aug 20] Available from: http://link.springer.com/10.1007/978-3-319-24277-4 [Google Scholar]
- 71.Escuin-Ordinas H, Atefi M, Fu Y, Cass A, Ng C, Huang RR, et al. COX-2 inhibition prevents the appearance of cutaneous squamous cell carcinomas accelerated by BRAF inhibitors. Molecular Oncology. 2014;8:250–60. [DOI] [PMC free article] [PubMed] [Google Scholar]
- 72.Marshall JD, Fearon KL, Higgins D, Hessel EM, Kanzler H, Abbate C, et al. Superior Activity of the Type C Class of ISS In Vitro and In Vivo Across Multiple Species. DNA and Cell Biology. 2005;24:63–72. [DOI] [PubMed] [Google Scholar]
- 73.Chen H, Lau MC, Wong MT, Newell EW, Poidinger M, Chen J. Cytofkit: A Bioconductor Package for an Integrated Mass Cytometry Data Analysis Pipeline. Schneidman D, editor. PLoS Comput Biol. 2016;12:e1005112. [DOI] [PMC free article] [PubMed] [Google Scholar]
Associated Data
This section collects any data citations, data availability statements, or supplementary materials included in this article.