

Summary:
Here, we perform a genome-wide screen for variants that regulate the expression of modules of co-expressed genes in the aging human brain; we discover and replicate such variants in the TMEM106B and RBFOX1 loci. The TMEM106B haplotype is known to influence the accumulation of TDP-43 proteinopathy, and its large-scale transcriptomic effects include dysregulation of lysosomal genes and alterations in synaptic gene splicing also seen in the pathophysiology of TDP-43 proteinopathy. Further, a variant near GRN, another TDP-43 proteinopathy susceptibility gene, shows concordant effects with the TMEM106B haplotype. Leveraging neuropathology data from the same participants, we also show that TMEM106B and APOE/amyloid-β effects converge to alter myelination/lysosomal gene expression, which then contributes to TDP-43 accumulation. These results advance our mechanistic understanding of the TMEM106B TDP-43 risk haplotype and uncover a transcriptional program that mediates APOE/amyloid-β and TMEM106B effects on TDP-43 aggregation in older adults.
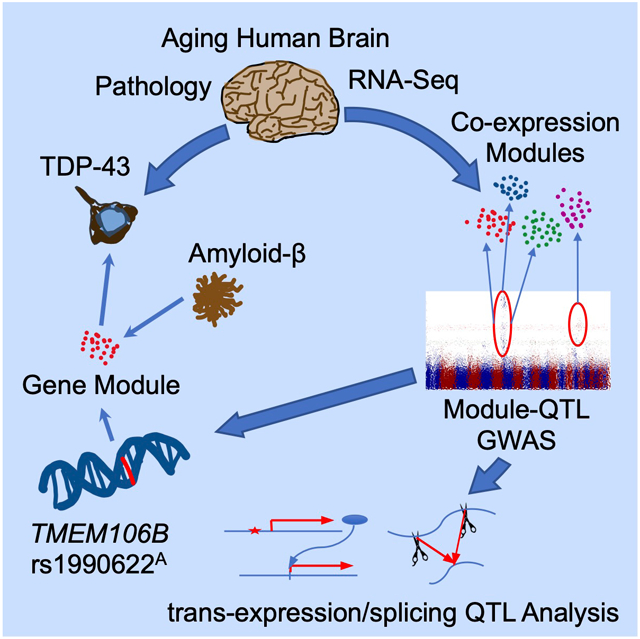
Graphical Abstract
eTOC Blurb
Yang et al. perform a genome-wide screen of regulators of gene co-expression modules and identify TMEM106B and RBFOX1 as key aging human brain transcriptome regulators. Further, TMEM106B and APOE/amyloid-β effects converged on a transcriptional program that mediates TDP-43 aggregation, revealing a key pathogenic link between Alzheimer’s disease and TDP-43 proteinopathy.
Introduction
Many common genetic variants regulate local (cis-) or distant (trans-) gene expressions, thereby contributing to phenotypic variability and disease risk (Albert and Kruglyak, 2015). Genetic regulation of local gene expression has been extensively studied, and numerous cis-expression quantitative trait loci (cis-eQTLs) have been identified from multiple human tissues (Albert and Kruglyak, 2015; GTEx Consortium, 2017; Ng et al., 2017). However, genetic factors that determine distant gene expression (trans-eQTLs)—that are more tissue- and context-specific—are not as well characterized, as their discovery is hampered by the extensive multiple testing burden to consider millions of variants against more than ten thousand transcripts in the context of tissue-specific functions and diseases (Albert and Kruglyak, 2015; Brynedal et al., 2017; GTEx Consortium, 2017; Westra et al., 2013). This methodological limitation is especially problematic for tissues with limited sample access and extensive heterogeneity, such as the aging human brain tissue that is usually available only through autopsy and is affected by multiple and frequently coexisting neuropathologic changes, such as Alzheimer’s disease (AD), vascular brain injury (VBI), Lewy bodies, and limbic-predominant age-related TAR DNA binding protein-43 kDa (TDP-43) encephalopathy neuropathological change (LATE-NC), that alone or in combination cause dementia (Kapasi et al., 2017; Nelson et al., 2019). As trans-eQTLs substantially contribute to gene expression and can provide key insights into disease mechanisms (Albert and Kruglyak, 2015; Brynedal et al., 2017; GTEx Consortium, 2017; Westra et al., 2013), it is critical to further characterize trans-eQTLs to understand their role in prevalent diseases without cure, such as neurodegenerative dementia in the rapidly aging population (Alzheimer's Association, 2018).
To overcome methodological challenges in genome-wide assessments of trans-eQTLs, we focused on the fact that trans-eQTLs often regulate expression of multiple biologically related genes (Albert and Kruglyak, 2015; Brynedal et al., 2017; GTEx Consortium, 2017; Westra et al., 2013). Such co-regulated transcriptional programs can be captured as groups of co-expressed genes that fluctuate in synchrony across individuals (Mostafavi et al., 2018; Parikshak et al., 2015), which we refer to as “modules.” This modular structure of the transcriptome can be leveraged for dimensionality reduction: instead of performing trans-eQTL GWAS for each gene, we aimed to identify “module-quantitative trait loci (modQTL)” that regulate the average expression of the genes found in the gene co-expression modules. We utilized two community-based prospective cohorts of older adults with brain autopsies as a primary (discovery) dataset, and a brain bank-based study as a replication dataset. We performed a genome-wide association studies (GWAS) to identify and replicate modQTLs in the aging human cerebral cortex. Then, we performed detailed characterization of these modQTLs using gene expression, RNA splicing, neuropathology, and cognitive data from each individual, to elaborate the causal chain of events linking the genetics of gene expression to late-life dementia.
Results
Discovery and replication of modQTL genome-wide associations
The primary (discovery) dataset was assembled from deceased participants in either the Religious Orders Study or the Rush Memory and Aging Project (ROSMAP), two community-based cohorts of older adults that capture a continuous spectrum of pathology and cognition found in aging and dementia (n=494, 62% female, median age at death=88.8 years; Table S1) (Bennett et al., 2018; Bennett et al., 2012a; Bennett et al., 2012b; De Jager et al., 2018; Mostafavi et al., 2018). The first replication dataset (“replication 1”) was from the Mayo RNAseq study, a case-control study using samples from the Mayo Clinic and Banner Sun Health brain banks (n=185, 56% female, median age at death=86 years; Table S2) (Allen et al., 2016; Allen et al., 2018a; Allen et al., 2018b). We also leveraged independently processed RNA-Seq data from deceased ROSMAP participants who were not included in the primary dataset as the second replication dataset (“replication 2”; n=89, 73% female, median age at death=90.5 years; Table S1) (De Jager et al., 2018; Logsdon et al., 2019).
We first performed 47 independent GWAS in the primary dataset, one for the average expression of each of the 47 non-overlapping dorsolateral prefrontal cortex (DLPFC) coexpression modules derived from the same dataset (Mostafavi et al., 2018). These modules capture large gene co-expression networks that reflect known biological pathways and capture gene expression changes associated with neuropathologic and cognitive endophenotypes of AD (Mostafavi et al., 2018). Further, this module structure has been shown to be largely preserved across independent datasets and different clustering algorithms (Mostafavi et al., 2018), and we used this module membership definition throughout this study to enable direct comparisons across primary and replication datasets. In the primary analysis, we identified two loci with a significant modQTL effect (significance threshold for 47 GWAS, p<1.1×10⁻⁹): (1) a linkage disequilibrium (LD) block which contains only the TMEM106B gene where a haplotype tagged by rs1990622A (ROSMAP allele frequency (AF) 0.55) was associated with expression of four different modules, and (2) an intronic allele within RBFOX1 (rs78930980G; ROSMAP AF 0.02) which was associated with expression of another module (Fig. 1, Table 1; see table S3 for the full list of module Gene Ontology (GO) term enrichments). In addition, there were 11 suggestive modQTLs (1.1×10⁻⁹<p<5.0×10⁻⁸), two of which are also influenced by the same TMEM106B locus (Table S4). Conditional analyses ruled out independent secondary modQTL effects within either the TMEM106B or the RBFOX1 region (Figure S1).
Figure 1. Module quantitative trait loci (ROSMAP).

Summary of the genome-wide association studies (GWAS) of gene co-expression module levels in the primary dataset (ROSMAP DLPFC, n=494). The circos plot displays five independent Manhattan plots: each colored sector represents a Manhattan plot summarizing the GWAS result for a module that had a significant modQTL. Outer (red) dotted circle indicates the Bonferroni-corrected p-value threshold for genome-wide significance, considering 47 independent GWAS we conducted, each for one of the 47 ROSMAP DLPFC modules. Inner (blue) dotted circle indicates genome-wide threshold for a single GWAS (p=5×10⁻⁸). Top association SNP is noted for each module, and the candidate gene corresponding to each SNP is noted in parenthesis. We note that four TMEM106B SNPs are in the same haplotype with rs1990622 (D’=0.99 to 1, r2=0.95 to 0.98).
Table 1. ModQTLs.
Significantly associated modQTLs from the primary discovery analyses in ROSMAP, with replication analyses in the Mayo RNAseq study (replication 1) and additional ROSMAP participants (replication 2). aMost enriched cell type” for each module indicates the cell type that has a gene expression profile with highest median rank of expression for each module’s gene members, and points to a cell type that best reflects coherent clustering of each module, as detailed in Mostafavi et al., 2018. It should be noted that the most enriched cell type for each module does not indicate absolute cell-type specificity of the gene members, and only serves as a relative indicator. bAuthor summary of enriched gene ontology (GO) terms. See table S3 for the full list. cAssociation statistics for a proxy allele, rs1054168C (r2=0.98 with rs1990622A), is shown for modules 16, 17, 18, and 110. Chr, chromosome; NA, not applicable; Pos, position per the hg19 reference.
| Module | Module Characteristics (Size; most enriched cell typea; enriched pathwaysb) |
SNP Chr:Pos (LD r2 with rs1990622A) |
Primary: ROSMAP (n=494) Beta (95% CI), P |
Replication 1: Mayo RNAseqc (n=185) Beta (95% CI), P |
Replication
2: ROSMAP (n=89) Beta (95% CI), P |
|---|---|---|---|---|---|
| 16 | 352 genes; Glutamatergic; Trans-synaptic signaling, ion channels, dendrite | rs12669919G Chr7:12271997 (0.98) |
−0.013 (−0.017 to −0.010), p=4.9×10⁻¹³ |
−0.22 (−0.37 to −0.07), p=5.1×10⁻³ |
−0.31 (−0.49 to −0.13), p=1.2×10⁻³ |
| 17 | 338 genes; Glutamatergic; No enriched GO terms | rs7797705G Chr7:12277773 (0.98) |
−0.011 (−0.014 to −0.008), p=3.3×10⁻¹² |
−0.16 (−0.27 to −0.05), p=5.9×10⁻³ |
−0.25 (−0.40 to −0.11), p=7.3×10⁻⁴ |
| 18 | 241 genes; GABAergic; No enriched GO terms |
rs13230513C Chr7:12268243 (0.97) |
−0.012 (−0.015 to −0.009), p=1.9×10⁻¹³ |
−0.19 (−0.30 to −0.08), p=6.0×10⁻⁴ |
−0.091 (−0.22 to 0.035), p=0.16 |
| 110 | 348 genes; Oligodendrocyte; Myelination | rs7804736G Chr7:12266867 (0.95) |
0.011 (0.007 to 0.014), p=5.0×10⁻¹⁰ |
0.12 (−0.04 to 0.28), p=0.14 |
0.28 (0.13 to 0.43), p=5.2×10⁻⁴ |
| 234 | 30 genes; Microglia; RNA helicase activity | rs78930980G Chr16:7131924 (NA) |
0.040 (0.028 to 0.052), p=7.6×10⁻¹¹ |
0.41 (0.02 to 0.80), p=0.041 |
NA |
The effects of both the TMEM106B and the RBFOX1 loci, with the exception of the rs1990622 – module 110 (m110) association, were replicated in the Mayo RNAseq temporal cortex (TCX) dataset (replication 1; Table 1), using the same module membership definitions as the primary dataset. We observed largely consistent modQTL associations across these studies, despite important differences in study designs of ROSMAP (prospective cohort studies; DLPFC) and the Mayo RNAseq study (a case-control study; TCX). Post-hoc analyses of the Mayo RNAseq study data adjusting for participant’s diagnosis did not significantly change the results (Table S5). In addition, three out of four TMEM106B modQTL associations were replicated in an independent subset of ROSMAP participants who were not part of the primary analysis (replication 2; Table 1), using the same module definition. We could not assess the RBFOX1 locus with lower AF in replication 2 given the dataset’s limited sample size. Of note, each of the primary, replication 1, and replication 2 datasets used different data processing pipeline, showing that our results are robust to the choice of aligning software and the version of reference genome used in data pre-processing.
The TMEM106B modQTL captures an already well-known pleiotropic locus of great clinical importance. The locus has been previously shown to increase susceptibility to TDP-43-related neurodegeneration such as frontotemporal lobar degeneration with TDP-43 (FTLD-TDP) (Van Deerlin et al., 2010) and LATE-NC (Yu et al., 2015), as well as major depressive disorder (Wray et al., 2018), poor cognitive resilience to neuropathology (White et al., 2017), and higher triglyceride level (Klarin et al., 2018). The locus is a cis-eQTL increasing TMEM106B expression (Figure S2) (GTEx Consortium, 2017; Ng et al., 2017; Van Deerlin et al., 2010) and a previously reported trans-eQTL of many distant genes in the aging human brain (Ren et al., 2018). By contrast, the RBFOX1 modQTL has no previously reported trait associations, and is neither a cis-eQTL of RBFOX1 (p=0.77)—which is the only coding gene within±1 Mb from the modQTL—nor in LD with any coding variants. Nonetheless, RBFOX1 is a major regulator of splicing and cytoplasmic mRNA metabolism in neurons, and has been implicated in neurodevelopment and multiple neuropsychiatric disorders (Gandal et al., 2018). We performed further characterization of these modQTLs in the primary dataset (ROSMAP).
Dominant modQTL, trans-eQTL, and trans-splicing QTL effects of the TMEM106B locus
The TMEM106B modQTL had a dominant effect on module levels (Figures 2A and S3A), and most of this dominant effect was not moderated or mediated by TMEM106B expression (Figures 2B, S3B, and S4; Table S6). Further, average expression of a module that includes TMEM106B (m121) had a much weaker association with rs1990622A (β=5.1×10⁻³, 95% CI 1.8×10⁻³ to 8.4×10⁻³, p=2.3×10⁻³) despite the module’s tight correlation with TMEM106B expression (Pearson’s r=0.82, p<2.2×10⁻¹⁶). These observations elucidate the main functional mechanism of this clinically important haplotype: the allele has a dominant effect on the aging brain’s transcriptome that is not dependent on TMEM106B mRNA level, suggesting that an allele of a coding variant rs3173615C (TMEM106B 185T; D’=1, r2=0.98 with rs1990622A) on this haplotype could have a functional role (Nicholson et al., 2013; Ren et al., 2018). By contrast, a dose-dependent cis-eQTL effect of a CTCF binding site, rs1990620A (r2=1 with rs1990622A) (Gallagher et al., 2017), would only explain a small portion this haplotype’s modQTL effect (8 to 12%; Table S6). Although TMEM106B 185T has been linked to an increased in vitro protein stability (Nicholson et al., 2013), TMEM106B protein level in ROSMAP DLPFC was not associated with the modQTL (p=0.52, n=435), and the exact mechanism of TMEM106B 185T remains unclear. Given the dominant modQTL effect, we used a dominant model of rs1990622A in all further analyses.
Figure 2. The TMEM106B locus harbors multiple modQTL, trans-eQTL, and trans-sQTL effects.

(A) Dominant effect of rs1990622A on m110 expression. Violin plot shows the distribution of module expression level (y-axis) in relation to rs1990622A allele count (x-axis). The upper edges of the boxes are the 75th percentiles, and the middle horizontal lines are medians, and the lower edges are 25th percentiles. The whiskers of the boxes extend to the maximum and minimum values, but no further than 1.5 × interquartile range. See Figure S3A for m16-18.
(B) TMEM106B expression level (x-axis) does not modify the strength of the association between rs1990622A carrier status (red: yes, blue: no) and m110 expression (y-axis). Solid colored line is a fitted linear regression line for each rs1990622A carrier status, and shaded regions indicate 95% confidence interval for the regression line. See Figure S3B for m16-18.
(C) Volcano plot from the transcriptome-wide trans-eQTL analysis of rs1990622A (dominant model) shows n=4,170 upregulated genes and n=3,360 downregulated genes at FDR<0.05 (indicated by the black horizontal line). x-axis indicates log 2 fold change in gene expression, and y-axis is −log10 p-value. Observed extensive trans-eQTL association was not limited to the genes in the modQTL-associated modules (blue: m16/m/17/m18, red: m110).
(D) Top 10 enriched GO terms (all FDR<0.05) of the rs1990622A trans-eQTLs (dominant model).
(E) Schematic summary of selected upregulated and downregulated KEGG pathways. See Table S7 for the list of genes from each pathway that are up/downregulated.
(F) Top 10 overrepresented GO terms (all FDR<0.05) among the genes differentially spliced according to rs1990622A carrier status (trans-sQTL). See Table S8 for the full list of differentially spliced genes.
(G) DLG4 is an example gene that has a trans-sQTL association with rs1990622A. Differential intron usage at cluster 6185 (toward the 3’-end of DLG4) is shown.
CLEAR, Coordinated Lysosomal Expression and Regulation network; dPSI, delta percent spliced in; KEGG, Kyoto Encyclopedia of Genes and Genomes; v-ATPase, vacuolar-ATPase.
Transcriptome-wide analyses of the association between rs1990622A with individual genes show extensive trans-eQTL effects reminiscent of the transcriptional and functional changes in TMEM106B overexpression and Grn knock-out rodent models of TDP-43 proteionopathy (Figure 2C-E) (Chen-Plotkin et al., 2012; Gallagher et al., 2017; Klein et al., 2017; Nicholson and Rademakers, 2016; Paushter et al., 2018). Tissue injury repair and immune pathways were enriched in upregulated genes, and synaptic function pathways were enriched in downregulated genes (Figure 2D), similar to a previous observation from the Mayo TCX dataset that compared rs3173615C homozygotes with rs3173615G homozygotes (Ren et al., 2018). Further, the pattern observed in rs1990622A carriers—including upregulation of TFEB, a principal transcription factor of lysosomal genes (Settembre et al., 2013), and downregulation of the autophagy pathway—suggests lysosome-autophagy pathway dysregulation (Figure 2E, Table S7). We note that, although statistically robust, the effect of the variant on most genes’ differential expression level was less than 1.5-fold change, consistent with modest physiologic effects at the tissue level for a common haplotype that has survived natural selection.
The splicing dysregulation associated with rs1990622A recapitulated molecular features of the TDP-43 proteinopathy models and might explain the observed synaptic gene downregulation. We observed a negative correlation between log mean intron length and rs1990622A trans-eQTL effect (Pearson’s r=−0.039, p=1.2×10⁻⁵; figure S5): genes with long introns (mean intron length > 10 kb) had higher odds of being downregulated in the rs1990622A carriers (OR=1.7, 95% CI 1.5 to 1.9, p<2.2×10⁻¹⁶). This is consistent with a rodent Tardbp (gene encoding TDP-43) knock down model where neuronal genes with large mean intron size were more likely to be downregulated (Polymenidou et al., 2011), which could be explained by splicing dysregulation from loss of a neuronal splicing regulator, TDP-43 (Ling et al., 2015; Tollervey et al., 2011). Thus, we leveraged the ROSMAP DLPFC intron usage calls (Raj et al., 2018) to assess transcriptome-wide splicing QTL (trans-sQTL) association of rs1990622A. Among 33,579 intron clusters from 13,484 genes, 212 intron clusters from 189 genes showed differential intron usage (i.e., differential splicing) according to rs1990622A carrier status (Table S8). Neuronal/synaptic processes were overrepresented in the list of differentially spliced genes (Figure 2F), similar to the downregulated genes in rs1990622A carriers (Figure 2D). Differentially spliced genes include key synaptic genes such as DLG4 (also known as PSD-95) (Figure 2G).
The GRN locus shows modQTL and trans-eQTL effects concordant with the TMEM106B modQTL
GRN is a gene on chromosome 17 which hosts variants that cause rare Mendelian FTLD-TDP cases in which haploinsufficiency leads to autosomal dominant cases of FTLD-TDP (Baker et al., 2006; Cruts et al., 2006). Model system studies have shown a close functional relationship between GRN and TMEM106B (Chen-Plotkin et al., 2012; Klein et al., 2017). In our study, rs850737C (ROSMAP MAF 0.40), a cis-eQTL downregulating GRN (GTEx Consortium, 2017; Ng et al., 2017), showed modQTL and trans-eQTL effects highly concordant with TMEM106B rs1990622A, demonstrating consistent transcriptomic impacts of two distinct TDP-43 proteinopathy risk genes (Figure 3A and 3B). We initially identified rs850737C as a suggestive modQTL from the modQTL GWAS that decreases m16 expression (p=4.1×10⁻⁸; Table S4), and the SNP also showed more modest evidence of decreasing m17 and m18 and increasing m110, effects concordant with those of rs1990622A (Table S9). These associations were replicated in the Mayo RNAseq data, except for the rs850737C – m110 association that did not reach statistical significance (Table S9). Further, in ROSMAP, the modQTL effects and the transcriptome-wide trans-eQTL effects of rs850737C were highly correlated with that of rs1990622A carrier status (Figures 3A and B). In fact, there was only one gene that was significantly regulated (FDR<0.05) in opposite directions by rs1990622A and rs850737C: GRN expression was increased by rs1990622A (β=0.076, FDR=0.016) while it was decreased by rs850737C (β=−0.051, FDR=0.027). We postulate that increased GRN mRNA expression in rs1990622A carriers might be due to a compensatory upregulation in the presence of altered TMEM106B function. Notably, rs850737 is in LD with rs5848 (D’=1, r2=0.6), a TDP-43 proteinopathy risk variant in the 3’-UTR of GRN (Nelson et al., 2019).
Figure 3. Concordant and synergistic modQTL effects between rs850737C (GRN) and rs1990622A (TMEM106B).

(A and B) rs850737C and rs1990622A show highly correlated modQTL (A) and trans-eQTL (B) effects. m16-18 and their gene members are indicated by blue color, and m110 and its gene members are indicated by red color. The gray dots are other modules or genes.
(C) Each panel shows module expression of m16, m17, m18, and m110 (y-axis; each dot representing each participant) according to rs1990622A carrier status (blue dots – non-carrier, red dots – carrier) and rs850737C allele count (x-axis). Blue and red lines capture mean module expression of rs1990622A non-carriers and carriers, respectively, at a given rs850737C allele count (with 95% confidence interval indicated by gray color). FDR for epistasis between rs1990622A carrier status and rs850737C dosage are indicated (FDRint; adjusted across four analyses displayed in the figure), showing significant epistasis between TMEM106B and GRN SNPs for m16 and m110. For full results of epistasis analysis, see Table S10.
There was also an epistatic interaction between rs1990622A (TMEM106B) and rs850737C (GRN) to decrease m16 and increase m110 (Figure 3C; Table S10). In the interaction models, rs1990622A had main modQTL effects, while the main effects of rs850737C was not significant (Table S10), consistent with a model in which the rs850737C modQTL effect requires the presence of the rs1990622A allele. Further, rs1990622A increased GRN expression (β=0.076, p=7.9×10⁻⁴), but rs850737C did not change TMEM106B expression (p=0.94). Together, these results support the hypothesis that TMEM106B is mechanistically upstream of GRN in their shared biological pathways (Chen-Plotkin et al., 2012).
Examining potential confounders of large-scale trans-eQTL effect of the TMEM106B locus
Large-scale trans-eQTL associations can be driven by biological factors such as changes in cell type proportion or miRNA expression (Li et al., 2019; Patrick et al., 2017; Ren et al., 2018), or technical factors such as the choice of data processing procedures and systematic RNA-Seq read misalignment. Therefore, we examined whether potential biological factors and technical confounders could explain the observed TMEM106B modQTL and trans-eQTL associations.
TMEM106B rs1990622A did not affect cell type proportions measured by immunohistochemistry (IHC) (Table S11) (Patrick et al., 2019), and the allele is not associated with available miRNA data (FDR>0.05 for all tested miRNAs, n=482) (De Jager et al., 2018; Patrick et al., 2017), making these biologic factors unlikely explanations for the TMEM106B modQTL and trans-eQTL effects. Previous studies reported that rs1990622A carriers had lower RNA-estimated neuronal proportion and higher RNA-estimated glial/endothelial proportions (Li et al., 2019; Ren et al., 2018). This same pattern of RNA-inferred cell type proportion changes was associated with rs1996022A carrier status even in the small subset of ROSMAP participants with IHC-measured cell type proportion data (Patrick et al., 2019) (n=54-65, Table S11). However, rs1990622A did not affect any of the IHC-measured cell type proportions in the same participants (Table S11), suggesting that the association between rs1990622A and RNA-inferred cell type proportions might be coming from the haplotype’s effect on marker gene expression rather than true cell type proportion changes. The rs1990622A modQTL effect was still present after controlling for the IHC-measured proportion of each module’s most enriched cell types (Table S12). These results illustrate the limitation of cell type proportions that are inferred based on bulk tissue marker gene expression levels instead of being directly measured, as the former are vulnerable to effects that alter marker gene expression.
The TMEM106B modQTL and trans-eQTL effects were consistently observed in the discovery and two replication RNA-Seq datasets that were sequenced and processed using different data generation pipelines (see STAR Methods), showing that our results are not dependent on the choice of specific data generation procedures. Further, we tested the TMEM106B rs1990622 modQTL and trans-eQTL associations from the primary dataset (ROSMAP, n=494) using a different data processing pipeline (the same pipeline that was used to process the replication 2 dataset, see STAR Methods and Logsdon et al., 2019). Using the same module definition as the primary analyses, all significant rs1990622 modQTLs were replicated (Table S13), and trans-eQTL results were highly correlated between the two different data processing pipelines (Figure S6). These results indicate that our modQTL and trans-eQTL results were robust to the choice of alignment algorithms (genome alignment using Bowtie (Langmead et al., 2009) versus splice-aware alignment using STAR (Dobin et al., 2013)) or the version of the reference genome used (GRCh37 versus GRCh38) (Table 1, figure S6).
The TMEM106B trans-eQTL effect on biological pathways and concordant trans-eQTL associations of the TMEM106B and GRN loci could not be explained by possible misalignment and cross-mapping of RNA-Seq short reads from cis-eGenes. Misalignment of short reads from a cis-eGene to other genes that share the short-read sequence is an important potential source of false-positive trans-eQTLs (Saha and Battle, 2018). We therefore performed a sensitivity analysis to assess whether rs1990622 trans-eQTL was driven by short-read misalignment and cross-mapping of cis-eGenes. We leveraged a published resource that lists all genes that share one or more short sequences (75 bp from an exon, 36 bp from a 3’-UTR) with a given gene (Saha and Battle, 2018) to exclude all genes that have sequence similarities with any gene within 1 Mb from rs1990622. Among 8,104 non-cross mapping trans genes, 1,968 genes were upregulated and 2,645 genes were downregulated (at FDR<0.05) (Figure S6). We note that this sensitivity analysis overestimates cross-mappability in our dataset because all datasets included in our study used 101 bp paired end read, that would greatly reduce the chance of alignment ambiguity. Nonetheless, gene set enrichment analysis for GO terms show largely consistent results compared to the GO term enrichment of full rs1990622A trans-eQTLs (Figures 2D and S7B), and trans-eQTL associations of TMEM106B (chromosome 7) and GRN (chromosome 17) loci are highly correlated even after excluding all genes that share short sequence with either loci (Figure S6).
Sensitivity analyses additionally accounting for latent confounders did not change the overall pattern of TMEM106B rs1990622A modQTL and trans-eQTL associations. Accounting for latent confounders captures and controls for global variation in gene expression, and it is an effectively strategy to increase power in cis-eQTL studies (GTEx Consortium, 2017; Leek and Storey, 2007; Ng et al., 2017). On the other hand, simulations as well as empiric studies have shown that adjusting for latent confounders can remove true large-scale biological signals including trans-eQTL hotspots, unless the primary independent variable of interest is explicitly modeled during latent confounder derivation (Jaffe et al., 2015; Leek and Storey, 2007; Stegle et al., 2010). Therefore, we did not correct for latent confounders in our genome-wide modQTL discovery analysis, while adjusting for known technical and demographic confounders. However, as latent confounder adjustment can help decrease false-positive trans-eQTLs that are attributable to technical artifacts (GTEx Consortium, 2017), we performed a sensitivity analysis in the primary dataset: we performed a surrogate variable analysis (SVA) (Leek and Storey, 2007) conditioned on rs1990622A carrier status, to capture latent confounders while explicitly modeling the primary independent variable of interest. The surrogate variables explained 43 – 72% of variances in module levels of the top rs1990622A modQTL modules (Table S14), and cis-eQTL association between rs1990622A and TMEM106B strengthened after adjusting for SVs (without adjustment: t=4.1, p=5.9×10⁻⁵; with adjustment: t=5.5, p=6.0×10⁻⁸), showing that these SVs effectively capture and remove large-scale transcriptome changes. Nonetheless, the rs1990622A modQTL associations actually strengthened after adjusting for SVs (Table S14), and the rs1990622A trans-eQTL effects were highly concordant before and after adjusting for SVs (r=0.97, p<2.2×10⁻¹⁶; Figure S6). These results support that the modQTL and trans-eQTL associations of the TMEM106B locus are robust to measured and unmeasured confounding factors.
Clinical implications of the TMEM106B modQTL: LATE-NC and cognitive resilience
A module with myelination/lysosomal genes (m110; Table S3), that is upregulated in the presence of rs1990622A, mediated much of the association between rs1990622A and LATE-NC, the most common form of TDP-43 proteinopathy and an important cause of dementia in older adults (Nelson et al., 2019). In all ROSMAP participants with genotypes and TDP-43 immunohistochemistry data (Table S1), rs1990622A carrier status was associated with more LATE-NC burden (β=0.24, 95% CI 0.09 to 0.39, p=1.6×10⁻³, n=1,117). The association between rs850737C dosage and LATE-NC was not significant (β=0.086, 95% CI −9.0×10⁻⁴ to 0.17, p=0.052, n=1,117). Among the four modules associated with rs1990622A, only m110 correlated with LATE-NC burden and stage, while other modules enriched with neuronal/synaptic genes did not exhibit this association (Table S15). Increased m110 expression mediated much of the association between rs1990622A carrier status and LATE-NC (Figure 4A), and the rs1990622A modQTL effects were present in a subset of participants without detectable LATE-NC (n=217; Table S16). The latter results suggest that TMEM106B-related dysregulation of myelination/lysosomal processes are upstream molecular events—rather than downstream consequences—of abnormal TDP-43 aggregation.
Figure 4. Clinical implications of the rs1990622A modQTL.

(A) Bidirectional mediation models (nonparametric bootstrap with 10,000 simulations) testing the relationship of m110 and LATE-NC (TDP-43) burden with rs1990622A. The model assuming m110 as a mediator showed significant mediation (upper diagram, red box), while an alternative model did not (lower diagram).
(B) Bidirectional mediation models testing the relationship of m110 and Aβ burden with APOE ε4. The model having Aβ as a mediator showed significant mediation (lower diagram, red box), while an alternative model did not (upper diagram).
(C) A structural equation modeling of APOE/Aβ and TMEM106B-related pathways for LATE-NC pathogenesis. The analyses were conducted in 420 ROSMAP participants with non-missing data and were adjusted for age at death and sex. Model fit metrics (left lower corner) indicate excellent model fit.
(D and E) m18 (D) and m110 (E) mediate the association between rs1990622A and residual cognition. APOE ε4, APOE ε4 carrier status; CFI, comparative fit index; Nobs=number of participants; RMSEA, root mean square error of approximation; rs1990622A, rs1990622A carrier status; TLI, Tucker Lewis index.
The myelination/lysosomal module (m110) is an important hub where APOE/Aβ and TMEM106B pathways converge in LATE-NC pathogenesis. APOE ε4, a previously reported genetic risk factor of LATE-NC (Wennberg et al., 2018; Yang et al., 2018), increases m110 expression through increased Aβ accumulation (Figure 4B). In a structural equation model, the APOE/Aβ effect and the TMEM106B haplotype’s effect converged on enhancing m110 expression, and together, both APOE/Aβ- and TMEM106B-related pathways lead to LATE-NC (Figure 4C). We note that although Aβ had a strong association with m110 (r=0.19, p=3.0×10⁻⁵), the rs1990622A modQTL effects are observed in a subset of participants without detectable Aβ accumulation (n=85; Table S16). Also, Aβ did not moderate the rs1990622A – m110 association (interaction term p=0.98). These results support independent and additive effects of APOE/Aβ- and TMEM106B-related pathways in increasing m110 expression. On the other hand, PHFtau was not associated with m110 (r=0.058, p=0.20), suggesting that m110 dysregulation might be an Aβ-specific mechanism that connects AD and LATE-NC.
M110 is enriched with oligodendroglial/myelination genes (Table S3) and includes the two most abundant lysosomal membrane proteins (LAMP1, LAMP2) (Settembre et al., 2013). Further unsupervised submodule clustering within m110 could not separate its component myelination and lysosomal pathway genes, as most of the m110 genes are strongly co-regulated with one another (Figure S7). We note that all four m110 submodules as well as key genes from both myelination and lysosomal pathways were associated with both rs1990622A and LATE-NC burden (Table S17 and S18), preventing us from refining the association to one molecular theme. Although cell-type specific analyses such as single nuclei RNA-Seq (sNuc-Seq) is required to further dissect the role of these pathways in different cell types, previous model system studies showed that TMEM106B manipulation leads to neuronal lysosomal changes (Klein et al., 2017; Nicholson and Rademakers, 2016), indicating that the TMEM106B-related lysosomal gene dysregulation is not confined to oligodendroglia.
We also observed that m18 and m110 partially mediate an association between rs1990622A and residual cognition (White et al., 2017), a measure that captures cognitive resilience (spared cognition despite neuropathologies) (Figures 4D and 4E). On the other hand, m16 and m17 were not correlated with Aβ, PHFtau, cognitive decline, LATE-NC, or residual cognition (p>0.05 for all tests), and the modQTL association with these two modules remain of unclear clinical significance.
RBFOX1 rs78930980G is associated with upregulation of microglial genes
The RBFOX1 modQTL rs78930980G (Figure 5A) as well as lower expression of RBFOX1 (Figure 5B) were associated with m234, a module most enriched with microglial genes. Further, rs78930980G was a significant trans-eQTL of more than a thousand genes (Figure 5C): upregulated genes were enriched with inflammation and innate immune processes (Figure 5D). Since RBFOX1 is primarily expressed in neurons, our observation could hint at an interesting effect on neuroglial interaction. However, although RBFOX1 is a well-known neuron-specific splicing regulator (Gandal et al., 2018), splicing of only 14 genes were significantly affected by rs78930980G (Table S19), and these genes were not enriched with any biological processes. Neither rs78930980G nor m234 was correlated with measured neuropathologies or cognitive decline (p>0.05).
Figure 5. RBFOX1 rs78930980 modQTL and trans-eQTL.

(A) modQTL association between rs78930980G and m234. There was no rs78930980G homozygote in ROSMAP. Violin plot shows the distribution of module expression level (y-axis) in relation to rs78930980G allele count (x-axis). The upper edges of the boxes are the 75th percentiles, and the middle horizontal lines are medians, and the lower edges are 25th percentiles. The whiskers of the boxes extend to the maximum and minimum values, but no further than 1.5 × interquartile range.
(B) Lower RBFOX1 expression is associated with higher m234 expression. Pearson’s r and p-value are indicated in the label. Solid line is a fitted linear regression line, and shaded regions indicate 95% confidence interval for the regression line.
(C) Volcano plot from the transcriptome-wide trans-eQTL analysis of rs78930980G shows n=547 upregulated genes and n=537 downregulated genes at FDR<0.05 (indicated by the black horizontal line). x-axis indicates log 2 fold change in gene expression, and y-axis is −log10 p-value. M234 genes are indicated in red dots.
(D) Top 10 enriched GO terms (all FDR<0.05) of the rs78930980G trans-eQTLs.
In sensitivity analyses, the RBFOX1 modQTL association was reproduced in the re-processed primary dataset (β=0.77, 95% CI 0.50 to 1.04, p=3.7×10⁻⁸), and two data processing pipelines showed highly concordant trans-eQTL results (Figure S8). There was only one gene that shared one or more short sequences (75 bp from an exon, 36 bp from a 3’-UTR) with genes within 1 Mb from rs78930980, and thus short-read misalignment cannot explain the rs78930980G trans-eQTL associations. We could not assess the role of cell type proportion differences or unmeasured confounders in the RBFOX1 modQTL, given the low allele frequency of rs78930980G (n=17 allele carriers in the primary dataset; no allele carriers among the subset with neuronal IHC cell type proportion data).
Therefore, while the RBFOX1 modQTL has a replicable effect on the transcriptome of the aging human neocortex, we could not assess the role of cell type proportion change or unmeasured confounders in this locus, and the mechanism and clinical implication of the locus remains unclear.
Discussion
Our module-based strategy provided a data-driven approach to organize the vast numbers of genes expressed in the aging human cortex and enabled us to perform an unbiased genome-wide screen of large-scale trans-eQTLs followed by detailed modeling of the variants’ impact on the transcriptome, neuropathology, and resilience of the aging human brain. The TMEM106B locus has been previously reported to affect the aging neocortical transcriptome in a candidate polymorphism study of gene expression (Ren et al., 2018) and GWAS of surrogate traits that reflect transcriptome changes such as transcriptome-inferred age (Rhinn and Abeliovich, 2017) and RNA-inferred neuronal proportion (Li et al., 2019). Our modQTL GWAS confirms the exceptional impact of the TMEM106B locus on the aging neocortical transcriptome and also identifies a new RBFOX1 locus that exerts a large-scale trans-eQTL effect. Further, we present a distinct approach considering genetic data, transcriptomic data, and pathologic measures from the same subjects, and produce new insights into molecular events leading to LATE-NC.
Based on our observation from hundreds of aging human brain samples, we postulate the following model of LATE-NC pathogenesis. TMEM106B S185T within the TDP-43 proteinopathy risk haplotype causes a dominant TMEM106B hyperfunction that shares pathophysiology with TMEM106B overexpression models (Chen-Plotkin et al., 2012; Gallagher et al., 2017; Nicholson and Rademakers, 2016), and leads to lysosomal/myelination gene dysregulation and subsequent pathologic aggregation of TDP-43. Genetically decreased GRN expression by the rs850737C haplotype as well as Aβ accumulation further exacerbates this pathophysiology. Consistent with this model, more extreme genetic perturbations of either TMEM106B or GRN cause earlier-onset, more severe phenotypes of lysosomal/myelination dysregulation and neurodegeneration: hypomyelinating leukodystrophy-16 (a rare dominant mutation TMEM106B D252N) (Simons et al., 2017), a Mendelian form of FTLD-TDP (GRN haploinsufficiency) (Baker et al., 2006; Cruts et al., 2006), and neuronal ceroid lipofuscinosis-11 (GRN homozygous loss-of-function) (Smith et al., 2012). Further, we postulate that large-scale downregulation and splicing dysregulation of the synaptic genes associated with the TMEM106B variant, that recapitulates prior observations from TDP-43 knock down/knock out models (Ling et al., 2015; Polymenidou et al., 2011; Tollervey et al., 2011), are reflective of varying degrees of nuclear TDP-43 depletion. Although synaptic gene downregulation did not correlate with histologically observable TDP-43 inclusions in our study, this could be due to the limitation of current histological methods that underestimate true TDP-43 pathology burden, as suggested by a recent study that observed splicing dysregulation in persons who only had nuclear TDP-43 depletion without pathologic inclusions (Sun et al., 2017). In our study, the transcriptomic effects of the TMEM106B haplotype were similarly present in the subsets of ROSMAP participants without Aβ or LATE-NC, suggesting that pre-existing neurodegenerative proteinopathies are not necessary for the genetically-driven TMEM106B-related transcriptome dysregulation. However, previous studies have shown attenuated transcriptomic impact of the TMEM106B 185T allele in healthy controls (Ren et al., 2018) or in younger subjects (Li et al., 2019; Rhinn and Abeliovich, 2017). Therefore, it is possible that the link between TMEM106B 185T and transcriptome dysregulation is context-dependent and is more accentuated in the setting of non-specific age-related brain changes rather than being contingent on a specific type of neurodegenerative process such as AD.
We acknowledge the limitations of our study. First, spurious co-expression module clusters can arise from unaccounted biological and technical artifacts (Parsana et al., 2019; Saha and Battle, 2018), and exact module membership might vary with the discovery sample characteristic and choice of clustering algorithm (Logsdon et al., 2019; Mostafavi et al., 2018). Thus, we used gene co-expression modules previously derived from our primary dataset, that were shown to be largely preserved across independent datasets and clustering algorithms (Mostafavi et al., 2018), and performed extensive sensitivity analyses to rule out artifact-driven results. Second, because longitudinal human brain sampling cannot be done, our models are derived from cross-sectional data that limit causal inference. However, our causal pathway model includes genetic factors that are not susceptible to reverse causation, and we ruled out alternate directions of causality by bidirectional mediation analyses and subgroup analyses. Third, all of our participants are older adults of European ancestry and the predominant form of TDP-43 proteinopathy in the older adults we studied is LATE-NC, so our results have limited generalizability to other age groups, races, and patients with other forms of TDP-43 neurodegeneration such as FTLD-TDP or ALS. Fourth, we cannot fully exclude the possibility that measurement errors and limited power masked true association between rs1990622A and cell type proportions. Nonetheless, our results uncover genetics of distant gene expression in the aging human brain, and identify a transcriptional program mediating APOE/Aβ and TMEM106B effects on TDP-43 aggregation, thereby opening a new avenue of further biological investigations and drug development efforts to tackle neurodegenerative dementia.
STAR Methods
RESOURCE AVAILABILITY
Lead Contact
Further information and requests for resources and reagents should be directed to and will be fulfilled by the Lead Contact, Philip L. De Jager (pld2115@cumc.columbia.edu).
Materials Availability
This study did not generate new unique reagents.
Data and Code Availability
Genotypes, RNA-Seq, proteomics, and miRNA data from ROSMAP and Genotypes and RNA-Seq data from the Mayo RNAseq study are available via the Alzheimer’s Disease (AD) Knowledge Portal (https://adknowledgeportal.org). The AD Knowledge Portal is a platform for accessing data, analyses, and tools generated by the Accelerating Medicines Partnership (AMP-AD) Target Discovery Program and other National Institute on Aging (NIA)-supported programs to enable open-science practices and accelerate translational learning. Data is available for general research use according to the following requirements for data access and data attribution (https://adknowledgeportal.synapse.org/#/DataAccess/Instructions).
See the following links for direct data access:
ROSMAP study - Phenotype data: https://www.radc.rush.edu
ROSMAP study - Genotypes-Imputed: https://doi.org/10.7303/syn3157329
ROSMAP study - Gene co-expression networks: https://doi.org/10.7303/syn7169817
ROSMAP study - DLPFC RNA-Seq (primary dataset): https://doi.org/10.7303/syn3505732.2
ROSMAP study - DLPFC RNA-Seq (reprocessed data; primary + replication 2): https://doi.org/10.7303/syn8456719.21
ROSMAP study - DLPFC LC-SRM proteomics (TMEM106B protein quantification): https://doi.org/10.7303/syn10468856
ROSMAP study - DLPFC miRNA: https://doi.org/10.7303/syn3387325
MayoRNAseq study - Genotypes-Imputed: https://doi.org/0.7303/syn8650955
MayoRNAseq study - Temporal Cortex RNAseq: https://doi.org/10.7303/syn3163039
For additional information and metadata on these studies see the following links:
The Religious Orders Study and the Memory and Aging Project (ROSMAP): https://adknowledgeportal.synapse.org/Explore/Studies?Study=syn3219045
The MayoRNAseq study: https://adknowledgeportal.synapse.org/Explore/Studies?Study=syn5550404
EXPERIMENTAL MODELS AND SUBJECT DETAILS
The primary dataset of this study is from the Religious Orders Study (ROS) and the Rush Memory and Aging Project (MAP), two community-based cohort studies that enroll older adults without dementia at baseline. ROS started in 1994, and enrolls Catholic priests, brothers, and nuns across religious communities in the United States. MAP started in 1997, and enrolls diverse participants throughout northern Illinois in the United States, including Chicago metropolitan area (Bennett et al., 2018; Bennett et al., 2012a; Bennett et al., 2012b). ROS and MAP (ROSMAP) participants sign informed consent and Anatomical Gift Act at the time of enrollment, and the Rush University Medical Center Institutional Review Board (IRB) has approved the data collection and usage protocols. ROS and MAP are designed for combined analyses, and collect coordinated sets of clinical and neuropathological measures. At the time of death, ROSMAP participants have wide spectrum of cognitive and functional impairment (cognitively normal to dementia) and neuropathology burden (e.g., Braak stage of neurofibrillary tangles (NFT) ranging from 0 to 6), reflective of the general aging population. For our primary analyses, we included ROSMAP participants of European descent who had genome-wide genotyping and dorsolateral prefrontal cortex (DLPFC) bulk RNA-Sequencing (De Jager et al., 2018), from whom a previous study derived DLPFC gene co-expression modules (n=494) (Mostafavi et al., 2018). In addition, we accessed recently re-processed ROSMAP DLPFC RNA-Seq data that include newer batches (n=583 with quality-controlled genotype and RNA-Seq data) (De Jager et al., 2018; Logsdon et al., 2019), and used the data for second biological replication (“replication 2”; n=89 who were not included in the primary analysis) and sensitivity analyses (n=494 who were included in the primary analysis; to assess whether the results are robust to the choice of front-end RNA-Seq data processing procedure). For the genetic association analyses of TDP-43 proteinopathy and TMEM106B and GRN variants, we included ROSMAP participants of European descent who had genome-wide genotyping and semi-quantitative TDP-43 assessment (n=1,117). Characteristics of ROSMAP participants are summarized in Table S1. Pertinent ROSMAP data acquisition and processing procedures are detailed below, and full description is available through previous publications (Bennett et al., 2018; Bennett et al., 2012a; Bennett et al., 2012b; Bennett et al., 2014; De Jager et al., 2018; Logsdon et al., 2019) and the Rush Alzheimer’s Disease Center Resource Sharing Hub (https://www.radc.rush.edu/).
The first replication dataset (“replication 1”) is from the Mayo RNA-Seq study (Allen et al., 2016; Allen et al., 2018a; Allen et al., 2018b). The Mayo RNA-Seq study is a case-control study that includes participants with definite Alzheimer’s disease (AD; Braak NFT stage 4 or above), pathologic diagnosis of progressive supranuclear palsy (PSP), pathologic aging (defined as presence of amyloid-β (Aβ) plaques but not NFTs or dementia), and elderly controls (no or sparse Aβ plaques, Braak NFT stage 3 or less, and does not have AD, Parkinson’s disease, dementia with Lewy bodies (DLB), vascular dementia, PSP, motor neuron disease, corticobasal degeneration, frontotemporal lobar degeneration, Huntington’s disease, hippocampal sclerosis, or dementia lacking distinctive histology). All AD and PSP subjects were from the Mayo Clinic Brain Bank, and all pathologic aging subjects were from the Banner Sun Health Institute. Control subjects are from either brain banks. Age at death was 60 years or older for the cases, and 50 years or older for the controls. The Mayo Clinic IRB approved Mayo RNA-Seq study. To select participants comparable to our primary dataset (ROSMAP participants with DLPFC RNA-Seq), we excluded participants with a diagnosis of PSP, a diagnostic entity that is rare in the general population and in the ROSMAP dataset, and included participants with genotype and temporal cortex (TCX) RNA-Seq data. Characteristics of Mayo RNA-Seq study participants are summarized in Table S2. Detailed Mayo RNA-Seq study procedures were described in previous publications (Allen et al., 2016; Allen et al., 2018a; Allen et al., 2018b), and we briefly summarize genotyping and RNA-Seq procedures in the following sections.
METHOD DETAILS
Clinical Phenotypes
Cognitive measures and clinical diagnoses of ROSMAP participants were accessed through the Rush Alzheimer’s Disease Center Resource Sharing Hub (https://www.radc.rush.edu/). Each ROSMAP participant gets annual comprehensive cognitive evaluation including the following 19 tests spanning multiple cognitive domains (Bennett et al., 2018; Bennett et al., 2012a; Bennett et al., 2012b): Word List Memory/Recall/Recognition, East Boston Immediate/Delayed Recall, Logical memory immediate/delayed, Boston Naming Test, Category Fluency, reading test (10 items), Digit Span forward/backward/ordering, Judgment of Line Orientation, Standard Progressive Matrices, Symbol Digit Modalities Test, Number Comparison, Stroop Color Naming, and Stroop Word Reading. Annual global cognitive function for each participant was defined as the average of z scores from these tests, standardized to baseline. The final clinical diagnosis of Alzheimer’s disease (AD) dementia was determined after death by a neurologist blinded to post-mortem pathology, using all available clinical data (Bennett et al., 2018; Bennett et al., 2012a; Bennett et al., 2012b).
Genotype Data Acquisition
Imputed genome-wide genotype data from ROSMAP was obtained from the Accelerating Medicines Partnership in Alzheimer’s Disease (AMP-AD) Knowledge Portal (synapse ID: syn3157329). DNA was extracted from blood or post-mortem brain tissue from ROSMAP participants, and genotyped on either the Affymetrix GeneChip 6.0 platform or the Illumina OmniQuad Express platform. After quality control (genotype success rate>0.95, Hardy–Weinberg equilibrium p>0.001, and misshap test<1×10⁻⁹) and excluding population outliers (participants of non-European Ancestry inferred from the genotype covariance matrix; to avoid confounding from population stratification), we had total of 2093 participants with genome-wide genotype data (n=1709 genotyped on the Affymetrix platform, and n=382 genotyped on the Illumina platform). Imputation was done on the 1000 Genomes Project (Phase 1b data freeze) reference panel, and after removing rare (MAF<0.01) or poorly imputed variants (INFO score<0.3), we analyzed about 7.5 million SNPs. APOE haplotypes (ε2, ε3, ε4) were derived from direct sequencing of APOE codons 112 and 158. Further details are available through previous publications (De Jager et al., 2018).
Genotype data from the Mayo RNA-Seq study is available through the AMP-AD KnowledgepOrtal (synapse ID: syn55504040). In the Mayo RNA-Seq study, genome-wide genotyping was done on the Illumina Infinium HumanOmni2.5-8 BeadChip platform (Allen et al., 2018a), and the two modQTL genotypes from the primary analyses (rs1054168, a proxy of rs1990622 (r2=0.98); rs78930980) were extracted for replication.
Neuropathological Assessment
Neuropathological phenotypes of ROSMAP participants were downloaded from the Rush Alzheimer’s Disease Center Resource Sharing Hub (https://www.radc.rush.edu/). ROSMAP participants underwent quantitative neuropathological assessment (Bennett et al., 2018; Bennett et al., 2012a; Bennett et al., 2012b). Individuals with high or intermediate likelihood according to the modified National Institute on Aging–Reagan Institute criteria were given pathological diagnosis of AD. Mean percentage area of cortex occupied by amyloid-β (Aβ) was assessed with immunohistochemistry (one of three monoclonal antibodies: 4G8 [Covance Labs, Madison, WI, USA; 1:9000 dilution], 6F/3D [Dako North America, Carpinteria, CA, USA; 1:50 dilution], or 10D5 [Elan Pharmaceuticals, San Francisco, CA, USA; 1:600 dilution]) in eight regions (hippocampus, entorhinal cortex, midfrontal cortex, inferior temporal cortex, angular gyrus, calcarine cortex, anterior cingulate cortex, and superior frontal cortex) to derive a quantitative Aβ burden measure. Mean cortical density of paired helical filament tau (PHFtau) was assessed with immunohistochemistry using an anti-phosphotau antibody (AT8, targeting Ser202/ Thr205 [Thermo Fisher Scientific, Rockford, IL, USA; 1:2000 dilution]) in the same eight regions to derive a quantitative PHFtau burden measure. TDP-43 proteinopathy was assessed with immunohistochemistry (TAR5P-1D3, targeting phosphorylated TDP-43 at Ser409/Ser410 [Ascenion, Munich, Germany; 1:100 dilution]). The stage of TDP-43 proteinopathy was documented to capture the topographic progression pattern of limbic-predominant age-related TDP-43 encephalopathy neuropathologic change (LATE-NC) (Nag et al., 2018): stage 0=no TDP-43 proteinopathy; stage 1=amygdala only; stage 2=hippocampus/entorhinal cortex; stage 3=anterior temporal pole cortex; stage 4=midtemporal cortex/orbitofrontal cortex; stage 5=middle frontal cortex. The burden of TDP-43 cytoplasmic inclusion was quantified by averaging a semi-quantitative six-point scale (0=none; 1=sparse [1–2 inclusions in a 0·25 mm2 area of greatest density within that region]; 2=sparse to moderate [3–5 inclusions]; 3=moderate [6–12 inclusions]; 4=moderate to severe [13–19 inclusions]; 5=severe [≥20 inclusions]) across six brain regions (amygdala, hippocampus CA1 or subiculum, dentate gyrus, entorhinal cortex, midfrontal cortex, and middle temporal cortex). Lewy body was detected with α-synuclein immunostain (either LB509 [Zymed Labs, Invitrogen, Carlsbad, CA, USA; 1:150 or 1:100 dilution] or pSyn#64 [Wako Chemicals, Richmond, VA, USA; 1:20,000 dilution]), and whether a participant has neocortical Lewy bodies, that are associated with dementia (Schneider et al., 2012), were coded as a binary variable. Presence of chronic macroscopic and microscopic infarcts were recorded as binary variables. Atherosclerosis and arteriolosclerosis were recorded as four-level severity scale variables (Arvanitakis et al., 2017). Cerebral amyloid angiopathy was graded on a five-point severity scale (0-4) in four neocortical regions (dorsolateral prefrontal cortex, angular gyrus, inferior temporal gyrus, and calcarine cortex) and averaged to create a semi-quantitative scale (Boyle et al., 2015).
RNA and Protein Data Acquisition
RNA-Seq data from ROSMAP (primary dataset) are available through the AMP-AD Knowledge Portal (synapse ID: syn3505732). In ROSMAP, frozen dorsolateral prefrontal cortex (DLPFC) gray matter from deceased ROSMAP participants was separated from white matter and vasculature, and was homogenized to extract RNA. For the samples that had RNA Integrity score (RIN)>5 and RNA quantity>5ug, next-generation RNA-Sequencing (RNA-Seq) was done on Illumina HiSeq platform with 101 bp paired end reads, aiming 50 million paired end reads coverage. Samples from n=540 participants (batches 1-6) were sequenced in the first phase (Mostafavi et al., 2018), and the reads were aligned to the hg19 transcriptome reference (GENCODE v14) using Bowtie (Langmead et al., 2009). Transcriptome outliers were removed, and Fragments Per Kilobase of transcript per Million mapped reads (FPKM) values were quantified for n=508 participants, n=494 of whom had quality-controlled genome-wide genotypes. We note that the average sequencing depth was 50 million reads, and all samples had more than 9.5 million total aligned reads. The distribution of FPKM values in each individual was quantile-normalized and batch-corrected. We selected 13,484 genes that have at least 4 reads in 100 participants for further analyses (Mostafavi et al., 2018), and linear regression was applied to log2 expression data to derive residual log expression values controlling for age at death, sex, three principal components from genotype covariance matrix (PC1-3), RIN, post-mortem interval, number of ribosomal bases, number of aligned reads, and study (ROS vs MAP). These residual expression values were used for transcriptome-wide trans-eQTL analyses. In a previous study (Mostafavi et al., 2018), we rank-normalized the residual expression values and used SpeakEasy algorithm (Gaiteri et al., 2015) to derive co-expression modules, resulting in 47 modules that have more than 20 gene members. We used this previously published module definition (Mostafavi et al., 2018) that was derived from the same participants as our primary dataset, and used mean values of rank-normalized expression of each module member genes to represent module expression, as previously described (Mostafavi et al., 2018). We note that each module expression had a near-perfect linear relationship (r2>0.99) with the first principal component of the same module.
In addition, we also analyzed recently re-aligned ROSMAP DLPFC RNA-Seq data (AMP-AD Knowledge Portal, synapse ID: syn8456719) (Logsdon et al., 2019) to ensure that results from the primary analyses are robust to the choice of data processing methodology, and to provide additional replication dataset (“replication 2”) by including additional RNA-Seq samples that were not included in the primary dataset (e.g., RNA-Seq batches 7-8). BAM files from the original data processing pipeline were converted to FASTQs using the Picard tools (http://broadinstitute.github.io/picard/), and then realigned to GRCh38 reference genome (GENCODE v24) using STAR aligner (Dobin et al., 2013). Gene counts were derived from each sample using STAR. Sample quality metrics were calculated with the Picard tools. Genes with less than 1 CPM (read counts per million total reads) in at least 50% of samples per clinical diagnosis (AD, Control, Other) were removed. Sample outliers were removed through principal component analysis and clustering. Then, conditional quantile normalization was used for library normalization, to account for variations in gene length and GC content. Then, the data was regressed against significant covariates (that were correlated with gene expression principal components) including Batch, age at death, sex, RIN, percent coding bases, percent intergenic bases, and percent intronic bases, post mortem interval. The residual gene expression was used for further analysis.
Tissue TMEM106B protein quantity was measured from ROSMAP DLPFC (AMP-AD Knowledge Portal, synapse ID: syn10468856), using targeted liquid chromatography-selection reaction monitoring (LC-SRM) quantitative proteomics as previously detailed (Yu et al., 2018), using a peptide sequence “NGLVNSEVHNEDGR” (that does not overlap with the common rs3173615C (S185T) variant). miRNA profile (AMP-AD Knowledge Portal, synapse ID: syn3387325) was measured using the Nanostring nCounter platform, and 309 quantified miRNAs that passed quality control in a previously study (De Jager et al., 2018; Patrick et al., 2017) were analyzed in the current study. Further details on ROSMAP DLPFC multi-omics data generation are available through previous publications (De Jager et al., 2018; Mostafavi et al., 2018; Yu et al., 2018).
In the Mayo RNA-Seq study (Allen et al., 2016; Allen et al., 2018a; Allen et al., 2018b), RNA-Seq was done from TCX and cerebellar samples using an Illumina platform, and SNAPR software (Magis et al., 2015) was used to align reads (to GRCh38 reference genome and Ensmbl v77 gene models) and quantify read counts. We accessed processed TCX RNA-Seq data (see Key Resources Table) for replication analyses. Residual expression values were taken from a linear model adjusted for age at death, sex, RIN, sequencing flow cell, and brain bank tissue source. Then, we imposed the same module definition as the primary ROSMAP dataset, and derived module expression (mean expression of module member genes) of the five modules that had significant module-SNP association in the primary analyses. Further details on the Mayo RNA-Seq study procedures are available through previous publications (Allen et al., 2016; Allen et al., 2018a; Allen et al., 2018b).
KEY RESOURCES TABLE
QUANTIFICATION AND STATISTICAL ANALYSIS
All statistical analyses were done in R, version 3.3, unless otherwise specified. Of note, we used Bonferroni correction to account for multiple testing in the initial GWAS, where we aimed to have a pre-specified p-value threshold. All other analyses requiring multiple testing corrections used FDR<0.05 as the statistical significance threshold.
In primary modQTL analysis in ROSMAP (DLPFC RNA-Seq), 47 GWAS were performed to identify modQTLs for each module expression, using linear regression using imputed SNP dosages, assuming additive models. Here, we only adjusted for genotyping platforms, as module expression is the mean of each module member gene expression level that is already extensively adjusted for demographic and technical covariates including genotype PC1-3, as noted above. We used Bonferroni-corrected significance threshold of p=5.0×10⁻⁸/47=1.1×10−9 to determine significant modQTLs, and also identified suggestive modQTLs that reached a genome-wide significance threshold for a single GWAS (p=5.0×10⁻⁸) but did not meet the study-wise significance threshold (p=1.1×10⁻⁹). LocusZoom (Pruim et al., 2010) was used to draw regional genetic association plots. A candidate gene for each significant modQTL was identified using previous literature and positional proximity. We used HaploReg v4.1 database (Ward and Kellis, 2012) and 1000 Genomes Project Phase 1 EUR reference panel (The 1000 Genomes Project Consortium, 2012) to assess the LD structure among the identified top SNPs in the TMEM106B locus. Given tight LD of all TMEM106B top SNPs with rs1990622A, a previously reported TDP-43 proteinopathy risk locus (Van Deerlin et al., 2010; Yu et al., 2015), we used rs1990622A dosage for the follow-up analyses of the TMEM106B modQTL. Conditional analyses of modQTLs were performed, controlling for the top modQTL or its proxy (rs1990622A for the TMEM106B modQTLs), and the result for the candidate gene ± 250 kb region were plotted with LocusZoom. The modQTL replication 1 analyses were performed for significant modQTLs discovered in the primary analysis, using the Mayo RNAseq study TCX data (n=185). Replication 2 analyses were performed for rs1990622A in the re-processed ROSMAP DLPFC RNA-Seq data from samples that do not overlap with the primary dataset (n=89).
Given the observed dominant effect of rs1990622A on module expression, we used dominant model for all follow-up analyses with rs1990622A. All individual gene expression data used for follow-up analyses are log2 residual expression values controlling for age at death, sex, three principal components from genotype covariance matrix (PC1-3), RIN, post-mortem interval, number of ribosomal bases, number of aligned reads, and study (ROS vs MAP).
Association between rs1990622A and ROSMAP DLPFC TMEM106B gene expression was assessed using linear model controlling for genotyping platform. An R package “mediation” (Tingley et al., 2014) was used to assess mediation of the rs1996022A modQTL effect through TMEM106B gene expression. Mediation analyses were done with nonparametric bootstrap with 10,000 simulations, having rs1990622A carrier status as the binary independent variable, TMEM106B expression as the continuous mediator, and the module expression as the continuous outcome variable. We controlled for genotyping platform in all models. We reported estimated average causal mediated effect (“effect mediated by cis-eQTL”), estimated average direct effect (“direct genetic effect”), and estimated proportion mediated (“mediated proportion”). Association between rs1990622A and ROSMAP DLPFC TMEM106B protein level was assessed by a linear model, in a subset of the primary dataset (ROSMAP) with genotypes and the TMEM106B protein measure (n=435): we used batch-adjusted z-score of the protein quantity as an outcome variable, and the analysis was adjusted for age at death, sex, genotyping platform, and PC1-3.
Trans-eQTL associations of rs1990622A with 13,484 genes expressed in DLPFC that pass our QC measures (Mostafavi et al., 2018) were assessed using linear models controlling for genotyping platform, and FDR<0.05 was used as a statistical significance threshold. Gene Ontology (GO) term enrichment visualization was performed using WebGestalt (Liao et al., 2019), using Gene Set Enrichment Analysis (Subramanian et al., 2005) (using t-values from each trans-eQTL to weigh and rank genes) with the following options: Gene Ontology Biological Process noRedundant, minimum number of IDs in the category: 5, maximum number of IDs in the category: 2000, significance Level: FDR < 0.05, number of permutation: 1000, and weighted set cover (Golab et al., 2015) for top 10 genes. Visualization from top 10 weighted set cover In addition, we selected Kyoto Encyclopedia of Genes and Genomes (KEGG) pathways from the TMEM106B/GRN/TDP-43 literature (Klein et al., 2017; Nicholson and Rademakers, 2016; Paushter et al., 2018), and summarized up-regulated and down-regulated genes from each pathway in rs1990622A carriers.
We calculated mean intron length from the longest transcripts of each gene per the GRCh37 reference genome, and assessed its relationship with rs1990622A-associated gene expression changes. We excluded genes with mean intron length of less than 30 bp (a minimum intron length in human genome (Piovesan et al., 2015)), and log10-transformed the mean intron length before analysis given its positively skewed distribution. Then, we used the differential splicing analysis feature of an R package “leafcutter” (Li et al., 2018) to assess trans-splicing QTL (trans-sQTL) associations. Among 35,855 ROSMAP DLPFC intron clusters that were previously reported from n=450 ROSMAP participants (Raj et al., 2018), 33,002 clusters were within the 13,484 genes analyzed in our study. We set rs1990622A carrier status (binary) as a condition to assess differential splicing, and controlled age at death, sex, genotyping platform, PC1-3, RNA-Seq batch, RIN, and post-mortem interval. Differential splicing was successfully assessed for 15,472 intron clusters, and we applied a statistical significance threshold of FDR<0.05. Intron clusters that showed significant different usage rate were mapped to genes to enlist differentially spliced genes, and the resulting gene list was assessed for GO term overrepresenation using WebGestalt (Liao et al., 2019). We used the leafcutter Shiny application (leafviz) to illustrate an example differential splicing gene, DLG4.
Cis-eQTL, modQTL, and trans-eQTL of rs850737C were calculated using the same analytic strategy as rs1990622A, but using rs850737C dosage as an independent variable (additive model). We correlated modQTL and trans-eQTL effect size (β-coefficient from linear regression models) of rs850737C dosage with that of rs1990622A carrier status using Pearson correlation.
We used RNA-estimated (per Digital Sorting Algorithm (DSA)) and immunohistochemistry (IHC)-measured ROSMAP DLPFC cell type proportions from a previous study (Patrick et al., 2019) to examine whether modQTL association can be explained by changes in cell type proportion in ROSMAP. As detailed in a previous study (Patrick et al., 2019), RNA-estimated cell type proportions are calculated using up to 100 markers per cell type, and IHC cell type assignment was based on the following markers: NeuN (neurons), GFAP (astrocytes), Iba1 (microglia), Olig2 (oligodendrocytes) and PECAM-1 (endothelial cells). To assess whether previously reported association between rs1990622A and RNA-inferred cell type proportions are due to actual cell type proportion change, we assessed and compared the associations of rs1990622A carrier status with both RNA-inferred and IHC-measured cell type. We used linear regression models, in a subset of participants with IHC-measured cell type proportions: either a measured or inferred cell type proportion was a dependent variable, rs1990622A carrier status was an independent variable, and we adjusted for genotyping platform. Then, we analyzed whether cell type proportion confounded the modQTL association, by testing the modQTL association while adjusting for the IHC-measured cell type proportions.
Association of modQTLs with miRNAs were tested with linear regression models: miRNA level was a dependent variable, a modQTL allele (either rs1990622A carrier status or rs78930980G dosage) was an independent variable, and we controlled age at death, sex, RIN, post-mortem interval, genotyping platform, and PC1-3. FDR<0.05 was used as a statistical significance threshold.
A set of sensitivity analyses was performed to rule out technical biases specific to front-end RNA-Seq data processing procedure: we performed modQTL and trans eQTL analyses of the significant modQTLs from the primary analyses, using the reprocessed ROSMAP DLPFC RNA-Seq data from the same participants as the primary dataset, and compared the results with our primary analyses. We performed another set of sensitivity analyses excluding trans-genes with sequence similarities with cis-genes, to exclude possible misalignment-driven trans-eQTL results. Genes with sequence similarities were defined as all genes that share one or more short sequences (75 bp from an exon, 36 bp from a 3’-UTR) with a given gene, per a published resource (Saha and Battle, 2018). We analyzed the trans-eQTL results excluding all genes with sequence similarities with any gene within 1 Mb from a given SNP. Then, to examine whether our results were driven by unmeasured confounders, we derived 10 surrogate variables (SVs) conditioned on the rs1990622A allele carrier status using the R “sva” package (Leek et al., 2019; Leek and Storey, 2007). We examined whether adjusting these SVs change the rs1990622A modQTL and trans-eQTL associations. Of note, we did not assess the RBFOX1 rs78930980 locus with SV analysis given that we had only 17 minor allele carriers.
Association of rs1990622 and rs850737 with LATE-NC burden (captured by a global semi-quantitative TDP-43 measure) was assessed in an extended dataset that include all deceased ROSMAP participants of European descents with genotype and TDP-43 proteinopathy assessment, controlling for age at death, sex, genotyping platform, and PC1-3. Correlation of each rs1990622-associated module with LATE-NC stage was tested through Spearman correlation, and Pearson correlation between each module expression and LATE-NC burden was also assessed. Mediation analyses were done with nonparametric bootstrap with 10,000 simulations, having either rs1990622A carrier status or APOE ε4 carrier status as the binary independent variable. We first set m110 expression as the continuous mediator, and quantitative neuropathology (Aβ for the APOE ε4 model, LATE-NC burden for the rs1990622A model) as the continuous outcome variable. Then, we repeated the analysis switching the mediator and the outcome, to determine a more plausible direction of causal mediation. We controlled for age at death, sex, genotyping platform, and PC1-3 in all models. Then, based on the mediation analyses results and literature, we set the following model for a structural equation modeling (SEM) through the R “lavaan” package:
Model fit of the SEM was assess with multiple metrics including chi-square, comparative fit index (CFI), Tucker Lewis Index (TLI), and root mean square error of approximation (RMSEA).
We captured resilience to neuropathology with residual cognition, a quantitative trait defined in this study as a residual from a linear model with global cognition as the outcome and Aβ, PHF-tau, macroscopic/microscopic infarcts, atherosclerosis, arteriolosclerosis, cerebral amyloid angiopathy, neocortical Lewy body, TDP-43 proteinopathy burden, age at death, sex, and education as predictors. Then, Pearson correlation was used to test association of residual cognition with each rs1990622-associated module. We performed mediation analysis (R “mediation” package; nonparametric bootstrap with 10,000 simulations) with rs1990622A carrier status as a binary independent variable, a module expression as a continuous mediator, and residual cognition as a continuous outcome, while adjusting for genotyping platform and PC1-3.
Cis-eQTL, trans-eQTL, and trans-sQTL associations of rs78909380G were calculated using the same analytic strategy as rs1990622A, using rs78909380G dosage as an independent variable.
Supplementary Material
Table S8. Intron clusters differentially excised in TMEM106B rs1990622A carriers. (Related to Figure 2 and section “Dominant modQTL, trans-eQTL, and trans-splicing QTL effects of the TMEM106B locus”) Differential intron excision according to rs1990622A carrier status was analyzed, using likelihood ratio test. Log likelihood ratio (loglr), p-value, and FDR from a likelihood ratio test with N-1 degrees of freedom (df) is shown (N = number of introns in each cluster) for intron clusters with FDR<0.05.
Highlights.
Genome-wide screen identifies regulators of aging brain gene co-expression modules
TMEM106B and GRN variants show coordinated effects on aging brain transcriptome
TMEM106B-regulated myelination/lysosomal genes connect amyloid-β and TDP-43
An RBFOX1 variant upregulates innate immunity genes in the aging human brain
Acknowledgements:
We thank the participants and study staffs of the Religious Orders Study, the Rush Memory and Aging Project, and the Mayo RNAseq study. This work was funded by the United States National Institutes of Health (P30AG10161 (DAB), R01AG036836 (PLD), R01AG15819 (DAB), R01AG17917 (DAB), R01AG042210 (JAS), R01AG057911 (CAG), RF1AG051504 (NET), U01AG046139 (NET), U01AG046152 (PLD, DAB), and K23AG062750 (HSY)) and Alzheimer’s Association (AACF-17-505359 (HSY)).
Footnotes
Declaration of Interests: P.L.D serves on a scientific advisory board for Neuroimmunology Newco, Roche, Biogen, Celgene, has a sponsored research agreement with Biogen and Roche, and has fellowship funding through Genentech, outside the submitted work. All other authors declare no competing interest.
Publisher's Disclaimer: This is a PDF file of an unedited manuscript that has been accepted for publication. As a service to our customers we are providing this early version of the manuscript. The manuscript will undergo copyediting, typesetting, and review of the resulting proof before it is published in its final form. Please note that during the production process errors may be discovered which could affect the content, and all legal disclaimers that apply to the journal pertain.
Supplemental Information
Please refer to a main supplemental information file (supplementary figures and tables) and an additional excel file (table S8).
References
- Albert FW, and Kruglyak L (2015). The role of regulatory variation in complex traits and disease. Nature reviews Genetics 16, 197–212. [DOI] [PubMed] [Google Scholar]
- Allen M, Carrasquillo MM, Funk C, Heavner BD, Zou F, Younkin CS, Burgess JD, Chai HS, Crook J, Eddy JA, et al. (2016). Human whole genome genotype and transcriptome data for Alzheimer's and other neurodegenerative diseases. Scientific data 3, 160089. [DOI] [PMC free article] [PubMed] [Google Scholar]
- Allen M, Wang X, Burgess JD, Watzlawik J, Serie DJ, Younkin CS, Nguyen T, Malphrus KG, Lincoln S, Carrasquillo MM, et al. (2018a). Conserved brain myelination networks are altered in Alzheimer's and other neurodegenerative diseases. Alzheimer's & dementia : the journal of the Alzheimer's Association 14, 352–366. [DOI] [PMC free article] [PubMed] [Google Scholar]
- Allen M, Wang X, Serie DJ, Strickland SL, Burgess JD, Koga S, Younkin CS, Nguyen TT, Malphrus KG, Lincoln SJ, et al. (2018b). Divergent brain gene expression patterns associate with distinct cell-specific tau neuropathology traits in progressive supranuclear palsy. Acta neuropathologica 136, 709–727. [DOI] [PMC free article] [PubMed] [Google Scholar]
- Alzheimer's Association (2018). 2018 Alzheimer's disease facts and figures. Alzheimer's & Dementia 14, 367–429. [DOI] [PubMed] [Google Scholar]
- Arvanitakis Z, Capuano AW, Leurgans SE, Buchman AS, Bennett DA, and Schneider JA (2017). The Relationship of Cerebral Vessel Pathology to Brain Microinfarcts. Brain Pathol 27, 77–85. [DOI] [PMC free article] [PubMed] [Google Scholar]
- Baker M, Mackenzie IR, Pickering-Brown SM, Gass J, Rademakers R, Lindholm C, Snowden J, Adamson J, Sadovnick AD, Rollinson S, et al. (2006). Mutations in progranulin cause tau-negative frontotemporal dementia linked to chromosome 17. Nature 442, 916–919. [DOI] [PubMed] [Google Scholar]
- Bennett DA, Buchman AS, Boyle PA, Barnes LL, Wilson RS, and Schneider JA (2018). Religious Orders Study and Rush Memory and Aging Project. Journal of Alzheimer's disease : JAD 64, S161–S189. [DOI] [PMC free article] [PubMed] [Google Scholar]
- Bennett DA, Schneider JA, Arvanitakis Z, and Wilson RS (2012a). Overview and findings from the religious orders study. Current Alzheimer research 9, 628–645. [DOI] [PMC free article] [PubMed] [Google Scholar]
- Bennett DA, Schneider JA, Buchman AS, Barnes LL, Boyle PA, and Wilson RS (2012b). Overview and findings from the rush Memory and Aging Project. Current Alzheimer research 9, 646–663. [DOI] [PMC free article] [PubMed] [Google Scholar]
- Bennett DA, Yu L, and De Jager PL (2014). Building a pipeline to discover and validate novel therapeutic targets and lead compounds for Alzheimer's disease. Biochemical pharmacology 88, 617–630. [DOI] [PMC free article] [PubMed] [Google Scholar]
- Boyle PA, Yu L, Nag S, Leurgans S, Wilson RS, Bennett DA, and Schneider JA (2015). Cerebral amyloid angiopathy and cognitive outcomes in community-based older persons. Neurology 85, 1930–1936. [DOI] [PMC free article] [PubMed] [Google Scholar]
- Brynedal B, Choi J, Raj T, Bjornson R, Stranger BE, Neale BM, Voight BF, and Cotsapas C (2017). Large-Scale trans-eQTLs Affect Hundreds of Transcripts and Mediate Patterns of Transcriptional Co-regulation. American journal of human genetics 100, 581–591. [DOI] [PMC free article] [PubMed] [Google Scholar]
- Chen-Plotkin AS, Unger TL, Gallagher MD, Bill E, Kwong LK, Volpicelli-Daley L, Busch JI, Akle S, Grossman M, Van Deerlin V, et al. (2012). TMEM106B, the risk gene for frontotemporal dementia, is regulated by the microRNA-132/212 cluster and affects progranulin pathways. The Journal of neuroscience : the official journal of the Society for Neuroscience 32, 11213–11227. [DOI] [PMC free article] [PubMed] [Google Scholar]
- Cruts M, Gijselinck I, van der Zee J, Engelborghs S, Wils H, Pirici D, Rademakers R, Vandenberghe R, Dermaut B, Martin JJ, et al. (2006). Null mutations in progranulin cause ubiquitin-positive frontotemporal dementia linked to chromosome 17q21. Nature 442, 920–924. [DOI] [PubMed] [Google Scholar]
- De Jager PL, Ma Y, McCabe C, Xu J, Vardarajan BN, Felsky D, Klein HU, White CC, Peters MA, Lodgson B, et al. (2018). A multi-omic atlas of the human frontal cortex for aging and Alzheimer's disease research. Scientific data 5, 180142. [DOI] [PMC free article] [PubMed] [Google Scholar]
- Dobin A, Davis CA, Schlesinger F, Drenkow J, Zaleski C, Jha S, Batut P, Chaisson M, and Gingeras TR (2013). STAR: ultrafast universal RNA-seq aligner. Bioinformatics 29, 15–21. [DOI] [PMC free article] [PubMed] [Google Scholar]
- Gaiteri C, Chen M, Szymanski B, Kuzmin K, Xie J, Lee C, Blanche T, Chaibub Neto E, Huang SC, Grabowski T, et al. (2015). Identifying robust communities and multi-community nodes by combining top-down and bottom-up approaches to clustering. Scientific reports 5, 16361. [DOI] [PMC free article] [PubMed] [Google Scholar]
- Gallagher MD, Posavi M, Huang P, Unger TL, Berlyand Y, Gruenewald AL, Chesi A, Manduchi E, Wells AD, Grant SFA, et al. (2017). A Dementia-Associated Risk Variant near TMEM106B Alters Chromatin Architecture and Gene Expression. American journal of human genetics 101, 643–663. [DOI] [PMC free article] [PubMed] [Google Scholar]
- Gandal MJ, Zhang P, Hadjimichael E, Walker RL, Chen C, Liu S, Won H, van Bakel H, Varghese M, Wang Y, et al. (2018). Transcriptome-wide isoform-level dysregulation in ASD, schizophrenia, and bipolar disorder. Science 362. [DOI] [PMC free article] [PubMed] [Google Scholar]
- Golab L, Korn F, Li F, Saha B, and Srivastava D (2015). Size-constrained weighted set cover. 2015 IEEE 31st International Conference on Data Engineering, 879–890. [Google Scholar]
- GTEx Consortium (2017). Genetic effects on gene expression across human tissues. Nature 550, 204–213. [DOI] [PMC free article] [PubMed] [Google Scholar]
- Jaffe AE, Hyde T, Kleinman J, Weinbergern DR, Chenoweth JG, McKay RD, Leek JT, and Colantuoni C (2015). Practical impacts of genomic data "cleaning" on biological discovery using surrogate variable analysis. BMC Bioinformatics 16, 372. [DOI] [PMC free article] [PubMed] [Google Scholar]
- Kapasi A, DeCarli C, and Schneider JA (2017). Impact of multiple pathologies on the threshold for clinically overt dementia. Acta neuropathologica 134, 171–186. [DOI] [PMC free article] [PubMed] [Google Scholar]
- Klarin D, Damrauer SM, Cho K, Sun YV, Teslovich TM, Honerlaw J, Gagnon DR, DuVall SL, Li J, Peloso GM, et al. (2018). Genetics of blood lipids among ~300,000 multi-ethnic participants of the Million Veteran Program. Nature genetics 50, 1514–1523. [DOI] [PMC free article] [PubMed] [Google Scholar]
- Klein ZA, Takahashi H, Ma M, Stagi M, Zhou M, Lam TT, and Strittmatter SM (2017). Loss of TMEM106B Ameliorates Lysosomal and Frontotemporal Dementia-Related Phenotypes in Progranulin-Deficient Mice. Neuron 95, 281–296 e286. [DOI] [PMC free article] [PubMed] [Google Scholar]
- Langmead B, Trapnell C, Pop M, and Salzberg SL (2009). Ultrafast and memory-efficient alignment of short DNA sequences to the human genome. Genome biology 10, R25. [DOI] [PMC free article] [PubMed] [Google Scholar]
- Leek JT, Johnson WE, Parker HS, Fertig EJ, Jaffe AE, Storey JD, Zhang Y, and Torres LC (2019). sva: Surrogate Variable Analysis. R package version 3340. [Google Scholar]
- Leek JT, and Storey JD (2007). Capturing heterogeneity in gene expression studies by surrogate variable analysis. PLoS genetics 3, 1724–1735. [DOI] [PMC free article] [PubMed] [Google Scholar]
- Li YI, Knowles DA, Humphrey J, Barbeira AN, Dickinson SP, Im HK, and Pritchard JK (2018). Annotation-free quantification of RNA splicing using LeafCutter. Nature genetics 50, 151–158. [DOI] [PMC free article] [PubMed] [Google Scholar]
- Li Z, Farias FHG, Dube U, Del-Aguila JL, Mihindukulasuriya KA, Fernandez MV, Ibanez L, Budde JP, Wang F, Lake AM, et al. (2020). The TMEM106B FTLD-protective variant, rs1990621, is also associated with increased neuronal proportion. Acta neuropathologica 139, 45–61. [DOI] [PMC free article] [PubMed] [Google Scholar]
- Liao Y, Wang J, Jaehnig EJ, Shi Z, and Zhang B (2019). WebGestalt 2019: gene set analysis toolkit with revamped UIs and APIs. Nucleic acids research 47, W199–W205. [DOI] [PMC free article] [PubMed] [Google Scholar]
- Ling JP, Pletnikova O, Troncoso JC, and Wong PC (2015). TDP-43 repression of nonconserved cryptic exons is compromised in ALS-FTD. Science 349, 650–655. [DOI] [PMC free article] [PubMed] [Google Scholar]
- Logsdon BA, Perumal TM, Swarup V, Wang M, Funk C, Gaiteri C, Allen M, Wang X, Dammer E, Srivastava G, et al. (2019). Meta-analysis of the human brain transcriptome identifies heterogeneity across human AD coexpression modules robust to sample collection and methodological approach. bioRxiv 10.1101/510420. [DOI] [Google Scholar]
- Magis AT, Funk CC, and Price ND (2015). SNAPR: a bioinformatics pipeline for efficient and accurate RNA-seq alignment and analysis. IEEE life sciences letters 1, 22–25. [DOI] [PMC free article] [PubMed] [Google Scholar]
- Mostafavi S, Gaiteri C, Sullivan SE, White CC, Tasaki S, Xu J, Taga M, Klein HU, Patrick E, Komashko V, et al. (2018). A molecular network of the aging human brain provides insights into the pathology and cognitive decline of Alzheimer's disease. Nature neuroscience 21, 811–819. [DOI] [PMC free article] [PubMed] [Google Scholar]
- Nag S, Yu L, Boyle PA, Leurgans SE, Bennett DA, and Schneider JA (2018). TDP-43 pathology in anterior temporal pole cortex in aging and Alzheimer's disease. Acta neuropathologica communications 6, 33. [DOI] [PMC free article] [PubMed] [Google Scholar]
- Nelson PT, Dickson DW, Trojanowski JQ, Jack CR, Boyle PA, Arfanakis K, Rademakers R, Alafuzoff I, Attems J, Brayne C, et al. (2019). Limbic-predominant age-related TDP-43 encephalopathy (LATE): consensus working group report. Brain : a journal of neurology 142, 1503–1527. [DOI] [PMC free article] [PubMed] [Google Scholar]
- Ng B, White CC, Klein HU, Sieberts SK, McCabe C, Patrick E, Xu J, Yu L, Gaiteri C, Bennett DA, et al. (2017). An xQTL map integrates the genetic architecture of the human brain's transcriptome and epigenome. Nature neuroscience 20, 1418–1426. [DOI] [PMC free article] [PubMed] [Google Scholar]
- Nicholson AM, Finch NA, Wojtas A, Baker MC, Perkerson RB 3rd, Castanedes-Casey M, Rousseau L, Benussi L, Binetti G, Ghidoni R, et al. (2013). TMEM106B p.T185S regulates TMEM106B protein levels: implications for frontotemporal dementia. Journal of neurochemistry 126, 781–791. [DOI] [PMC free article] [PubMed] [Google Scholar]
- Nicholson AM, and Rademakers R (2016). What we know about TMEM106B in neurodegeneration. Acta neuropathologica 132, 639–651. [DOI] [PMC free article] [PubMed] [Google Scholar]
- Parikshak NN, Gandal MJ, and Geschwind DH (2015). Systems biology and gene networks in neurodevelopmental and neurodegenerative disorders. Nature reviews Genetics 16, 441–458. [DOI] [PMC free article] [PubMed] [Google Scholar]
- Parsana P, Ruberman C, Jaffe AE, Schatz MC, Battle A, and Leek JT (2019). Addressing confounding artifacts in reconstruction of gene co-expression networks. Genome biology 20, 94. [DOI] [PMC free article] [PubMed] [Google Scholar]
- Patrick E, Rajagopal S, Wong HA, McCabe C, Xu J, Tang A, Imboywa SH, Schneider JA, Pochet N, Krichevsky AM, et al. (2017). Dissecting the role of non-coding RNAs in the accumulation of amyloid and tau neuropathologies in Alzheimer's disease. Molecular neurodegeneration 12, 51. [DOI] [PMC free article] [PubMed] [Google Scholar]
- Patrick E, Taga M, Ergun A, Ng B, Casazza W, Cimpean M, Yung C, Schneider JA, Bennett DA, Gaiteri C, et al. (2019). Deconvolving the contributions of cell-type heterogeneity on cortical gene expression. bioRxiv doi: 10.1101/566307. [DOI] [PMC free article] [PubMed] [Google Scholar]
- Paushter DH, Du H, Feng T, and Hu F (2018). The lysosomal function of progranulin, a guardian against neurodegeneration. Acta neuropathologica 136, 1–17. [DOI] [PMC free article] [PubMed] [Google Scholar]
- Piovesan A, Caracausi M, Ricci M, Strippoli P, Vitale L, and Pelleri MC (2015). Identification of minimal eukaryotic introns through GeneBase, a user-friendly tool for parsing the NCBI Gene databank. DNA Res 22, 495–503. [DOI] [PMC free article] [PubMed] [Google Scholar]
- Polymenidou M, Lagier-Tourenne C, Hutt KR, Huelga SC, Moran J, Liang TY, Ling SC, Sun E, Wancewicz E, Mazur C, et al. (2011). Long pre-mRNA depletion and RNA missplicing contribute to neuronal vulnerability from loss of TDP-43. Nature neuroscience 14, 459–468. [DOI] [PMC free article] [PubMed] [Google Scholar]
- Pruim RJ, Welch RP, Sanna S, Teslovich TM, Chines PS, Gliedt TP, Boehnke M, Abecasis GR, and Willer CJ (2010). LocusZoom: regional visualization of genome-wide association scan results. Bioinformatics 26, 2336–2337. [DOI] [PMC free article] [PubMed] [Google Scholar]
- Raj T, Li YI, Wong G, Humphrey J, Wang M, Ramdhani S, Wang YC, Ng B, Gupta I, Haroutunian V, et al. (2018). Integrative transcriptome analyses of the aging brain implicate altered splicing in Alzheimer's disease susceptibility. Nature genetics 50, 1584–1592. [DOI] [PMC free article] [PubMed] [Google Scholar]
- Ren Y, van Blitterswijk M, Allen M, Carrasquillo MM, Reddy JS, Wang X, Beach TG, Dickson DW, Ertekin-Taner N, Asmann YW, et al. (2018). TMEM106B haplotypes have distinct gene expression patterns in aged brain. Molecular neurodegeneration 13, 35. [DOI] [PMC free article] [PubMed] [Google Scholar]
- Rhinn H, and Abeliovich A (2017). Differential Aging Analysis in Human Cerebral Cortex Identifies Variants in TMEM106B and GRN that Regulate Aging Phenotypes. Cell systems 4, 404–415 e405. [DOI] [PubMed] [Google Scholar]
- Saha A, and Battle A (2018). False positives in trans-eQTL and co-expression analyses arising from RNA-sequencing alignment errors. F1000Research 7, 1860. [DOI] [PMC free article] [PubMed] [Google Scholar]
- Schneider JA, Arvanitakis Z, Yu L, Boyle PA, Leurgans SE, and Bennett DA (2012). Cognitive impairment, decline and fluctuations in older community-dwelling subjects with Lewy bodies. Brain : a journal of neurology 135, 3005–3014. [DOI] [PMC free article] [PubMed] [Google Scholar]
- Settembre C, Fraldi A, Medina DL, and Ballabio A (2013). Signals from the lysosome: a control centre for cellular clearance and energy metabolism. Nature reviews Molecular cell biology 14, 283–296. [DOI] [PMC free article] [PubMed] [Google Scholar]
- Simons C, Dyment D, Bent SJ, Crawford J, D'Hooghe M, Kohlschutter A, Venkateswaran S, Helman G, Poll-The BT, Makowski CC, et al. (2017). A recurrent de novo mutation in TMEM106B causes hypomyelinating leukodystrophy. Brain : a journal of neurology 140, 3105–3111. [DOI] [PMC free article] [PubMed] [Google Scholar]
- Smith KR, Damiano J, Franceschetti S, Carpenter S, Canafoglia L, Morbin M, Rossi G, Pareyson D, Mole SE, Staropoli JF, et al. (2012). Strikingly different clinicopathological phenotypes determined by progranulin-mutation dosage. American journal of human genetics 90, 1102–1107. [DOI] [PMC free article] [PubMed] [Google Scholar]
- Stegle O, Parts L, Durbin R, and Winn J (2010). A Bayesian framework to account for complex non-genetic factors in gene expression levels greatly increases power in eQTL studies. PLoS Comput Biol 6, e1000770. [DOI] [PMC free article] [PubMed] [Google Scholar]
- Subramanian A, Tamayo P, Mootha VK, Mukherjee S, Ebert BL, Gillette MA, Paulovich A, Pomeroy SL, Golub TR, Lander ES, et al. (2005). Gene set enrichment analysis: a knowledge-based approach for interpreting genome-wide expression profiles. Proc Natl Acad Sci U S A 102, 15545–15550. [DOI] [PMC free article] [PubMed] [Google Scholar]
- Sun M, Bell W, LaClair KD, Ling JP, Han H, Kageyama Y, Pletnikova O, Troncoso JC, Wong PC, and Chen LL (2017). Cryptic exon incorporation occurs in Alzheimer's brain lacking TDP-43 inclusion but exhibiting nuclear clearance of TDP-43. Acta neuropathologica 133, 923–931. [DOI] [PMC free article] [PubMed] [Google Scholar]
- The 1000 Genomes Project Consortium. (2012). An integrated map of genetic variation from 1,092 human genomes. Nature 491, 56–65. [DOI] [PMC free article] [PubMed] [Google Scholar]
- Tingley D, Yamamoto T, Hirose K, Keele L, and Imai K (2014). mediation: R package for causal mediation analysis. Journal of Statistical Software 59. [Google Scholar]
- Tollervey JR, Curk T, Rogelj B, Briese M, Cereda M, Kayikci M, Konig J, Hortobagyi T, Nishimura AL, Zupunski V, et al. (2011). Characterizing the RNA targets and position-dependent splicing regulation by TDP-43. Nature neuroscience 14, 452–458. [DOI] [PMC free article] [PubMed] [Google Scholar]
- Van Deerlin VM, Sleiman PM, Martinez-Lage M, Chen-Plotkin A, Wang LS, Graff-Radford NR, Dickson DW, Rademakers R, Boeve BF, Grossman M, et al. (2010). Common variants at 7p21 are associated with frontotemporal lobar degeneration with TDP-43 inclusions. Nature genetics 42, 234–239. [DOI] [PMC free article] [PubMed] [Google Scholar]
- Ward LD, and Kellis M (2012). HaploReg: a resource for exploring chromatin states, conservation, and regulatory motif alterations within sets of genetically linked variants. Nucleic acids research 40, D930–934. [DOI] [PMC free article] [PubMed] [Google Scholar]
- Wennberg AM, Tosakulwong N, Lesnick TG, Murray ME, Whitwell JL, Liesinger AM, Petrucelli L, Boeve BF, Parisi JE, Knopman DS, et al. (2018). Association of Apolipoprotein E epsilon4 With Transactive Response DNA-Binding Protein 43. JAMA neurology 75, 1347–1354. [DOI] [PMC free article] [PubMed] [Google Scholar]
- Westra HJ, Peters MJ, Esko T, Yaghootkar H, Schurmann C, Kettunen J, Christiansen MW, Fairfax BP, Schramm K, Powell JE, et al. (2013). Systematic identification of trans eQTLs as putative drivers of known disease associations. Nature genetics 45, 1238–1243. [DOI] [PMC free article] [PubMed] [Google Scholar]
- White CC, Yang HS, Yu L, Chibnik LB, Dawe RJ, Yang J, Klein HU, Felsky D, Ramos-Miguel A, Arfanakis K, et al. (2017). Identification of genes associated with dissociation of cognitive performance and neuropathological burden: Multistep analysis of genetic, epigenetic, and transcriptional data. PLoS medicine 14, e1002287. [DOI] [PMC free article] [PubMed] [Google Scholar]
- Wray NR, Ripke S, Mattheisen M, Trzaskowski M, Byrne EM, Abdellaoui A, Adams MJ, Agerbo E, Air TM, Andlauer TMF, et al. (2018). Genome-wide association analyses identify 44 risk variants and refine the genetic architecture of major depression. Nature genetics 50, 668–681. [DOI] [PMC free article] [PubMed] [Google Scholar]
- Yang HS, Yu L, White CC, Chibnik LB, Chhatwal JP, Sperling RA, Bennett DA, Schneider JA, and De Jager PL (2018). Evaluation of TDP-43 proteinopathy and hippocampal sclerosis in relation to APOE epsilon4 haplotype status: a community-based cohort study. The Lancet Neurology, 17, 773–781. [DOI] [PMC free article] [PubMed] [Google Scholar]
- Yu L, De Jager PL, Yang J, Trojanowski JQ, Bennett DA, and Schneider JA (2015). The TMEM106B locus and TDP-43 pathology in older persons without FTLD. Neurology 84, 927–934. [DOI] [PMC free article] [PubMed] [Google Scholar]
- Yu L, Petyuk VA, Gaiteri C, Mostafavi S, Young-Pearse T, Shah RC, Buchman AS, Schneider JA, Piehowski PD, Sontag RL, et al. (2018). Targeted brain proteomics uncover multiple pathways to Alzheimer's dementia. Annals of neurology 84, 78–88. [DOI] [PMC free article] [PubMed] [Google Scholar]
Associated Data
This section collects any data citations, data availability statements, or supplementary materials included in this article.
Supplementary Materials
Table S8. Intron clusters differentially excised in TMEM106B rs1990622A carriers. (Related to Figure 2 and section “Dominant modQTL, trans-eQTL, and trans-splicing QTL effects of the TMEM106B locus”) Differential intron excision according to rs1990622A carrier status was analyzed, using likelihood ratio test. Log likelihood ratio (loglr), p-value, and FDR from a likelihood ratio test with N-1 degrees of freedom (df) is shown (N = number of introns in each cluster) for intron clusters with FDR<0.05.
Data Availability Statement
Genotypes, RNA-Seq, proteomics, and miRNA data from ROSMAP and Genotypes and RNA-Seq data from the Mayo RNAseq study are available via the Alzheimer’s Disease (AD) Knowledge Portal (https://adknowledgeportal.org). The AD Knowledge Portal is a platform for accessing data, analyses, and tools generated by the Accelerating Medicines Partnership (AMP-AD) Target Discovery Program and other National Institute on Aging (NIA)-supported programs to enable open-science practices and accelerate translational learning. Data is available for general research use according to the following requirements for data access and data attribution (https://adknowledgeportal.synapse.org/#/DataAccess/Instructions).
See the following links for direct data access:
ROSMAP study - Phenotype data: https://www.radc.rush.edu
ROSMAP study - Genotypes-Imputed: https://doi.org/10.7303/syn3157329
ROSMAP study - Gene co-expression networks: https://doi.org/10.7303/syn7169817
ROSMAP study - DLPFC RNA-Seq (primary dataset): https://doi.org/10.7303/syn3505732.2
ROSMAP study - DLPFC RNA-Seq (reprocessed data; primary + replication 2): https://doi.org/10.7303/syn8456719.21
ROSMAP study - DLPFC LC-SRM proteomics (TMEM106B protein quantification): https://doi.org/10.7303/syn10468856
ROSMAP study - DLPFC miRNA: https://doi.org/10.7303/syn3387325
MayoRNAseq study - Genotypes-Imputed: https://doi.org/0.7303/syn8650955
MayoRNAseq study - Temporal Cortex RNAseq: https://doi.org/10.7303/syn3163039
For additional information and metadata on these studies see the following links:
The Religious Orders Study and the Memory and Aging Project (ROSMAP): https://adknowledgeportal.synapse.org/Explore/Studies?Study=syn3219045
The MayoRNAseq study: https://adknowledgeportal.synapse.org/Explore/Studies?Study=syn5550404