

Abstract
Intelligence is a socially and scientifically interesting topic because of its prominence in human behavior, yet there is little clarity on how the neuroimaging and neurobiological correlates of intelligence differ between males and females, with most investigations limited to using either mass-univariate techniques or a single neuroimaging modality. Here we employed connectome-based predictive modeling (CPM) to predict the intelligence quotient (IQ) scores for 166 males and 160 females separately, using resting-state functional connectivity, grey matter cortical thickness or both. The identified multimodal, IQ-predictive imaging features were then compared between genders. CPM showed high out-of-sample prediction accuracy (r > 0.34), and integrating both functional and structural features further improved prediction accuracy by capturing complementary information (r = 0.45). Male IQ demonstrated higher correlations with cortical thickness in the left inferior parietal lobule, and with functional connectivity in left parahippocampus and default mode network, regions previously implicated in spatial cognition and logical thinking. In contrast, female IQ was more correlated with cortical thickness in the right inferior parietal lobule, and with functional connectivity in putamen and cerebellar networks, regions previously implicated in verbal learning and item memory. Results suggest that the intelligence generation of males and females may rely on opposite cerebral lateralized key brain regions and distinct functional networks consistent with their respective superiority in cognitive domains. Promisingly, understanding the neural basis of gender differences underlying intelligence may potentially lead to optimized personal cognitive developmental programs and facilitate advancements in unbiased educational test design.
Keywords: Individualized prediction, Intelligence quotient, Connectome-based predictive modeling, Multimodal, Gender difference
Introduction
Individual differences in overall intellectual performance can be measured using the intelligence quotient (IQ), which covers a variety of cognitive domains including memory, verbal comprehension, processing speed, reasoning, spatial ability and executive function (Deary et al. 2010). Consequently, intelligence is postulated to draw on communications between regions that are responsible for multiple high-order cognitive functions. A paper reviewed advances in functional and structural neuroimaging findings (Jung and Haier 2007) reported a striking consensus, named the Parieto-Frontal Integration Theory (P-FIT), which suggested that individual differences in intelligence can be characterized by a distributed network mainly involving the parietal and frontal regions (Vakhtin et al. 2014). This theory has been corroborated by numerous neuroscientific studies across various neuroimaging modalities (Langeslag et al. 2013; Song et al. 2008; Glascher et al. 2010; Vakhtin et al. 2014; R. T. Jiang et al. 2017). Specifically, this theory implied that basic sensory/perceptual regions were responsible for visual/auditory recognition, imagery, elaboration, the parietal regions for structural symbolism, abstraction, the frontal regions for problem solving, evaluation, hypothesis testing, and then the anterior cingulate accounted for selecting the response (Colom et al. 2010).
On the other hand, sex discrepancy in intelligence has been of enduring biological interest in cognitive psychology, with existing studies converged in demonstrating superior memory and social cognition abilities in females, and better motor and social skills in males (Ingalhalikar et al. 2014). A wealthy of neuroimaging studies on intelligence have also demonstrated marked gender difference, focusing on showing how brain imaging measures differentially correlate with intelligence in males and females. For example, females’ intelligence demonstrates a greater reliance on functional connectivity (FC) between the bilateral Wernicke’s areas and left posterior superior temporal gyrus, while males’ intelligence displays a closer correlation with FC between Broca’s area and auditory processing areas (Schmithorst and Holland 2007). Males show stronger intelligence/gray matter (GM) correlations in primarily frontal and parietal areas (Brodmann area, [BA] 8, 9, 39, 40) (Haier et al. 2005), and greater hemispheric lateralization for various high-level cognitive domains like affective, language and memory (Cahill et al. 2001; Schmithorst and Holland 2006), whereas in females the strongest correlations are in frontal lobe (BA 10) along with Broca’s area (Haier et al. 2005). Regarding cortical thickness, females’ intelligence is strongly correlated with prefrontal and temporal association cortices, whereas intelligence of males exhibits pre-dominated correlations in temporal-occipital cortices (Narr et al. 2007; Goriounova and Mansvelder 2019). In addition, males exhibit stronger correlations with overall white matter volume, enhanced modularity, and greater within-hemisphere connectivity (Ryman et al. 2016), whereas females show greater local and global efficiency, as well as between-hemisphere connectivity (Yan et al. 2011; Ingalhalikar et al. 2014). Moreover, differences in hemispheric laterality are also hypothesized to exist between males and females. For example, males show more left hemisphere specialization for verbal processing and greater bilateral activity for visuospatial tasks, whereas females show greater bilateral activity for verbal processing and more right hemisphere specialization for visuospatial tasks (Clements et al. 2006). Studies also suggested that the male brain was more strongly lateralized than the female brain, which may underlie their greater vulnerability to disorders with disrupted brain asymmetries like schizophrenia, dyslexia and autism (Tomasi and Volkow 2012; Baron-Cohen et al. 2005).
Despite the fact that males and female exhibit striking differences in brain structure and function, there is little difference in general intelligence between them (Ryman et al. 2016). It appears that males and females may achieve comparable levels of general intelligence by using distinct strategies when solving cognitive tasks (Deary et al. 2010). Although gender difference in intelligence is socially and scientifically important, there is little clarity on how the neuroimaging and neurobiological correlates of intelligence differ between males and females. In addition, most existing investigations on intelligence focused on mass univariate approaches at the group level, ignoring the individual heterogeneity, or were restricted to using a single modality without utilizing complementary information provided by multimodal imaging data (Sui et al. 2018).
In the current study, we are motivated to ascertain the degree to which intelligence of males and females is underpinned by different neurobiological correlates using multimodal neuroimaging data in the context of individualized prediction. Addressing these issues could advance our understanding of the potential neurobiological basis underlying gender difference in intelligence, and promisingly lead to optimized personal cognitive programs which can narrow the gender gap that is believed to exist in some specific cognitive domains (Irwing and Lynn 2006). Specifically, we employed a recently developed machine learning-based multivariate approach —connectome-based predictive modeling (CPM) (Shen et al. 2017)—to quantitatively estimate individual’s intelligence scores using resting-state functional connectivity, grey matter cortical thickness or both. Previously, it has been stated that the strengths of CPM include its use of linear operation which allows for fast computation, robust generalization and straightforward interpretation of feature weights, as well as its purely data-driven nature which helps guard against the possibility of ignoring potentially important features brought by hypothesis-driven approaches (Shen et al. 2017). The CPM has been successfully applied to predict aspects of human behaviors like personality traits (Hsu et al. 2018), attention (Rosenberg et al. 2016), creative ability (R. E. Beaty et al. 2018; Z. Liu et al. 2018) and treatment outcomes for cocaine use disorder (Yip et al. 2019) from patterns of brain connectivity. Moreover, CPM has also been used for the prediction of fluid intelligence. Specifically, Finn’s work successfully predicted the individual fluid intelligence scores with CPM in rigorous cross-validated analysis, demonstrating the potential of using CPM to reveal brain-behavior relationships and search for promising imaging biomarkers (Finn et al. 2015).
However, this study only used a single neuroimaging modality and didn’t investigate the gender difference. In the current study, we improved CPM which can now deal with multimodal neuroimaging features here, and derived improved prediction accuracy. Within a rigorous cross-validated analysis, our results showed that the intelligence generation of males and females may rely on opposite cerebral lateralized key brain regions and distinct functional networks, which is consistent with their superiority in cognitive domains.
Materials and methods
Subjects
Data used in the current study is same as our previous work (R. Jiang et al. 2018). A total of 440 healthy college students who were all Han Chinese covering a wide range of research areas, were recruited from the University of Electronic Science and Technology of China (UESTC). The Ethics Committee of School of Life Science and Technology at the UESTC approved the research protocol. Participants provided written informed consent and were paid for their participation. Participants had no history of neurologic or psychiatric disorders, and were not taking medications that could interfere with their ability to complete a questionnaire or provide MRI data (R. Jiang et al. 2018). All participants completed the Chinese version of Wechsler Adult Intelligence Scale (WAIS-RC) (Dai et al. 1990; Wechsler 1981). With high test-retest reliability, WAIS is a widely used measurement system that includes several fundamental cognitive performance subtests contributing to intelligence (Jensen 1998) including digit span, picture arrangement, information, block design, similarities, and digit symbol. The computed overall score from WAIS, i.e., Full-Scale IQ, can be used to represent the general intellectual abilities. Participants with either missing imaging data, incomplete WAIS assessment score or excessive head motion (defined as >3 mm translation, or >3° rotation during the run) were excluded. Finally, 326 righted-handed subjects (160F/166M, mean age 19.0±1.1 years, range: 17–24 years) were retained for further analysis. In this investigation, Full-Scale IQ scores ranged between 74 and 126 (mean IQ = 109.9 ± 11.1). There is no difference between males and females in age (p=0.55, Supplementary Figure S1) or education (males: 12.33±0.80 years; females: 12.38±0.84 years; p=0.57). Males have a slightly higher IQ scores than females (p=0.041).
MRI data acquisition
Details of the imaging protocol can be found in our previous work (Zhang et al. 2015). Whole-brain imaging was performed on a 3T MR750 magnetic resonance scanner (GE Healthcare). Resting-state fMRI data were acquired using a gradient echo, echo-planar-imaging (GRE-EPI) sequence with the following parameters: Repetition Time (TR) =2000 ms, Echo Time (TE) = 30 ms, field of view (FOV) = 240×240 mm2, flip angle = 90°, matrix = 64×64, voxel size = 3.75×3.75×4.0 mm3, 36 slices, and 245 volumes. High-resolution T1-weighted volumetric sequence was acquired using the following parameters: TR = 8.16 ms, TE = 3.18 ms, FA = 7°, FOV =256×256 mm2, acquisition matrix =256×256, slice thickness = 1 mm without gap, slice number = 188. Before scanning, all subjects were instructed to move as little as possible, keep eyes closed, think of nothing in particular, and not fall asleep. Subjects were asked right after the scan whether they had fallen asleep during the scan. Notably, the mean framewise displacement (FD) was not correlated with IQ scores (p>0.05).
Whole-brain functional connectivity analysis
Functional imaging data were preprocessed using DPARSFA (Data Processing Assistant for RestingState fMRI Advanced Edition, http://rfmri.org/DPARSF). Details of preprocessing have been published elsewhere (Jin et al. 2015; R. Jiang et al. 2018). The first 10 volumes were discarded to allow for magnetization equilibrium. Subsequent preprocessing included slice timing correction, head motion correction, spatial normalization to the Montreal Neurological Institute (MNI) template, resampling to 2 × 2 × 2 mm3 , smoothing using a 4 mm Gaussian kernel, temporal band-pass filtering (0.01 Hz to 0.08 Hz), and regressing out nuisance signals of head motion parameters, white matter, CSF, and global signals.
The registered fMRI volumes in the MNI template were parcellated into 116 nodes according to the Automated Anatomical Labeling (AAL) (Tzourio-Mazoyer et al. 2002). Mean regional time series were obtained for each individual by averaging voxel-wise fMRI time series in each of the 116 regions of interests (ROI). Pearson correlations of time courses between each node pair were calculated, and Fisher transformed, generating a 116 × 116 symmetric connectivity matrix per subject. After removing 116 diagonal elements, we extracted elements in the upper triangle of the FC matrix as features for analyzation.
Overall, the FC matrix was reshaped in a feature vector in the dimension of (116 × 115)/2 = 6670.
Cortical thickness calculation
Vertex-wise estimates of cortical thickness were calculated using publically available software package FreeSurfer (version 5.3.0, http://surfer.nmr.mgh.harvard.edu/). Initially, grey matter/white matter (white) and grey matter/cerebrospinal fluid (pial) surfaces were constructed for each participant. Detailed processing procedures refer to (Fischl and Dale 2000; Cui et al. 2016). The generated cortical surfaces were then quality checked to ensure accurate quantification of cortical thickness. The shortest distance between the white and pial surfaces at numerous vertices across the entire cortical mantle were calculated. Finally, the reconstructed cortical surfaces for each participants were aligned to a standardized cortical surface tessellation with 40,962 vertices per hemisphere and smoothed with a 20 mm full-width at half-maximum Gaussian filter (B. Liu et al. 2016).
Individualized prediction
In this study, we applied CPM to estimate participants’ IQ scores using either whole-brain FC or cortical thickness for males, females and all subjects separately. Figure 1 demonstrates a summary of our analysis flowchart. In light of CPM has been described in detail elsewhere (Shen et al. 2017), we briefly describe the procedure in the context of functional connectivity here. We employed a leave-one-out cross-validation (LOOCV) strategy to predict the IQ scores of novel individuals. Previously, the CPM procedure, along with LOOCV approach, has been widely applied for the prediction of multiple cognitive metrics and demonstrated robust prediction performance (Finn et al. 2015; R. E. Beaty et al. 2018; Feng et al. 2018; Greene et al. 2018; Hsu et al. 2018; Rosenberg et al. 2016). During LOOCV, each subject is designated as the testing sample in turns while the remaining subjects are used to train the CPM model. Each iteration consisted of three steps:
Fig. 1. Summary of the prediction flowchart and the derived neural correlates for intelligence.

In the current study, we employed CPM to estimate individual’s IQ scores using resting-state functional connectivity, grey matter cortical thickness or both. Importantly, integrating both functional and structural features improved prediction accuracy. Within rigorous cross-validated analysis, our results showed that the intelligence generation of males and females may rely on opposite cerebral lateralized key brain regions and distinct functional networks, which is consistent with their respective superiority in cognitive domains
Feature selection. We calculated the Pearson correlation between IQ scores and each of the 6670 FCs (edges) across training subjects, obtaining an r-value with an associated P value for each edge (Hsu et al. 2018). Next, edges that were positively correlated with IQ scores with a P value < INLINE made up the positive network or high-intelligent network (edges whose strength indexed higher IQ scores), while edges negatively correlated with IQ scores with a P value < INLINE made up the negative network or low-intelligent network (edges whose strength indexed low IQ scores).
Model building. By summing edges in the high-intelligent or low-intelligent network, we obtained a single summary statistic ‘network strength’ for each training subject. Then, a simple linear regression model was constructed to estimate the relationship between the high-intelligent or low-intelligent network strength with observed IQ scores (R. E. Beaty et al. 2018). A general linear model (GLM) was also built by combining the high- and low-intelligent network strengths.
Prediction. The model built in training subjects was applied to the one left out subject, generating a predicted IQ score. By exchanging the role of training and testing subsets in turn, and pulling together all testing subjects across N (sample size) loops, we obtained the predicted IQ scores for all participants.
Additionally, we repeated the CPM procedure with 81924 cortical thickness values as input features and acquired the high-intelligent and low-intelligent regions. The prediction performance was assessed by calculating the Pearson’s correlations between observed and predicted IQ scores and the normalized root mean square error (NRMSE). Moreover, to confirm the specificity of the IQ-predictive models and control for potential confounds, we also calculated the partial correction between predicted and observed IQ scores after ruling out age, mean frame-to-frame displacement and education years.
Note that the optimal parameters of INLINE and INLINE were determined by the data for each imaging modality, and once determined, they remained constant across all cross-validation loops (R. Jiang et al. 2018).
Details regarding parameter tuning and the optimal parameters used in final results are provided in Supplementary File S1 and Table S1. To implement multimodal prediction, we then combined functional and structural features using multiple linear regression. Specifically, positive network strength, positive cortex strength, negative network strength and negative cortex strength were concatenated horizontally as input features. Notably, the multimodal prediction was also performed within a LOOCV strategy.
IQ-predictive grey matter cortices and functional networks
Considering that our prediction was performed within a LOOCV strategy, in each iteration, slightly different imaging features were selected. Supplementary Table S1 demonstrates the number range of features identified across all loops. Predictive regions/FCs were determined by pulling together all features that appeared in each of the cross-validation loops. To facilitate characterization of the biological substrates underlying functional networks to prediction, we grouped the 116 AAL nodes into seven canonical networks similar to those defined previously in resting-state studies: default mode (DMN), visual, cognitive control (CC), sensorimotor, auditory, cerebellar and subcortical networks (Rashid et al. 2014; Allen et al. 2011). Furthermore, to confirm the predictive power of each individual canonical network, we reran the CPM procedure in two ways: (1) prediction with whole-brain FCs after excluding FCs that appeared in one of the seven canonical networks in turn (Rosenberg et al. 2016); and (2) prediction by restricting the feature selection step in CPM to FCs from each of the seven canonical networks alone (using only within-network edges) (Finn et al. 2015).
Data and code availability
Matlab scripts were written to implement individualized prediction. The code is available from the authors upon request. The data used for prediction in this study can be accessed upon request to the corresponding author.
Results
Individualized prediction
CPM achieved appreciable estimations of IQ scores, using functional connections, cortical thickness or both for males and females respectively (Table 1). Prediction with high-intelligent region in males was absent from our results, because we didn’t detected any positively correlated cortical thickness in males. Notably, combining functional connectivity and cortical thickness further improved prediction accuracy (r[male] = 0.45, p =1.2×10⁻⁹, RMSE= 9.83, NRMSE =0.088; r[female] = 0.45, p = 1.7×10⁻⁹, RMSE= 10.19, NRMSE= 0.094; Fig 2) than using any single modality alone. In addition, predictions remain significant after regressing out age, mean framewise head motion and education years, ruling out these potential confounds (Table 1). Moreover, to determine whether our results were affected by the brain parcellation, we reran the prediction pipeline using FCs based on the 246-node Brainnetome atlas (Fan et al. 2016), and results suggest that using a less fine-grained brain atlas like AAL does not influence our prediction performance (Figure S2).
Table 1.
Prediction results of IQ scores using CPM
| Main results | Ruling out potential confounds | ||||
|---|---|---|---|---|---|
| Males (N = 166) | Female (N = 160) | Males | Females | ||
| Predictive region | Positive | NA | r = 0.20, p = 0.01 | NA | r = 0.20, p = 0.01 |
| Negative | r = 0.29, p = 1.4 × 10 −4 | r = 0.29, p = 2.0 × 10⁻⁴ | r = 0.27, p = 1.6 × 10⁻⁴ | r = 0.28, p = 2.0 × 10⁻⁴ | |
| GLM | r = 0.29, p = 1.4 × 10⁻⁴ | r = 0.36, p = 3.4 × 10⁻⁶ | r = 0.27, p= 1.6× 10⁻⁴ | r = 0.36, p = 2.2 × 10⁻⁶ | |
| Predictive network | Positive | r = 0.28, p= 2.0× 10⁻⁴ | r = 0.28, p = 3.6 × 10⁻⁴ | r = 0.22, p = 3.1 × 10⁻³ | r = 0.27, p = 6.3 × 10⁻⁴ |
| Negative | r = 0.29, p = 1.5 × 10 −4 | r = 0.33, p= 2.0× 10⁻⁵ | r = 0.23, p = 1.3 × 10⁻³ | r = 0.33, p = 4.9 × 10⁻⁵ | |
| GLM | r = 0.34, p = 7.0 × 10⁻⁶ | r = 0.36, p= 1.3× 10⁻⁶ | r = 0.28, p= 1.4× 10⁻⁴ | r = 0.36, p = 1.6 × 10⁻⁶ | |
| Multimodal MRI Data | r = 0.45, p = 1.2 × 10⁻⁹ | r = 0.45, p = 1.7 × 10⁻⁹ | r = 0.39, p = 5.2 × 10⁻⁷ | r = 0.44, p = 1.1 × 10⁻⁸ | |
Fig. 2. Scatter plot of the model-estimated IQ scores with respect to observed values using multimodal neuroimaging features.

When integrating functional connectivity and cortical thickness features together as input for CPM, Pearson’s correlations of r[male] = 0.45 (p = 1.2 × 10⁻⁹) and r[female] = 0.45 (p = 1.7 × 10⁻⁹) between predicted and observed IQ scores were achieved for males and females respectively. All values were standardized to z-scores for visualization
Additionally, CPM also achieved comparable prediction accuracy when reran the prediction procedure by restricting the analysis to only subjects with IQ scores ≥85 (Table S2). Figure S3 demonstrated the prediction results for all subjects.
IQ-predictive brain regions and functional networks
For males, the low-intelligent regions encompass 258 features located exactly in two regions: the left inferior parietal lobule (IPL) and right precuneus (Fig. 3a). While for females, CPM reveals 284 positively correlated features (high-intelligent region) concentrated primarily in the right insula, right superior temporal gyrus (STG), and the right inferior frontal gyrus; and 444 negatively correlated features (low-intelligent region) distributed across the right IPL, right precuneus extending to the left caudal middle frontal cortex (Fig. 3b). Together, these represented <0.6% of the total 81924 possible features (Table S1). Specifically, for females, 93.54% of all the identified features were located in the right brain. For males, 63.2% of all 258 features were located in the left brain (Table S3). Regarding the consensus features (appear in every iteration of the cross-validation, with a 100% identification rate), all GM features from females were located in the right brain, while all GM features from males were located in the left brain (Table S4).
Fig. 3. Brain regions and functional connections predicting IQ scores for males and females.
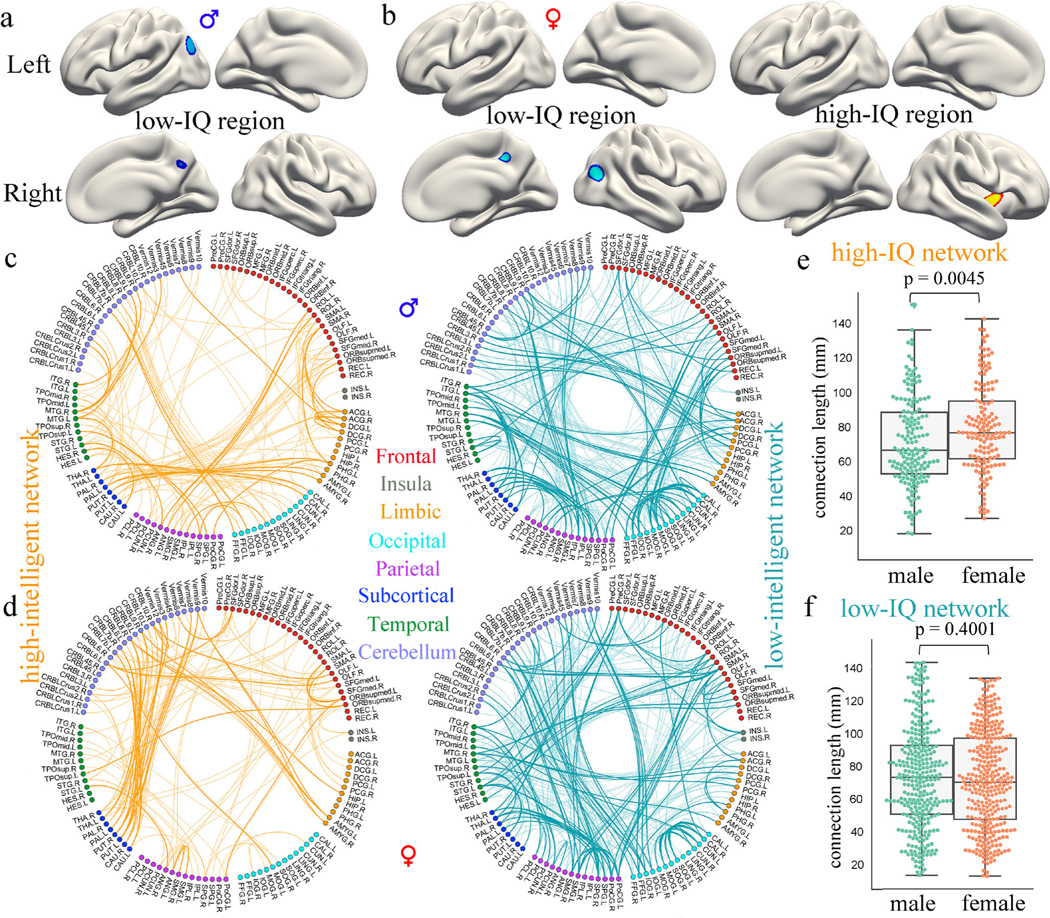
For males, CPM identified 258 features in the low-intelligent region (a), 162 connections in the high-intelligent network, and 309 connections in the low-intelligent network (c). For females, a respective 284 and 444 features were encompassed in the high-intelligent and low-intelligent regions (b), while 145 and 329 edges were encompassed in the high-intelligent and low-intelligent networks (d). As demonstrated in the circle figure, the 116 functional nodes are grouped into eight AAL-defined macroscale brain regions according to their lobe locations. Edges in the high-intelligent network are colored in orange, while connections in the low-intelligent network are colored in blue. Edges that appear in every iteration of the LOOCV (a 100% identification rate) are visualized in bold. (e). Functional connections of females in the high-intelligent network were significantly longer in anatomical vector distance than those of males. (f). There was no difference in the length of connections in the low-intelligent network between males and females
With regard to FCs, the high-intelligent network comprises 162 edges, and the low-intelligent network comprises 309 edges in males (Fig 3c). Anatomically, the top 5 nodes showing the highest degree (i.e. the total number of connected FCs identified across all cross-validation loops) in the high-intelligent network were the left parahippocampal gyrus (PHG), right middle temporal gyrus, left anterior cingulum, and left/right middle cingulum, which are primarily hubs of DMN and cognitive control network; while the top 5 nodes in the low-intelligent network were the right superior parietal lobule, right inferior temporal gyrus, left calcarine, left middle occipital gyrus and left fusiform, spanning primarily sensorimotor and visual networks (Fig. 4a). For females, 145 and 329 edges were detected in the positive and negative networks separately (Fig. 3d). Anatomically, the top 5 most important nodes in the high-intelligent network were the left putamen, right cerebellar VIII, left medial orbital part of superior frontal gyrus, left vermis IX, and right putamen, predominantly corresponding to core hubs of the cognitive control and cerebellar network; the top 5 nodes in the low-intelligent network pre-dominantly concentrated in the sensorimotor network comprising the left/right postcentral, right supplementary motor area, right superior parietal lobule, and the right precentral gyrus (Fig. 4b). Collectively, these accounted for <5% of the brain’s 6670 total edges. Degrees of all 116 AAL nodes for males and females can be found in Table S5 and S6. Additionally, detailed information of the consensus FCs (Fig. 3c, d, in bold edge) (R. Jiang et al. 2018; Dosenbach et al. 2010) and their correlations with IQ scores can be found in Table S7 and S8. Moreover, functional connections of females (mean length 79.76 mm) in the high-intelligent network were significantly longer (p=0.0045) in anatomical vector distance than these of males (mean length 71.37 mm), while there was no significant difference in the length of functional connections in the low-intelligent network between them (Fig. 3e, f, Table S9). The IQ-predictive GM regions and functional connections derived from subjects with IQs≥85 were very similar to those derived from all subjects (Table S2 and Figure S4). Additionally, predictive GM regions and functional connections derived from all subjects can be found in Table S3 and Figure S5.
Fig. 4. Functional nodes in the high-intelligent and low-intelligent networks.

To facilitate characterization, we grouped the 116 nodes defined in AAL into seven canonical networks that were defined previously in resting-state studies: default mode (DMN), visual (VIS), cognitive control (CC), sensorimotor (SM), auditory (AUD), cerebellar (CB) and subcortical network (SC). The node size denotes degree, which represents the number of connected functional connections identified in the prediction procedure across all cross-validation loops
Separately evaluating the importance of each canonical network, we found that prediction in females was insignificant in only one case—when CPM was performed on whole-brain FCs excluding the cerebellar edges in the high-intelligent network (r[-CB] = −0.03, p = 0.74). For males, excluding either DMN or CC edges in the high-intelligent network generated insignificant predictions (r[-DMN] = 0.12, p =0.11; r[-CC] = 0.13, p =0.11). By contrast, all predictions remain significant in the low-intelligent network when excluding edges in any of the seven networks. Interestingly, CPM achieved consistent results when predicting using only within-network edges from each of the seven canonical networks. Specifically, predictive model based on the positive network was highlighted with the most contribution for the cerebellar network in females (r[CB] = 0.36, p =3.4×10⁻⁶), and the DMN in males (r[DMN] = 0.17, p =0.03). Negative features in all seven networks yielded attenuated prediction performance, with the visual network emerged as the most predictive one for both males (r[VIS] = 0.26, p =52.×10−4) and females (r[VIS] = 0.26, p =6.7×10⁻⁴) (Table 2).
Table 2.
The importance of each canonical network in IQ prediction
| Females (N = 160) | Males (N = 166) | ||||
|---|---|---|---|---|---|
| Positive network | Negative network | Positive network | Negative network | ||
| Whole-brain networks | r = 0.28, p= 3.6× 10⁻⁴ | r = 0.33, p = 2.0 × 10⁻⁵ | r = 0.28, p = 0.008 | r = 0.29, p = 1.7 × 10⁻⁵ | |
| Excluded network | -Sensorimotor | r = 0.30, p= 1.1 × 10⁻⁴ | r = 0.32, p = 4.6 × 10⁻⁵ | r = 0.16, p = 0.04 | r = 0.29, p = 1.1 × 10⁻⁴ |
| -Visual | r = 0.28, p = 3.6 × 10⁻⁴ | r = 0.28, p = 4.5 × 10⁻⁴ | r = 0.29, p = 1.2 × 10⁻⁴ | r = 0.24, p = 1.6 × 10⁻³ | |
| -Auditory | r = 0.29, p = 1.9 × 10⁻⁴ | r = 0.34, p = 1.4 × 10⁻⁵ | r = 0.18, p = 0.02 | r = 0.30, p = 6.9 × 10⁻⁵ | |
| -Cognitive control | r = 0.29, p = 1.9 × 10⁻⁴ | r = 0.36, p= 3.6× 10⁻⁶ | r = 0.12, p = 0.11 | r = 0.30, p = 6.8 × 10⁻⁵ | |
| -Default mode | r = 0.29, p= 1.9 × 10⁻⁴ | r = 0.34, p= 1.1× 10⁻⁶ | r = 0.13, p= 0.11 | r = 0.33, p = 9.1 × 10⁻⁶ | |
| -Subcortical | r = 0.19, p = 0.015 | r = 0.33, p= 1.5× 10⁻⁵ | r = 0.20, p = 8.5 × 10⁻³ | r = 0.31, p = 5.9 × 10⁻⁵ | |
| -Cerebellar | r = −0.03, p = 0.74 | r = 0.34, p = 8.8 × 10⁻⁶ | r = 0.17, p = 0.03 | r = 0.36, p = 6.8 × 10⁻⁶ | |
| Included network | +Sensorimotor | r = 0.07, p = 0.36 | r = 0.25, p= 1.9× 10⁻³ | r = 0.15, p = 0.05 | r = 0.22, p = 4.0 × 10⁻³ |
| +Visual | r = −0.05, p = 0.54 | r = 0.26, p = 6.7 × 10⁻⁴ | r = −0.03, p = 0.64 | r = 0.26, p = 5.2 × 10⁻⁴ | |
| +Auditory | r = 0.23, p = 3.4 × 10⁻³ | r = 0.11, p = 0.17 | r = 0.12, p = 0.12 | r = 0.04, p = 0.62 | |
| +Cognitive control | r = −0.11, p = 0.17 | r = 0.14, p = 0.07 | r = 0.04, p = 0.61 | r = 0.17, p = 0.02 | |
| +Default mode | r = 0.16, p= 0.04 | r = 0.24, p = 2.7 × 10⁻³ | r = 0.17, p = 0.03 | r = 0.21, p = 7.0 × 10⁻³ | |
| +Subcortical | r = 0.26, p= 1.1 × 10⁻³ | r = 0.22, p = 5.6 × 10⁻³ | r = 0.05, p = 0.50 | r = 0.16, p = 0.04 | |
| +Cerebellar | r = 0.36, p= 3.4× 10⁻⁶ | r = 0.23, p = 4.3 × 10⁻³ | r = 0.02, p = 0.81 | r = 0.01, p = 0.88 | |
Discussion
Intelligence is a very general capability that accurately predicts various important life outcomes including socioeconomic status and health (Colom et al. 2010). Currently, there is little understanding of how neurobiological correlates of IQ differ between males and females. In the present study, we successfully uncovered the functional and structural correlates of intelligence using CPM for males and females separately, demonstrating that intelligence can be characterized by both the resting-state FCs and cortical thickness. More importantly, we found that intelligence of males and females may be underpinned by different neurobiological substrates, complementing existing work on gender difference of intelligence.
Methodological considerations
CPM is a recently developed method that has been successfully employed to predict multiple cognitive traits like attention (Rosenberg et al. 2016), reading comprehension ability (Jangraw et al. 2018), and creativity (R. E. Beaty et al. 2018) using neuroimaging features of brain connectivity or whole genome genes (Z. Liu et al. 2018). Rather than constraining to specific ROIs, CPM performs a whole-brain data-driven searching for possible neuroimaging features most related to the target cognitive metrics, and uses the strength of these features to generate predictions. It has been demonstrated that CPM performs as well as or better than many of the existing approaches in brain-behavior prediction, and confers an advantage in interpreting the derived predictive neuroimaging features (Shen et al. 2017). However, CPM was mostly applied in FCs previously, with other neuroimaging features limited. For the first time, cortical thickness was adopted as input of CPM in the prediction of cognitive construct. Given that anatomically neighboring cortical features demonstrate similar characteristics and closer relationships, predictive regions derived with CPM in our results are distributed densely on neighboring brain areas, which relates to more biological significance. In contrast to other intensity or volumetric-based GM measures, the thickness of cortex delineates properties in cytoarchitectural aspects of neuropil, including the arrangement and density of neurons, nerve fibers and neuroglia (Narr et al. 2007), which may more closely link with intelligence (Narr et al. 2005). Similar to previous works using CPM (Rosenberg et al. 2016), both of high-intelligent (predicting higher IQ scores) and low-intelligent (predicting lower IQ scores) models generated significant predictions. Generally, FC-based models showed better numerical prediction accuracy, implying that intelligence may be more strongly related to brain function than structure (Song et al. 2008; Choi et al. 2008). More importantly, two types of neuroimaging features were leveraged to implement multimodal prediction, achieving improved prediction accuracy than using any single modality alone, indicating that complementary information can be provided by different modalities (Meng et al. 2017; Sui et al. 2015). Putatively, multimodal data can capitalize on the strength of each imaging modality effectively (Sui et al. 2012; Qi et al. 2018), and holistically uncover the biological substrates underlying intelligence. Correspondingly, in our study, prediction with cortical thickness explored more gender difference in the lateralization of predictive brain regions, while prediction with FCs detected more gender difference in the specification of contributing functional networks.
Gender difference in intelligence-associated brain structures
It has long been recognized that the spatial ability and verbal ability are two core cognitive domains that are consistently reported to exhibit significant sexual dimorphism (Bell et al. 2006). Generally, existing studies converged on an consensus that females commonly outperform males in verbal-related tasks including manual speed, verbal fluency, verbal and item memory, whereas males outperform females in mathematical and visuospatial tasks including mental rotation and logical thinking (Kimura 1996). Consistently, brain regions and functional networks detected in our results are related to males’ and females’ superiority in cognitive domains.
As shown in our results, the neuroanatomy of both high-intelligent and low-intelligent regions concentrates primarily in higher-order association cortices (parietal, prefrontal, and insula cortex), which are similar to brain regions reported in previous investigations of intelligence (Colom et al. 2010). Interestingly, negative correlations between IQ scores and cortical thickness are more pronounced than positive ones in our study. Apparently, this finding may seem a little counterintuitive to the well-recognized central working hypothesis, which attributes more neuronal mass to higher-level cognitive abilities. However, our results are in line with findings on the mechanisms of maturation-induced and learning-induced synaptic plasticity, both of which are associated with an initial increase of synapse number and a subsequent synaptic pruning (Genc et al. 2018; Huttenlocher 1990), a process which can speed up learning and processing, and save resources of network and energy by using less computation to perform tasks (Genc et al. 2018). Speculatively, more intelligent adults may optimize their structural brain network efficiency by employing synaptic pruning (Schnack et al. 2015; Goh et al. 2011).
Apart from the common brain regions appearing in both gender groups, we found significant IQ/cortical thickness correlations in caudal middle frontal and STG in females, but not in males. Our findings are in accordance with the hypothesis that tasks requiring verbal processing and memory involve the participation of frontal-temporal cortical networks (Narr et al. 2007). In addition, the STG, an important part of anterior temporal lobe, is central to the acquisition of long-term lexical memories (Bonner and Price 2013), which contributes greatly to verbal abilities in human. The IPL is reported to participate in language processing, mathematical operations and during cognitive set-shifting tasks. The IPL can be activated in high-intelligent individuals to implement feedback evaluation through an attention-related process (Nejad et al. 2009). Interestingly, the right IPL was reported to participate more in tasks like sensing relationships between body parts, spatial working memory and the recognition of affect (Frederikse et al. 1999). By contrast, the left IPL participated more in cognitive processes concerning spatial perception like motor planning, mental rotation of 3-D objects, time estimation and judgments of speed and position (Frederikse et al. 1999). In support of our findings, (Narr et al. 2007) also reported a negative correlation between IQ scores and cortical thickness in the left IPL in males. Coincidentally, in our study, correlations between cortical thickness in IPL and intelligence were found to be lateralized to the left brain for males, and right for females. However, there are also studies suggesting a functional contribution of the left IPL to social cognition and language tasks (Bzdok et al. 2016). Specifically, Hartwigsen et.al demonstrated that the left angular gyrus, a key part of IPL, participated in the language processing by facilitating speech comprehension in challenging listening conditions (Hartwigsen et al. 2015), which is consistent with the fact that lesions of the left angular gyrus are associated with difficulties in language tasks. Apart from the IPL, most brain regions identified in females were right lateralized. Previous work has suggested that males show dominance of left brain, which is described as more analytical, sequential, logical, detailed, and are excel at logical thinking and numerical computation (Fah 2009; Bonner and Price 2013). In contrast, females tend to use their right brain more efficiently and rely more on intuitive thinking in decision-making (Ingalhalikar et al. 2014).
Gender difference in intelligence-associated brain function
Nodes showing greater degrees in the high-intelligent networks correspond to high-level cognitive networks, such as the DMN and executive control network (ECN), especially for males. Numerous studies have shown that high-level cognitive processes may rely on the dynamic coupling of DMN and ECN (Jung et al. 2013). Specifically, the DMN is responsible for generating ideas in both domain-specific and domain-general tasks including the semantic memory and mental simulation (R. E. Beaty et al. 2018). Then, the ECN contributes to the selection and modification of appropriate response from candidate ideas by evaluating their efficacy (Roger E. Beaty et al. 2016). Different from brain areas derived in the low-intelligent regions, functional nodes showing the highest degrees in the low-intelligent networks are among various primary sensory networks (e.g., visual, auditory and sensorimotor). Previous work has verified the role of these regions in processing procedural (habitual) responses, suggesting that low-creative people might be unable to transcend learned knowledge when attempting to generate novel ideas (R. E. Beaty et al. 2018). A recent study also reported negative associations between these primary sensory regions and creative ability (R. E. Beaty et al. 2018). Given that both creativity and intelligence are high-level cognitions sharing some common mechanisms (Kenett et al. 2018), we thus posit that low-intelligent people may depend more on retrieving previously learned knowledge (Dezfouli and Balleine 2012).
Among all functional nodes in the high-intelligent network, the left PHG exhibits the highest degree for males. The PHG has been studied extensively and been implicated in a variety of spatial analysis-related cognitive tasks like spatial representation, navigation and scene perception (Aminoff et al. 2013). Studies have emphasized an involvement of PHG in learning spatial configurations of objects. Previous evidence for the role of PHG in spatial processing has demonstrated the existence of various types of activity in this region in the processing of scenes and environmental landmarks (Levy et al. 2001; Bar et al. 2006), aspects of spatial memory (Burgess et al. 2001), and spatial navigation (Janzen et al. 2007). In contrast, for females, the left putamen in the high-intelligent network demonstrates the highest degree. As an essential part of the striatum, the putamen is intimately recognized to be crucial for higher cognitive functions like mental flexibility, learning, cognitive control and language processing particularly (Becker et al. 2016). AVBM study indicated that multilinguals are skilled in handling and mastering multiple languages (i.e., articulatory repertoire) primarily by inducing structural plasticity in the left putamen. And compared with monolinguals, multilinguals generally demonstrated higher GM density and activation level in left putamen (Abutalebi et al. 2013). Additionally, neuromodulator studies implied that dopamine transporters availability in caudate and putamen participated in the mediation of intelligence (Grazioplene et al. 2015). Specially, females performed better on verbal learning tasks, which may be due to their higher dopamine availability in striatum.
Notably, among all brain networks, the cerebellar network contributes the most to IQ prediction for females. Traditionally, the cerebellum is considered to participate in the coordination and regulation of somatic and autonomic motor tasks (Manto et al. 2012). However, a paper reviewed advances in functional and structural neuroimaging findings of the cerebellum, as well as evidence from neuropsychological and neurophysiological investigations (Murdoch 2010), and concluded that the cerebellum also participated in mediation of a wealthy of cognitive functions, especially language processing such as syntax, verbal fluency, word retrieval, reading and writing (Mariën et al. 2014). Correspondingly, many clinical studies showed that patients with cerebellar pathology exhibited various types of impairments in linguistic functions (Murdoch 2010). Moreover, a meta-analysis study provided support for the participation of cerebellum in cognition, suggesting that both cognitive tasks of language processing and verbal working memory employed overlapped cerebellar regions (Stoodley and Schmahmann 2009). Likewise, another study posited that the cerebellum participates in verbal working memory through two separate processes: articulatory rehearsal which involves a cerebello-frontal circuit, and the storage of information which involves a cerebello-parietal loop (Chen and Desmond 2005; Stoodley and Schmahmann 2009). Moreover, a recent fMRI study employing tools from network theory reported that both males and females have the small-worldness characteristics, but females show higher neural network efficiency in cerebellum, especially for higher-intelligence females (Pezoulas et al. 2017). Putatively, this configuration maximizes the efficiency and reduces the costs of information transfer, signifying that the network organization in females is more efficient. Moreover, longer functional connections distance for females in the high-intelligent network may reflect more myelination and functional integration between distant regions (Fair et al. 2007), which can facilitate efficient interareal communication (van den Heuvel and Sporns 2011), and consequently afford more pronounced positively correlated cortical thickness.
Limitations and future directions
Some issues relating to the current study need to be mentioned. First, gender differences in intelligence were discussed primarily around the verbal and nonverbal aspects, however, no significant differences were observed in verbal domains of intelligence test between them in our data. It may be due to the great homogeneity of our current samples. Participants in the study are all young college students with a limited age range (19 to 24 years) for whom higher intellectual capacity than average were likely achieved. Although homogeneous samples can rule out a number of potential confounds, such samples are typically not representative of the broader population. Moreover, it has been reported that age exerted an important confound on both the intelligence level and cortical development (Schnack et al. 2015; Narr et al. 2007). Studies consist of subjects with more heterogeneous properties warrant further consideration, and generalization of the current results should be evaluated in external cohorts. The gender difference in intelligence can also be interpreted from other aspects in the future. Third, since integrating cortical thickness and resting-state FC achieved improved prediction performance, other types of neuroimaging features including GM volume, fractional anisotropy and dynamic FC characteristics (Zhi et al. 2018) can also be adopted for prediction in the context of multimodal fusion in the future. Additionally, future study can employ fine-grained brain parcellations that divide the human brain into well-defined functional networks (Power et al. 2011), which may confer more biological significance.
Conclusions
In this study, we built a connectome-based IQ-prediction procedure based on solid cross-validation by integrating multi-modal neuroimaging data, which complements existing work on individualized prediction in human intelligence. Moreover, we identified and compared the gender-different imaging biomarkers that may predict other individuals’ educational or health outcomes (Gabrieli et al. 2015). More importantly, we found that intelligence of males and females were underpinned by different neurobiological correlates. Specifically, males IQ demonstrated closer correlations with cortical thickness in the left IPL, and with functional connectivity in the left PHG and default mode network; whereas female IQ was more correlated with cortical thickness in the right IPL, and with functional connectivity linking left putamen and within the cerebellar networks, which is consistent with their respective superiority in cognitive and behavioral performance (visuospatial processing vs. verbal and memory ability). In summary, better understanding the neuroimaging correlates and gender difference underlying human intelligence may facilitate advancements on unbiased educational or cognitive test design, particularly with regard to popular standardized tests such as the GRE and SAT, which are criticized for showing gender-bias (Hill et al. 2014). Furthermore, females and males can be guided to take advantage of their most efficient cognitive procedure in problem solving (Halpern et al. 2007), which may allow more flexibility and positively impact overall performance.
Supplementary Material
Acknowledgments
This project was supported by China Natural Science Foundation (No. 61773380), Brain Science and Brain-inspired Technology Plan of Beijing City (Z181100001518005), the Strategic Priority Research Program of the Chinese Academy of Sciences (grant No. XDB32040100), the National Institute of Health (1R01EB005846, 1R56MH117107, 1R01MH094524, P20GM103472, P30GM122734), the National Science Foundation (1539067), and National Key R&D Program of China (2017YFC0112000).
Footnotes
Compliance with ethical standards
Conflict of interest The authors report no financial relationships with commercial interests.
Informed consent Informed consent was obtained from all individual participants included in the study.
Ethical approval The current study was approved by the Ethics Committee of Institute of Automation, Chinese Academy of Sciences.
Electronic supplementary material The online version of this article (https://doi.org/10.1007/s11682–019-00146-z) contains supplementary material, which is available to authorized users.
References
- Abutalebi J, Della Rosa PA, Gonzaga AK, Keim R, Costa A, & Perani D (2013). The role of the left putamen in multilingual language production. Brain and Language, 125(3), 307–315. 10.1016/j.bandl.2012.03.009. [DOI] [PubMed] [Google Scholar]
- Allen EA, Erhardt EB, Damaraju E, Gruner W, Segall JM, Silva RF, Havlicek M, Rachakonda S, Fries J, Kalyanam R, Michael AM, Caprihan A, Turner JA, Eichele T, Adelsheim S, Bryan AD, Bustillo J, Clark VP, Feldstein Ewing SW, Filbey F, Ford CC, Hutchison K, Jung RE, Kiehl KA, Kodituwakku P, Komesu YM, Mayer AR, Pearlson GD, Phillips JP, Sadek JR, Stevens M, Teuscher U, Thoma RJ, & Calhoun VD (2011). A baseline for the multivariate comparison of resting-state networks. Frontiers in Systems Neuroscience, 5, 2 10.3389/fnsys.2011.00002. [DOI] [PMC free article] [PubMed] [Google Scholar]
- Aminoff EM, Kveraga K, & Bar M (2013). The role of the parahippocampal cortex in cognition. Trends in Cognitive Sciences, 17(8), 379–390. 10.1016/j.tics.2013.06.009. [DOI] [PMC free article] [PubMed] [Google Scholar]
- Bar M, Gronau N, & Aminoff E (2006). The Parahippocampal cortex mediates spatial and nonspatial associations. Cerebral Cortex, 17(7), 1493–1503. 10.1093/cercor/bhl078 [DOI] [PubMed] [Google Scholar]
- Baron-Cohen S, Knickmeyer RC, & Belmonte MK (2005). Sex differences in the brain: Implications for explaining autism. Science, 310(5749), 819–823. 10.1126/science.1115455. [DOI] [PubMed] [Google Scholar]
- Beaty RE, Benedek M, Silvia PJ, & Schacter DL (2016). Creative cognition and brain network dynamics. Trends in Cognitive Sciences, 20(2), 87–95. 10.1016/j.tics.2015.10.004. [DOI] [PMC free article] [PubMed] [Google Scholar]
- Beaty RE, Kenett YN, Christensen AP, Rosenberg MD, Benedek M, Chen Q, Fink A, Qiu J, Kwapil TR, Kane MJ, & Silvia PJ (2018). Robust prediction of individual creative ability from brain functional connectivity. Proceedings of the National Academy of Sciences of the United States of America, 115, 1087–1092. 10.1073/pnas.1713532115. [DOI] [PMC free article] [PubMed] [Google Scholar]
- Becker L, Kutz D, & Voelcker-Rehage C (2016). Exercise-induced changes in basal ganglia volume and their relation to cognitive performance. J Neurol Neuromed, 1(5), 19–24. 10.29245/2572.942X/2016/5.1044. [DOI] [Google Scholar]
- Bell EC, Willson MC, Wilman AH, Dave S, & Silverstone PH (2006). Males and females differ in brain activation during cognitive tasks. Neuroimage, 30(2), 529–538. 10.1016/j.neuroimage.2005.09.049. [DOI] [PubMed] [Google Scholar]
- Bonner MF, & Price AR (2013). Where is the anterior temporal lobe and what does it do? The Journal of Neuroscience: The Official Journal of the Society for Neuroscience, 33(10), 4213–4215. 10.1523/JNEUROSCI.0041-13.2013. [DOI] [PMC free article] [PubMed] [Google Scholar]
- Burgess N, Maguire EA, Spiers HJ, & O’Keefe J (2001). A temporoparietal and prefrontal network for retrieving the spatial context of lifelike events. Neuroimage, 14(2), 439–453. 10.1006/nimg.2001.0806. [DOI] [PubMed] [Google Scholar]
- Bzdok D, Hartwigsen G, Reid A, Laird AR, Fox PT, & Eickhoff SB (2016). Left inferior parietal lobe engagement in social cognition and language. Neuroscience and Biobehavioral Reviews, 68, 319–334. 10.1016/j.neubiorev.2016.02.024. [DOI] [PMC free article] [PubMed] [Google Scholar]
- Cahill L, Haier RJ, White NS, Fallon J, Kilpatrick L, Lawrence C, Potkin SG, & Alkire MT (2001). Sex-related difference in amygdala activity during emotionally influenced memory storage. Neurobiology of Learning and Memory, 75(1), 1–9. 10.1006/nlme.2000.3999. [DOI] [PubMed] [Google Scholar]
- Chen SH, & Desmond JE (2005). Cerebrocerebellar networks during articulatory rehearsal and verbal working memory tasks. Neuroimage, 24(2), 332–338. 10.1016/j.neuroimage.2004.08.032. [DOI] [PubMed] [Google Scholar]
- Choi YY, Shamosh NA, Cho SH, DeYoung CG, Lee MJ, Lee JM, Kim SI, Cho ZH, Kim K, Gray JR, & Lee KH (2008). Multiple bases of human intelligence revealed by cortical thickness and neural activation. The Journal of Neuroscience, 28(41), 10323–10329. 10.1523/JNEUROSCI.3259-08.2008. [DOI] [PMC free article] [PubMed] [Google Scholar]
- Clements AM, Rimrodt SL, Abel JR, Blankner JG, Mostofsky SH, Pekar JJ, Denckla MB, & Cutting LE (2006). Sex differences in cerebral laterality of language and visuospatial processing. Brain and Language, 98(2), 150–158. 10.1016/j.bandl.2006.04.007. [DOI] [PubMed] [Google Scholar]
- Colom R, Karama S, Jung RE, & Haier RJ (2010). Human intelligence and brain networks. Dialogues in Clinical Neuroscience, 12(4), 489–501. [DOI] [PMC free article] [PubMed] [Google Scholar]
- Cui Y, Liu B, Zhou Y, Fan L, Li J, Zhang Y, Wu H, Hou B, Wang C, Zheng F, Qiu C, Rao LL, Ning Y, Li S, & Jiang T (2016). Genetic effects on fine-grained human cortical regionalization. Cerebral Cortex, 26(9), 3732–3743. 10.1093/cercor/bhv176. [DOI] [PubMed] [Google Scholar]
- Dai XY, Ryan JJ, Paolo AM, & Harrington RG (1990). Factor-Analysis of the Mainland Chinese Version of the Wechsler Adult Intelligence Scale (Wais-Rc) in a Brain-Damaged Sample. International Journal of Neuroscience, 55(2–4), 107–111. 10.3109/00207459008985956. [DOI] [PubMed] [Google Scholar]
- Deary IJ, Penke L, & Johnson W (2010). The neuroscience of human intelligence differences. Nature Reviews. Neuroscience, 11(3), 201–211. 10.1038/nrn2793. [DOI] [PubMed] [Google Scholar]
- Dezfouli A, & Balleine BW (2012). Habits, action sequences and reinforcement learning. The European Journal of Neuroscience, 35(7), 1036–1051. 10.1111/j.1460-9568.2012.08050.x. [DOI] [PMC free article] [PubMed] [Google Scholar]
- Dosenbach NU, Nardos B, Cohen AL, Fair DA, Power JD, Church JA, et al. (2010). Prediction of individual brain maturity using fMRI. Science, 329(5997), 1358–1361. 10.1126/science.1194144. [DOI] [PMC free article] [PubMed] [Google Scholar]
- Fah LY (2009). Logical thinking abilities among form 4 students in the interior division of Sabah, Malaysia. Journal of Science and Mathematics Education in Southeast Asia, 32(2), 161–187. [Google Scholar]
- Fair DA, Dosenbach NUF, Church JA, Cohen AL, Brahmbhatt S, Miezin FM, Barch DM, Raichle ME, Petersen SE, & Schlaggar BL (2007). Development of distinct control networks through segregation and integration. Proceedings of the National Academy of Sciences, 104(33), 13507–13512. 10.1073/pnas.0705843104. [DOI] [PMC free article] [PubMed] [Google Scholar]
- Fan L, Li H, Zhuo J, Zhang Y, Wang J, Chen L, Yang Z, Chu C, Xie S, Laird AR, Fox PT, Eickhoff SB, Yu C, & Jiang T (2016). The human Brainnetome atlas: A new brain atlas based on connectional architecture. Cerebral Cortex, 26(8), 3508–3526. 10.1093/cercor/bhw157. [DOI] [PMC free article] [PubMed] [Google Scholar]
- Feng C, Yuan J, Geng H, Gu R, Zhou H, Wu X, & Luo Y (2018). Individualized prediction of trait narcissism from whole-brain resting-state functional connectivity. Human Brain Mapping, 39, 3701–3712. 10.1002/hbm.24205. [DOI] [PMC free article] [PubMed] [Google Scholar]
- Finn ES, Shen X, Scheinost D, Rosenberg MD, Huang J, Chun MM, Papademetris X, & Constable RT (2015). Functional connectome fingerprinting: Identifying individuals using patterns of brain connectivity. Nature Neuroscience, 18(11), 1664–1671. 10.1038/nn.4135. [DOI] [PMC free article] [PubMed] [Google Scholar]
- Fischl B, & Dale AM (2000). Measuring the thickness of the human cerebral cortex from magnetic resonance images. Proceedings of the National Academy of Sciences, 97(20), 11050–11055. 10.1073/pnas.200033797 [DOI] [PMC free article] [PubMed] [Google Scholar]
- Frederikse ME, Lu A, Aylward E, Barta P, & Pearlson G (1999). Sex differences in the inferior parietal lobule. Cerebral Cortex, 9(8), 896–901. 10.1093/cercor/9.8.896. [DOI] [PubMed] [Google Scholar]
- Gabrieli JD, Ghosh SS, & Whitfield-Gabrieli S (2015). Prediction as a humanitarian and pragmatic contribution from human cognitive neuroscience. Neuron, 85(1), 11–26. 10.1016/j.neuron.2014.10.047. [DOI] [PMC free article] [PubMed] [Google Scholar]
- Genc E, Fraenz C, Schluter C, Friedrich P, Hossiep R, Voelkle MC, et al. (2018). Diffusion markers of dendritic density and arborization in gray matter predict differences in intelligence. Nature Communications, 9(1), 1905 10.1038/s41467-01804268-8. [DOI] [PMC free article] [PubMed] [Google Scholar]
- Glascher J, Rudrauf D, Colom R, Paul LK, Tranel D, Damasio H, & Adolphs R (2010). Distributed neural system for general intelligence revealed by lesion mapping. Proceedings of the National Academy of Sciences of the United States of America, 107(10), 4705–4709. 10.1073/pnas.0910397107. [DOI] [PMC free article] [PubMed] [Google Scholar]
- Goh S, Bansal R, Xu D, Hao X, Liu J, & Peterson BS (2011). Neuroanatomical correlates of intellectual ability across the life span. Developmental Cognitive Neuroscience, 1(3), 305–312. 10.1016/j.dcn.2011.03.001. [DOI] [PMC free article] [PubMed] [Google Scholar]
- Goriounova NA, & Mansvelder H. D. J. F. i. H. N. (2019). Genes, Cells and Brain Areas of Intelligence, 13 10.3389/fnhum.2019.00044. [DOI] [PMC free article] [PubMed] [Google Scholar]
- Grazioplene RG, S GR, Gray JR, Rustichini A, Jung RE, & DeYoung CG (2015). Subcortical intelligence: Caudate volume predicts IQ in healthy adults. Human Brain Mapping, 36(4), 1407–1416. 10.1002/hbm.22710. [DOI] [PMC free article] [PubMed] [Google Scholar]
- Greene AS, Gao S, Scheinost D, & Constable RT (2018). Task-induced brain state manipulation improves prediction of individual traits. Nature Communications, 9(1), 2807 10.1038/s41467-018-04920-3. [DOI] [PMC free article] [PubMed] [Google Scholar]
- Haier RJ, Jung RE, Yeo RA, Head K, & Alkire MT (2005). The neuroanatomy of general intelligence: Sex matters. Neuroimage, 25(1), 320–327. 10.1016/j.neuroimage.2004.11.019. [DOI] [PubMed] [Google Scholar]
- Halpern DF, Benbow CP, Geary DC, Gur RC, Hyde JS, & Gernsbacher MA (2007). The science of sex differences in science and mathematics. Psychological Science in the Public Interest, 8(1), 1–51. 10.1111/j.1529-1006.2007.00032.x. [DOI] [PMC free article] [PubMed] [Google Scholar]
- Hartwigsen G, Golombek T, & Obleser J (2015). Repetitive transcranial magnetic stimulation over left angular gyrus modulates the predictability gain in degraded speech comprehension. Cortex, 68, 100–110. 10.1016/j.cortex.2014.08.027. [DOI] [PubMed] [Google Scholar]
- Hill AC, Laird AR, & Robinson JL (2014). Gender differences in working memory networks: A BrainMap meta-analysis. Biological Psychology, 102, 18–29. 10.1016/j.biopsycho.2014.06.008. [DOI] [PMC free article] [PubMed] [Google Scholar]
- Hsu WT, Rosenberg MD, Scheinost D, Constable RT, & Chun MM (2018). Resting-state functional connectivity predicts neuroticism and extraversion in novel individuals. Social Cognitive and Affective Neuroscience, 13(2), 224–232. 10.1093/scan/nsy002. [DOI] [PMC free article] [PubMed] [Google Scholar]
- Huttenlocher PR (1990). Morphometric study of human cerebral cortex development. Neuropsychologia, 28(6), 517–527. 10.1016/0028-3932(90)90031-I. [DOI] [PubMed] [Google Scholar]
- Ingalhalikar M, Smith A, Parker D, Satterthwaite TD, Elliott MA, Ruparel K, Hakonarson H, Gur RE, Gur RC, & Verma R (2014). Sex differences in the structural connectome of the human brain. Proceedings of the National Academy of Sciences of the United States of America, 111(2), 823–828. 10.1073/pnas.1316909110. [DOI] [PMC free article] [PubMed] [Google Scholar]
- Irwing P, & Lynn R (2006). Intelligence: Is there a sex difference in IQ scores? Nature, 442(7098), E1–E1; discussion E2. 10.1038/nature04966. [DOI] [PubMed] [Google Scholar]
- Jangraw DC, Gonzalez-Castillo J, Handwerker DA, Ghane M, Rosenberg MD, Panwar P, & Bandettini PA (2018). A functional connectivity-based neuromarker of sustained attention generalizes to predict recall in a reading task. Neuroimage, 166, 99–109. 10.1016/j.neuroimage.2017.10.019. [DOI] [PMC free article] [PubMed] [Google Scholar]
- Janzen G, Wagensveld B, & van Turennout M (2007). Neural representation of navigational relevance is rapidly induced and long lasting. Cerebral Cortex, 17(4), 975–981. 10.1093/cercor/bhl008. [DOI] [PubMed] [Google Scholar]
- Jensen AR (1998). The g factor: The science of mental ability. 10.1007/BF02685991. [DOI] [Google Scholar]
- Jiang RT, Qi SL, Du YH, Yan WZ, Calhoun VD, Jiang TZ, et al. (2017). Predicting Individualized Intelligence Quotient Scores Using Brainnetome-Atlas Based Functional Connectivity. 2017 Ieee 27th International Workshop on Machine Learning for Signal Processing 10.1109/MLSP.2017.8168150. [DOI] [Google Scholar]
- Jiang R, Calhoun VD, Zuo N, Lin D, Li J, Fan L, Qi S, Sun H, Fu Z, Song M, Jiang T, & Sui J (2018). Connectome-based individualized prediction of temperament trait scores. Neuroimage, 183, 366–374. 10.1016/j.neuroimage.2018.08.038. [DOI] [PubMed] [Google Scholar]
- Jin L, Bing L, Chuansheng C, Yue C, Liqing S, Yun Z, et al. (2015). RAB2A Polymorphism impacts prefrontal morphology, functional connectivity, and working memory. 36(11), 4372–4382. 10.1002/hbm.22924. [DOI] [PMC free article] [PubMed] [Google Scholar]
- Jung RE, & Haier RJ (2007). The Parieto-frontal integration theory (P-FIT) of intelligence: Converging neuroimaging evidence. The Behavioral and Brain Sciences, 30(2), 135–154; discussion 154–187. 10.1017/S0140525X07001185. [DOI] [PubMed] [Google Scholar]
- Jung RE, Mead BS, Carrasco J, & Flores RA (2013). The structure of creative cognition in the human brain. Frontiers in Human Neuroscience, 7, 330 10.3389/fnhum.2013.00330. [DOI] [PMC free article] [PubMed] [Google Scholar]
- Kenett YN, Medaglia JD, Beaty RE, Chen Q, Betzel RF, Thompson-Schill SL, & Qiu J (2018). Driving the brain towards creativity and intelligence: A network control theory analysis. Neuropsychologia, 118, 79–90. 10.1016/j.neuropsychologia.2018.01.001. [DOI] [PMC free article] [PubMed] [Google Scholar]
- Kimura D (1996). Sex, sexual orientation and sex hormones influence human cognitive function. Current Opinion in Neurobiology, 6(2), 259–263. 10.1016/S0959-4388(96)80081-X. [DOI] [PubMed] [Google Scholar]
- Langeslag SJ, Schmidt M, Ghassabian A, Jaddoe VW, Hofman A, van der Lugt A, et al. (2013). Functional connectivity between parietal and frontal brain regions and intelligence in young children: The generation R study. Human Brain Mapping, 34(12), 3299–3307. 10.1002/hbm.22143. [DOI] [PMC free article] [PubMed] [Google Scholar]
- Levy I, Hasson U, Avidan G, Hendler T, & Malach R (2001). Center-periphery organization of human object areas. Nature Neuroscience, 4(5), 533–539. 10.1038/87490. [DOI] [PubMed] [Google Scholar]
- Liu B, Li J, Zhang X, Tao Y, Cui Y, Jiang T, et al. (2016). Polygenic risk for schizophrenia influences cortical Gyrification in 2 independent general populations. Schizophrenia Bulletin, 43(3), 673–680. 10.1093/schbul/sbw051. [DOI] [PMC free article] [PubMed] [Google Scholar]
- Liu Z, Zhang J, Xie X, Rolls ET, Sun J, Zhang K, Jiao Z, Chen Q, Zhang J, Qiu J, & Feng J (2018). Neural and genetic determinants of creativity. Neuroimage, 174, 164–176. 10.1016/j.neuroimage.2018.02.067. [DOI] [PubMed] [Google Scholar]
- Manto M, Bower JM, Conforto AB, Delgado-Garcia JM, da Guarda SN, Gerwig M, et al. (2012). Consensus paper: Roles of the cerebellum in motor control–the diversity of ideas on cerebellar involvement in movement. Cerebellum, 11(2), 457–487. 10.1007/s12311-011-0331-9. [DOI] [PMC free article] [PubMed] [Google Scholar]
- Mariën P, Ackermann H, Adamaszek M, Barwood CHS, Beaton A, Desmond J, de Witte E, Fawcett AJ, Hertrich I, Küper M, Leggio M, Marvel C, Molinari M, Murdoch BE, Nicolson RI, Schmahmann JD, Stoodley CJ, Thürling M, Timmann D, Wouters E, & Ziegler W (2014). Consensus paper: Language and the cerebellum: An ongoing enigma. Cerebellum (London, England), 13(3), 386–410. 10.1007/s12311-013-0540-5. [DOI] [PMC free article] [PubMed] [Google Scholar]
- Meng X, Jiang R, Lin D, Bustillo J, Jones T, Chen J, Yu Q, du Y, Zhang Y, Jiang T, Sui J, & Calhoun VD (2017). Predicting individualized clinical measures by a generalized prediction framework and multimodal fusion of MRI data. Neuroimage, 145(Pt B), 218–229. 10.1016/j.neuroimage.2016.05.026. [DOI] [PMC free article] [PubMed] [Google Scholar]
- Murdoch BE (2010). The cerebellum and language: Historical perspective and review. Cortex, 46(7), 858–868. 10.1016/j.cortex.2009.07.018. [DOI] [PubMed] [Google Scholar]
- Narr KL, Toga AW, Szeszko P, Thompson PM, Woods RP, Robinson D, Sevy S, Wang YP, Schrock K, & Bilder RM (2005). Cortical thinning in cingulate and occipital cortices in first episode schizophrenia. Biological Psychiatry, 58(1), 32–40. 10.1016/j.biopsych.2005.03.043. [DOI] [PubMed] [Google Scholar]
- Narr KL, Woods RP, Thompson PM, Szeszko P, Robinson D, Dimtcheva T, Gurbani M, Toga AW, & Bilder RM (2007). Relationships between IQ and regional cortical gray matter thickness in healthy adults. Cerebral Cortex, 17(9), 2163–2171. 10.1093/cercor/bhl125. [DOI] [PubMed] [Google Scholar]
- Nejad AB, Jiang J, Zhisheng K, Salleh SR, Manning V, Graham S, et al. (2009). IQ-related fMRI differences during cognitive set shifting. Cerebral Cortex, 20(3), 641–649. 10.1093/cercor/bhp130. [DOI] [PMC free article] [PubMed] [Google Scholar]
- Pezoulas VC, Zervakis M, Michelogiannis S, & Klados MA (2017). Resting-state functional connectivity and network analysis of cerebellum with respect to crystallized IQ and gender. Frontiers in Human Neuroscience, 11, 189 10.3389/fnhum.2017.00189. [DOI] [PMC free article] [PubMed] [Google Scholar]
- Power JD, Cohen AL, Nelson SM, Wig GS, Barnes KA, Church JA, Vogel AC, Laumann TO, Miezin FM, Schlaggar BL, & Petersen SE (2011). Functional network organization of the human brain. Neuron, 72(4), 665–678. 10.1016/j.neuron.2011.09.006. [DOI] [PMC free article] [PubMed] [Google Scholar]
- Qi S, Yang X, Zhao L, Calhoun VD, Perrone-Bizzozero N, Liu S, Jiang R, Jiang T, Sui J, & Ma X (2018). MicroRNA132 associated multimodal neuroimaging patterns in unmedicated major depressive disorder. Brain, 141, 916–926. 10.1093/brain/awx366. [DOI] [PMC free article] [PubMed] [Google Scholar]
- Rashid B, Damaraju E, Pearlson GD, & Calhoun VD (2014). Dynamic connectivity states estimated from resting fMRI identify differences among schizophrenia, bipolar disorder, and healthy control subjects. Frontiers in Human Neuroscience, 8, 897 10.3389/fnhum.2014.00897. [DOI] [PMC free article] [PubMed] [Google Scholar]
- Rosenberg MD, Finn ES, Scheinost D, Papademetris X, Shen X, Constable RT, & Chun MM (2016). A neuromarker of sustained attention from whole-brain functional connectivity. Nature Neuroscience, 19(1), 165–171. 10.1038/nn.4179. [DOI] [PMC free article] [PubMed] [Google Scholar]
- Ryman SG, Yeo RA, Witkiewitz K, Vakhtin AA, van den Heuvel M, de Reus M, Flores RA, Wertz CR, & Jung RE (2016). Fronto-parietal gray matter and white matter efficiency differentially predict intelligence in males and females. Human Brain Mapping, 37(11), 4006–4016. 10.1002/hbm.23291. [DOI] [PMC free article] [PubMed] [Google Scholar]
- Schmithorst VJ, & Holland SK (2006). Functional MRI evidence for disparate developmental processes underlying intelligence in boys and girls. Neuroimage, 31(3), 1366–1379. 10.1016/j.neuroimage.2006.01.010. [DOI] [PubMed] [Google Scholar]
- Schmithorst VJ, & Holland SK (2007). Sex differences in the development of neuroanatomical functional connectivity underlying intelligence found using Bayesian connectivity analysis. Neuroimage, 35(1), 406–419. 10.1016/j.neuroimage.2006.11.046. [DOI] [PMC free article] [PubMed] [Google Scholar]
- Schnack HG, van Haren NE, Brouwer RM, Evans A, Durston S, Boomsma DI, et al. (2015). Changes in thickness and surface area of the human cortex and their relationship with intelligence. Cerebral Cortex, 25(6), 1608–1617. 10.1093/cercor/bht357. [DOI] [PubMed] [Google Scholar]
- Shen X, Finn ES, Scheinost D, Rosenberg MD, Chun MM, Papademetris X, & Constable RT (2017). Using connectome-based predictive modeling to predict individual behavior from brain connectivity. [protocol]. Nature Protocols, 12(3), 506–518. 10.1038/nprot.2016.178. [DOI] [PMC free article] [PubMed] [Google Scholar]
- Song M, Zhou Y, Li J, Liu Y, Tian L, Yu C, & Jiang T (2008). Brain spontaneous functional connectivity and intelligence. Neuroimage, 41(3), 1168–1176. 10.1016/j.neuroimage.2008.02.036. [DOI] [PubMed] [Google Scholar]
- Stoodley CJ, & Schmahmann JD (2009). Functional topography in the human cerebellum: A meta-analysis of neuroimaging studies. Neuroimage, 44(2), 489–501. 10.1016/j.neuroimage.2008.08.039. [DOI] [PubMed] [Google Scholar]
- Sui J, Adali T, Yu Q, Chen J, & Calhoun VD (2012). A review of multivariate methods for multimodal fusion of brain imaging data. Journal of Neuroscience Methods, 204(1), 68–81. 10.1016/j.jneumeth.2011.10.031. [DOI] [PMC free article] [PubMed] [Google Scholar]
- Sui J, Pearlson GD, Du Y, Yu Q, Jones TR, Chen J, et al. (2015). In search of multimodal neuroimaging biomarkers of cognitive deficits in schizophrenia. Biological Psychiatry, 78(11), 794–804. 10.1016/j.biopsych.2015.02.017. [DOI] [PMC free article] [PubMed] [Google Scholar]
- Sui J, Qi S, van Erp TGM, Bustillo J, Jiang R, Lin D, Turner JA, Damaraju E, Mayer AR, Cui Y, Fu Z, du Y, Chen J, Potkin SG, Preda A, Mathalon DH, Ford JM, Voyvodic J, Mueller BA, Belger A, McEwen SC, O’Leary DS, McMahon A, Jiang T, & Calhoun VD (2018). Multimodal neuromarkers in schizophrenia via cognition-guided MRI fusion. Nature Communications, 9(1), 3028 10.1038/s41467-018-05432-w. [DOI] [PMC free article] [PubMed] [Google Scholar]
- Tomasi D, & Volkow ND (2012). Laterality patterns of brain functional connectivity: Gender effects. Cerebral Cortex, 22(6), 1455–1462. 10.1093/cercor/bhr230. [DOI] [PMC free article] [PubMed] [Google Scholar]
- Tzourio-Mazoyer N, Landeau B, Papathanassiou D, Crivello F, Etard O, Delcroix N, Mazoyer B, & Joliot M (2002). Automated anatomical labeling of activations in SPM using a macroscopic anatomical parcellation of the MNI MRI single-subject brain. Neuroimage, 15(1), 273–289. 10.1006/nimg.2001.0978. [DOI] [PubMed] [Google Scholar]
- Vakhtin AA, Ryman SG, Flores RA, & Jung RE (2014). Functional brain networks contributing to the Parieto-frontal integration theory of intelligence. Neuroimage, 103, 349–354. 10.1016/j.neuroimage.2014.09.055. [DOI] [PubMed] [Google Scholar]
- van den Heuvel MP, & Sporns O (2011). Rich-club organization of the human connectome. The Journal of Neuroscience, 31(44), 15775–15786. 10.1523/JNEUROSCI.3539-11.2011. [DOI] [PMC free article] [PubMed] [Google Scholar]
- Wechsler D (1981). WAIS-R manual: Wechsler adult intelligence scale-revised: Psychological Corporation. [Google Scholar]
- Yan C, Gong G, Wang J, Wang D, Liu D, Zhu C, Chen ZJ, Evans A, Zang Y, & He Y (2011). Sex- and brain size-related small-world structural cortical networks in young adults: A DTI tractography study. Cerebral Cortex, 21(2), 449–458. 10.1093/cercor/bhq111. [DOI] [PubMed] [Google Scholar]
- Yip SW, Scheinost D, Potenza MN, & Carroll KM (2019). Connectome-based prediction of cocaine abstinence. American Journal of Psychiatry, 176(2), 156–164. 10.1176/appi.ajp.2018.17101147. [DOI] [PMC free article] [PubMed] [Google Scholar]
- Zhang X, Yu J-T, Li J, Wang C, Tan L, Liu B, & Jiang T (2015). Bridging integrator 1 (BIN1) genotype effects on working memory, hippocampal volume, and functional connectivity in young healthy individuals. Neuropsychopharmacology, 40(7), 1794–1803. 10.1038/npp.2015.30. [DOI] [PMC free article] [PubMed] [Google Scholar]
- Zhi D, Calhoun VD, Lv L, Ma X, Ke Q, Fu Z, du Y, Yang Y, Yang X, Pan M, Qi S, Jiang R, Yu Q, & Sui J (2018). Aberrant dynamic functional network connectivity and graph properties in major depressive disorder. Frontiers in Psychiatry, 9, 339 10.3389/fpsyt.2018.00339. [DOI] [PMC free article] [PubMed] [Google Scholar]
Associated Data
This section collects any data citations, data availability statements, or supplementary materials included in this article.
Supplementary Materials
Data Availability Statement
Matlab scripts were written to implement individualized prediction. The code is available from the authors upon request. The data used for prediction in this study can be accessed upon request to the corresponding author.