Abstract
Decellularized nerve, or acellular nerve allografts (ANAs), are an increasingly used alternative to nerve autografts to repair nerve gaps to facilitate regeneration. The adaptive immune system, specifically T cells, plays a role in promoting regeneration upon these ANA scaffolds. However, how T cells promote regeneration across ANAs is not clear. Here, we show that T cells accumulate within ANAs repairing nerve gaps resulting in regulation of cytokine expression within the ANA environment. This in turn ultimately leads to robust nerve regeneration and functional recovery. Nerve regeneration across ANAs and functional recovery in Rag1KO mice was limited compared to wild-type (WT) mice. Prior to appreciable nerve regeneration, ANAs from Rag1KO mice contained fewer eosinophils and reduced IL-4 expression compared to ANAs from WT mice. During this period, both T cells and eosinophils regulated IL-4 expression within ANAs. Eosinophils represented the majority of IL-4 expressing cells within ANAs, while T cells regulated IL-4 expression. Finally, an essential role for IL-4 during nerve regeneration across ANAs was confirmed as nerves repaired using ANAs had reduced regeneration in IL-4 KO mice compared to WT mice. Our data demonstrate T cells regulate the expression of IL-4 within the ANA environment via their effects on eosinophils.
Keywords: Regeneration, T cells, IL-4, acellular nerve allograft, myelination
1. Introduction
Severe damage to a nerve often results in a gap requiring repair of the nerve ends with a material to “bridge” the proximal to distal nerve ends [1]. Alternatives, consisting of various biomaterials, have increasingly been used to repair these nerve gaps. Clinically, decellularized nerve in the form of acellular nerve allografts (ANAs) are a now prominently used biomaterial [2]. However, review of the clinical literature using currently available biomaterials, including ANAs, for nerve repair finds that these materials still yield inadequate and inconsistent functional recovery compared to autografts [3]. To rationally develop improved biomaterials, a better understanding of the underlying biology that drives regeneration upon scaffolds is needed.
The immune system is emerging as a critical component for regeneration. For example, following muscle injury, T cells were critical to the repair of functional muscle upon a variety of scaffolds repairing these injuries [4]. Similar, we recently demonstrated that T cells are critical in the context of nerve regeneration upon scaffolds bridging a nerve gap. T cells accumulated within short ANAs that promoted robust nerve regeneration and functional recovery. Conversely, ANAs of longer length, which poorly promoted axon regeneration, accumulated few T cells during ongoing regeneration. Furthermore, a T cell deficiency reduced regeneration across even short ANAs [5]. While we showed a role for T cells during nerve repair with ANAs, how T cells promote nerve regeneration across these scaffolds was not considered.
T cells may promote regeneration via regulation of cytokines [6,7]. Interleukin-4 (IL-4) has increasingly been shown to be an important cytokine regulating the immune response following scaffold implantation, where it contributes to robust regeneration [8]. In our previous studies considering the role of T cells in regeneration across ANAs, ANAs which contained fewer T cells also contained lower gene expression of select cytokines, such as IL-4, suggesting T cells and IL-4 levels in ANAs may be linked [5]. However, mechanistic studies are needed to determine the nature of this link. While T cells and eosinophils are two important cell types known to express high levels of IL-4 [9,10], Schwann cells have also been hypothesized to be sources of IL-4 in nerve [11]. The cells expressing IL-4, and how it is regulated, during scaffold mediated nerve regeneration is critical to ascertain.
Despite evidence that exogenous IL-4 promotes tissue regeneration through scaffolds, the contributions of endogenous IL-4 to successful nerve regeneration are unclear. In our previous studies, ANAs containing fewer T cells and IL-4 levels also contained SCs expressing lower levels of myelination related genes [5]. Thus, our data suggests a link between myelination and IL-4, whereby IL-4 may promote myelination, critical to regeneration and functional recovery [12–14]. Thus, examining how endogenous IL-4 contributes to regeneration could also yield insights as to what factors are needed to promote robust functional recovery across biomaterials.
Therefore, we undertook experiments to further delineate the role of T cells on nerve regeneration ANAs, using ANAs as an example of one of many biomaterials for nerve repair. We specifically considered whether T cells had a role in IL-4 regulation within the ANA. And, based on those results, we also asked if IL-4 signaling contributed to specific aspects of nerve regeneration across an ANA, including nerve myelination and functional recovery.
2. Materials and Methods
2.1. Animals and experimental design
Commercially-available adult mice (20-25g, Jackson Laboratories, Bar Harbor, ME) were utilized for all experiments. Wild-type (WT; C57BL/6J, total 65), Rag1KO ( JAX #002216 [15], total 26), IL-4/GFP-enhanced transcript (4Get) ( JAX #004190 [16], total 23), and IL-4KO ( JAX #002253 [17], total 10). Randomized C57BL/6J mice were used as donor mice to derive ANAs. Procedures were conducted in compliance with the AAALAC accredited Washington University Institutional Animal Care and Use Committee (IACUC) and the National Institutes of Health guidelines. All animals were housed in a central animal care facility and provided with food (PicoLab rodent diet 20, Purina Mills Nutrition International, St. Louis, MO) and water ad libitum.
2.2. Surgical procedures
Mice were anesthesized using a cocktail of ketamine (100 mg/kg; Fort Dodge Animal Health, Fort Dodge, IA) and dexmedetomidine (0.5 mg/kg; Pfizer Animal Health, Exton, PA). For mice serving as ANA donors, following euthanization, their sciatic nerves were transected proximally at the level of exiting nerve roots, and distally just beyond the sciatic trifurcation. In experimental mice receiving the ANAs, the right sciatic nerve was exposed and transected 5 mm proximal to the distal trifurcation. ANAs were reverse oriented (distal end of donor graft facing proximal nerve stump of recipient) sutured into the nerve gap with 11-0 nylon microsutures (Sharpoint, Reading, PA). A two-layer closure of muscle and skin was performed using 6-0 vicryl and 4-0 nylon suture, respectively. Atipamezole solution (0.1mg/kg; Zoetis, Florham Park, NJ) was administered for anesthesia reversal. The animals were recovered on a warming pad and monitored for postoperative complications before returning them to a central animal care facility. Postoperative pain was managed using Buprenorphine SR™ (0.05 mg/kg; ZooPharm, Windsor, CO). Animals were monitored daily post-operatively for signs of infection and/or distress. At the appropriate endpoints, animals were euthanized via cervical dislocation under anesthesia, and their tissues collected for respective studies (see below).
2.3. ANA processing
ANAs were decellularized using a modified series of detergents in the method described previously [18]. Briefly, to prepare these ANAs, nerves were isolated from donor animals and repeatedly washed in deionized water. Then, a series of three detergents in a sodium phosphate buffer were used to decellularize the nerve consisting of: Triton X-100, sulfobetaine-16 (SB-16), and sulfobetaine-10 (SB-10). All grafts were washed and stored in 10 mM phosphate-buffered 50 mM sodium solution at 4°C and used within 3 days.
2.4. Antibody-mediated depletion of T cells or IL-4 neutralization in vivo
In select mice as indicated in the results, CD4 T cells were depleted or IL-4 neutralized of its activity by administration of neutralizing antibodies (Bio X Cell, Lebanon, NH). Seven days following surgery, to allow for recovery following surgery, rat anti-mouse CD4 antibody (clone GK1.5) or its corresponding control isotype (clone LTF-2), or rat anti-mouse IL-4 antibody (clone 11B11) or its corresponding control isotype (clone TNP6A7), were given intraperitoneally once every other day until a 14 day endpoint. Antibody (250 μg) was diluted to 100 μL PBS.
2.5. Immunohistochemistry (IHC) of tissues
To assess cell populations and protein expression within ANAs, nerve samples were explanted at indicated endpoints and immediately placed in 4% paraformaldehyde in PBS overnight followed by immersion in 30% sucrose in PBS solution for 24–48 hours. Samples were frozen in OCT Compound (VWR, Radnor, PA) and sectioned at 15 μm onto pretreated charged glass slides. Sections were rehydrated and blocked using 5% normal goat serum diluted in PBS before primary antibody staining. Primary antibodies were applied overnight and included: T cells (CD3), axons (NF200), Schwann cells (S100), myelin basic protein (MBP), macrophages (CD68, CD206), and eosinophils (Siglec F) (Supplementary Table 1). Sections were then washed in PBS and stained for appropriate secondary antibodies for 1 h at room temperature. All sections were mounted with Fluoroshield mounting medium with DAPI (Abcam, Boston, MA) and then imaged using a Fluoview FV1000 confocal microscope system (Olympus, Waltham, MA) at overall 200x (20x water immersion objective) or 600x magnification (60x oil immersion objective). A minimum of three sections were analyzed and averaged for each tissue area using ImageJ (NIH) to obtain a value for each single animal (n=1). ImageJ macro was used to quantify metrics. The percentage of the area in a standardized field that was positive for the marker was measured. For cell counts, a 600x standardized standard field was used and colocalization of the marker(s) with DAPI was considered a positive cell.
2.6. Flow cytometry of dissociated tissues
To identify and quantify immune cell populations, at the indicated endpoints after surgery, mice were sacrificed and their ANAs, blood (collected via cardiac puncture), or spleen harvested. Nerve tissues and spleen were digested using a cocktail of 1 mL digestion buffer (0.1% collagenase, 0.05% DNase in 2% fetal bovine serum (FBS)/ Dulbeccòs Modified Eagle Media (DMEM)). Samples were incubated for 20 minutes at 37°C with constant agitation, and following digestion, the samples were re-suspended in FACS buffer (2% FBS, 0.1% EDTA in phosphate buffered saline). RBCs were removed when applicable. After filtering through 75 um membrane, cells were incubated with Fc block for 10 minutes followed by an antibody cocktail specific to the cell of interest (Supplemental Table 2) for 1 hour before analysis with flow cytometry using BD Fortessa. At least 500,000 events were acquired for flow cytometry. Data was analyzed using FlowJo. Macrophages were gated by CD45+, CD11b+, CD64+, F4/80+. Eosinophils were gated by CD45+, CD11b+, CD64-, SiglecF+. Neutrophils were gated by CD45+, CD11b+, Ly6G+. T cells were gated by CD45+, CD11b-, CD3+. B cells were gated by CD45+, CD11b-, CD3-, CD19+. Single color stained compensation beads were used as control.
2.7. Gene analysis (qRT-PCR) of cells derived from tissues
To quantify gene expression from all cells within ANAs, total RNA was prepared from ANA explants. RNA was extracted using Trizol (Life Technologies), chloroform and a RNeasy Kit (Qiagen, Valencia, CA) according to manufacturer’s instructions. RNA concentration was determined on a NanoDrop 1000 Spectrophotometer (Thermo Scientific, Wilmington, DE). The cDNA was generated with SuperScript II reverse transcriptase (Invitrogen, Carlsbad, CA). Real-time PCR was performed using a Step One Plus thermocycler (Applied Biosystems, Foster City, CA) using Taqman Master Mix (Applied Biosystems) reagents with specific oligonucleotide primer pairs (Supplemental Table 3). The expression levels of genes were normalized to Actb. Data were analyzed using Step One Software v2.2.2 (Applied Biosystems, Foster City, CA).
2.8. Histology and histomorphometry to assess nerve regeneration
To quantify the extent of nerve regeneration at a 4 week endpoint, histology with histomorphometric analysis of nerve were performed as previously described [19]. At least six random fields per processed and stained histological section of a single animal were imaged by person blinded to groups and averaged. Average nerve fiber density (fibers/mm2) from the fields was used to quantify total number of myelinated fibers based on total nerve fascicular area. The total area imaged and quantified represented greater than half of total area of the cross-section area of nerves. Also from the averaged fields, the average myelinated fiber width (μm2), percent myelinated fiber, and percent myelin debris was calculated. The values for an animal’s experimental nerve thus reflected a single ‘n’ value, despite multiple fields averaged for a given animal nerve.
2.9. Relative muscle mass assessment
Relative gastrocnemius muscle mass was measured as an indication of reinnervation of denervated muscles. After nerve harvest at 4 weeks, muscles were harvested and weighed from experimental and contralateral sides. The ratio of the sides was calculated and reported.
2.10. Whole mount IHC of extensor digitorum muscle (procedures for Figure S2)
To quantify reinnervation of neuromuscular junctions (NMJs), extensor digitorum muscles (EDL) from WT and Rag1KO mice 4 weeks post repair were removed and fixed in 4% paraformaldehyde for 30 minutes. Following overnight incubation in 2% triton, muscles were stained with NF200 (axons), and Alexa-488 conjugated α-bungarotoxin (ThermoFisher, Waltham, MA) for 48 hrs. Specimens were then extensively washed with PBS before staining with secondary antibody for the NF200. Images were acquired on Fluoview FV1000 confocal microscope system. A minimum of three sections were analyzed per muscle and averaged for each tissue area using ImageJ (NIH) to obtain a value for each single animal (n=1). NMJs were considered reinnervated based on colocalization of NF200 and α-bungarotoxin staining, and the percentage of NMJ (α-bungarotoxin) positive for NF200 was reported.
2.11. Behavioral recovery (Grid walk assessment)
Prior to surgery and measured every two weeks until week 8 post-operative, mice underwent a grid walk assessment for functional recovery similar to previous studies [20–22]. Mice were placed on an elevated mesh or grid with a grid size measuring 2.5cm by 2.5cm. After mice have acclimated to the grid for at least 5 mins, they were recorded with a video camera for at least 4 minutes moving upon the grid. From the video considering the injured limb, the total number of steps with that foot and steps that resulted in a foot placement missing the mesh and going through the grid (slipped steps) was measured. Foot fault was calculated as the proportion of slipped steps to total steps.
2.12. Retrograde labeling of motor neurons (procedures for Figure S3)
Two weeks after a sciatic nerve injury without repair in Rag1KO or WT mice, mice underwent a second procedure under anesthesia as described before. The proximal nerve was transected to expose the axoplasm and placed in a silicone gel (Tyco, Mansfield, MA) well to isolate it. The well was filled with 4% Fluoro-Gold in 0.9% saline to immerse the nerve and label it for 30 mins. The dye was then removed, wound irrigated with saline, and the incision closed in 2 layers as before. After 7 days, the animals were euthanized as before and the lumbar region of the spinal cord was removed and placed in 4% paraformaldehyde. After 24 hours, the spinal cords were placed in 30% sucrose until frozen in OCT Compound (VWR) and cut into 30 μm thick longitudinal sections on a cryostat (Leica, Buffalo Grove, IL). The total number of Fluoro-Gold-positive cell nuclei in the lumbar ventral horns from all slides collected from each animal was counted on an Olympus IX81 microscope using both 10X and 20X objectives (100-200X overall magnification) with a DAPI (365nm) filter (Omega Optical, Brattleboro, VT).
2.13. Statistical analysis
Statistical analyses were performed using GraphPad Prism. Each animal was considered an ‘n’ value. All data were compiled as mean ± standard deviation. Data were tested for normality using the Kolmogorov–Smirnov test for N=5 or more. For all others, Shapiro-Wilk test was used. For groups that failed to test for normality (Fig 7A), Mann-Whitney test was performed. For all others, Student’s t test was performed for analysis between 2 groups. Two-way ANOVA with multiple comparison using Sidak’s correction was used for comparison of functional recovery in grid walk. A significance level of p < 0.05 was used in all statistical tests performed.
3. Results
3.1. T cells accumulated within ANAs during ongoing nerve regeneration
T cell (CD3) accumulation within ANAs repairing nerve gaps in WT mice revealed a temporal relationship regarding their accumulation within ANAs. Based on IHC analysis, few CD3 cells accumulated within ANAs by day 10, but CD3 cell numbers increased substantially by day 14, which was sustained through day 18. This accumulation of CD3 cells was specific to the ANA, as CD3 cell accumulation in the distal nerve stump was less than ~33% of those in the ANA throughout all time points examined (Fig. 1A). This CD3 cell accumulation also was correlated with the procession of nerve regeneration across ANAs. At Day 10, limited axons (NF200) and myelin basic protein (MBP) were present. However, from Day 14 onward, axon density and myelination increased (Fig. 1B–C).
Fig 1.
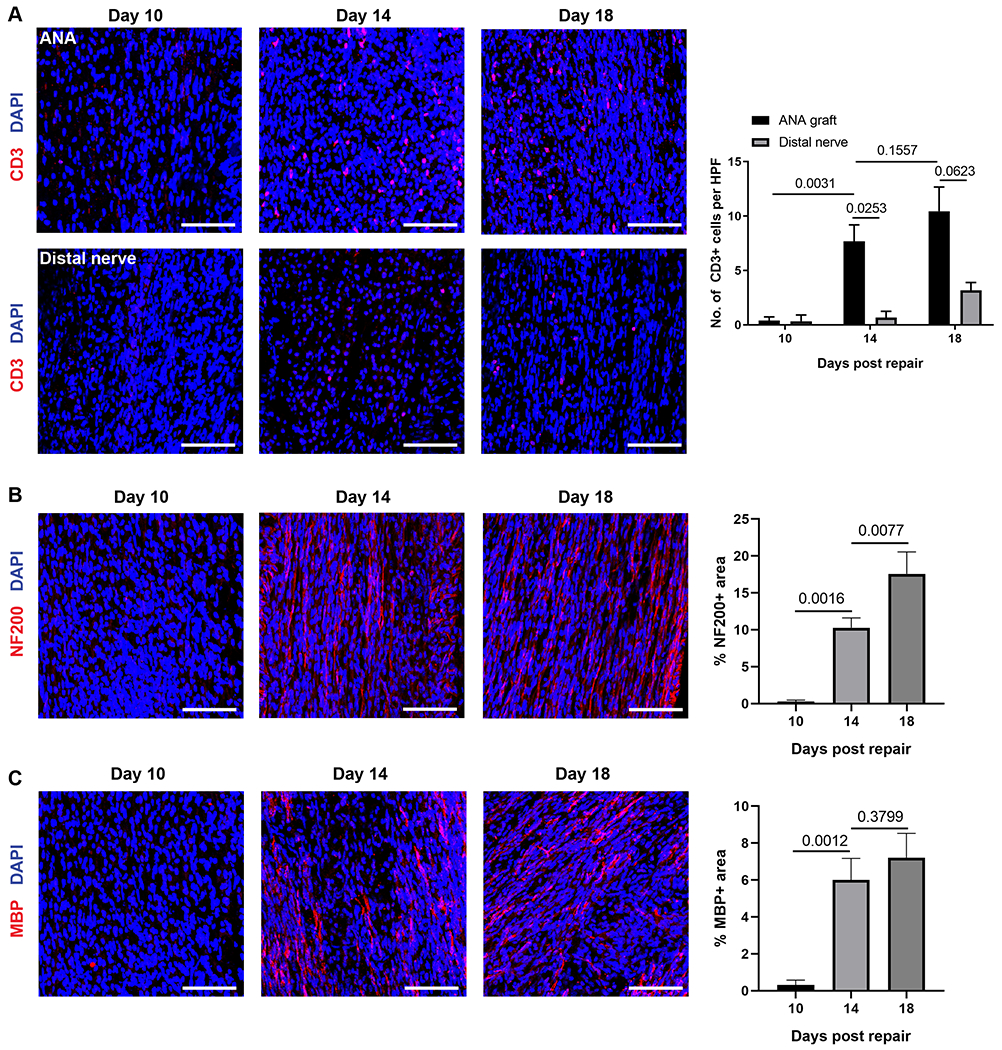
T cells temporally accumulate within ANAs repairing sciatic nerve of WT mice. A) Representative immunofluorescence images of T cells (CD3, red) within ANA and distal nerve at 10, 14, and 18 days after repair with corresponding quantification. B) Representative immunofluorescence images of axons (NF200, red) within ANA and at 10, 14, and 18 days after repair with corresponding quantification. C) Representative immunofluorescence images of myelinated axons (MBP, red) within ANA and at 10, 14, and 18 days after repair with corresponding quantification. Mean ± SD, n=3/group. Scale bar represent 50 μm.
To further characterize the role of T cells and the adaptive immune system during regeneration across ANAs, flow cytometry was used to analyze T cell populations and compare them relative to other leukocytes (CD45 cells) within ANAs. Similar to the results from IHC analysis, the proportion of CD3 cells within ANAs increased over time as regeneration proceeded, where CD3 cell proportions reached ~11% of total CD45 cells within the ANA by day 18 (Fig. 2A). Furthermore, CD4 T cells were present at ~50% higher proportion compared to CD8 T cells after 14 days post repair. Because of the use of Rag1KO mice in future experiments, the extent of B cell (CD19) accumulation within ANAs was also assessed. The proportion of CD19 cells was substantially smaller (<1.5% of CD45 cells; Fig. 2B) compared to CD3 cells at a 14-day endpoint. Since it was revealed that CD3 cell numbers increase locally within ANAs, we also analyzed the proportion of CD3 and CD19 cells in the spleen at this 14-day endpoint to determine if nerve repair using ANAs also affected their systemic cell numbers. However, there was no increase in the proportion of CD3 or CD19 cells in spleen relative to total CD45 cell numbers (Fig. 2C–D). Finally, we examined the proportion of CD3 T cells and CD19 B cells among leukocytes within ANAs and spleen. While CD3 T cells were a larger proportion of all CD45 leukocytes within the ANAs compared to CD19 B cells, the reverse is true in the spleen (Fig. 2E). These results demonstrated that T cells are actively recruited into ANAs during nerve regeneration, where their numbers increase as regeneration proceeds.
Fig 2.
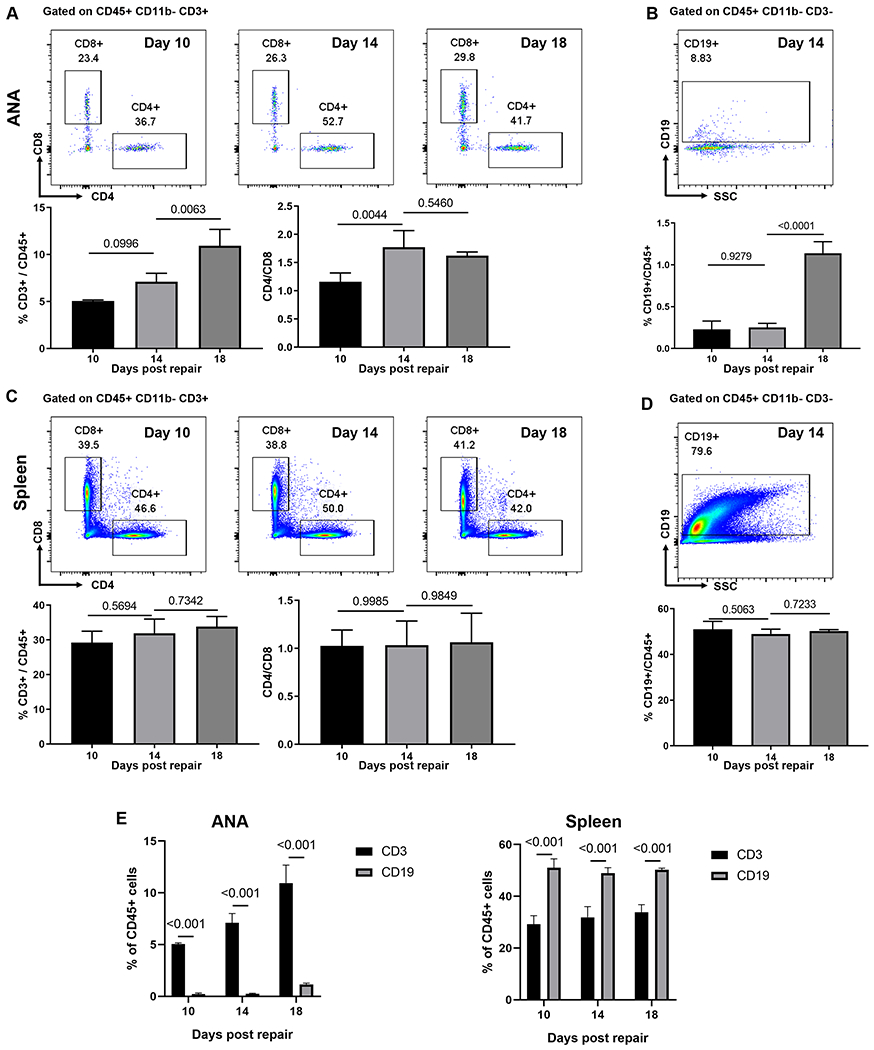
T cells but not B cells accumulate within ANAs. A) Representative flow cytometry analysis for CD4 and CD8 T cells within ANA. Cells were gated on CD45+CD11b−CD3+. Total T cells relative to hematopoietic cells (CD3/CD45) and the proportion of CD4 to CD8 T cells were quantified. B) Representative flow cytometry and quantification of B cells (CD19) within ANA. Cells were gated on CD45+CD11b−CD3−. C) Representative flow cytometry and quantification of CD4 and CD8 T cells from spleen. Cells were gated on CD45+CD11b−CD3+. D) Representative flow cytometry and quantification of B cells from spleen. Cells were gated on CD45+CD11b−CD3−. E) Comparative analysis of CD3 T cells and CD19 B cells as proportion of CD45 cells within ANAs and spleen. . Mean ± SD, n=3/group; p values shown.
3.2. Rag1KO mice have reduced nerve regeneration and recovery across ANAs
Given the influx of T cells into ANAs, we assessed whether T cells contributed to nerve regeneration using Rag1KO mice. Two weeks after ANA repair, Rag1KO had no reduction in initial axon growth into ANAs compared to WT, as revealed by no difference in NF200 areas (Fig. 3A). However, in Rag1KO, almost all of the NF200 axons within ANAs were non-myelinated, as evidenced by the qualitative lack of co-staining with MBP (Fig. 3A). Conversely, WT had robust MBP co-staining with NF200 axons. Consequently, WT ANAs contained increased MBP expression compared to Rag1KO, based on MBP area. We also examined changes in Schwann cells within the ANA and found Rag1KO had reduced S100+ area, suggesting a reduced accumulation of Schwann cells compared to WT (Fig. 3B).
Fig 3.
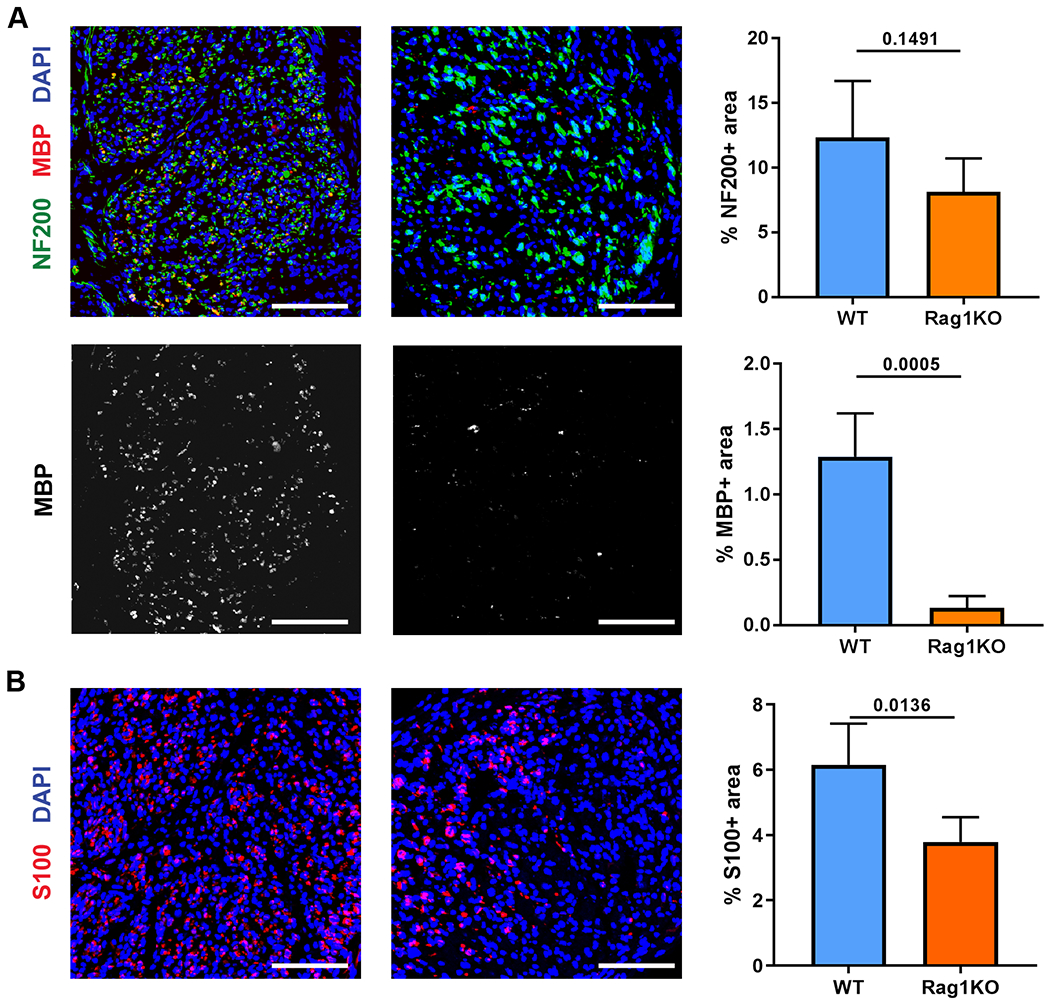
Nerve regeneration across ANAs in Rag1KO mice is impaired. The extent of nerve regeneration across ANAs in WT vs Rag1KO mice was assessed at 2 weeks. A) Representative immunofluorescence and quantification of neurofilament (NF200, green) and myelin (MBP, red) in the mid-graft of ANA at 2 weeks. B) Representative immunofluorescence and quantification of Schwann cells (S100, red) in the mid-graft of ANA at 2 weeks. Mean ± SD, n=5/group; p values shown. Scale bar represent 50 μm.
By four weeks after ANA repair, both WT and Rag1KO exhibited myelinated axon regeneration, but Rag1KO had reduced numbers of regenerating myelinated axons, both in the ANA (Fig. 4A) as well as at the distal nerve (Fig. 4B), compared to WT. Further histological assessment of axon regeneration revealed that while the G ratio was not different between Rag1KO and WT, Rag1KO had higher levels of myelin debris within ANAs, suggesting a disruption of remyelination during ongoing regeneration (Fig. 4C, Fig. S1 for larger images of histology). Furthermore, regenerated myelinated fiber size, axon area, and myelin area were reduced within Rag1KO compared to WT ANAs (Fig. 4C). Downstream from regenerating nerve, relative gastrocnemius muscle mass in Rag1KO was reduced compared to WT (Fig. 4D). Consistently, the EDL muscle affected also demonstrated reduced reinnervation of NMJs comparing Rag1KO vs WT mice (Fig. S2). To determine if these changes to nerve regeneration affected functional recovery, grid walk analysis revealed that Rag1KO had a persistent increase in the proportion of foot faults compared to WT starting at 4 weeks after repair, and which subsided by 8 weeks, demonstrating delayed functional recovery (Fig. 4E; Supplemental Table 4). Finally, we addressed whether adaptive immune deficiency affected neuron survival, which would in turn affect axon regeneration. Rag1KO and WT sciatic nerve retrograde traced 2 weeks after the initial nerve injury had no differences in motor neuron counts, demonstrating limited motor neuron death at the level of the sciatic nerve after injury due to loss of adaptive immunity (Fig. S3). Overall, Rag1KO mice revealed that the adaptive immune system contributes to promoting nerve regeneration across ANAs.
Fig 4.
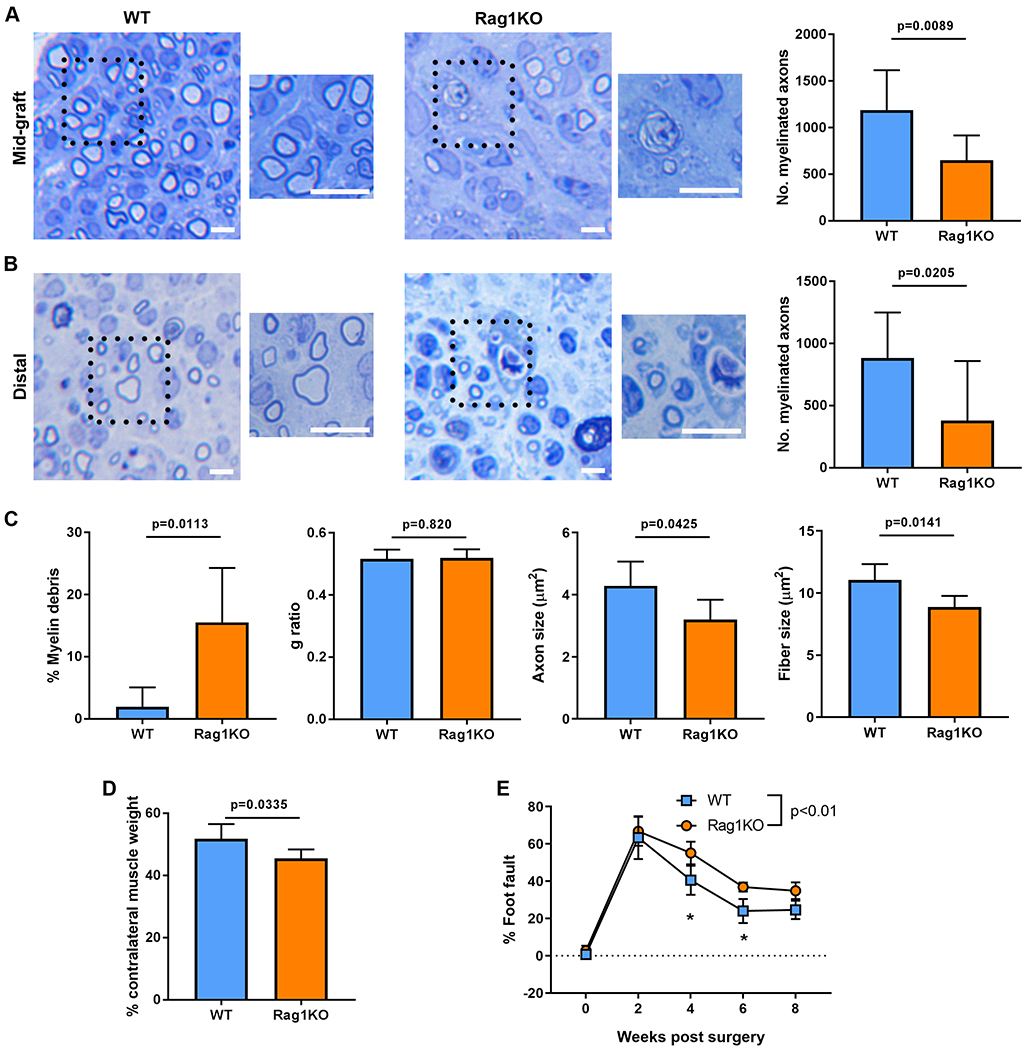
Functional regeneration of nerve across ANAs in Rag1KO mice is impaired. At 4 weeks after ANA repair, representative histological images and quantification of myelinated axon regeneration in the mid-graft of ANA (A) and distal nerve (B). C) Additional quantification of histomorphometric data from the mid-graft of ANA. D) Relative (to uninjured side) weight of gastrocnemius muscle at 4 weeks. E) Functional assessment (behavior) following ANA repair over time. Mean ± SD, n=8/group histology and muscle assessment at 4 weeks; n=5/group functional assessment; p values shown or indicated by * for group comparison at an endpoint. Scale bar represent 10 μm, insert scale bar represent 25 μm.
3.3. Rag1KO mice ANAs have altered immune environments during nerve regeneration
To determine how the adaptive immune system contributes to nerve regeneration across ANAs, we analyzed the ANA environment within Rag1KO compared to WT during early stages of nerve regeneration. From assessing gene expression from all cells contained within ANAs at 14 days after repair, Rag1KO vs WT ANAs contained lower levels of IL-4 transcripts (Fig. 5E). Transcripts of other Th2 related cytokines, including IL-13, were also reduced in Rag1KO mice (Fig. S4). Based on these cytokine expression patterns, immune cell populations within ANAs were also assessed at this endpoint. IHC analysis confirmed no differences in CD68 cell quantities within ANAs among groups (Fig. 5A). However, when considering the proportion of macrophages, CD68 cells represented a greater proportion of cells within ANAs from Rag1KO compared to WT. Yet, there still remained no change in the proportion of CD68, CD206 cells (M2 macrophages) among groups. Flow cytometry analysis of ANAs also revealed no changes in CD64, F4/80 total macrophages cell quantities relative to total CD11b cells, nor the proportion of CD64 F4/80 cells expressing CD206, among Rag1KO compared to WT (Fig. 5B). Considering other immune cell populations, Rag1KO ANAs contained a decreased quantity of Siglec F cells, representing eosinophils (Fig. 5D) and no differences in Ly6G neutrophils (Fig. 5C) relative to total CD11b cells compared to WT ANAs. However, despite these local changes within ANAs, there were no systemic changes in CD64 F4/80 or Ly6G cell quantities from Rag1KO compared to WT (Fig. S5). Conversely, Rag1KO contained increased Siglec F cell proportion within the spleen compared to WT (Fig. S5). Overall, these data demonstrated that the ANA environment derived from Rag1KO models is altered compared to WT, and suggest that T cell loss could be a primary reason for the changes.
Fig 5.
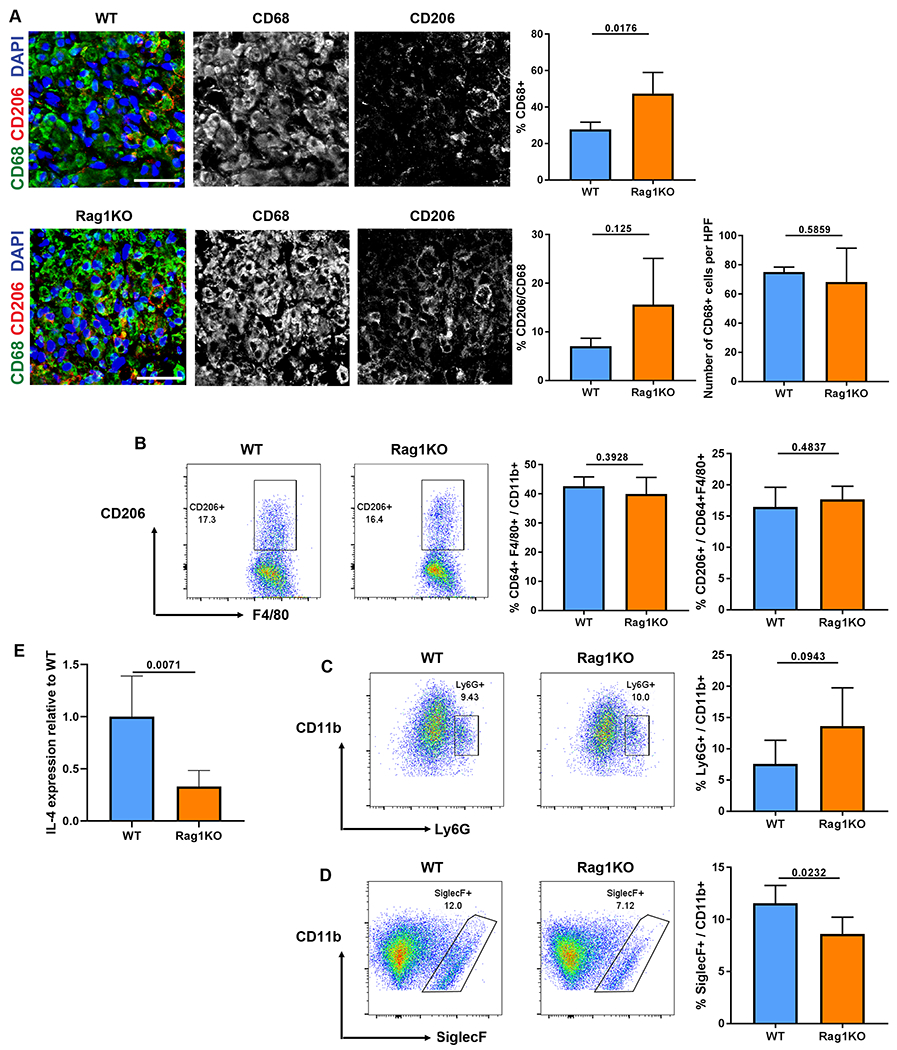
Cytokine expression and myeloid cell repopulation within ANAs is altered in Rag1KO mice at 2 weeks. A) Representative immunofluorescence and quantification of macrophages (CD68, green) and CD206 macrophages (CD206, red) from the mid-graft of ANAs. B) Representative flow cytometry and quantification of macrophages (F4/80 CD64) among myeloid cells (CD11b), and proportion of CD206 macrophages among all macrophages. Cells were gated on CD45+CD11b+F4/80+CD64+.. Representative flow cytometry and quantification of neutrophils (Ly6G, C) and eosinophils (Siglec-F, D) among myeloid cells. Cells were gated on CD45+CD11b+. E) Gene expression of IL-4 from all cells contained within ANAs. Mean ± SD, n=5/group; p values shown. Scale bar represent 50 μm.
3.4. T cells are associated with IL-4 expression within ANAs, but do not express substantial IL-4
Based on the difference in Il4 transcript levels contained within Rag1KO vs WT ANAs, the cell sources of IL-4 were identified using IL-4/GFP (4Get) mice. A correlation between T cell accumulation and IL-4 expressing cell accumulation was identified. Ten days following nerve repair with ANAs, there were minimal numbers of CD3 cells, nor IL-4-GFP expressing cells, within ANAs. By day 14, both cell populations substantially increased within ANAs compared to day 10 (Fig. 6A). This increase of CD3 cells and IL-4-GFP expressing cells were sustained up to 18 days post repair. However, only a minority of the IL-4-GFP cells colocalized with CD3 cells (Fig. 6B). Instead, the majority of IL-4-GFP cells colocalized with Siglec F cells. Furthermore, flow cytometry analysis verified these findings demonstrating that Siglec F cells were the majority of IL-4-GFP cells, with over 50% of Siglec F cells expressing GFP while <5% of other immune cells express GFP (Fig. 6C). Overall, this data demonstrated that T cells were not the primary cells expressing IL-4, but instead, their accumulation within ANAs is associated with the accumulation of IL-4 expressing eosinophils.
Fig 6.
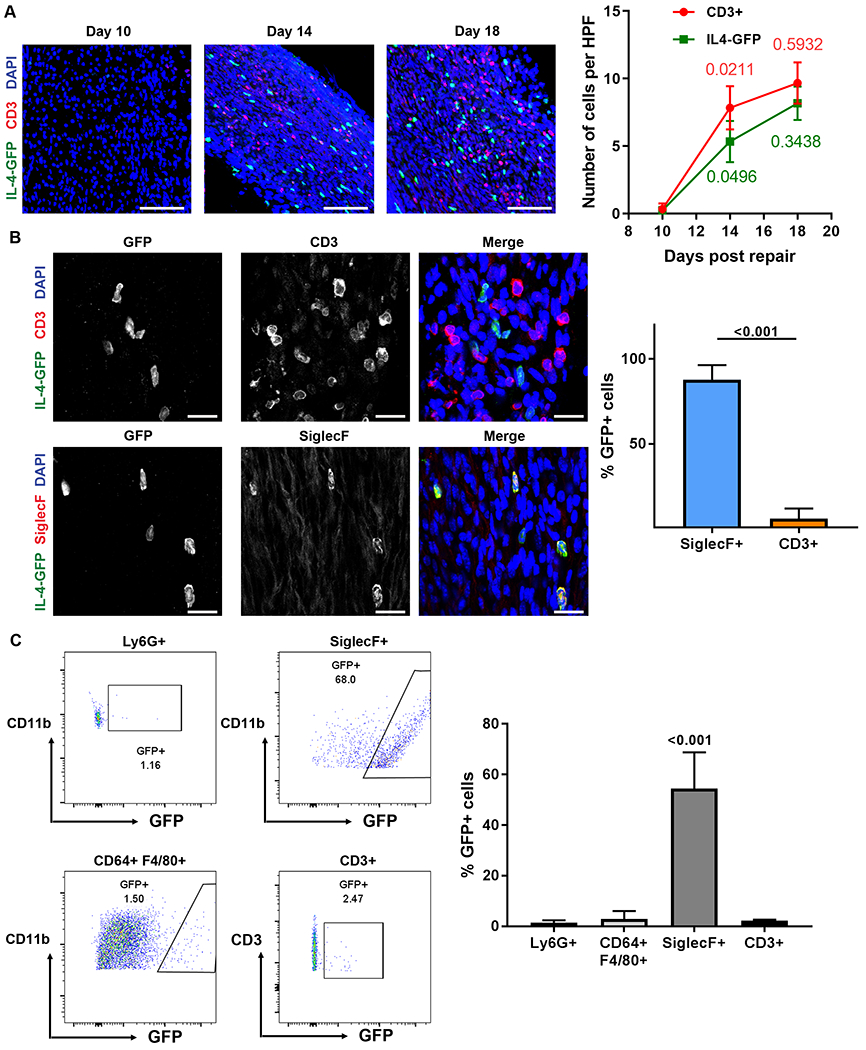
Eosinophils are the major source of IL-4 within ANAs during early regeneration. IL-4-GFP mice sciatic nerve were repaired using ANA to identify sources of IL-4. A) Representative images and quantification of T cells (CD3, red) and IL4-GFP cells (green) within ANAs at 10, 14, and 18 days after ANA repair. P values across time for each group are indicated in a matching color. B) Representative images and quantification of T cells and eosinophils (Siglec F) colocalization with GFP expressing cells at 14 days. C) Representative flow cytometry and quantification of proportion of neutrophils, macrophages, eosinophils, and T cells from spleen expressing GFP at 14 days after ANA repair. Neutrophils were gated on CD45+CD11b+Ly6G+. Macrophages were gated on CD45+CD11b+F4/80+CD64+. Eosinophils were gated on CD45+CD11b+SiglecF+. T cells were gated on CD45+CD11b+CD3+. Mean ± SD, n=3/group; p values shown. Scale bar represent 50 μm.
3.5. CD4 T cells impact IL-4 expressing eosinophil accumulation within ANA
To then further explore the relationship between T cells, IL-4 expressing cells, and eosinophils, 4Get mice nerves repaired with ANAs were subsequently depleted of CD4 T cells. Depletion of CD4 cells starting from 7 days post repair until a 2 week endpoint led to a substantial reduction in the number of CD3 cells that accumulated within ANAs (Fig. 7A). As well, this depletion lead to reduction in IL-4-GFP expressing cells within ANAs compared to isotype control antibody treated mice at 2 weeks (Fig. 7A). To further consider the scope of changes in eosinophil accumulation within ANAs, flow cytometry analysis of major leukocyte populations was performed considering both the ANA and systemic levels in spleen and blood at 2 weeks. Based on these findings, flow cytometry quantified the number of immune cells expressing GFP to further corroborate the sources of IL-4 expression. While CD4 cell depletion reduced Siglec F cell quantities within ANAs compared to the isotype control (Fig. 7B), CD4 depletion did not change the proportion of CD11b myeloid cells within ANAs. As well, despite the reduction in Siglec F cell quantities within ANAs, the proportion of Siglec F cells that expressed GFP within the ANA was not altered. However, considering these effects at a systemic level, while CD4 antibody depletion led to a loss of ~50% of total CD3 cells from blood (Fig. 7C) and spleen (Fig. 7D), it did not alter the proportion of Siglec F cells relative to CD11b myeloid cells contained in blood or spleen, nor the proportion of Siglec F cells expressing IL-4-GFP. Taken together, these data demonstrated that CD4 T cells regulate eosinophil accumulation within ANAs during early stages of nerve regeneration. And, CD4 T cells likely do not affect eosinophils expression of IL-4, but instead affect the recruitment of eosinophils to ANAs.
Fig 7.
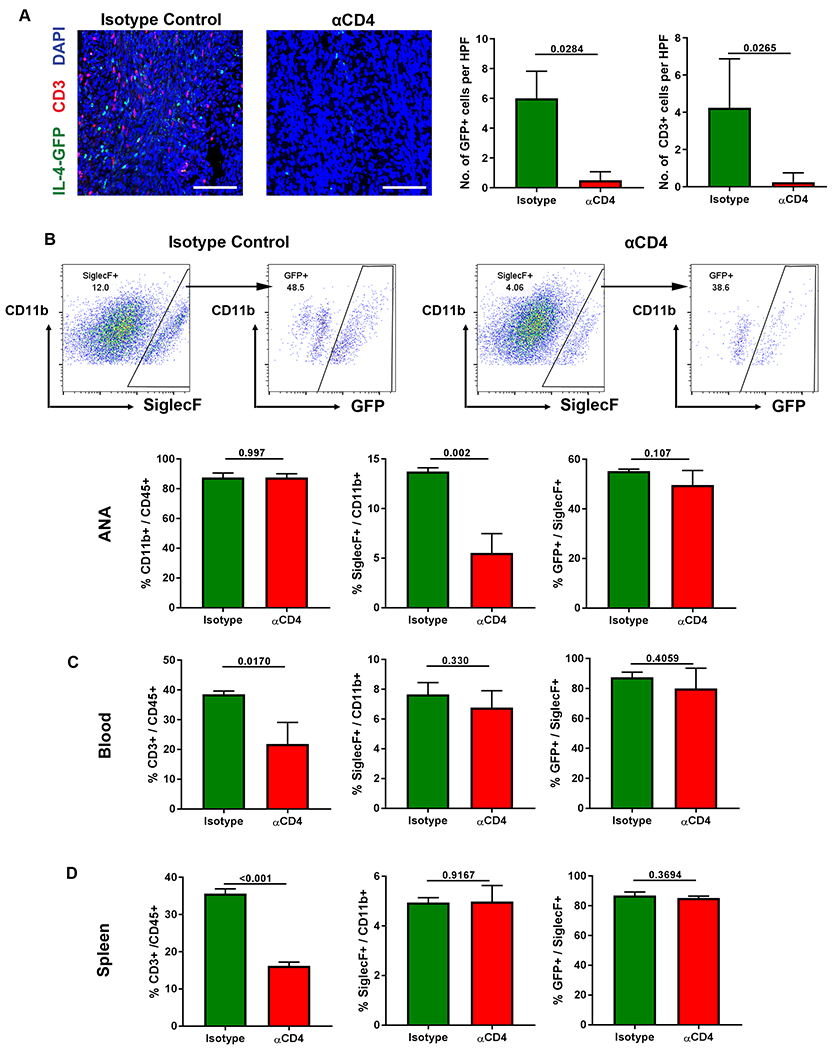
CD4 T cells affect IL-4 expression within ANAs via their regulation of eosinophils. IL-4-GFP mice sciatic nerve were repaired using ANA and treated with antibodies to deplete CD4 T cell accumulation within ANAs up to the 14 day endpoint. A) Representative images and quantification of IL4-GFP cells (green) and T cells (CD3, red) within ANAs. B) Representative flow cytometry and quantification of eosinophils (Siglec F) and IL4-GFP expression among eosinophils within ANAs, including the proportion of myeloid cells (CD11b) among CD45 cells, eosinophils among myeloid cells, and IL4-GFP cells among eosinophils. Quantification of flow cytometry of blood (C) and spleen (D) from treated mice for the proportion of T cells among hematopoietic cells (CD45), eosinophils among myeloid cells, and IL4-GFP cells among eosinophils. Mean ± SD, n=4/group for (A) and n=3/group for all others; p values shown. Scale bar represent 50 μm.
3.6. Depletion of CD4 T cells or neutralization of IL-4 impacts early myelin expression
Given our new data, we assessed whether depletion of CD4 T cells in the setting of WT mice impacted nerve regeneration across ANAs. Two weeks after ANA repair, mice that had CD4 depletion for one week showed no changes in axonal regeneration, based on NF200 area (Fig. 8A). However, there was lesser degree of myelin expression within ANAs of CD4 depleted mice compared to isotype treated mice, based on MBP area. This reduction in myelin expression was likely not caused by a deficiency of SC accumulation within the graft as S100 area was not different between CD4 depleted compared to isotype treated (Fig. 8B). Thus, loss of CD4 cells contributed to delayed myelination of regenerated axons. Given this outcome and the link between CD4 T cells and IL-4 expression, WT mice were also treated with IL-4 antibody to neutralize IL-4 activity within ANAs. Similar to the results of CD4 depletion, ANAs from mice with IL-4 neutralization showed no changes in axonal regeneration, based on NF200 area (Fig. 8C), but myelin expression was reduced, based on MBP area. And, similar to CD4 depletion, IL-4 neutralization did not affect SC numbers that accumulated within ANAs, based on S100 area (Fig. 8D). Thus, loss of IL-4 also contributed to delayed myelination of regenerated axons.
Fig 8.
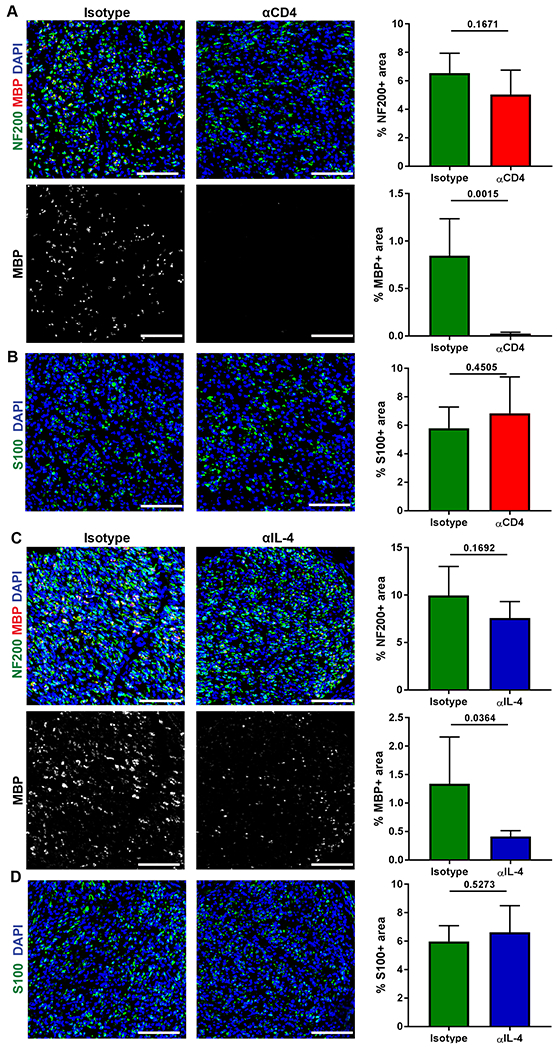
CD4 T cells and IL-4 are critical to early myelination of axons within ANAs. WT mice sciatic nerve were repaired using ANA and treated with antibodies to deplete CD4 T cells or neutralize IL-4 up to the 14 day endpoint. A&B) Representative immunofluorescence and quantification of myelin (MBP, red), neurofilament (NF200, green), and Schwann cells (S100, green) within ANAs for CD4 depletion groups. C&D) Representative immunofluorescence and quantification of myelin (MBP, red), neurofilament (NF200, green), and Schwann cells (S100, green) within ANAs for IL-4 neutralization groups. Mean ± SD, n=5/group; p values shown. Scale bar represent 50 μm.
3.7. IL-4 contributes to nerve regeneration across ANAs
IL-4KO mice were then used to determine if IL-4 alone substantially contributed to nerve regeneration across ANAs. Nerve histology at 4 weeks after ANA repair revealed that IL-4KO had fewer myelinated axon numbers within ANAs compared to WT (Fig. 9A), but no differences in axon numbers across ANAs in distal nerve (Fig. 9B). IL-4KO also had significantly greater levels of myelin debris within ANAs compared to WT (Fig. 9C, Fig. S6 for larger images of histology). And while an IL-4 deficiency did not affect the G ratio or Axon area, it did reduce Fiber area, again suggesting a role in myelination. Finally, IL-4KO also demonstrated differences in downstream recovery. IL-4KO had reduced relative gastrocnemius muscle mass compared to WT (Fig. 9D). And critically, IL-4KO had reduced functional recovery compared to WT (Fig. 9E; Supplemental Table 5), mirroring a major finding from the Rag1KO mice studies. Overall, IL-4KO mice models regenerating nerve across ANAs demonstrated deficiencies in nerve regeneration.
Fig 9.
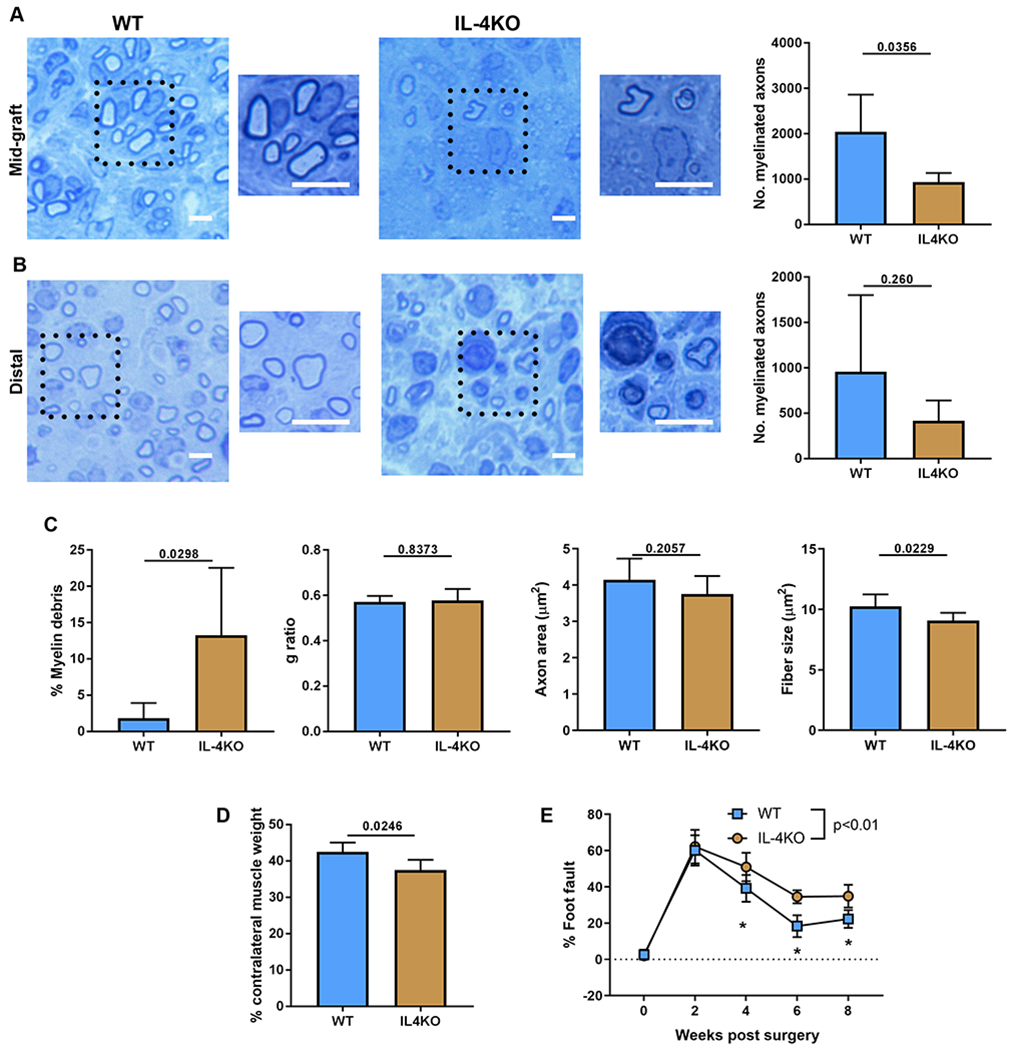
Nerve regeneration across ANAs in IL-4KO mice is impaired. The extent of nerve regeneration across ANAs in WT vs IL-4KO mice was assessed at multiple endpoints. At 4 weeks after ANA repair, representative histological images and quantification of myelinated axon regeneration in the mid-graft of ANA (A) and distal nerve (B). C) Additional quantification of histomorphometric data from the mid-graft of ANA. D) Relative (to uninjured side) weight of gastrocnemius muscle at 4 weeks. E) Functional assessment (behavior) following ANA repair over time. Mean ± SD, n=5/group histology and muscle assessment at 4 weeks; n=5/group functional assessment; p values shown or indicated by * for group comparison at an endpoint. Scale bar represent 10 μm, insert scale bar represent 25 μm.
4. Discussion
The role of T cells during peripheral nerve regeneration upon scaffolds is largely unresolved. Previously, we found that T cells were associated with successful regeneration across ANA scaffolds repairing nerve defects. And, a T cell deficiency decreased regeneration and recovery across ANAs used to repair nerve defects. However, we did not explore the mechanism by which T cells may promote such effects. Here, we demonstrate that T cells regulate IL-4 during nerve regeneration across ANAs, specifically by recruiting IL-4 expressing eosinophils. In turn, T cells and IL-4 promoted nerve regeneration across ANAs, as their deficiencies reduced early myelin protein expression and the quantity of myelinated axons regenerating across ANAs, and ultimately reduced or delayed functional recovery.
After a nerve injury repaired using ANAs in mice, we observed a sustained accumulation of T cells within the ANA environment. The presence of T cells within ANAs was slightly delayed compared to myeloid cells. This finding is consistent with previous studies on the immune response to biomaterials [23]. Indeed, innate immunity typically mounts a fast response, while adaptive immunity has a delayed but sustained response [24]. It is possible that cells arriving early to ANAs, such as macrophages, may be required to recruit T cells. For example, macrophage may promote angiogenesis which promotes T cell accumulation within tissue [25]. Furthermore, T cells accumulated within the graft environment likely are specific to the injury. Indeed, fewer T cells were observed in the injured distal nerve, demonstrating that T cells specifically accumulate within the ANA wound environment, suggesting their potential importance to resolving regeneration in this context. Recent studies have found that the wound environment of a nerve defect is unique compared to the injured distal nerve [26]. SCs and macrophages within this defect wound environment play unique roles and express different genes compared to those in the distal nerve [26,27]. T cells may therefore be recruited into the ANA due to its unique nature.
We determined that nerve regeneration across ANAs and functional recovery in Rag1KO mice, which lack functional B and T cells, was reduced compared to WT mice. These results are similar to our previous studies comparing nerve regeneration across ANAs in athymic rats, which lack functional T cells, to heterozygous T cell sufficient rats [5]. Rag1KO mice exhibited both reduced regeneration of myelinated axons across the ANA, and delayed functional recovery. However, previous work has linked T cells to motor neuron survival following a facial nerve injury [28]. Therefore, motor neuron death could account for changes in regeneration in our sciatic nerve injury model in Rag1KO mice. However, our results do not support this mechanism. Rag1KO and WT mice retrograde traced using Fluorogold, which involves passive transport of the dye to neurons via fluid-phase endocytosis, revealed no differences in motor neuron counts after a sciatic nerve injury. Furthermore, analysis of the ANA environment of Rag1KO mice revealed direct evidence of a T cell role within the ANA. We observed reduced expression of Th2 cytokines, in particular Il-4, contained within ANAs of Rag1KO mice. Thus, this led us to hypothesize that reduced IL-4 levels within the ANA environments of mice deficient in adaptive immunity may be one of the reasons for their reduced regeneration and recovery. Since B cells are present at small proportions (<1%), while T cells are almost 10% of leukocyte populations, we hypothesize that T cells are major mediators of these changes.
IL-4 has been suggested to drive macrophage proliferation and M2 polarization. Surprisingly, despite a higher level of IL-4 expression levels contained within the ANAs of WT mice, no differences in macrophage numbers or their polarization (CD206 expression) was observed compared to Rag1KO mice. It is possible that in WT mice, their ANA environments may contain elevated levels of inflammatory cytokines, which thus dampen the impact of IL-4 on polarization. At present, our cytokine analysis was limited as we primarily focused on anti-inflammatory cytokines given our previous work that demonstrated a relationship between T cells and Th2 cytokine expression [5]. While no broad differences in macrophages were observed, we did observe an increase in eosinophils in WT vs Rag1KO ANAs. This reduction of eosinophils in ANAs within Rag1KO mice is likely due to the lack of T cells within the ANA, rather than systemic changes. In support of this concept, Rag1KO mice did have a greater proportion of eosinophils among their myeloid cells in their spleen.
We also identified sources of IL-4 within ANAs, which is a unique finding regarding the source of IL-4 expression within ANAs, or biomaterials within nerve generally speaking. Using 4get mice, which allowed tracking of all cells expressing IL-4, we determined that eosinophils, but not T cells, are the major source of IL-4. Given the reduced number of eosinophils and lower expression of IL-4 in Rag1KO mice, we hypothesized that lack of T cells may contribute to deficient eosinophil accumulation. This was supported by our observation following CD4 T cell depletion. Loss of CD4 T cells drastically reduced the number of IL-4 expressing cells within ANAs. This general relationship regarding CD4 T cells and IL-4 regeneration is consistent with studies in other organ systems [29–31]. While loss of CD4 T cells reduced eosinophil accumulation within ANAs, it did not inhibit IL-4 expression of the few eosinophils that did accumulate. Furthermore, loss of CD4 T cells did not change systemic eosinophil numbers since similar numbers of eosinophils were found in blood of CD4 T cell depleted or isotype control treated mice. Nor did it broadly prevent migration of eosinophils, as splenic eosinophils did not become diminished. Taken together, these data present a mechanistic finding, whereby local CD4 T cells regulate IL-4 expression by recruiting eosinophils into ANAs.
In the context of nerve regeneration across a defect, the role of IL-4 has been unclear. While supra-physiological levels of IL-4 provided through sustained drug release have been found to promote nerve regeneration across a defect (1 cm) bridged by conduits [8,32], loss of endogenous IL-4 signaling during regeneration across a small nerve defect (~3 mm) had limited impact on the extent of final motor axon regeneration [33]. Specifically, the loss of IL-4 signaling through IL-4RKO mice resulted in no differences to WT mice regarding the final number of motor neurons regenerating their axons to distal nerve by 8 weeks following a repaired nerve injury [33]. However, this outcome did not rule out a role for IL-4 signaling in the rate of nerve regeneration, the degree of myelination, or the ultimate functional outcome. We showed, using IL-4KO mice, that loss of IL-4 significantly reduced the number of myelinated axons actively regenerating within the ANA environment by 4 weeks, as well as reduced functional recovery even until 8 weeks. Therefore, our results do not conflict with, but add to, previous evidence on the role of endogenous IL-4 signaling during nerve regeneration.
Our results strongly suggest that the role of IL-4 in regeneration involves its ability to promote myelination. Both Rag1KO and IL-4KO mice demonstrated reduced myelination and myelinated axon regeneration across ANAs compared to WT mice. Also, consistent with data that CD4 T cells regulate IL-4, we found that depletion of either CD4 T cells or neutralization of IL-4 through antibodies in WT mice reduced myelin protein expression (MBP) within ANAs. Because Rag1KO mice and IL-4KO mice also experience systemic changes in their germ-lines from the knockout, these antibody mediated depletion studies reinforce that loss of either T cells or IL-4 are important for myelination. However, at present, our results are limited in explaining how IL-4 affects myelination. Future mechanistic studies will be required to understand how IL-4 promotes myelination.
There are several limitations of this study. The use of rodents as models of human nerve injury and repair has recently come under increased focus. Differences exist between the immune system of mice and human that may affect translation of findings. For example, gene analysis has revealed some differences in cytokine expression between human and mice, including a divergent Interferon signaling pathway [34]. On the other hand, human eosinophils are known to express IL-4 [35], and human T cells can recruit eosinophils both in vivo, and in vitro [36], suggesting a possibility of similar roles for T cells in modulating IL-4 within nerve injury. In addition, ANA represents a single type of nerve biomaterial among many [37]. The mechanism and impact of IL-4 and T cells on nerve regeneration across different biomaterials may differ [33]. Finally, additional behavioral testing, including Von Frey, rotor-meter, and walking track analysis would be valuable motor and sensory functional analyses to further examine and validate the impact of IL-4 and T cells on functional recovery, as at present only a grid-walk analysis was performed. Future studies on how IL-4 and T cells may contribute to nerve regeneration across different biomaterials are also needed.
A number of studies have demonstrated how IL-4 may modulate tissue response to scaffolds [38,39]. Elucidating the source and regulation of IL-4 may be an important aspect of characterization of tissue scaffolds in vivo. The ability of T cells to regulate IL-4 and eosinophils also suggest possible strategies to modulate scaffolds to improve regeneration could involve promoting local T cell accumulation or recruiting eosinophils.
Supplementary Material
Acknowledgements
This work was supported in part by the National Institutes of Neurological Disorders and Stroke of the National Institutes of Health (NIH) under award numbers R01 NS086773 (SEM), R01 NS115960 (MDW), K08NS096232 (ASW), and P30 NS057105 to Washington University, an award from the McDonnell Center for Cellular and Molecular Neuroscience (MDW), and by a Pilot Project Award from the Hope Center for Neurological Disorders at Washington University (MDW). The content is solely the responsibility of the authors and does not represent the views of the NIH or Washington University.
Footnotes
The authors have no competing interests to declare.
Data Availability
The experimental data required to reproduce the findings from this study will be made available to interested investigators upon request.
References
- [1].Grinsell D, Keating CP, Peripheral nerve reconstruction after injury: a review of clinical and experimental therapies, Biomed Res. Int. 2014 (2014). [DOI] [PMC free article] [PubMed] [Google Scholar]
- [2].Karabekmez FE, Duymaz A, Moran SL, Early clinical outcomes with the use of decellularized nerve allograft for repair of sensory defects within the hand, (2009). [DOI] [PMC free article] [PubMed]
- [3].Rbia N, Shin AY, The role of nerve graft substitutes in motor and mixed motor/sensory peripheral nerve injuries, J. Hand Surg. Am. 42 (2017) 367–377. [DOI] [PubMed] [Google Scholar]
- [4].Sadtler K, Estrellas K, Allen BW, Wolf MT, Fan H, Tam AJ, Patel CH, Luber BS, Wang H, Wagner KR, Developing a pro-regenerative biomaterial scaffold microenvironment requires T helper 2 cells, Science (80-. ). 352 (2016) 366–370. [DOI] [PMC free article] [PubMed] [Google Scholar]
- [5].Pan D, Hunter DA, Schellhardt L, Jo S, Santosa KB, Larson EL, Fuchs AG, Snyder-Warwick AK, Mackinnon SE, Wood MD, The accumulation of T cells within acellular nerve allografts is length-dependent and critical for nerve regeneration, Exp. Neurol 318 (2019) 216–231. 10.1016/j.expneurol.2019.05.009. [DOI] [PMC free article] [PubMed] [Google Scholar]
- [6].Seder RA, Paul WE, Acquisition of lymphokine-producing phenotype by CD4+ T cells, Annu. Rev. Immunol 12 (1994) 635–673. [DOI] [PubMed] [Google Scholar]
- [7].Murphy KM, Reiner SL, Decision making in the immune system: the lineage decisions of helper T cells, Nat. Rev. Immunol 2 (2002) 933. [DOI] [PubMed] [Google Scholar]
- [8].Mokarram N, Merchant A, Mukhatyar V, Patel G, Bellamkonda RV, Effect of modulating macrophage phenotype on peripheral nerve repair, Biomaterials. 33 (2012) 8793–8801. 10.1016/j.biomaterials.2012.08.050. [DOI] [PMC free article] [PubMed] [Google Scholar]
- [9].Goh YPS, Henderson NC, Heredia JE, Eagle AR, Odegaard JI, Lehwald N, Nguyen KD, Sheppard D, Mukundan L, Locksley RM, Eosinophils secrete IL-4 to facilitate liver regeneration, Proc. Natl. Acad. Sci 110 (2013) 9914–9919. [DOI] [PMC free article] [PubMed] [Google Scholar]
- [10].Walsh JT, Hendrix S, Boato F, Smirnov I, Zheng J, Lukens JR, Gadani S, Hechler D, Gölz G, Rosenberger K, MHCII-independent CD4+ T cells protect injured CNS neurons via IL-4, J. Clin. Invest 125 (2015) 699–714. [DOI] [PMC free article] [PubMed] [Google Scholar]
- [11].Ozaki A, Nagai A, Lee YB, Myong NH, Kim SU, Expression of cytokines and cytokine receptors in human Schwann cells, Neuroreport. 19 (2008) 31–35. [DOI] [PubMed] [Google Scholar]
- [12].Stratton JA, Holmes A, Rosin NL, Sinha S, Vohra M, Burma NE, Trang T, Midha R, Biernaskie J, Macrophages Regulate Schwann Cell Maturation after Nerve Injury, Cell Rep. 24 (2018) 2561–2572. [DOI] [PubMed] [Google Scholar]
- [13].Michailov GV, Sereda MW, Brinkmann BG, Fischer TM, Haug B, Birchmeier C, Role L, Lai C, Schwab MH, Nave K-A, Axonal neuregulin-1 regulates myelin sheath thickness, Science (80-. ). 304 (2004) 700–703. [DOI] [PubMed] [Google Scholar]
- [14].Ogata T, Iijima S, Hoshikawa S, Miura T, Yamamoto S, Oda H, Nakamura K, Tanaka S, Opposing extracellular signal-regulated kinase and Akt pathways control Schwann cell myelination, J. Neurosci 24 (2004) 6724–6732. [DOI] [PMC free article] [PubMed] [Google Scholar]
- [15].Mombaerts P, Iacomini J, Johnson RS, Herrup K, Tonegawa S, Papaioannou VE, RAG-1-deficient mice have no mature B and T lymphocytes, Cell. 68 (1992) 869–877. [DOI] [PubMed] [Google Scholar]
- [16].Mohrs M, Shinkai K, Mohrs K, Locksley RM, Analysis of type 2 immunity in vivo with a bicistronic IL-4 reporter., Immunity. 15 (2001) 303–11. http://www.ncbi.nlm.nih.gov/pubmed/11520464. [DOI] [PubMed] [Google Scholar]
- [17].Kühn R, Rajewsky K, Müller W, Generation and analysis of interleukin-4 deficient mice., Science. 254 (1991) 707–10. 10.1126/science.1948049. [DOI] [PubMed] [Google Scholar]
- [18].Poppler LH, Ee X, Schellhardt L, Hoben GM, Pan D, Hunter DA, Yan Y, Moore AM, Snyder-Warwick AK, Stewart SA, Axonal growth arrests after an increased accumulation of Schwann cells expressing senescence markers and stromal cells in acellular nerve allografts, Tissue Eng. Part A. 22 (2016) 949–961. [DOI] [PMC free article] [PubMed] [Google Scholar]
- [19].Hunter DA, Moradzadeh A, Whitlock EL, Brenner MJ, Myckatyn TM, Wei CH, Tung THH, Mackinnon SE, Binary imaging analysis for comprehensive quantitative histomorphometry of peripheral nerve, J. Neurosci. Methods. 166 (2007) 116–124. [DOI] [PMC free article] [PubMed] [Google Scholar]
- [20].Chao OY, Pum ME, Li J-S, Huston JP, The grid-walking test: assessment of sensorimotor deficits after moderate or severe dopamine depletion by 6-hydroxydopamine lesions in the dorsal striatum and medial forebrain bundle., Neuroscience. 202 (2012) 318–25. 10.1016/j.neuroscience.2011.11.016. [DOI] [PubMed] [Google Scholar]
- [21].Lee JK, Geoffroy CG, Chan AF, Tolentino KE, Crawford MJ, Leal MA, Kang B, Zheng B, Assessing spinal axon regeneration and sprouting in Nogo-, MAG-, and OMgp-deficient mice., Neuron. 66 (2010) 663–70. 10.1016/j.neuron.2010.05.002. [DOI] [PMC free article] [PubMed] [Google Scholar]
- [22].Baskin YK, Dietrich WD, Green EJ, Two effective behavioral tasks for evaluating sensorimotor dysfunction following traumatic brain injury in mice., J. Neurosci. Methods. 129 (2003) 87–93. 10.1016/s0165-0270(03)00212-7. [DOI] [PubMed] [Google Scholar]
- [23].Sadtler K, Estrellas K, Allen BW, Wolf MT, Fan H, Tam AJ, Patel CH, Luber BS, Wang H, Wagner KR, Powell JD, Housseau F, Pardoll DM, Elisseeff JH, Developing a pro-regenerative biomaterial scaffold microenvironment requires T helper 2 cells, Science (80-. ). 352 (2016) 366–370. 10.1126/science.aad9272. [DOI] [PMC free article] [PubMed] [Google Scholar]
- [24].Van Loon SLM, Smits A, Driessen-Mol A, Baaijens FPT, Bouten CVC, The immune response in in situ tissue engineering of aortic heart valves, in: Calcif. Aortic Valve Dis., IntechOpen, 2013.
- [25].Lim Y-C, Garcia-Cardena G, Allport JR, Zervoglos M, Connolly AJ, Gimbrone MA Jr, Luscinskas FW, Heterogeneity of endothelial cells from different organ sites in T-cell subset recruitment, Am. J. Pathol 162 (2003) 1591–1601. [DOI] [PMC free article] [PubMed] [Google Scholar]
- [26].Clements MP, Byrne E, Guerrero LFC, Cattin A-L, Zakka L, Ashraf A, Burden JJ, Khadayate S, Lloyd AC, Marguerat S, The wound microenvironment reprograms Schwann cells to invasive mesenchymal-like cells to drive peripheral nerve regeneration, Neuron. 96 (2017) 98–114. [DOI] [PMC free article] [PubMed] [Google Scholar]
- [27].Cattin A-L, Burden JJ, Van Emmenis L, Mackenzie FE, Hoving JJA, Garcia Calavia N, Guo Y, McLaughlin M, Rosenberg LH, Quereda V, Jamecna D, Napoli I, Parrinello S, Enver T, Ruhrberg C, Lloyd AC, Macrophage-Induced Blood Vessels Guide Schwann Cell-Mediated Regeneration of Peripheral Nerves, Cell. 162 (2015) 1127–1139. 10.1016/j.cell.2015.07.021. [DOI] [PMC free article] [PubMed] [Google Scholar]
- [28].Serpe CJ, Byram SC, Sanders VM, Jones KJ, Brain-derived neurotrophic factor supports facial motoneuron survival after facial nerve transection in immunodeficient mice, Brain. Behav. Immun 19 (2005) 173–180. 10.1016/j.bbi.2004.07.005. [DOI] [PubMed] [Google Scholar]
- [29].Nakajima H, Iwamoto I, Tomoe S, Matsumura R, Tomioka H, Takatsu K, Yoshida S, CD4+ T-lymphocytes and interleukin-5 mediate antigen-induced eosinophil infiltration into the mouse trachea, Am Rev Respir Dis. 146 (1992) 374–377. [DOI] [PubMed] [Google Scholar]
- [30].Voehringer D, Shinkai K, Locksley RM, Type 2 immunity reflects orchestrated recruitment of cells committed to IL-4 production, Immunity. 20 (2004) 267–277. [DOI] [PubMed] [Google Scholar]
- [31].Gavett SH, Chen X, Finkelman F, Wills-Karp M, Depletion of murine CD4+ T lymphocytes prevents antigen-induced airway hyperreactivity and pulmonary eosinophilia., Am. J. Respir. Cell Mol. Biol. 10 (1994) 587–593. [DOI] [PubMed] [Google Scholar]
- [32].Mokarram N, Dymanus K, Srinivasan A, Lyon JG, Tipton J, Chu J, English AW, Bellamkonda RV, Immunoengineering nerve repair, Proc. Natl. Acad. Sci 114 (2017) E5077–E5084. [DOI] [PMC free article] [PubMed] [Google Scholar]
- [33].Tomlinson JE, Žygelytė E, Grenier JK, Edwards MG, Cheetham J, Temporal changes in macrophage phenotype after peripheral nerve injury, J. Neuroinflammation. 15 (2018) 185. [DOI] [PMC free article] [PubMed] [Google Scholar]
- [34].Monaco G, van Dam S, Ribeiro JLCN, Larbi A, de Magalhães JP, A comparison of human and mouse gene co-expression networks reveals conservation and divergence at the tissue, pathway and disease levels, BMC Evol. Biol. 15 (2015) 259. [DOI] [PMC free article] [PubMed] [Google Scholar]
- [35].Bjerke T, Gaustadnes M, Nielsen S, Nielsen LP, Schiøtz PO, Rudiger N, Reimert CM, Dahl R, Christensen I, Poulsen LK, Human blood eosinophils produce and secrete interleukin 4, Respir. Med 90 (1996) 271–277. [DOI] [PubMed] [Google Scholar]
- [36].Robinson D, Hamid Q, Bentley A, Ying S, Kay AB, Durham SR, Activation of CD4+ T cells, increased TH2-type cytokine mRNA expression, and eosinophil recruitment in bronchoalveolar lavage after allergen inhalation challenge in patients with atopic asthma, J. Allergy Clin. Immunol. 92 (1993) 313–324. [DOI] [PubMed] [Google Scholar]
- [37].Pan D, Mackinnon SE, Wood MD, Advances in the repair of segmental nerve injuries and trends in reconstruction, Muscle Nerve. (2019) mus.26797. 10.1002/mus.26797. [DOI] [PMC free article] [PubMed] [Google Scholar]
- [38].Brodbeck WG, Shive MS, Colton E, Ziats NP, Anderson JM, Interleukin-4 inhibits tumor necrosis factor-α—induced and spontaneous apoptosis of biomaterial-adherent macrophages, J. Lab. Clin. Med 139 (2002) 90–100. [DOI] [PubMed] [Google Scholar]
- [39].Hachim D, LoPresti ST, Yates CC, Brown BN, Shifts in macrophage phenotype at the biomaterial interface via IL-4 eluting coatings are associated with improved implant integration, Biomaterials. 112 (2017) 95–107. [DOI] [PMC free article] [PubMed] [Google Scholar]
Associated Data
This section collects any data citations, data availability statements, or supplementary materials included in this article.


