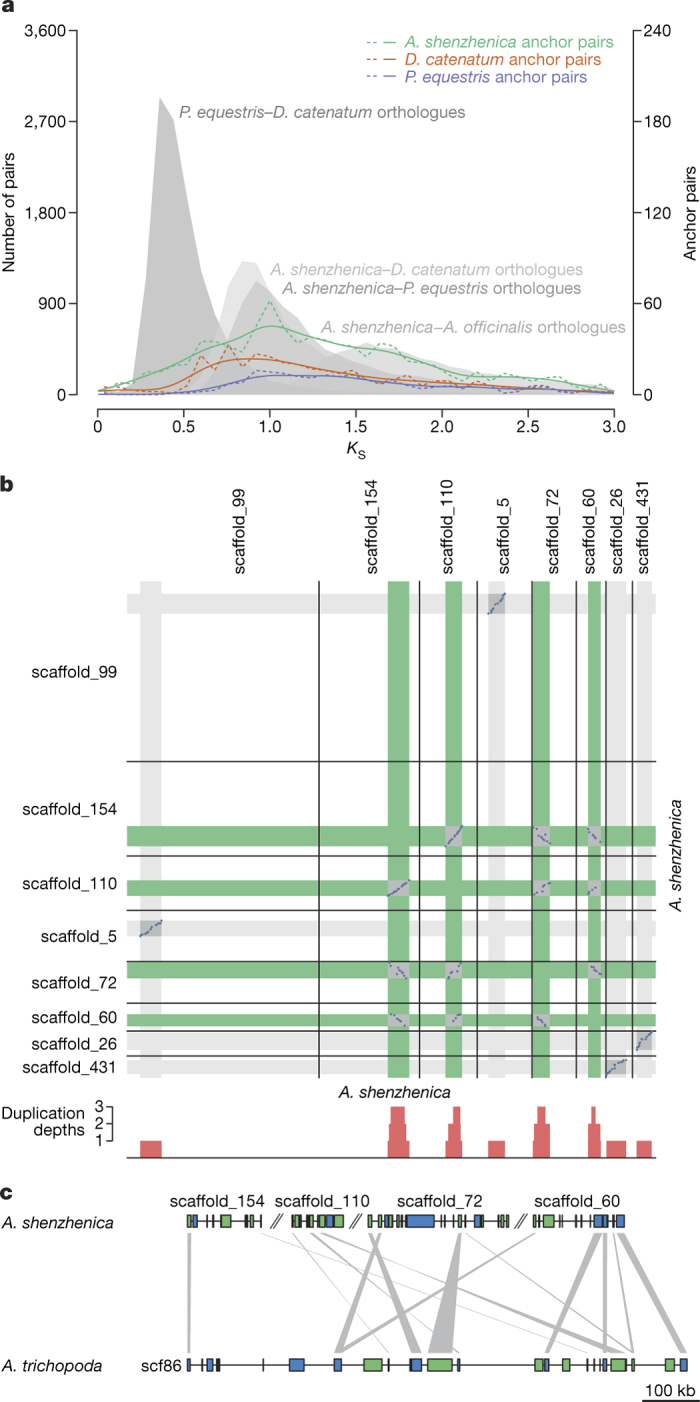
Figure 2. KS and co-linearity analysis of the A. shenzhenica WGD.

a, Distribution of KS for the one-to-one P. equestris–D. catenatum, A. shenzhenica–D. catenatum, A. shenzhenica–P. equestris and A. shenzhenica–A. officinalis orthologues (filled grey curves and left-hand y-axis). Distribution of KS for duplicated anchors found in co-linear regions of A. shenzhenica (green lines), D. catenatum (red lines) and P. equestris (blue lines). The filled grey curves and dashed coloured lines are actual data points from the distributions; the solid coloured lines are kernel density estimates (KDE) of the anchor-pair (duplicated genes found in co-linear regions) data scaled to match the corresponding dashed lines. All anchor-pair data are scaled up ×15 (right-hand y-axis) compared to the orthologue data. b, Syntenic dot plot of the self-comparison of A. shenzhenica. Only co-linear segments with at least 15 anchor pairs are shown. The sections on each scaffold with co-linear segments are shown in grey. The red bars below the dot plot illustrate the duplication depths (the number of connected co-linear segments overlapping at each position; see Methods). The co-linear regions in green indicate the four co-linear segments that have a common orthologous co-linear segment in A. trichopoda as shown in (c). c, Co-linear alignment of A. shenzhenica and A. trichopoda. The colours of genes in the alignment indicate gene orientation, with blue for forward strands and green for reverse strands. The grey links connect orthologues between A. shenzhenica and A. trichopoda. Scf86, scaffold00086 of the A. trichopoda genome (v1.0).
