

SUMMARY
PD-1 blockade-based combination therapy has been approved as a first-line treatment for head and neck squamous cell carcinoma (HNSCC). However, the responsive rate remains relatively low, and the patients with HNSCC eventually relapses. Here we show that the combination treatment of anti-PD1 and cisplatin enriched BMI1+ CSCs in HNSCC while inhibiting HNSCC growth. In contrast, the pharmacological and genetic inhibition of BMI1 eliminated BMI1+ CSCs and enabled PD1 blockade therapy, resulting in the inhibition of metastatic HNSCC and prevention of HNSCC relapses. Unexpectedly, BMI1 inhibition strongly induced tumor cell-intrinsic immune responses by recruiting and activating CD8+ T cells in addition to eliminating BMI1+ CSCs. Mechanistically, BMI1 inhibition induced CD8+ T cell-recruiting chemokines by stimulating IRF3-mediated transcription and erasing repressive H2A ubiquitination. Our results suggest that targeting BMI1 might enable immune checkpoint blockade to inhibit metastatic tumor growth and prevent tumor relapse by activating cell-intrinsic immunity in addition to purging CSCs.
eTOC BLURB
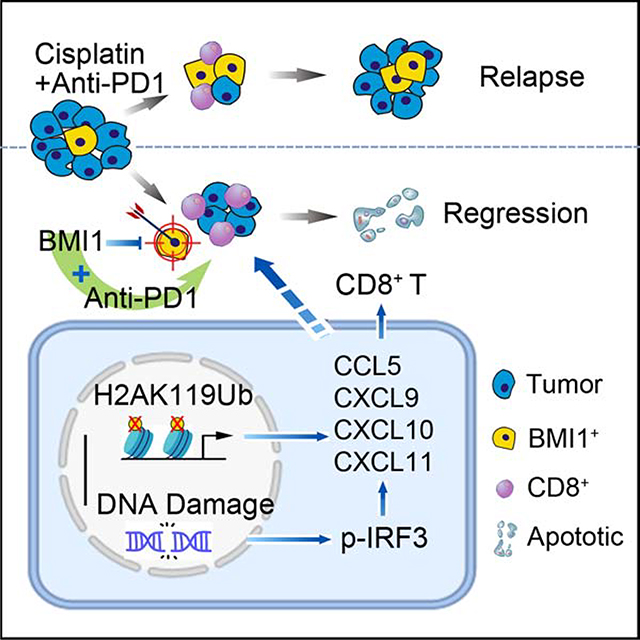
Jia et al. show that the pharmacological or genetic inhibition of BMI1 not only helps to eliminate BMI1+ CSCs, but also to augment PD1 blockade by activating tumor cell-intrinsic immunity, resulting in the inhibition of metastatic tumor growth and the prevention of tumor relapse.
Graphical Abstract
INTRODUCTION
Cancer stem cells (CSCs), also known as cancer initiating cells, are associated with tumor initiation, growth and metastasis. Growing evidence suggest that CSCs might be responsible for cancer therapy resistance and relapse or recurrence (Al-Hajj et al., 2003; Boumahdi et al., 2014; Brooks et al., 2015; Prager et al., 2019; Saygin et al., 2019). In order to achieve complete regression of tumors, CSCs have to be targeted based on the CSC theory (Chen and Wang, 2019). Moloney murine leukemia virus insertion site 1 (BMI1) has been found to control CSC self-renewal and functions in several human cancers including HNSCC (Chen et al., 2017; Kreso et al., 2014). BMI1 is a core component of the polycomb repressive complex 1 (PRC1) that mediates gene silencing via monoubiquitination of histone H2A. Targeting BMI1 with the small molecule inhibitor PTC209 was shown to abolish the self-renewal of CSCs isolated from human colorectal cancers in the xenografted nude mouse model (Kreso et al., 2014). Using in vivo lineage tracing in a spontaneously-formed mouse model, we convincingly demonstrated that BMI1+ CSCs were responsible for HNSCC initiation, invasive growth, and metastasis. Targeting BMI1+ CSCs collaborated with the chemotherapeutic agent cisplatin to inhibit HNSCC growth (Chen et al., 2017), thereby suggesting that the combination therapy to debulk tumor and eliminate CSCs can achieve better cancer therapy efficacy.
HNSCC is an aggressive malignancy with a low 5-year survival rate and poor prognosis and is highly invasive and frequently metastasizes to cervical lymph nodes (Hedberg et al., 2016; Lee et al., 2018; Wang et al., 2012). PD1 blockade combined with chemotherapy has been approved for treating recurrent or metastatic HNSCC and has significantly changed the therapeutic landscape of HNSCC. Unfortunately, the objective responsive rates are not very high and the median response duration is relatively short, indicating that HNSCC might be intrinsically resistant to PD1 blockade and eventually relapse after treatment (Burtness et al., 2019; Ferris et al., 2016; Seiwert et al., 2016). Because CSCs were often defined by using immunodeficient mouse models, it is largely unknown whether PD1 blockade-based immunotherapy can target CSCs. Growing evidence suggests that CSCs may secrete various growth factors and cytokines to inhibit immune responses and promote immunosuppressive tumor microenvironment (Zhang et al., 2018; Prager et al., 2019; Clara et al., 2020). The expression of components of the antigen processing and major histocompatibility complex molecules have been found to be downregulated in CSCs of glioblastoma and prostate cancer (Tomaso et al., 2010; Cancer Genome Atlas Research Network, 2015). On the other hand, PD-L1 was shown to be elevated in CSCs of human HNSCC and other solid tumors (Zhang et al., 2018). Very recently, it has been shown that CSCs directly inhibited cytotoxic T cell activity and mediated tumor resistance to adoptive cytotoxic T cell transfer-based immunotherapy by expressing CD80 (Miao et al., 2019). Taken together, these studies suggest that targeting CSCs may be critical for improving the efficacy of immunotherapy and preventing tumor relapses.
The limited model systems available for the genetic lineage analysis of CSCs in intact tumor immune microenvironment has hampered the development of novel therapeutic strategies. Despite exciting progresses in cancer immunotherapy, currently, there are no pre-clinical or clinical studies to show that immune checkpoint blockade can eliminate CSCs by activating antitumor immunity. Recently, we established a 4 nitroquinoline-1 oxide (4NQO) induced Bmi1CreER;RosatdTomato mouse model of HNSCC, which fully mimics human HNSCC development and metastasis and allows us to perform in vivo lineage tracing of BMI1+ CSCs in an unperturbed tumor immune microenvironment (Chen et al., 2017). Taking advantage of this model, we tested whether BMI1+ CSCs could be eradicated by PD1 blockade-based combination therapy. Unexpectedly, we found that the pharmacological or genetic inhibition of BMI1 not only helped to eliminate BMI1+ CSCs, but also to augment PD1 blockade by activating tumor cell-intrinsic immunity, resulting in inhibition of metastatic tumor growth and prevention of tumor relapse. Our preclinical studies provide an important foundation for developing a new clinical trial for PD1 blockade-based combination therapy with BMI1 inhibitors.
Results
BMI1+ CSCs Are Enriched after Combination of Cisplatin and Anti-PD1
To examine whether anti-PD1 plus cisplatin could eliminate BMI1+ CSCs of HNSCC, we treated Bmi1CreER;RosatdTomato mice with 4NQO in their drinking water for 16 weeks and then provided them with normal drinking water. At 22 weeks, the tumor-bearing mice were randomly divided into four groups and treated with cisplatin, anti-PD1, anti-PD1 plus cisplatin, or IgG control for 4 weeks. A single dose of tamoxifen was administered 1 day prior to sacrificing the mice in order to label Tomato+ BMI1+ CSCs (Figure 1A). Whereas the treatment of cisplatin alone reduced the lesion surface areas, anti-PD1 did not show the inhibition compared with vehicle control. The addition of anti-PD1 to cisplatin did not further enhance inhibitory effects compared with cisplatin alone (Figures 1B and 1C). Histological analysis found that cisplatin plus anti-PD1 significantly reduced HNSCC numbers and areas, while such inhibitory effect was not observed by anti-PD1 treatment alone. Although antitumor effects between cisplatin alone and anti-PD1 plus cisplatin did not show a statistically significant difference, we observed a trend that anti-PD1 plus cisplatin more effectively reduced SCC numbers (**p < 0.01, cisplatin plus anti-PD1 vs. control; not significant, cisplatin vs. control) and areas (**p < 0.01, cisplatin plus anti-PD1 vs. control; *p < 0.05, cisplatin vs. control) compared with cisplatin treatment alone (Figures 1D and 1E). Moreover, anti-PD1 plus cisplatin also significantly reduced the invasiveness of HNSCC (Figure 1F). Immunostaining with anti-active caspase-3 antibodies (anti-Ac-casp3) demonstrated that apoptotic cells were significantly increased by anti-PD1 plus cisplatin. However, apoptosis was mainly induced in Bmi1− tumor cells rather than BMI1+ CSCs (Figures S1A and S1B). The cervical lymph nodes are the most common site of HNSCC metastasis which is a key prognostic factor for patients. To accurately detect whether the treatment inhibited HNSCC lymph node metastasis, cervical lymph nodes of mice were immunostained with anti-pan-keratin (PCK) antibodies. Anti-PCK immunostaining revealed that anti-PD1 plus cisplatin, but not cisplatin or anti-PD1 alone, significantly reduced the lymph node metastasis (Figures 1G–1I).
Figure 1. Enrichment of BMI1+ CSCs after the combination treatment of anti-PD1 and cisplatin.

(A) Schematic diagrams show the treatment and lineage tracing of primary HNSCC in Bmi1CreER;RosatdTomato mice. Tamoxifen (Tam) was administered 1 day prior to sacrificing (Sac) mice in order to label BMI1+ CSCs.
(B) Representative image of tongue visible lesions in different treatment groups. Black dashed lines demark lesion areas. Scale bar, 2 mm.
(C) Quantification of HNSCC lesion area from mice with treatment as indicated. Values are mean ± SD from the pool of two independent experiments. n = 10. *p < 0.05 and **p < 0.01 by one-way ANOVA.
(D) Representative H&E staining of HNSCC from mice with treatment as indicated. Scale bar, 200 μm. Enlarged images are shown in the lower panels. Scale bar, 50 μm.
(E) Quantification of HNSCC number and area from mice with treatment as indicated. Values are mean ± SD from the pool of two independent experiments. n = 10. *p < 0.05 and **p < 0.01 by one-way ANOVA.
(F) Quantification of HNSCC invasion grades from mice with treatment as indicated. Data was pooled from two independent experiments. n = 10. *p < 0.05 by Cochran-Armitage test.
(G) Immunostaining of metastatic cells in cervical lymph nodes using anti-PCK. Scale bar, 200 μm.
(H) Percentage of metastatic lymph nodes from mice with treatment as indicated. Number of metastatic lymph nodes in each group is indicated in the figure. Data was pooled from two independent experiments. *p < 0.05 by Chi-square test.
(I) Quantification of metastatic area in lymph nodes from mice with treatment as indicated. Values are mean ± SEM from the pool of two independent experiments. *p < 0.05 by one-way ANOVA.
(J) Immunofluorescent images for CD8+ T from mice with treatment as indicated. Scale bar, 10 μm.
(K) Quantifications of CD8+ T cells in HNSCC from mice with treatment as indicated. Values are mean ± SD from the pool of two independent experiments. n = 10, **p < 0.01 by one-way ANOVA.
(L) Representative images of Tomato+ BMI1+ CSCs in HNSCC from mice with treatment as indicated. White dashed lines demark tumor-stromal junction. Scale bar, 10 μm.
(M) Quantification of the percentage of Tomato+ cells in HNSCC from mice with treatment as indicated. Values are mean ± SD from the pool of two independent experiments. n = 10. *p < 0.05 and **p < 0.01 by one-way ANOVA.
Also see Figure S1
Next, we investigated the effect of the combination treatment on antitumor T cell immunity. Anti-PD1 or cisplatin alone did not significantly increase CD8+ T cell infiltration in HNSCC. However, immunostaining showed that anti-PD1 plus cisplatin significantly increased CD8+ T cell infiltration (Figures 1J and 1K). Since anti-PD1 plus cisplatin efficiently inhibited HNSCC, we wondered whether the combination could efficiently eliminate BMI1+ CSCs by in vivo labeling BMI1+ CSCs since BMI1+ CSCs were found to play a critical role in HNSCC chemoresistance and relapse (Chen et al., 2017). Anti-PD1 treatment alone did not affect BMI1+ CSCs compared with IgG control. Consistent with our previous studies, cisplatin significantly enriched BMI1+ CSCs in HNSCC. Interestingly, anti-PD1 plus cisplatin further enriched BMI1+ CSCs compared with cisplatin alone, probably due to anti-PD1 plus cisplatin capability to efficiently kill non-stem tumor cells (Figures 1L and 1M), indicating that BMI1+ CSCs also evaded cytotoxic CD8+ T cell killing.
BMI1 Inhibitor plus Anti-PD1 Eliminates CSCs and Inhibits HNSCC progression
To explore whether targeting BMI1+ CSCs augmented PD1 blockade therapy, we took advantage of the specific Bmi1 inhibitor PTC209, which has be shown to effectively destroy BMI1+ CSCs by others and us (Chen et al., 2017; Kreso et al., 2014). The reduction of BMI1 expression by PTC209 in tumors was confirmed by immunostaining (Figure S2A) and Western blot (Figure S2B). Flow cytometry analysis showed that there was no significant alteration in the percentage of CD8+ T cells and IFNγ-produced CD8+ T cells in the lymph nodes, blood and spleen after PTC209 treatment (Figures S2C–S2F). Tumor-bearing Bmi1CreER;RosatdTomato mice were treated with anti-PD1, PTC209, anti-PD1 plus PTC209, or control vehicle. PTC209 plus anti-PD1 significantly reduced more lesion surface areas compared with PTC209 alone (Figures 2A and 2B). Histological analysis found that anti-PD1 plus PTC209 significantly reduced HNSCC numbers, areas and invasiveness compared with PTC209 or anti-PD1 (Figures 2C–2E). Consistently, anti-Ac-casp3 staining revealed that PTC209 plus anti-PD1 potently induced apoptosis in HNSCC compared with PTC209 or anti-PD1 (Figures 2F ad 2G). We further examined whether apoptosis was induced in CSCs or non-stem tumor cells. While anti-PD1 did not induce apoptosis in CSCs, PTC209 was able to induce apoptosis in Tomato+ CSCs. However, we could not find apoptotic Tomato+ cells after PTC209 plus anti-PD1 treatment, probably because the combination treatment potently induced apoptosis in BMI1+ CSCs and impaired their self-renewal (Figures S3A–S3C). PTC209 plus anti-PD1 effectively eliminated the majority of lymph node metastasis of HNSCC as determined by anti-PCK immunostaining (Figures 2H–2J). Unexpectedly, immunostaining found that PTC209, but not anti-PD1, could induce CD8+ T cell infiltration in tumors, which were further significantly increased in HNSCC treated with PTC209 plus anti-PD1 (Figures 2K and 2L). To assess the functional activity of CD8+ T cells, we analyzed the expression of the Granzyme-B (GzmB) in CD8+ T cells. Immunostaining found that anti-PD1 plus PTC209 also significantly increased GzmB+CD8+ T cell infiltration in tumors (Figures S3D and S3E). In vivo labeling showed that PTC209 was able to reduce BMI1+ CSCs while anti-PD1 did not. In sharp contrast to anti-PD1 plus cisplatin, in vivo labeling showed that anti-PD1 plus PTC209 efficiently eliminated BMI1+ CSCs in HNSCC (Figures 2M and 2N). SOX2+ cells have been identified to represent CSCs in the skin SCC (Boumahdi et al., 2014), and our previous study has shown that most of the BMI1+ cells had increasing SOX2 protein expression in HNSCC (Chen et al., 2017). Because of weak positive staining in some non-stem tumor cells, we only counted SOX2+ cells which were strongly stained. Immunostaining revealed that the number of SOX2+ cells were significantly reduced after PTC209 treatment, which were further decreased in tumors treated with PTC209 plus anti-PD1 (Figures S3F and S3G)
Figure 2. PTC-209 eliminates BMI1+ CSCs and collaborates with anti-PD1 to suppress HNSCC growth and metastasis by recruiting CD8+ Cells.

(A) Representative image of tongue visible lesions in different treatment groups as indicated. Black dashed lines demark lesion areas. Scale bar, 2 mm.
(B) Quantification of HNSCC lesion areas from mice. Values are mean ± SD from the pool of two independent experiments. n = 12, *p < 0.05 and **p < 0.01 by one-way ANOVA.
(C) Representative H&E staining of HNSCC from mice with treatment as indicated. Scale bar, 200 μm. Enlarged images are shown in the lower panels. Scale bar, 50 μm.
(D) Quantification of HNSCC number and area. Values are mean ± SD from the pool of two independent experiments. n = 12, *p < 0.05 and **p < 0.01 by one-way ANOVA.
(E) Quantification of HNSCC invasion grades. *p < 0.05 and **p < 0.01 by Cochran-Armitage test.
(F) Representative images of active caspase3 (Ac-casp3, green) in HNSCC. Nuclei were stained with DAPI (blue). White dashed lines demark tumor-stromal junction. Scale bar, 10 μm.
(G) Percentage of Ac-Casp3+ cells in HNSCC from mice with indicated treatments. Values are mean ± SD from the pool of two independent experiments. n = 12, **p < 0.01 by one-way ANOVA.
(H) Immunostaining of metastatic cells in cervical lymph nodes by anti-PCK. Scale bar, 200 μm.
(I) Quantification of percentage of metastatic lymph nodes from mice with treatment as indicated. Number of metastatic lymph nodes in each group is indicated in the figure. *p < 0.05 and **p < 0.01 by Chi-square test.
(J) Quantification of metastatic areas in lymph nodes from mice with treatment as indicated. Values are mean ± SEM from the pool of two independent experiments. *p < 0.05 and **p < 0.01 by one-way ANOVA.
(K) Representative immunofluorescent images for CD8 (red) and PCK (green) of HNSCC from mice with treatment as indicated. Nuclei were visualized by DAPI (blue). Scale bar, 10 μm.
(L) Quantifications of CD8+ T cells percentage from mice with treatment as indicated. Values are mean ± SD from the pool of two independent experiments. n = 12, **p < 0.01 by one-way ANOVA.
(M) Representative images of Bmi1+ cell-driven lineage tracing in HNSCC from mice with treatment as indicated. White dashed lines demark tumor-stromal junction. Scale bar, 10 μm.
(N) Quantification of the percentage of Tomato+ cells in HNSCC from mice with treatment as indicated. Values are mean ± SD from the pool of two independent experiments. n = 12, *p < 0.05 and **p < 0.01 by one-way ANOVA.
Also see Figures S2 and S3
Intratumoral CD8+ T Cells Provide Antitumor Immunity Induced by BMI1 Inhibitor plus Anti-PD1
To test whether intratumoral CD8+ cells were required for PTC209 plus anti-PD1 -mediated antitumor immunity, we concurrently treated tumor-bearing mice with anti-CD8 antibodies to immunodeplete CD8+ cells. Immunostaining showed that anti-CD8 significantly abrogated CD8+ T cells infiltration in HNSCC induced by PTC-209 plus anti-PD1 (Figures 3A and 3B). Anti-CD8 significantly restored visible lesion areas inhibited by PTC-209 plus anti-PD1 (Figures 3C and 3D). Histological analysis found that anti-CD8 significantly reversed the inhibition of HNSCC growth by PTC209 plus anti-PD1 (Figures 3E–3G). Consistently, anti-CD8 attenuated PTC209 plus anti-PD1-induced apoptosis in HNSCC (Figures 3H and 3I). Furthermore, anti-CD8 also significantly lessened the inhibition of lymph node metastasis of HNSCC mediated by PTC209 plus anti-PD1 (Figures 3J–3L).
Figure 3. Depletion of intratumoral CD8+ T cells reverse PTC209 plus anti-PD1-mediated antitumor immunity.

(A) Representative immunofluorescent images for CD8 (red) and PCK (green) in HNSCC from mice with indicated treatments. Nuclei were visualized by DAPI (Blue). Scale bar, 10 μm.
(B) Quantifications of percentage of CD8+ T cells in HNSCC. Values are mean ± SD from the pool of two independent experiments. n = 8, *p < 0.05 and **p < 0.01 by one-way ANOVA.
(C) Representative image of tongue visible lesions. Scale bar, 2 mm.
(D) Quantification of HNSCC lesion areas. Values are mean ± SD from the pool of two independent experiments. n = 8, **p < 0.01 by one-way ANOVA.
(E) Representative H&E staining of HNSCC. Scale bar, 200 μm. Enlarged images are shown in the lower panels. Scale bar, 50 μm.
(F) Quantification of HNSCC number and area. Values are mean ± SD from the pool of two independent experiments. n = 8, *p < 0.05 and **p < 0.01 by one-way ANOVA.
(G) Quantification of HNSCC invasion grades. *p < 0.05 by Cochran-Armitage test.
(H) Representative images of Ac-casp3 (red) and PCK (green) in HNSCC. Nuclei were visualized by DAPI (Blue). Scale bar, 10 μm.
(I) Percentage of Ac-casp3+ apoptotic cells in all tumor cells. Values are mean ± SD from the pool of two independent experiments. n = 8, **p < 0.01 by one-way ANOVA.
(J) Immunostaining of metastatic cells in cervical lymph nodes using anti-PCK. Scale bar, 200 μm.
(K) Percentage of metastatic lymph nodes from mice. Number of metastatic lymph nodes in each group is indicated in the figure. *p < 0.05 and **p < 0.01 by Chi-square test.
(L) Quantification of metastatic areas in cervical lymph nodes. Values are mean ± SEM from the pool of two independent experiments. *p < 0.05 and **p < 0.01 by one-way ANOVA.
To further determine whether targeting tumor cell-intrinsic BMI1 promoted CD8+ T cells infiltration, we crossed Bmi1flox/flox (Bmi1f/f) mice with keratin 14-Cre/ERT2 mice (K14CreER) to generate K14CreER;Bmi1f/f mice in which epithelial BMI1 can be inducibly deleted by tamoxifen treatment. To achieve efficient recombination activity, three successive applications of tamoxifen were applied to both K14CreER;Bmi1f/f and the control Bmi1f/f mice 22 weeks after the initial 4NQO treatment (Figure 4A). BMI1 knockout (BMI1 KO) in mouse HNSCC was confirmed by immunostaining (Figure S4A) and Western blot (Figure S4B). Consistently, whereas BMI1 KO alone reduced the lesion surface areas, BMI1 KO plus anti-PD1 had superior inhibitory effects (Figures 4B and 4C). Histological analysis revealed that BMI1 KO plus anti-PD1 significantly inhibited the numbers, areas and invasive grades of HNSCC compared with BMI1 KO or anti-PD1 alone (Figures 4D–4F). Consistently, BMI1 KO plus anti-PD1 also potently induced apoptosis in HNSCC (Figures S4C and S4D). Moreover, BMI1 KO plus anti-PD1 also exhibited superior inhibitory effects on lymph node metastasis compared with BMI1 KO alone (Figures 4G–4I). Importantly, immunostaining revealed that BMI1 KO alone could induce CD8+ T cell infiltration in HNSCC, which was further increased in HNSCC treated with BMI1 KO plus anti-PD1 (Figures 4J and 4K). Moreover, BMI1 KO plus anti-PD1 also significantly increased GzmB+CD8+ T cells in HNSCC (Figures S4E and S4F). Taken together, these findings confirm that the inhibition of BMI1 in tumor cells collaborates with PD1 blockade to inhibit HNSCC invasive growth and metastasis by recruiting and activating CD8+ T cells.
Figure 4. Epithelial deletion of BMI1 collaborates with anti-PD1 to suppress HNSCC growth and metastasis by recruiting CD8+ cells.

(A) Experimental design for Bmi1 knockout in tumor cells and anti-PD1 treatment in vivo. Three administrations of Tam were given to tumor-bearing mice. Mice were randomly divided into four experimental groups (n = 14 per group from two independent experiments): BMI1f/f with IgG isotype, BMI1f/f with anti-PD1, K14Cre;BMI1f/f with IgG isotype, and K14Cre;BMI1f/f with anti-PD1.
(B) Representative image of tongue visible lesions. Black dashed lines demark lesion area. Scale bar, 2 mm.
(C) Quantification of lesion areas from mice treated with different conditions as indicated. Values are mean ± SD from the pool of two independent experiments. *p < 0.05 and **p < 0.01 by two-way ANOVA.
(D) Representative H&E staining of HNSCC from mice treated with different conditions as indicated. Scale bar, 200 μm. Enlarged images are shown in the lower panels. Scale bar, 50 μm.
(E) Quantification of HNSCC area and number from mice treated with different conditions as indicated. Values are mean ± SD from the pool of two independent experiments. *p < 0.05 and **p < 0.01 by two-way ANOVA.
(F) Quantification of HNSCC invasion grades from mice treated with different conditions as indicated. *p < 0.05 and **p < 0.01 by Cochran-Armitage test.
(G) Represent immunostaining of metastatic cells in cervical lymph nodes by anti-PCK. Scale bar, 200 μm.
(H) Quantification of percentage of metastatic lymph nodes. Number of metastatic lymph nodes in each group is indicated in the figure. *p < 0.05 and **p < 0.01 by Chi-square test.
(I) Quantification of metastatic area in lymph nodes from mice treated with different conditions as indicated. Values are mean ± SEM from the pool of two independent experiments. *p < 0.05 and **p < 0.01 by two-way ANOVA.
(J) Representative immunofluorescent images for CD8 (red) and PCK (green) in HNSCC. Nuclei were visualized by DAPI (blue). Scale bar, 10 μm.
(K) Quantification of the percentage of CD8+ T cells from mice treated with different conditions as indicated. Values are mean ± SD from the pool of two independent experiments. **p < 0.01 by two-way ANOVA. ##p < 0.01 treatment x genotype interaction.
Also see Figure S4.
Activating Tumor Cell-Intrinsic Immune Response by BMI1 Inhibition
To further elucidate the molecular and epigenetic mechanisms by which BMI1 inhibition recruited CD8+ T cells to augment PD1 blockade therapy, we knocked down BMI1 expression in SCC23 and SCC1 cells using the lentivirus-based short-hairpin RNA for BMI1 (shBMI1). Western blot analysis confirmed that shBMI1 reduced the expression of BMI1. Since BMI1 is required for H2AUb, the level of H2AUb was reduced in SCC23 and SCC1 cells (Figure S5A). Similarly, PTC209 also reduced BMI1 and H2AUb in SCC23 and SCC1 cells in a dose-dependent manner (Figure S5A). Next, we performed RNA-Seq to determine whether PTC209 treatment or BMI1 knockdown affected the gene expression in SCC23 cells. Interestingly, GO analysis revealed that the inhibition of BMI1 by PTC209 induced the expression of genes associated with immune response and chemotaxis (Figure S5B). Similarly, BMI1 knockdown also increased the expression of genes associated with inflammatory response, IFNγ signaling and chemotaxis (Figure S5C). Heatmap from the RNA-seq data showed that IFN-regulated chemokines (CCL5, CXCL9, CXCL10, and CXCL11), which promote the recruitment of CD8+ T lymphocytes into tumor sites (Gao et al., 2019; Qin et al., 2019), were significantly increased by BMI1 knockdown or PTC209 (Figure 5A). PTC209 or BMI1 knockdown also significantly increased the expression of CCL5, CXCL9, CXCL10, and CXCL11 in both SCC1 and SCC23 cells (Figures 5B and S5D–S5F) as determined by both qRT-PCR and enzyme-linked immunosorbent assays (ELISA). We also performed immunostaining to examine expression of BMI1, CD8, CCL5, and CXCL10 in human HNSCC samples. Immunostaining demonstrated that there was a negative correlation between BMI1 and CD8, CCL5, and CXCL10 in human HNSCC tissues (Figures S6A–S6C).
Figure 5. BMI1 Inhibition induces expression of effector T cell attracting chemokines in SCC cells by activating cGAS-STING-IRF3 signaling and erasing repressive H2AUb on their promoters.

(A) Heatmap from RNA-sequencing data showing the differentially expressed genes related to chemokines-mediated signaling in SCC23 cells upon PTC209 or BMI1 knockdown. Blue rectangles indicate the genes related to IFN-regulated chemokines.
(B) qRT-PCR showed that the expression of CCL5, CXCL9, CXCL10, and CXCL11 in SCC23 cells were induced by PTC209 or BMI1 knockdown. Means ± SD were shown. **p < 0.01 by unpaired Student’s t test.
(C) Immunofluorescent staining of pH2A.X (green) in 4NQO-induced HNSCC by PTC209 or BMI1 knockout and their quantifications. Nuclei were stained with DAPI (blue). Scale bar, 10 μm. Means ± SD were shown (n = 8). **p<0.01 by unpaired Student’s t test.
(D) Confocal images showing cytosolic DNA accumulations and their quantifications in SCC23 cells upon PTC209 or shBMI1 treatment. Double strand DNA (dsDNA) was stained by Picogreen (green). Mitochondria and nuclei were respectively stained with Mito-tracker (Red) and DAPI (blue). White arrows indicate cytosolic dsDNA. Scale bar, 10 μm. More than 100 cells were analyzed per group. Means ± SD were shown. **p < 0.01 by one-way ANOVA.
(E) Induction of phosphorylation of STING (S366), TBK1 (S172) and IRF3 (S396) in SCC23 cells by PTC209 or shBMi1 treatment.
(F) qRT-PCR showing the induction of IFNβ mRNA expression in SCC23 cells by PTC209 or shBMI1 treatment. **p < 0.01 by unpaired Student’s t test.
(G) The reduction of BMI1 occupied on the promoters of CCL5, CXCL9, CXCL10, and CXCL11 in SCC23 cells by PTC209.
(H) The reduction of H2AUb levels on the promoters of CCL5, CXCL9, CXCL10, and CXCL11 in SCC23 cells by PTC209.
(I) The reduction of BMI1 occupied on the promoters of CCL5, CXCL9, CXCL10, and CXCL11 in SCC23 cells by shBMI1.
(J) The reduction of H2AUb levels on the promoters of CCL5, CXCL9, CXCL10, and CXCL11 in SCC23 cells by shBMI1. n = 3, means ± SD are shown. *p < 0.05 and **p < 0.01 by unpaired Student’s t test.
Also see Figures S5, S6 and S7.
BMI1 has been found to play a regulatory role in DNA damage response and repair (Ismail et al., 2010; Lin et al., 2015). Upon DNA damage, BMI1 is recruited to sites of double-stranded DNA breaks (DSBs) where they promote the ubiquitylation of pH2A.X, thereby facilitating the repair of DSBs by stimulating homologous recombination and non-homologous end joining. To explore how BMI1 inhibition induced IFN-regulated chemokines, we observed that pH2A.X, a specific marker for DNA damage, was significantly increased in PTC209-treated HNSCC (Figure 5C). Similarly, BMI1 KO also increased pH2A.X in HNSCC, indicating that BMI1 inhibition induces DNA damage in HNSCC (Figure 5C). Furthermore, PTC209 or shBMI1 treatment also increased pH2A.X in SCC23 and SCC1 cells as determined by immunostaining (Figure S7A) and Western blot (Figure S7B). PTC209 or shBMI1 treatment also significantly increased the Olive tail moment in SCC23 and SCC1 cells as determined by the alkaline comet assay for the detection of dsDNA damage (Figure S7C). To examine whether DNA damages induced by BMI1 inhibition caused the accumulation of cytosolic double strand DNA (dsDNA) in SCC cells, we stained SCC cells with PicoGreen, a dsDNA-specific vital dye. Since PicoGreen also stains mitochondrial DNA (Ashley et al., 2005), we also stained mitochondrial dsDNA with MitoTracker simultaneously. Multiple PicoGreen staining areas in the cytoplasm of SCC23 and SCC1 cells, which were not overlapped with MitoTracker, were detected upon PTC209 or shBMI1 treatment, indicating that PTC209 and shBMI1 induced the accumulation of cytosolic dsDNA (Figures 5D, S7D and S7E). It is well known that cytosolic DNA could activate the cyclic GMP-AMP synthase/stimulator of interferon genes (cGAS-STING) signaling axis by the sequential phosphorylation of STING, TBK1, and IRF3 and subsequently induce transcription of IFN and IFN-regulated chemokines (Wu et al., 2013). Western blot analysis showed that BMI1 inhibition induced the phosphorylation of STING, TBK1, and IRF3 in SCC23 and SCC1 cells (Figures 5E and S7F). Consistently, BMI1 inhibition also induced IFNβ in SCC23 and SCC1 cells (Figures 5F and S7G). We also observed that pIRF3 was significantly increased in HNSCC upon PTC209 treatment or BMI1 KO, confirming that BMI1 inhibition activated the cGAS-STING-IRF3 pathway in vivo (Figure S7H).
Very recently, PRC1 was found to activate CCL2 transcription to promote cancer stemness and bone metastasis in prostate cancers by recruiting macrophages and regulatory T cells (Su et al., 2019). However, our RNA-seq analysis did not detect that BMI inhibition regulated CCL2 transcription in HNSCC. In contrast, BMI1 inhibition induced the transcription of chemokines associated with CD8+ T cell recruitments. We further explored whether BMI1 could repress the transcription of chemokines by H2AUb and whether BMI1 inhibition might erase the repressive H2AUb by chromatin immunoprecipitation-qPCR (ChIP-qPCR). ChIP-qPCR revealed that BMI1 specifically occupied on the promoters of CCL5, CXCL9, CXCL10 and CXCL11. PTC209 treatment significantly reduced the levels of BMI1 on their promoters in SCC23 cells (Figure 5G). Consistently, the levels of H2AUb marks on the promoters of CCL5, CXCL9, CXCL10 and CXCL11 were significantly decreased in SCC23 cells by PTC209 (Figure 5H). Furthermore, shBMI1 also confirmed that BMI1 was present on the promoters of CCL5, CXCL9, CXCL10 and CXCL11 and that the knockdown of BMI1 reduced the levels of H2AUb on their promoters (Figures 5I and 5J), indicating that BMI1 inhibition could also de-repress chemokine expression intrinsically. Taken together, our results suggest that BMI1 inhibition stimulated chemokines in tumor cells by two interrelated mechanisms: inducing cGAS-STING signaling to activate IRF3-mediated transcription and erasing repressive H2AUb marks on the promoter of chemokines.
To test whether IFN-regulated chemokines and the recruitment of CD8+ T cells were required for anti-PD1 plus PTC209-mediated antitumor immunity, we concurrently treated tumor-bearing mice with TAK779, an inhibitor of CCR5 and CXCR3, which are the receptors for CCL5, CXCL9, CXCL10 and CXCL11, respectively (Akahori et al., 2006). Immunostaining showed that TAK779 significantly abrogated CD8+ T cells infiltration in HNSCC induced by anti-PD1 plus PTC209 (Figures 6A and 6B). TAK779 significantly restored visible lesion areas inhibited by anti-PD1 plus PTC209 (Figures 6C and 6D). Histological analysis found that TAK779 significantly reversed the inhibition of HNSCC growth by anti-PD1 plus PTC209 (Figures 6E–6G). Consistently, TAK779 attenuated apoptosis in HNSCC induced by PTC209 plus anti-PD1 (Figures 6H and 6I). TAK779 also significantly lessened the inhibition of lymph node metastasis of HNSCC mediated by anti-PD1 plus PTC209 (Figures 6J–6L).
Figures 6. Inhibition of chemokine signaling impairs PTC209 plus anti-PD1-mediated antitumor immunity.

(A) Representative immunofluorescent images for CD8 (red) and PCK (green) in HNSCC from mice with indicated treatments. Nuclei were visualized by DAPI (Blue). Scale bar, 10 μm.
(B) Quantifications of percentage of CD8+ T cells in HNSCC. Values are mean ± SD from the pool of two independent experiments. n = 8, *p < 0.05 and **p < 0.01 by one-way ANOVA.
(C) Representative image of tongue visible lesions. Scale bar, 2 mm.
(D) Quantification of HNSCC lesion areas. Values are mean ± SD from the pool of two independent experiments. n = 8, *p < 0.05 and **p < 0.01 by one-way ANOVA.
(E) Representative H&E staining of HNSCC. Scale bar, 200 μm. Enlarged images are shown in the lower panels. Scale bar, 50 μm.
(F) Quantification of HNSCC number and area. Values are mean ± SD from the pool of two independent experiments. n = 8, *p < 0.05 and **p< 0.01 by one-way ANOVA.
(G) Quantification of HNSCC invasion grades. n = 8, *p < 0.05 by Cochran-Armitage test.
(H) Representative images of Ac-casp3 (red) and PCK (green) in HNSCC. Nuclei were visualized by DAPI (Blue). Scale bar, 10 μm.
(I) Percentage of Ac-casp3+ apoptotic cells in all tumor cells. Values are mean ± SD from the pool of two independent experiments. n = 8, *p < 0.05 and **p < 0.01 by one-way ANOVA.
(J) Immunostaining of metastatic cells in cervical lymph nodes using anti-PCK. Scale bar, 200 μm.
(K) Percentage of metastatic lymph nodes from mice. Number of metastatic lymph nodes in each group is indicated in the figure. *p < 0.05 and **p < 0.01 by Chi-square test.
(L) Quantification of metastatic areas in cervical lymph nodes. Values are mean ± SEM from the pool of two independent experiments. *p < 0.05 and **p < 0.01 by one-way ANOVA.
BMI1 Inhibitor plus anti-PD1 Prevents Relapse of HNSCC
HNSCC frequently relapse although they initially respond to chemotherapies (Hedberg et al., 2016; Lee et al., 2018). Our in vivo labeling revealed that BMI1+ CSCs were enriched after anti-PD1 plus cisplatin while PTC209 plus anti-PD1 efficiently eliminated BMI1+ CSCs. To determine whether BMI1+ CSCs were responsible for HNSCC relapse, in vivo lineage tracing was performed. Tumor-bearing Bmi1CreER;RosatdTomato mice were treated with anti-PD1 plus cisplatin, anti-PD1 plus PTC209, or control vehicle for 4 weeks and then given tamoxifen to trace Tomato+ cells derived from BMI1+ CSCs in HNSCC over a period of 4 weeks (Figure 7A). In vivo lineage tracing revealed that more than 70% of tumor cells were Tomato+ cells in HNSCC treated with anti-PD1 plus cisplatin, which were similar to HNSCC treated with control vehicle. In contrast, Tomato+ tumor cells were sparsely present or not detected in regressed HNSCC upon anti-PD1 plus PTC209 (Figures 7B and 7C), suggesting that enriched BMI1+ CSCs are responsible for HNSCC relapse. Although antitumor effects between these two combination treatments did not show a significant difference, we observed a trend that HNSCC treated by anti-PD1 plus PTC209 might have less HNSCC relapse compared with anti-PD1 plus cisplatin (Figures 7D–7F).
Figures 7. The combination treatment of anti-PD1 and PTC209 prevents BMI1+ CSC-mediated tumor relapse.

(A) Experimental design for BMI1+ CSCs lineage tracing in HNSCC after treatment with anti-PD1 plus cisplatin or anti-PD1 plus PTC209 (n = 7 per group). After treatment, mice were injected with Tam and maintained for 4 additional weeks.
(B) Representative images of Tomato+ tumor cells (red) derived from BMI1+ CSCs one month after treatment. Nuclei are stained with DAPI (blue). White dashed lines demark tumor-stromal junction. Scale bar, 10 μm.
(C) Quantification of the percentage of Tomato+ tumor cells in HNSCC. Values are mean ± SD from the pool of two independent experiments. ns, not significant, *p < 0.05 and **p < 0.01 by one-way ANOVA.
(D) Quantification of HNSCC lesion areas. Values are mean ± SD from the pool of two independent experiments. ns, not significant, *p < 0.05 and **p < 0.01 by one-way ANOVA.
(E) Quantification of HNSCC number and area from mice with treatment as indicated. Values are mean ± SD from the pool of two independent experiments. ns, not significant, *p < 0.05 and **p< 0.01 by one-way ANOVA.
(F) Quantification of HNSCC invasion grades. ns, not significant, *p < 0.05 by Cochran-Armitage test.
(G) Experimental design for examining HNSCC relapse after treatment. BmiCreER;RosatdTomato mice with 4NQO induced HNSCC were randomly divided into three experimental groups (n = 8). After treatment, mice were maintained for 8 additional weeks for the tumor relapse. Tamoxifen (Tam) was administered 1 day prior to sacrificing (Sac) the mice in order to label BMI1+ CSCs.
(H) Representative image of tongue visible lesions. Black dashed lines demark lesion area. Scale bar, 2 mm.
(I) Quantification of HNSCC lesion areas. Mean ± SD from the pool of two independent experiments. ns, not significant, *p < 0.05 and **p < 0.01 by one-way ANOVA.
(J) H&E staining of HNSCC. Scale bar, 200 μm. Enlarged images are shown in the lower panels. Scale bar, 50 μm.
(K) Quantification of HNSCC number and area. Mean ± SD from the pool of two independent experiments. ns, not significant, *p < 0.05 and **p< 0.01 by one-way ANOVA.
(L) Quantification of HNSCC invasion grades. ns, not significant, *p < 0.05 by Cochran-Armitage test.
(M) Immunostaining of metastatic cells in cervical lymph nodes by anti-PCK. Scale bar, 200 μm.
(N) Percentage of metastatic lymph nodes in HNSCC. Number of metastatic lymph nodes in each group is indicated. ns, not significant, **p < 0.01 by Chi-square test.
(O) Quantification of metastatic areas in lymph nodes. Mean ± SEM from the pool of two independent experiments. ns, not significant, *p < 0.05 and **p < 0.01 by one-way ANOVA.
(P) Representative images of Tomato+ BMI1+ CSCs in HNSCC after treatment. White dashed lines demark tumor-stromal junction. Scale bar, 10 μm.
(Q) Quantification of the percentage of Tomato+ BMI1+ CSCs in HNSCC after treatment. Mean ± SD from the pool of two independent experiments. *p < 0.05 and **p < 0.01 by one-way ANOVA.
To further confirm whether HNSCC treated with anti-PD1 plus PTC209 had less relapse compared with anti-PD1 plus cisplatin, we extended our combination treatment for additional 4 weeks in order to obtain recurrent HNSCC (Figure 7G). Compared with anti-PD1 plus cisplatin, anti-PD1 plus PTC209 had much smaller lesion areas, and even in some cases lesions were undetectable (Figures 7H and 7I). Following a prolonged observation, histological analysis found that there was no difference in the numbers, areas and invasion grades of HNSCC between the treatment with control vehicle and anti-PD1 plus cisplatin, thereby validating that HNSCC treated with anti-PD1 plus cisplatin relapsed (Figures 7J–7L). In contrast, the inhibition of HNSCC growth by anti-PD1 plus PTC209 was sustained compared with anti-PD1 plus cisplatin, and tumors could not be detected in 3 of the 8 mice after anti-PD1 plus PTC209 (Figures 7J–7L). The lymph node metastasis is an important predictor for the relapse and prognosis of HNSCC patients. Furthermore, immunostaining with anti-PCK revealed that only 30% of lymph nodes had metastatic tumor cells in mice treated with anti-PD1 plus PTC209 whereas 74% of lymph nodes had metastatic tumor cells in mice treated with anti-PD1 plus cisplatin (Figures 7M–7O). Of note, because the majority of mice treated with anti-PD1 plus cisplatin were very weak due to recurrent HNSCC, we needed to euthanize these mice which did not allow us to perform a long-term in vivo tracing of the fate of BMI1+ CSCs. In vivo labeling BMI1+ CSCs revealed that anti-PD1 plus PTC209 efficiently eliminated BMI1+ CSCs in regressed HNSCC while BMI1+ CSCs remained in recurrent HNSCC treated with anti-PD1 plus cisplatin (Figures 7P and 7Q).
DISCUSSION
Treating or preventing recurrent and metastatic HNSCC remains a great therapeutic challenge regardless of the promising progress in immune checkpoint therapy. In this study, we showed that the combination treatment of anti-PD1 and cisplatin enriched BMI1+ CSCs, although the combination could inhibit HNSCC growth by recruiting CD8+ T cells. Not surprisingly, dwindling HNSCC after treatment with anti-PD1 plus cisplatin regrew and eventually relapsed. In contrast, the combination treatment of anti-PD1 and PTC209 not only potently inhibited HNSCC invasive growth, but also significantly reduced HNSCC relapse and lymph node metastasis compared with anti-PD1 plus cisplatin. Mechanistically, while BMI1 inhibition destroyed CSCs, it also induced tumor cell-intrinsic immune responses and augmented PD1 blockade to kill non-stem tumor cells in HNSCC by recruiting and activating CD8+ T cells. Given the fact that a large number of PD1 blockade-based combination therapies are currently in clinical trials, our preclinical studies suggest that targeting BMI1 might be a new strategy of the combination therapy in order to effectively inhibit metastatic tumor growth and prevent relapse.
HNSCC has an immunosuppressive tumor microenvironment with low tumor-infiltrating lymphocytes (Polverini et al., 2018; Tan et al., 2018; Wang et al., 2019). Previous studies have shown that cisplatin could enhance antitumor immunity by increasing the expression of antigen-processing machinery components or impair antitumor immunity by inducing the expression of PD-L1 (de Biasi et al., 2014; Hato et al., 2014; Hodge et al., 2013). In our model, cisplatin did collaborate with anti-PD1 to recruit CD8+ T cells into HNSCC although cisplatin alone could not. However, we found that anti-PD1 plus cisplatin could not effectively kill BMI1+ CSCs based on in vivo lineage tracing. Supporting our studies, it was reported that CSCs selectively acquired the expression of CD80 to inhibit cytotoxic T cell activity recently (Miao et al., 2019). Interestingly, CD80 was highly expressed in BMI1+ CSCs based on our RNA-seq results (Chen et al., 2017). Therefore, it is possible that CSCs in HNSCC might be intrinsically resistant to CD8+ T cell killing. Although the conventional therapy combined with PD-1 blockade has been approved for treating HNSCC, the durable response is limited, indicating that PD-1 blockade combined with the conventional therapy may be unable to eliminate CSCs in HNSCC.
We demonstrated that combination therapy of BMI1 inhibitor and anti-PD1 effectively inhibited tumor growth metastasis by eliminating CSCs. Although use of the BMI1 inhibitor alone also suppressed HNSCC growth and metastasis, it was not as effective as the combination therapy. Previously, it has been reported that PTC209 inhibited colorectal tumor growth and reduced the frequency of CSCs in mouse xenograft models (Kreso et al., 2014). However, because the study transplanted human tumor cells into immunodeficient mice, the potential impact of antitumor immune responses could not be observed. In this study, unexpectedly, we found that BMI1 inhibitor not only inhibited CSC self-renewal, but also activated CSC-intrinsic immune response. Our results showed that CD8+ T cells recruited to tumor tissues were significantly increased by PTC209 treatment. BMI1 inhibitor could boost the immunotherapy effect of anti-PD1 in addition to targeting BMI1+ CSCs, thereby sensitizing non-stem tumor cells to immunotherapy-induced apoptosis.
SCC cells, frequently metastasize to cervical lymph nodes which are enriched with immune cells (Ding et al., 2013), indicating that immune evasion plays a critical role in HNSCC progression and metastasis. Growing evidence demonstrates that targeting tumor cell-intrinsic genetic and epigenetic alterations is crucial to unleash antitumor immunity, thereby inhibiting tumor growth and metastasis (Sen et al., 2019). The inhibition of PRC2-mediated histone H3 lysine 27 trimethylation, leads to increased responses to cancer immunotherapy (Nagarsheth et al., 2016; Peng et al., 2015). BMI1 is a core component of the PRC1 that mediates gene silencing via H2Aub (Wang et al., 2004). PRC1 also cooperates with PRC2 to control chromatin compaction and repress gene expression (Blackledge et al., 2015). BMI1, as an important epigenetic factor, regulates cancer invasive growth and progression in addition to cancer stemness. BMI1 is also associated with DNA damage response and repair. BMI1 ablation impairs the recruitment of DNA repair factors to DSBs which are dependent on ubiquitin signaling, thereby promoting DNA damage (Ismail et al., 2010; Lin et al., 2015). Here, we found that BMI1 inhibition induced chemokines by two interconnected mechanisms: 1) stimulating cGAS-STING signaling to activate IRF3-mediated transcription by induction of DNA damage and 2) erasing repressive H2AUb markers epigenetically. We observed that pH2A.X, a known hallmark of DNA double strand break and DNA damage response activation, was increased in SCC cells upon BMI1 inhibition in vitro and in vivo. Consistent with ongoing DNA damage, cytosolic dsDNA was accumulated which subsequently activated the STING-TBK1-IRF3 pathway to induce the expression of the type I IFN chemokines (CCL5, CXCL9, CXCL10, and CXCL11) (Brzostek-Racine et al., 2011; Sen et al., 2019). The removal of repressive H2Aub marks on the promoters of the type I IFN chemokines may further facilitate the transactivation of IRF3 upon BMI1 inhibition.
While Tomato+ BMI1+ CSCs might represent a rare population of CSCs in HNSCC which have high BMI1 transcription, we have previously found that the basal level of BMI1 was also increased in non-stem tumor cells. Immunostaining found that human HNSCC tumor samples had a more broad expression pattern because BMI1 proteins could also be post-translationally regulated (Chen et al., 2017). Therefore, BMI1 inhibition in these tumor cells should also intrinsically activate their immune response and recruit CD8+ T cells. Targeting BMI1 could also sensitize non-stem tumor cells to anti-PD1 by recruiting CD8+ T cells in addition to purging CSCs. The combination of PD1 blockade and BMI1 inhibition not only inhibited metastatic HNSCC growth, but also efficiently prevented HNSCC relapses. PTC596, an analog of PTC209 has been in clinical trials to treat advanced solid tumors. The phase 1 study suggested that PTC596 is tolerable with manageable gastrointestinal side effects (Infante et al., 2017). In the future, it will be interesting to perform a clinical trial to determine whether anti-PD1 and PTC596 collaboratively inhibit human HNSCC growth and lymph node metastasis. Taken together, our results have important implications in developing a new combination treatment for advanced cancer by targeting CSCs and activating tumor cell-intrinsic immune responses.
Limitation of the Study
There are some limitations of the mouse model of tumorigenesis in general. 4NQO-induced HNSCC mice model in vivo is not convenient for us to observe the tumor growth dynamically. The HNSCC of the tongue grow invasively underneath the mucosa so that these tumors cannot be measured directly without sacrificing mice and dissecting tissues. There are two major subsets of HNSCC, HPV-positive and HPV-negative. Our model mainly mimics the pathology of HPV-negative HNSCC, but not HPV-positive HNSCC.
STAR★ METHODS
Detailed methods are provided in the online version of this paper and include the following:
RESOURCE AVAILABILITY
Lead Contact
Further information and requests for reagents may be directed to, and will be fulfilled by the Lead Contact, Cun-Yu Wang (cwang@dentistry.ucla.edu).
Materials Availability
Cell lines and plasmids used in this study are described in the Key Resource Table and available upon request. Bmi1CreER;R26tdTomato and K14CreER; Bmi1flox/flox mice are available upon request with the approved animal protocol. All requests need to execute a suitable Materials Transfer Agreement.
KEY RESOURCES TABLE.
| REAGENT or RESOURCE | SOURCE | IDENTIFIER |
|---|---|---|
| Antibodies | ||
| Rabbit polyclonal anti-wide spectrum Cytokeratin | Abcam | Cat#ab9377; RRID: AB_307222 |
| Rabbit Cleaved Caspase-3 (Asp175) | Cell Signaling Technology | Cat#9661; RRID: AB_2341188 |
| Rabbit monoclonal anti-CD8α (D4W2Z) | Cell Signaling Technology | Cat#98941; RRID: AB_2756376 |
| Goat polyclonal anti-Granzyme B | R&D Systems | Cat#AF1865; RRID: AB_2294988 |
| Mouse monoclonal (4C4.9) to S100 | Abcam | Cat#ab4066; RRID: AB_304258 |
| Rabbit monoclonal anti-BMI1 (D42B3) | Cell Signaling Technology | Cat#5856; RRID: AB_10838137 |
| Rabbit monoclonal anti-CD8α (D8A8Y) | Cell Signaling Technology | Cat#85336; RRID: AB_2800052 |
| Rabbit polyclonal to CCL5 | Abcam | Cat#ab9679; RRID: AB_308752 |
| Mouse monoclonal anti-CXCL10 | Santa Cruz | Cat#sc-101500; RRID: AB_1564138 |
| Rabbit monoclonal anti-Phospho-STING (Ser366) (D7C3S) | Cell Signaling Technology | Cat#19781; RRID: AB_2737062 |
| Rabbit monoclonal anti-STING (D2P2F) | Cell Signaling Technology | Cat#13647; RRID: AB_2732796 |
| Rabbit monoclonal anti-Phospho-TBK1 (Ser172) (D52C2) | Cell Signaling Technology | Cat#5483; RRID: AB_10693472 |
| Rabbit monoclonal anti-TBK1 (D1B4) | Cell Signaling Technology | Cat#3504; RRID: AB_2255663 |
| Rabbit monoclonal anti-Phospho-IRF3 (Ser396) (D6O1M) | Cell Signaling Technology | Cat#29047; RRID: AB_2773013 |
| Rabbit monoclonal anti-IRF3 (D83B9) | Cell Signaling Technology | Cat#4302; RRID: AB_1904036 |
| Rabbit monoclonal anti-Ubiquityl-Histone H2A (Lys119) | Cell Signaling Technology, | Cat#8240; RRID: AB_10891618 |
| Rabbit monoclonal anti-BMI1 (D20B7) | Cell Signaling Technology | Cat#6964; RRID: AB_10828713 |
| Rabbit monoclonal anti-phospho-Histone H2A.X (Ser139) (20E3) | Cell Signaling Technology | Cat#9718; RRID: AB_2118009 |
| Rabbit monoclonal anti-GAPDH (D16H11) | Cell Signaling Technology | Cat#5174; RRID: AB_10622025 |
| Rabbit monoclonal anti-Histone H3 (D1H2) | Cell Signaling Technology | Cat#4499; RRID: AB_10544537 |
| FITC anti-CD3e monoclonal antibody (145-2C11) | eBioscience | Cat#11-0031; RRID: AB_464883 |
| APC anti-CD4 monoclonal antibody (GK1.5) | eBioscience | Cat#17-0041; RRID: AB_469319 |
| PerCP-Cyanine5.5 anti-CD8 monoclonal antibody (53-6.7) | eBioscience | Cat#45-0081; RRID: AB_906236 |
| PE anti-IFNγ monoclonal antibody (XMG1.2) | eBioscience | Cat#12-7311; RRID: AB_1907418 |
| InVivoMab anti-mouse PD-1 (CD279) antibody | Bio X Cell | Cat#BE0146; RRID: AB_10949053 |
| InVivoPlus anti-mouse CD8a antibody | Bio X Cell | Cat#BP0061, RRID: AB_1125541 |
| InVivoMAb rat IgG2a isotype control | Bio X Cell | Cat#BE0089; RRID: AB_1107769 |
| Biological Samples | ||
| Human HNSCC embedded tumor samples | UCLA translational pathology core laboratory | http://pathology.ucla.edu/tpcl |
| Chemicals, Peptides, and Recombinant Proteins | ||
| Cisplatin | Sigma-Aldrich | Cat#479306 |
| PTC209 | MedChem Express | Cat#HY-15888 |
| TAK779 | Sigma-Aldrich | Cat#SML0911 |
| Polyethylene glycol 400 | Sigma-Aldrich | Cat#202304 |
| Polyethylene glycol | Sigma-Aldrich | Cat#4347 |
| Fisherbrand Superfrost Plus Microscope Slides | Thermo Fisher Scientific | Cat#12-550-15 |
| DAPI | Sigma-Aldrich | Cat#D9542 |
| SlowFade Antifade Reagents | Thermo Fisher Scientific | Cat#S36937 |
| MitoTracker™ Red CMXRos | Thermo Fisher Scientific | Cat#M7512 |
| Polybrene | Sigma-Aldrich | Cat#H9268 |
| Puromycin | Sigma-Aldrich | Cat#P9620 |
| DMEM | Thermo Fisher Scientific | Cat#11995065 |
| Fetal Bovine Serum | Thermo Fisher Scientific | Cat#10437028 |
| Trypsin-EDTA | Thermo Fisher Scientific | Cat#R001100 |
| M-MuLV Reverse Transcriptase | New England Biolabs | Cat#M0253L |
| Random Primers | Thermo Fisher Scientific | Cat#48190011 |
| dNTP | Thermo Fisher Scientific | Cat#18427013 |
| Dynabeads™ Protein A | Thermo Fisher Scientific | Cat#10002D |
| Hot Start DNA Polymerase | New England Biolabs | Cat#M0481L |
| RNase Inhibitor | New England Biolabs | Cat#0307L |
| 4-Nitroquinoline N-oxide (4NQO) | Santa Cruz | Cat#sc-256815 |
| ProLong™ Diamond Antifade Mountant with DAPI | Thermo Fisher Scientific | Cat#P36962 |
| RIPA Buffer | Sigma-Aldrich | Cat#R0278 |
| TRIzol Reagent | Thermo Fisher Scientific | Cat#15596026 |
| PhosSTOP™ | Sigma-Aldrich | Cat#4906845001 |
| Halt™ Protease Inhibitor Cocktail | Thermo Fisher Scientific | Cat#78430 |
| Ficoll Paque Plus | GE Healthcare Sciences | Cat#17-1440 |
| Cell Stimulation Cocktail (500X) | eBioscience | Cat#00-4970 |
| Tamoxifen | Sigma-Aldrich | Cat#5648 |
| KAPA Library Quantification Kit | KAPA Biosystems | Cat#07960140001 |
| SYBR™ Green I Nucleic Acid Gel Stain | Thermo Fisher Scientific | Cat#S7563 |
| Critical Commercial Assays | ||
| Clarity Western ECL Substrate | Bio-Rad | Cat#1705060 |
| Human CCL5/RANTES Quantikine ELISA Kit | R&D Systems | Cat#DRN00B |
| Human CXCL9/MIG Quantikine ELISA Kit | R&D Systems | Cat#DCX900 |
| Human CXCL10/IP-10 Quantikine ELISA Kit | R&D Systems | Cat#DIP100 |
| Human CXCL11/I-TAC Quantikine ELISA Kit | R&D Systems | Cat#DCX110 |
| Fixation/Permeabilization Solution Kit | BD Biosciences | Cat#554715 |
| Comet SCGE assay kit | Enzo Life Sciences | Cat#ADI-900-166 |
| Quant-iT™ PicoGreen™ dsDNA Assay Kit | Thermo Fisher Scientific | Cat# P11496 |
| ChIP DNA Clean & Concentrator | Zymo Research | Cat#D5205 |
| Experimental Models: Cell Lines | ||
| Human cell line: SCC23 | Laboratory of T. Carey | Ding et al., 2013 |
| Human cell line: SCC1 | Laboratory of T. Carey | Ding et al., 2013 |
| Experimental Models: Organisms/Strains | ||
| Mouse: C57BL/6J | The Jackson Laboratory | JAX: 000664 |
| Mouse: Bmi1CreER | The Jackson Laboratory | JAX: 010531 |
| Mouse: R26tdTomato | The Jackson Laboratory | JAX: 007908 |
| Mouse: K14CreER | The Jackson Laboratory | JAX: 005107 |
| Mouse: Bmi1flox/flox | The Jackson Laboratory | JAX: 028974 |
| Oligonucleotides | ||
| See Table S1 | This paper | N/A |
| Recombinant DNA | ||
| Plasmid: PLKO.1-shCtrl | Addgene | Cat#1864 |
| Plasmid: PLKO.1-shBmi1 | Sigma-Aldrich | Cat#N0000020156 |
| Plasmid: psPAX2 | Addgene | Cat#12260 |
| Plasmid: pMD2.G | Addgene | Cat#12259 |
| Software and Algorithms | ||
| CellSens | Olympus | http://www.olympus-lifescience.com/en/software/cellsens/ |
| LAS X | Leica | https://www.leica-microsystems.com/products/microscope-software/p/leica-las-x-ls/ |
| FlowJo | FlowJo | https://www.flow.com |
| CASP | CASP lab | http://casplab.com/ |
| GraphPad Prism 6.0 | GraphPad Prism | https://www.graphpad.com/ |
| Heatmap Builder | Ashley lab | http://ashleylab.stanford.edu/tools/ |
| Deposited Data | ||
| Raw and analyzed RNAseq data | This paper | GEO: GSE140433 |
Data and Code Availability
RNA-seq data was deposited at the Gene Expression Omnibus (GEO) under the accession number GEO: GSE140433.
EXPERIMNTAL MODEL AND SUBJECT DETAILS
Mice
Bmi1CreER (JAX:010531) and R26tdTomato (JAX:007908) mouse strains were crossmated to generate Bmi1CreER;R26tdTomato. K14CreER (JAX: 005107) and Bmi1flox/flox (JAX: 028974) mouse strains were crossmated to generate K14CreER; Bmi1flox/flox. All these above mice were purchased from The Jackson Laboratory and housed under specific-pathogen-free (SPF) conditions in the UCLA animal facility. All mouse experiments were performed per protocols approved by UCLA Animal Research Committee. For induction of HNSCC, six-week-old mice were treated with drinking water containing 50 μg/ml 4NQO (Santa Cruz, Cat# 256815) for 16 weeks and then given normal drinking water for tumor formation and lymph node metastasis. For lineage tracing and Bmi1 knock out studies, mice were intraperitoneally injected with tamoxifen (9 mg per 40 g body weight; Sigma-Aldrich, Cat#T5648) to activate Cre.
Cell lines
Human HNSCC cell lines SCC23 and SCC1 were from the University of Michigan. B16 cells were from American Type Culture Collection (ATCC, Manassas, VA). Cells were maintained in DMEM containing 10% FBS and antibiotics (streptomycin and penicillin) at 37°C in 5% CO2 atmosphere.
Human HNSCC samples
The use of human HNSCC samples for immunostaining was approved by the UCLA Institutional Review Board. Human HNSCC paraffin-embedded blocks were obtained from the UCLA Translational Pathological Core Laboratory and processed as described previously (Chen et al., 2017; Ding et al., 2013).
METHOD DETAILS
4NQO mouse model of HNSCC, treatment and histology
Cisplatin (Sigma-Aldrich, Cat#479306) was dissolved in saline. PTC209 (MedChem Express, Cat#HY-15888) was dissolved in 14% DMSO, 36% polyethylene glycol 400 (Sigma-Aldrich, Cat#202304) and 50% polypropylene glycol (Sigma-Aldrich Cat#4347). For treatment, tumor-bearing mice were randomly divided into 4 groups and given: 1) control vehicle and antibody InVivoPlus rat IgG2a isotype (BioXcell Cat#BP0089, 200 μg/mouse); 2) anti-PD1 (BioXcell, Cat#BE0146, 200 μg/mouse twice/week); 3) cisplatin (5 mg/kg body weight once a week) or PTC209 (60 mg/kg body weight twice/week); and 4) anti-PD1 plus cisplatin or anti-PD1 plus PTC-209. The cisplatin dose and frequency chosen was the weekly tolerated dose that did not have severe side effects on mice based on previous studies (Tran et al., 2017). For depletion of CD8+ T cells, mice were given anti-mouse CD8 (InVivoPlus, BioXcell Cat#BP0061, 100 μg/mouse twice/week). For the inhibition of CXCR3 and CXCR5, mice were given TAK779 (Sigma-Aldrich, Cat#SML0911, 150 μg/mouse twice/week).
Tumor growth and cervical lymph node metastasis were examined as described before (Chen et al., 2017). Briefly, mice were sacrificed, and tongues and cervical lymph nodes were harvested immediately and the lesion surface areas were measured. For histological analysis and immunostaining, longitudinally cut tongues (dorsal/ventral) and intact lymph nodes were fixed overnight in 10% buffered formalin and paraffin-embedded. Tissue blocks were cut into 10–15 sections in 4 μm thickness and stained with hematoxylin and Eosin (H&E). The SCC number was counted and areas were measured as described before (Chen et al., 2017). The HNSCC invasiveness was scored based on the following criteria: showing signs of normal or epithelial dysplasia appearance (grade 1); distinct invasion, unclearness of basement membrane, drop and diffuse infiltration into the superficial portion of the muscle layer (grade 2); loss of the basement membrane, extensive invasion into deep muscle layer (grade 3). To assess lymph node metastasis, the sections of cervical lymph nodes were immunostained with anti-PCK antibodies which specifically detected epithelial tumor cells in lymph nodes (Santa Cruz, Cat#sc-8018). The percentage of lymph nodes with metastasis and their metastatic areas were measured.
Immunostaining
Mouse HNSCC and cervical lymph nodes were harvested and cytosections were prepared and processed as previously described (Chen et al., 2017). For immunofluorescent staining, sections were stained with the following primary antibodies: anti-PCK (Abcam Cat#ab9377; 1:200), anti-Ac-casp3 (Cell Signaling Technology, Cat#9661; 1:200), anti-CD8 (Cell Signaling Technology Cat#98941; 1:200), anti-Granzyme-B, (R&D Systems, Cat#AF1865; 1:100), and anti-S100 (Abcam Cat#ab4066; 1:200). The immunocomplexes were detected and visualized using related secondary antibodies conjugated with Cy2 or Cy3 (Jackson ImmunoResearch Laboratories). Sections were then counterstained with 4’6’-diamidino-2-phenilindole (DAPI; Sigma-Aldrich Cat#D9542) and mounted with SlowFade Antifade Reagents (Thermo Fisher Scientific Cat#S36937) for imaging and analysis. For the quantification of CD8+, Ac-casp3+ and Tomato+ cells, we followed the methods described previously (Miao et al., 2019) with some modifications. At least three sections from each HNSCC lesions were immunostained and analyzed. Tumor cells (>150) and CD8+, Ac-casp3+ and Tomato+ cells of these tumor cell areas were counted manually in each section. The percentage of CD8+, Ac-casp3+ and Tomato+ cells were calculated by dividing those cells with tumor cells and averaged from the sections.
For immunohistochemistry of human or murine HNSCC samples, sections were incubated with the following primary antibodies at 4°C overnight: anti-BMI1 (Cell Signaling Technology, Cat#5856; 1:50), anti-CD8α (Cell Signaling Technology Cat#85336; 1:100), anti-CCL5 (Abcam Cat# ab9679; 1:100), and anti-CXCL10 (Santa Cruz, Cat# sc-101500; 1:100). The sections were then incubated with horseradish perioxidase-labeled polymer for 60 min. The signals were detected with AEC+ chromogen (Dako EnVision System Cat#MP-6401–15) and counterstained with hematoxylin. The intensity of immunostaining was scored as follows: 0, no staining; 1, weak staining; 2, moderate staining; 3, strong staining; and 4, very strong staining as described before (Chen et al., 2017). The Spearman or Pearson correlation coefficient of liner regression was used to determine the correlation between different proteins in human HNSCC samples.
Flow Cytometry Analysis
PBMCs were isolated from blood using Ficoll-Paque Plus density gradient centrifugation (GE Healthcare Life Sciences, Cat#17–1440). Cervical lymph nodes and spleens were collected and processed into single-cell suspensions through mechanical separation. The isolated or dissociated cells were stained with the specific surface marker antibodies, anti-CD3-FITC (eBioscience, Cat#11–0031), anti-CD4-APC (eBioscience, Cat#17–0041), and anti-CD8-PerCP-Cy5.5 (eBioscience, Cat#45–0081) in PBS with FBS for 30 min at 4°C. Intracellular staining of IFNγ was performed as follows: Cells were stimulated with PMA and ionomysin cocktail (eBioscience, Cat#00–4970) for 5 h at 37°C with 5% CO2. Cells were washed and stained with surface marker antibodies, then fixed and permeabilized with a fixation/permeabilization kit (BD Bioscience, Cat#554715) and intracellularly stained with anti-IFNγ-PE (eBioscience, Cat#12–7311). For proper compensation of flow cytometry channels, single-stain samples were utilized, and for gating, isotype controls were applied. The stained cells were analyzed on the BD FACS flow cytometer, and data analyzed using Flowjo software.
Cell culture and BMI1 knockdown by shRNA
Human SCC23 and SCC1 cells were grown in DMEM containing 10% FBS and antibiotics (streptomycin and penicillin) at 37°C in a 5% CO2 atmosphere. To generate lentiviruses, scramble control (shCtrl, Addgene, Cat#1864) and BMI1 specific shRNA lentiviral plasmids (shBmi1, Sigma-Aldrich, Cat#N0000020156) were transfected into HEK293T cells with two helper plasmids psPAX2 (Addgene, Cat#12260) and pMD2.G (Addgene, Cat#12259). Viral supernatant was harvested 72 h after transfection and passed through a 0.45 μm filter to remove cell debris and live cells. Collected lentiviruses were used directly to infect cells with the addition of polybrene (Sigma-Aldrich, Cat#H9268), or frozen at −80°C for later use. 24 hr after infection, cells were selected with puromycin (Sigma-Aldrich, Cat#P9620) at 1 μg/ml for 5 days and then expanded before being used for subsequent assays. The knockdown of BMI1 was confirmed by Western blot analysis.
qRT-PCR and ChIP-qPCR
For qRT-PCR, total RNA was prepared using TRIzol reagent (Thermo Fisher Scientific Cat#15596026), and 1 μg of RNA was reversely transcribed with random primer (Thermo Fisher Scientific Cat#48190011), dNTP mix (Thermo Fisher Scientific, Cat#18427013), and M-MuLV Reverse Transcriptase (New England Biolabs, Cat#M0253L). The levels of mRNA were qualitatively measured using a SYBRGreen supermix (Bio-Rad, Cat#1708880). GAPDH was used as an internal control.
ChIP-qPCR assays were performed as previously described (Ding et al, 2013). Briefly, SCC cells were sequentially treated with dimethyl 3,3’-dithiobispropionimidate-HCl (DTBP; Cat#20665, Thermo Fisher Scientific) solution and formaldehyde, and harvested with a cell scraper. The cell pellet was lysed with ChIP lysis buffer and sonicated to generate 200–500 bp DNA fragments with a sonicator. The fragmented chromatins were immunoprecipitated with anti-BMI1 (Cell Signaling Technology, Cat#6964), anti-Ubiquityl-Histone H2A (Lys119) (Cell Signaling Technology, Cat#8240) overnight at 4°C. The precipitated DNA-chromatin products were purified with ChIP DNA clean & concentrator kit (Cat#D5205, Zymo Research) and the DNA levels were quantified by qPCR. Data is presented as the percentage of input DNA. The primer sequences used for qRT-PCR and ChIP-qPCR were listed in Table S1.
Western blot and ELISA assays
Cells were lysed using the radioimmunoprecipitation assay (RIPA) buffer (Sigma-Aldrich, Cat#R0278) added with a cocktail of protease inhibitors (Thermo Fisher Scientific, Cat##78430) and phosphatase inhibitors (Sigma-Aldrich, Cat#4906845001). Protein extracts were resolved on a 10% or 15% SDS polyacrylamide gel and then transferred to a polyvinylidene difluoride membrane. Membranes were blocked with 5% milk for 1 h and incubated with primary antibodies overnight at 4°C. Primary antibodies used in this study were: anti-phospho-STING (Ser366) (1: 1,000; Cell Signaling Technology, Cat#19781), anti-STING (1:1,000; Cell Signaling Technology, Cat#13647), anti-phospho-TBK1 (Ser172) (1:1,000; Cell Signaling Technology, Cat#5483), anti-TBK1 (1:1,000; Cell Signaling Technology, Cat#3504), anti-phospho-IRF3 (Ser396) (1:1,000; Cell Signaling Technology, Cat#29047), anti-IRF3 (1:1,000; Cell Signaling Technology, Cat#4302), anti-BMI1 (1:1,000; Cell Signaling Technology, Cat#6964), anti-Ubiquityl-Histone H2A (Lys119) (1:1000, Cell Signaling Technology, Cat#8240), anti-phospho Histone H2A.X (Ser139) (1:1000; Cell Signaling Technology, Cat#9718), and anti-GAPDH (1:1000; Cell Signaling Technology, Cat# 5174), anti-Histone H3 (1:2,000; Cell Signaling Technology, Cat#4499). The signals were detected using the Clarity Western ECL kit (Bio-Rad, Cat#1705060).
To measure the protein levels of CCL5, CXCL9, CXCL10 and CXCL11, cells were treated with PTC209 or shBMI1 knockdown for 48 hr. After treatment, supernatants were collected, and the protein levels of CCL5, CXCL9, CXCL10 and CXCL11 were measured with ELISA (R&D Systems, Cat#DRN00B, DCX900, DIP100, DCX110) according to the manufacturer’s instructions.
RNA-Seq and pathway enrichment analysis
Total RNA was isolated from PTC209-treated or shBMI1 knockdown SCC cells using a RNeasy Micro Kit (QIAGEN, Cat# 74004). RNA Quality was examined using an Agilent 2100 Bioanalyzer. Library preparation using the KAPA RNA-Seq Library Preparation Kits (KAPA Biosystems, Cat#07960140001) was performed at the UCLA sequencing core facility, and RNAs were single-end sequenced on Illumina HiSeq 3000 machines. The online DAVID (https://david.ncifcrf.gov/summary.jsp) bioinformatics resources were used to analyze the differentially expressed genes under the category of GOTERM_BP_DIRECT. The heatmap was generated with Heatmap Builder (http://ashleylab.stanford.edu/tools/tools-scripts.html).
Cytosolic dsDNA Staining
Following the treatment, SCC23 and SCC1 cells were incubated with culture media containing PicoGreen (dsDNA stain, 200-fold dilution, Thermo Fisher Scientific, Cat#P11496) and MitoTracker (mitochondrial dsDNA stain, 100 nM, Thermo Fisher Scientific, Cat#M7512). One hour after incubation, cells were fixed with 4% paraformaldehyde for 10 min. Cells were then washed twice with PBS and stained with DAPI (Sigma-Aldrich, Cat#D9542) and mounted with SlowFade Antifade Reagents (Thermo Fisher Scientific, Cat#S36937). Staining was imaged and assessed using a Leica SP5X laser scanning confocal microscope.
Comet assays
Single cell gel electrophoresis comet assays were performed using the SCGE assay Kit (Enzo Life Sciences, Cat# ADI-900–166). Following the treatment, cells were mixed with low melting point agarose at a volume ratio of 1:50, and 100 μl of aliquots were loaded onto pre-warmed slides. Slides were incubated in pre-chilled lysis solution for 1 h and then in pre-chilled alkaline solution for 1 h. Electrophoresis was run at 22 V in the TBE buffer for 30 min. Comets were stained with CYGREEN dye for 30 min and imaged. 50 individual cells at least per sample were evaluated in duplicates by the CASP Version 1.2.2 analysis tool.
Statistical analyses
Statistical parameters of the analyses are reported in the Figure Legends. All in vitro experiments were repeated at least twice, and in vivo experiments were repeated at least once. Statistical analyses were performed using GraphPad Prism 6.0 for windows (GraphPad software, Inc.). To compare HNSCC lesion size, number and area in control and knockout mice, the differences were assessed using two-way ANOVA. For comparison of treatment in same stain of mouse, the differences were evaluated by one-way ANOVA followed by the Tukey’s HSD post-hoc tests to minimize type I errors. For ANOVA analyses, we utilized Shapiro-Wilk test to validate normal distribution of data and that all data met the assumptions of no significant outliers. A total of 60 human HNSCC samples were used in this study, and the parameters for scores was reported in the Figure legends (Figure S6). The Pearson and Spearman correlation coefficient of liner regression was used to assess the correlation between different proteins.
Supplementary Material
Highlights.
BMI1+ CSCs enriched in HNSCC after cisplatin plus anti-PD1 treatment
BMI1 inhibitor plus anti-PD1 eliminates BMI1+ CSCs and inhibits tumor progression
BMI1 inhibition increased type 1 IFN chemokines and CD8+ T cell infiltration
BMI1 inhibitor plus anti-PD1 prevents BMI1+ CSCs-mediated tumor relapse
ACKNOWLEDGEMENTS
We thank Mari Ekimyan Salvo for reading the manuscript. This work was supported by NIH/NIDCR grants R01DE15964 and R01CA236878.
Footnotes
DECLARATION OF INTERESTES
C.Y.W and L.J have filed a provisional patent based on this work.
Publisher's Disclaimer: This is a PDF file of an unedited manuscript that has been accepted for publication. As a service to our customers we are providing this early version of the manuscript. The manuscript will undergo copyediting, typesetting, and review of the resulting proof before it is published in its final form. Please note that during the production process errors may be discovered which could affect the content, and all legal disclaimers that apply to the journal pertain.
REFERENCES
- Akahori T, Sho M, Kashizuka H, Nomi T, Kanehiro H, and Nakajima Y (2006). A novel CCR5/CXCR3 antagonist protects intestinal ischemia/reperfusion injury. Transplant Proc 38, 3366–3368. [DOI] [PubMed] [Google Scholar]
- Al-Hajj M, Wicha MS, Benito-Hernandez A, Morrison SJ, and Clarke MF (2003). Prospective identification of tumorigenic breast cancer cells. Proc Natl Acad Sci U S A 100, 3983–3988. [DOI] [PMC free article] [PubMed] [Google Scholar]
- Ashley N, Harris D, and Poulton J (2005). Detection of mitochondrial DNA depletion in living human cells using PicoGreen staining. Exp Cell Res 303, 432–446. [DOI] [PubMed] [Google Scholar]
- Boumahdi S, Driessens G, Lapouge G, Rorive S, Nassar D, Le Mercier M, Delatte B, Caauwe A, Lenglez S, Nkusi E, et al. (2014). SOX2 controls tumour initiation and cancer stem-cell functions in squamous-cell carcinoma. Nature 511, 246–250. [DOI] [PubMed] [Google Scholar]
- Brooks MD, Burness ML, and Wicha MS (2015). Therapeutic Implications of Cellular Heterogeneity and Plasticity in Breast Cancer. Cell Stem Cell 17, 260–271. [DOI] [PMC free article] [PubMed] [Google Scholar]
- Burtness B, Harrington KJ, Greil R, Soulieres D, Tahara M, de Castro G Jr., Psyrri A, Baste N, Neupane P, Bratland A, et al. (2019). Pembrolizumab alone or with chemotherapy versus cetuximab with chemotherapy for recurrent or metastatic squamous cell carcinoma of the head and neck (KEYNOTE-048): a randomised, open-label, phase 3 study. Lancet 394, 1915–1928. [DOI] [PubMed] [Google Scholar]
- Cancer Genome Atlas Research Network. (2015). The Molecular Taxonomy of Primary Prostate Cancer. Cell 163, 1011–1025. [DOI] [PMC free article] [PubMed] [Google Scholar]
- Chen DM, and Wang CY (2019). Targeting cancer stem cells in squamous cell carcinoma. Precis Clin Med 2, 152–165. [DOI] [PMC free article] [PubMed] [Google Scholar]
- Chen DM, Wu MS, Li Y, Chang I, Yuan Q, Ekimyan-Salvo M, Deng P, Yu B, Yu YX, Dong JQ, et al. (2017). Targeting BMI1(+) Cancer Stem Cells Overcomes Chemoresistance and Inhibits Metastases in Squamous Cell Carcinoma. Cell Stem Cell 20, 621–634. [DOI] [PMC free article] [PubMed] [Google Scholar]
- Clara JA, Monge C, Yang Y, and Takebe N (2020). Targeting Signalling Pathways and the Immune Microenvironment of Cancer Stem Cells - a Clinical Update. Nat Rev Clin Oncol 4, 204–232. [DOI] [PubMed] [Google Scholar]
- de Biasi AR, Villena-Vargas J, and Adusumilli PS (2014). Cisplatin-induced antitumor immunomodulation: a review of preclinical and clinical evidence. Clin Cancer Res 20, 5384–5391. [DOI] [PMC free article] [PubMed] [Google Scholar]
- Ding X, Pan H, Li J, Zhong Q, Chen X, Dry SM, Wang CY (2013). Epigenetic activation of AP1 promotes squamous cell carcinoma metastasis. Science signaling 6, ra28.1–13. [DOI] [PMC free article] [PubMed] [Google Scholar]
- Ferris RL, Blumenschein G Jr., Fayette J, Guigay J, Colevas AD, Licitra L, Harrington K, Kasper S, Vokes EE, Even C, et al. (2016). Nivolumab for Recurrent Squamous-Cell Carcinoma of the Head and Neck. The New England journal of medicine 375, 1856–1867. [DOI] [PMC free article] [PubMed] [Google Scholar]
- Gao Q, Wang SM, Chen XF, Cheng SY, Zhang Z, Li F, Huang L, Yang Y, Zhou B, Yue DL, et al. (2019). Cancer-cell-secreted CXCL11 promoted CD8(+) T cells infiltration through docetaxel-induced-release of HMGB1 in NSCLC. J Immunother Cancer 7, 42. [DOI] [PMC free article] [PubMed] [Google Scholar]
- Hato SV, Khong A, de Vries IJ, and Lesterhuis WJ (2014). Molecular pathways: the immunogenic effects of platinum-based chemotherapeutics. Clin Cancer Res 20, 2831–2837. [DOI] [PubMed] [Google Scholar]
- Hedberg ML, Goh G, Chiosea SI, Bauman JE, Freilino ML, Zeng Y, Wang L, Diergaarde BB, Gooding WE, Lui VW, et al. (2016). Genetic landscape of metastatic and recurrent head and neck squamous cell carcinoma. The Journal of clinical investigation 126, 169–180. [DOI] [PMC free article] [PubMed] [Google Scholar]
- Hodge JW, Garnett CT, Farsaci B, Palena C, Tsang KY, Ferrone S, and Gameiro SR (2013). Chemotherapy-induced immunogenic modulation of tumor cells enhances killing by cytotoxic T lymphocytes and is distinct from immunogenic cell death. Int J Cancer 133, 624–636. [DOI] [PMC free article] [PubMed] [Google Scholar]
- Infante R, Bedard L, Shapiro G, Bauer TM, Prawira A, Laskin O, Weetall M, Baird J, Branstrom A, O’Mara E, and Spiegel RJ (2017). Phase 1 results of PTC596, a novel small molecule targeting cancer stem cells (CSCs) by reducing levels of BMI1 protein. J Clin Oncol 35, 15_suppl, 2574–2574. [Google Scholar]
- Ismail IH, Andrin C, McDonald D, and Hendzel MJ (2010). BMI1-mediated histone ubiquitylation promotes DNA double-strand break repair. J Cell Biol 191, 45–60. [DOI] [PMC free article] [PubMed] [Google Scholar]
- Kreso A, van Galen P, Pedley NM, Lima-Fernandes E, Frelin C, Davis T, Cao L, Baiazitov R, Du W, Sydorenko N, et al. (2014). Self-renewal as a therapeutic target in human colorectal cancer. Nat Med 20, 29–36. [DOI] [PubMed] [Google Scholar]
- Lee YS, Johnson DE, and Grandis JR (2018). An update: emerging drugs to treat squamous cell carcinomas of the head and neck. Expert Opin Emerg Drugs 23, 283–299. [DOI] [PMC free article] [PubMed] [Google Scholar]
- Lin X, Ojo D, Wei F, Wong N, Gu Y, and Tang D (2015). A Novel Aspect of Tumorigenesis-BMI1 Functions in Regulating DNA Damage Response. Biomolecules 5, 3396–3415. [DOI] [PMC free article] [PubMed] [Google Scholar]
- Miao Y, Yang H, Levorse J, Yuan S, Polak L, Sribour M, Singh B, Rosenblum MD, and Fuchs E (2019). Adaptive Immune Resistance Emerges from Tumor-Initiating Stem Cells. Cell 177, 1172–1186 e1114. [DOI] [PMC free article] [PubMed] [Google Scholar]
- Nagarsheth N, Peng D, Kryczek I, Wu K, Li W, Zhao E, Zhao L, Wei S, Frankel T, Vatan L, et al. (2016). PRC2 Epigenetically Silences Th1-Type Chemokines to Suppress Effector T-Cell Trafficking in Colon Cancer. Cancer Res 76, 275–282. [DOI] [PMC free article] [PubMed] [Google Scholar]
- Peng D, Kryczek I, Nagarsheth N, Zhao L, Wei S, Wang W, Sun Y, Zhao E, Vatan L, Szeliga W, et al. (2015). Epigenetic silencing of TH1-type chemokines shapes tumour immunity and immunotherapy. Nature 527, 249–253. [DOI] [PMC free article] [PubMed] [Google Scholar]
- Polverini PJ, D’Silva NJ, and Lei YL (2018). Precision Therapy of Head and Neck Squamous Cell Carcinoma. J Dent Res 97, 614–621. [DOI] [PMC free article] [PubMed] [Google Scholar]
- Prager BC, Xie Q, Bao S, and Rich JN (2019). Cancer Stem Cells: The Architects of the Tumor Ecosystem. Cell Stem Cell 24, 41–53. [DOI] [PMC free article] [PubMed] [Google Scholar]
- Qin Y, Vasilatos SN, Chen L, Wu H, Cao ZS, Fu YM, Huang M, Vlad AM, Lu BF, Oesterreich S, et al. (2019). Inhibition of histone lysine-specific demethylase 1 elicits breast tumor immunity and enhances antitumor efficacy of immune checkpoint blockade. Oncogene 38, 390–405. [DOI] [PMC free article] [PubMed] [Google Scholar]
- Saygin C, Matei D, Majeti R, Reizes O, and Lathia JD (2019). Targeting Cancer Stemness in the Clinic: From Hype to Hope. Cell Stem Cell 24, 25–40. [DOI] [PubMed] [Google Scholar]
- Seiwert TY, Burtness B, Mehra R, Weiss J, Berger R, Eder JP, Heath K, McClanahan T, Lunceford J, Gause C, et al. (2016). Safety and clinical activity of pembrolizumab for treatment of recurrent or metastatic squamous cell carcinoma of the head and neck (KEYNOTE-012): an open-label, multicentre, phase 1b trial. Lancet Oncol 17, 956–965. [DOI] [PubMed] [Google Scholar]
- Sen T, Rodriguez BL, Chen L, Corte CMD, Morikawa N, Fujimoto J, Cristea S, Nguyen T, Diao L, Li L, et al. (2019). Targeting DNA Damage Response Promotes Antitumor Immunity through STING-Mediated T-cell Activation in Small Cell Lung Cancer. Cancer Discov 9, 646–661. [DOI] [PMC free article] [PubMed] [Google Scholar]
- Su W, Han HH, Wang Y, Zhang B, Zhou B, Cheng Y, Rumandla A, Gurrapu S, Chakraborty G, Su J, et al. (2019). The Polycomb Repressor Complex 1 Drives Double-Negative Prostate Cancer Metastasis by Coordinating Stemness and Immune Suppression. Cancer Cell 36, 139–155 e110. [DOI] [PMC free article] [PubMed] [Google Scholar]
- Tan YS, Sansanaphongpricha K, Prince MEP, Sun D, Wolf GT, and Lei YL (2018). Engineering Vaccines to Reprogram Immunity against Head and Neck Cancer. J Dent Res 97, 627–634. [DOI] [PMC free article] [PubMed] [Google Scholar]
- Tran L, Allen CT, Xiao R, Moore E, Davis R, Park SJ, Spielbauer K, Van Waes C, and Schmitt NC (2017). Cisplatin Alters Antitumor Immunity and Synergizes with PD-1/PD-L1 Inhibition in Head and Neck Squamous Cell Carcinoma. Cancer Immunol Res 5, 1141–1151. [DOI] [PMC free article] [PubMed] [Google Scholar]
- Wang Y, Ow TJ, and Myers JN (2012). Pathways for cervical metastasis in malignant neoplasms of the head and neck region. Clinical anatomy (New York, NY) 25, 54–71. [DOI] [PubMed] [Google Scholar]
- Wang Z, Wu VH, Allevato MM, Gilardi M, He Y, Luis Callejas-Valera J, Vitale-Cross L, Martin D, Amornphimoltham P, Mcdermott J et al. (2019). Syngeneic animal models of tobacco-associated oral cancer reveal the activity of in situ anti-CTLA-4. Nat Commun 10, 5546. [DOI] [PMC free article] [PubMed] [Google Scholar]
- Wu J, Sun L, Chen X, Du F, Shi H, Chen C, and Chen ZJ (2013). Cyclic GMP-AMP is an endogenous second messenger in innate immune signaling by cytosolic DNA. Science 339, 826–830. [DOI] [PMC free article] [PubMed] [Google Scholar]
- Zhang D, Tang DG, and Rycaj K (2018). Cancer stem cells: regulation programs, immunological properties and immunotherapy. Semin Cancer Biol 52, 94–106. [DOI] [PMC free article] [PubMed] [Google Scholar]
Associated Data
This section collects any data citations, data availability statements, or supplementary materials included in this article.
Supplementary Materials
Data Availability Statement
RNA-seq data was deposited at the Gene Expression Omnibus (GEO) under the accession number GEO: GSE140433.