

Abstract
G protein-coupled receptors (GPCRs) are the largest class of cell surface signaling proteins; they participate in all physiological processes and are the targets of 30% of marketed drugs. Typically, nanomolar-micromolar concentrations of ligand are used to activate GPCRs in experimental systems. However, by measuring cAMP with increased spatial and temporal resolution, we can now detect GPCR responses to an extraordinarily wide range of ligand concentrations: from attomolar to millimolar. Mathematical modeling shows that the addition of femtomolar concentrations of ligand can activate a significant proportion of cells provided that a cell can be activated by 1–2 binding events. In addition to cAMP, activation of the endogenous β2-adrenoceptor (β2AR) and muscarinic M3R by femtomolar concentrations of ligand in cell lines and human cardiac fibroblasts causes sustained increases in nuclear ERK or cytosolic PKC, respectively. These responses are spatially and temporally distinct from those that occur at higher concentrations of ligand, and result in a unique proteomic profile. This highly sensitive signaling is dependent on the GPCRs forming pre-assembled higher-order signaling complexes at the plasma membrane. Recognizing that GPCRs respond to ultra-low concentrations of neurotransmitters and hormones challenges established paradigms of drug action and provides a new dimension of GPCR activation that is quite distinct from that typically observed.
Keywords: femtomolar, highly sensitive, ultra-low, GPCR, cAMP, compartmentalized signaling, β2AR, M3R, signaling complex
One-sentence summary:
Femtomolar concentrations of ligand activate GPCRs due to a pre-assembled protein complex that stimulates compartmentalized signaling and unique whole cell responses
Introduction
G protein-coupled receptors (GPCRs) represent the largest class of cell surface signaling proteins. These receptors can sense a diverse range of stimuli – from photons and odors to large peptides and hormones – to induce intracellular signal transduction cascades that mediate specific cellular responses. GPCRs are ubiquitously distributed across all cell types, are involved in many diseases, and are the targets of 30% of marketed drugs (1). GPCRs signal by initiating a chain of events from a receptor unit at the cell surface: agonist binding stabilizes an active receptor conformation that promotes interaction with the heterotrimeric G protein, and the activated G protein then interacts with intracellular effectors to induce downstream signaling. However, it is increasingly clear that GPCRs do not exist in isolation. Instead, GPCR activity is closely coordinated by the assembly of receptors into higher-order protein complexes (e.g. (2–8)) that can restrict GPCR signaling to highly organized compartments within the cell, to activate receptor- and location-specific responses (2, 4, 9, 10). The spatial and temporal properties of these intracellular signals are very important for the control of distinct physiological outcomes (2, 4, 9–17).
While the assembly of GPCRs into protein complexes allows precise spatiotemporal control over signaling, the physical interaction between the complex and the receptor is likely to alter the pharmacological properties of the GPCR itself. We have previously reported that the relaxin receptor, RXFP1, pre-assembles into a large signaling complex that facilitates activation of the receptor by attomolar concentrations of relaxin (8). While responses to such “ultra-low” concentrations of biologically active compounds are well-documented and accepted by, for example, the cytokine field (18), such high ligand sensitivity for GPCRs is not widely reported. Typically, nanomolar-micromolar concentrations of ligand are used to activate GPCRs in experimental systems using global cellular measurements. Nevertheless, there are reports that some GPCRs (including the β2-adrenoceptor(AR), opioid receptors, and angiotensin receptors) can respond to femtomolar (10−15M) concentrations of ligand in endogenous, physiological systems (19–26). Despite these observations, there is little mechanistic insight to explain these non-conventional responses, the responses are typically measured at a highly amplified level (e.g. cell adhesion or glucose uptake for the β2AR, analgesia or neuroprotection for opioid receptors, blood vessel contraction for angiotensin receptors), and ultra-low ligand concentrations induce the same cellular responses (or a limited sub-set) as higher ligand concentrations. It is currently unclear if this sensitivity is a widespread fundamental property of GPCRs, and whether ultra-low concentrations of ligands have a unique and physiologically relevant role in the cell. As such, there is no detailed characterization of the putative extreme sensitivity of these important and ubiquitous receptors.
Here, by measuring endogenous GPCR activity with high spatial and temporal resolution, we find that we can detect responses from a broad range of GPCRs across an extraordinarily wide range of ligand concentrations: from attomolar to millimolar. We report that two prototypical GPCRs, the adrenergic β2AR and muscarinic M3R, are activated by femtomolar concentrations of ligand. Through mathematical modeling, we show that femtomolar concentrations of ligand can feasibly activate a significant fraction of cells over a 5 min period as observed in our assays, provided that individual cells are capable of responding to 1–2 binding events. We demonstrate that signaling in response to femtomolar concentrations of ligand depends on the pre-assembly of a higher-order signaling complex at the plasma membrane. Compared to higher concentrations of ligand, receptor activation by femtomolar concentrations results in both a distinct intracellular signal (both spatially and temporally) as well as a distinct response at the whole cell level. The physical interaction between the GPCR and signaling complex appears to allosterically alter the pharmacological properties of the receptor to reveal an enhanced sensitivity to ligand. The ability of many prototypical receptors to respond to ultra-low concentrations of ligand suggests that a better understanding of this sensitivity is necessary for future research and drug discovery.
Results
Ultra-low concentrations of ligand activate endogenously expressed GPCRs.
Typically, GPCR ligands within the nanomolar-micromolar concentration range activate receptors in experimental systems however, over the last 40 years there have been sporadic reports of GPCRs responding to femtomolar concentrations of ligand (well below conventionally defined pEC50 values)in endogenous physiological systems (e.g. (19–26)). We have previously shown that the relaxin receptor, RXFP1, induces a biphasic increase in cAMP that is characterized by a remarkably wide separation of pEC50 values (10.9 aM vs. 0.3 nM) (8). This differs from typical biphasic response profiles, whereby each pEC50 value is closely clustered within the nanomolar-micromolar concentration range (e.g. (27)). To determine if this sensitivity to femtomolar (and lower) concentrations of ligand is a widespread property of GPCRs, we measured cAMP following activation of members of eight GPCR families; six of which are expressed endogenously in HEK293 cells and, as negative controls, two for which we could not detect any RNA (Fig. 1, A to C and fig. S1, A to H) (28, 29). These receptors are canonically linked to Gαs (adenosine A2B, β1AR, β2AR, the prostanoid, relaxin and glucagon-like peptide receptors), Gαi/o (α2B-AR, α2C-AR, opioid DOP and dopamine D2 and D4) or Gαq/11 (muscarinic M3). Sub-nanomolar concentrations of adenosine, isopreterenol (Iso), prostaglandin E1 (PGE1) (Fig. 1A), carbachol (CCh), SNC80 and dopamine (Fig. 1B) increased cAMP. As expected, there was no change in baseline cAMP in response to relaxin or glucagon-like peptide 1 (HEK293 cells lack expression of these receptor families) (Fig. 1C). For endogenously expressed receptors, biphasic concentration-response curves were observed, ranging from attomolar-millimolar, that in each instance were characterized by two response phases separated by a very wide concentration range. All ligands caused an increase in cAMP at femtomolar concentrations (Table S1); when the ligand reached nanomolar concentrations, ligands that activated Gαs-coupled GPCRs caused a further increase in cAMP (Fig. 1A), whereas ligands that activated Gαi/o- or Gαq/11-coupled GPCRs decreased cAMP back to baseline (Fig. 1B). To determine whether this characteristic biphasic response was cell-type specific, and as a further control, we repeated the same experiment in the CHO-K1 cell line. These cells do not endogenously express adrenergic or muscarinic receptors (NCBI Gene Expression Omnibus accession GSE75521; (30)), and accordingly we observed no change in cAMP from baseline upon activation with Iso or CCh (fig. S2A). In contrast, we were able to detect changes in cAMP following activation of members of four GPCR families expressed endogenously (NCBI Gene Expression Omnibus accession GSE75521; (30)) in these cells (Fig. 1, D and E): adenosine (A2A and A2B), prostanoid (EP1 and EP4), 5-hydroxytryptamine (5-HT; 5-HT1B, 5-HT6, 5-HT7) and proteinase-activated (PAR1 and PAR2) receptors. Again, all ligands caused a biphasic change in cAMP from baseline; an initial increase in cAMP at femtomolar concentrations, followed by a further increase (adenosine, PGE1; Fig. 1D) or a decrease back to baseline (5-HT, thrombin; Fig. 1E) when the ligand reached nanomolar concentrations. These data suggest that sensitivity to ultra-low concentrations of ligand is a potentially fundamental property of many endogenously expressed GPCRs, irrespective of cell-type and their canonical G protein coupling profile.
Figure 1. GPCRs respond to sub-nanomolar concentrations of ligand.
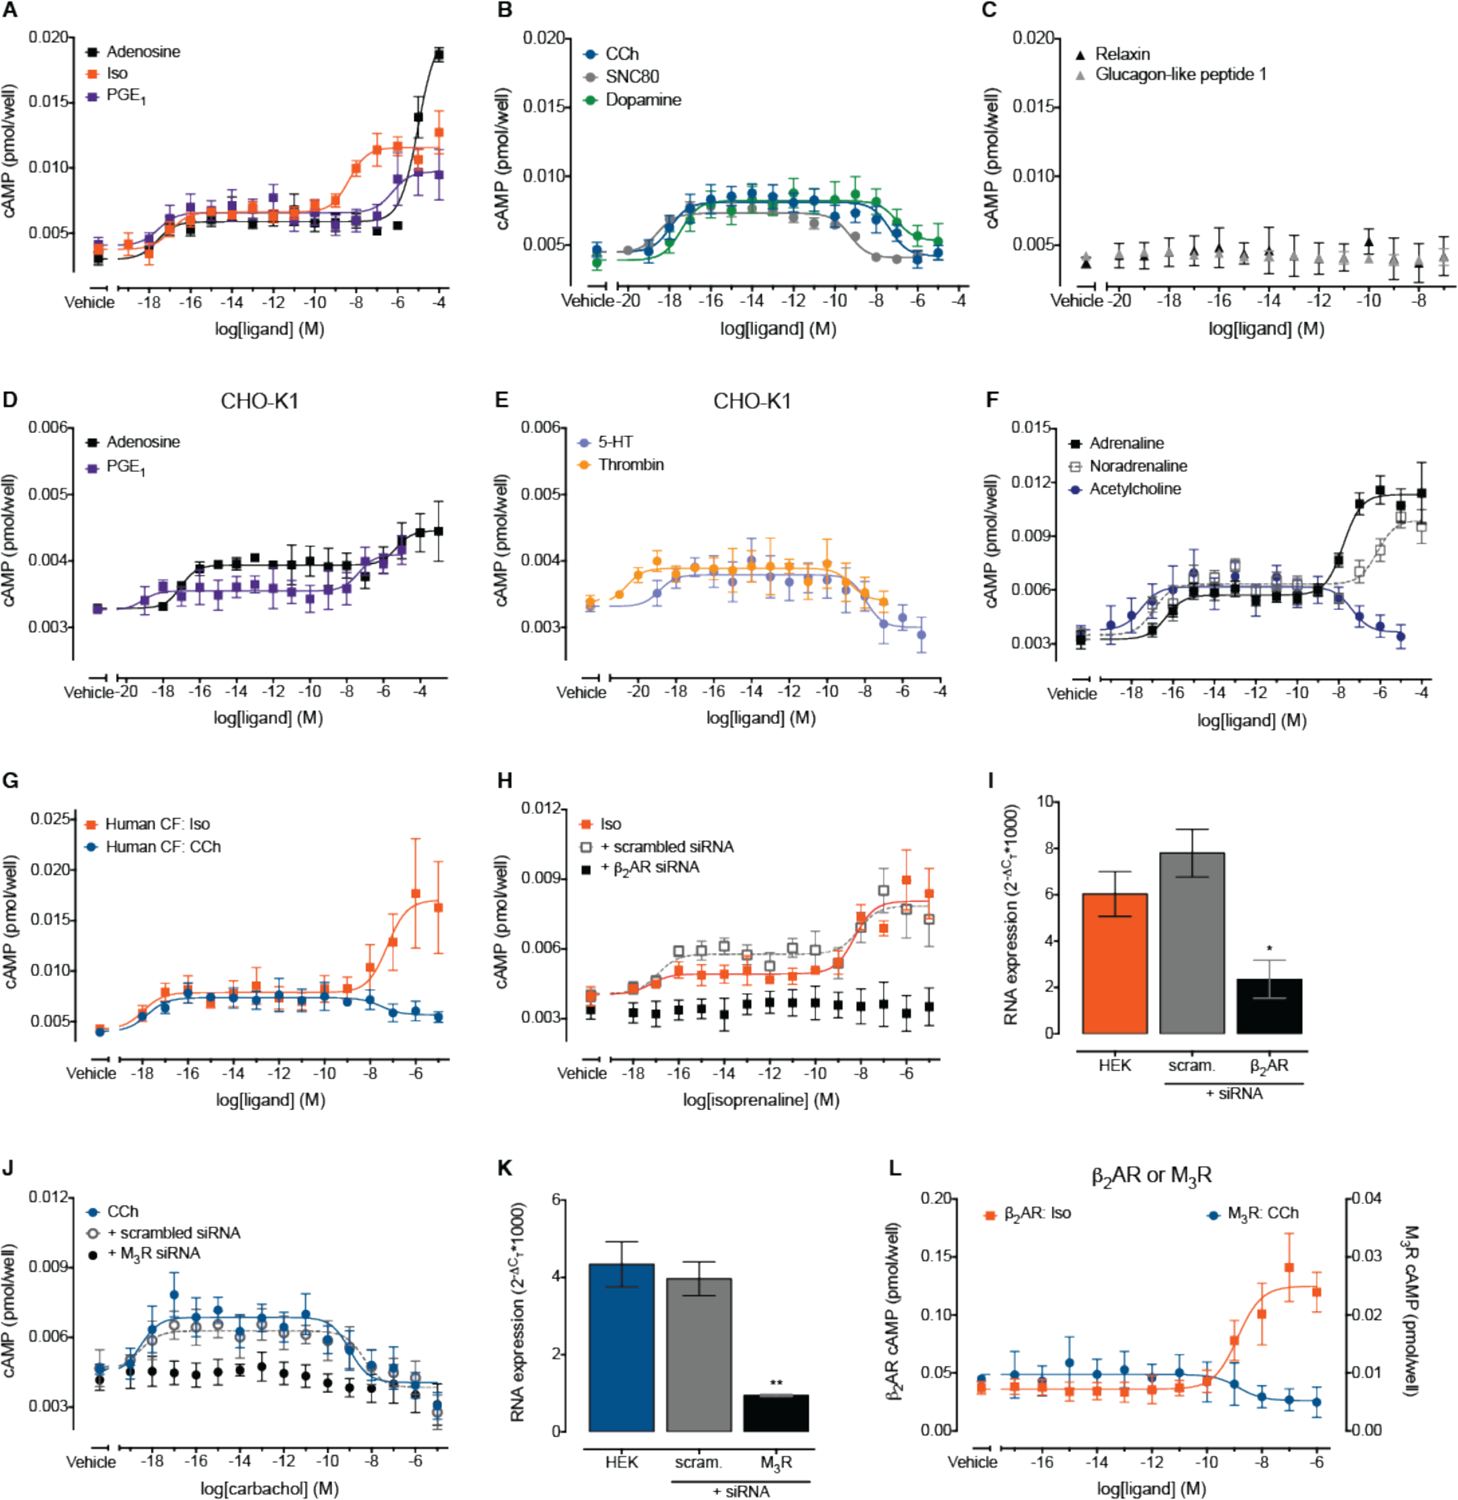
(A-C) cAMP assay in native HEK293 cells stimulated for 30 min in the absence of IBMX by increasing concentrations of (A) adenosine, Iso or prostaglandin E1 (PGE1), (B) CCh, SNC80 or dopamine, and (C) relaxin or glucagon-like peptide 1 (n=6–9; see also Table S1). (D-E) cAMP assay in native CHO-K1 cells stimulated for 30 min in the presence of IBMX by increasing concentrations of (D) adenosine or PGE1, and (E) 5-hydroxytryptamine (5-HT) or thrombin (n=6). (F) cAMP in native HEK293 cells stimulated for 30 min in the absence of IBMX by increasing concentrations of adrenaline, noradrenaline or acetylcholine (n=6–8, see also Table S1). (G) cAMP assay in primary human cardiac fibroblasts (CFs) stimulated for 30 min in the absence of IBMX by increasing concentrations of Iso or CCh (n=5–6). (H) cAMP assay in native HEK293 cells or following transient transfection with 25 nM scrambled or β2AR siRNA, with cells stimulated for 30 min in the absence of IBMX by increasing concentrations of Iso (n=6). (I) RNA was isolated from native HEK293 cells or following transient transfection with 25 nM scrambled (scram.) or β2AR siRNA, and expression of the β2AR was detected by qRT-PCR (n=3). (J) cAMP assay in native HEK293 cells or following transient transfection with 25 nM scrambled or M3R siRNA, with cells stimulated for 30 min in the absence of IBMX by increasing concentrations of CCh (n=6). (K) RNA was isolated from native HEK293 cells or following transient transfection with 25 nM scrambled (scram.) or M3R siRNA, and expression of the M3R detected by qRT-PCR (n=3). (L) cAMP assay in HEK293 cells transiently transfected with the β2AR or M3R, with cells stimulated for 30 min in the absence of IBMX by increasing concentrations of Iso or CCh, respectively (n=3–4). All data are expressed as the mean ± S.E.M. of n independent experiments. * p<0.05 and ** p<0.01 versus HEK293 controls, one-way ANOVA with Tukey’s multiple comparison test.
To further understand this highly sensitive signaling, we selected two prototypical GPCRs for detailed examination: the β2AR (a classical Gαs-coupled receptor) responds to Iso, whereas the muscarinic M3 receptor (M3R, a classical Gαq/11-coupled receptor) responds to CCh. To our knowledge, there are no reports of muscarinic receptors responding to femtomolar concentrations of ligand. However, there are previous reports that activation of the β2AR by picomolar concentrations of ligand (well below the EC50 values) leads to increased cell adhesion (19) and glucose uptake (20). While both the β2AR and M3R are endogenously expressed at the RNA level in HEK293 cells (fig. S1, C and E), we confirmed protein localization at the plasma membrane of HEK293 cells using fluorescent ligand binding (fig. S2, B and C). We found that sub-nanomolar concentrations of the endogenous β2AR and M3R ligands adrenaline or noradrenaline and acetylcholine, respectively, elicited similar increases in cAMP in HEK293 cells to the synthetic ligands Iso and CCh (Fig. 1F). The same biphasic response was also observed following addition of the β2AR-selective agonists, salbutamol and formoterol (no selective M3R agonists are available; fig. S2D). Further, similar highly sensitive responses to Iso and CCh were observed in primary cultures of human cardiac fibroblasts that endogenously express the β2AR and M3R (Fig. 1G and fig. S2E). This highlights that activation of endogenous GPCRs by ultra-low concentrations of ligand is a general feature of endogenous systems. To confirm that responses to ultra-low concentrations of ligand are receptor dependent, we knocked down the endogenous β2AR or M3R in HEK293 cells; this abolished cAMP responses to sub-nanomolar concentrations of Iso or CCh, respectively (Fig. 1, H to K). Knockdown of the β2AR had no effect on the cAMP response to CCh and knockdown of the M3R had no effect on the cAMP response to Iso (fig. S2, F and G). This confirms that receptor knockdown is not merely lowering baseline cAMP so that responses to sub-nanomolar Iso or CCh are undetectable, but that cAMP responses to ultra-low concentrations of Iso or CCh require the β2AR or M3R, respectively. Responses to sub-nanomolar concentrations of ligand were undetectable by the cAMP assay following exogenous expression of the β2AR or M3R (Fig. 1L). We suggest that receptor over-expression may mask the responses to sub-nanomolar concentrations of ligand typically observed in endogenous expression systems. This could be because over-expressed receptors with increased constitutive activity can elevate baseline cAMP within the cell (compare vehicle responses in Fig. 1, A and B to Fig. 1L). Alternatively, the over-expressed receptors may alter the composition of signaling complexes required to respond to ultra-low concentrations of ligand (31), allowing the prototypical signaling response to dominate.
We then wanted to determine if ultra-low and high concentrations of ligand activate qualitatively different signaling pathways, or if there is only a quantitative difference in the degree of signaling initiated. To do this we employed a sensitive plasma membrane-targeted cAMP Förster resonance energy transfer (FRET) biosensor (32), that allowed us to gain a higher resolution measure of cAMP produced at the plasma membrane in real time and in single live cells. Activation of the endogenous β2AR by 1 fM Iso caused a relatively slow, gradual elevation of plasma membrane cAMP over 5 min (Fig. 2, A and B). In contrast, high concentrations of Iso (100 nM) caused a more rapid increase in plasma membrane cAMP, which then declined (Fig. 2, A and B). The sustained plasma membrane cAMP response to 1 fM Iso was blocked by pre-incubation of the cells with 100 nM of the adrenergic receptor antagonist, ICI-118,551 (Fig. 2C and fig. S2H), further demonstrating the receptor dependence of this signal. While activation of the endogenous M3R by 1 fM CCh also caused a relatively slow, gradual increase in plasma membrane cAMP over 5 min, there was no response to a high concentration of CCh (1 μM; Fig. 2, D and E). The absence of a cAMP signal in response to a high concentration of CCh, and the distinct temporal profiles of cAMP generated by ultra-low vs high concentrations of Iso, demonstrates that the signaling outcomes of high vs ultra-low concentrations are qualitatively different, and not merely due to amplification of the same signal (33). The sustained plasma membrane cAMP response to 1 fM CCh was blocked by pre-incubation of the cells with 10 nM of the muscarinic receptor antagonist, N-methyl scopolamine (NMS; Fig. 2F and fig. S2H), confirming the receptor dependence of this signal. There was no effect of inhibition of Gαi/o proteins (NF023) on the cAMP response to Iso or CCh (fig. S2, I and J) suggesting that differences in signaling at high concentrations are not due to additional activation of G proteins that inhibit cAMP production. Therefore, the endogenously expressed β2AR and M3R induce sustained increases in cAMP at the plasma membrane in response to remarkably low concentrations of ligand. Critically, stimulating either the ultra-low or high concentration phases resulted in different temporal signaling profiles.
Figure 2. Femtomolar concentrations of ligand cause sustained increases in plasma membrane-localized cAMP, require an intact orthosteric binding site and only one binding event per cell.
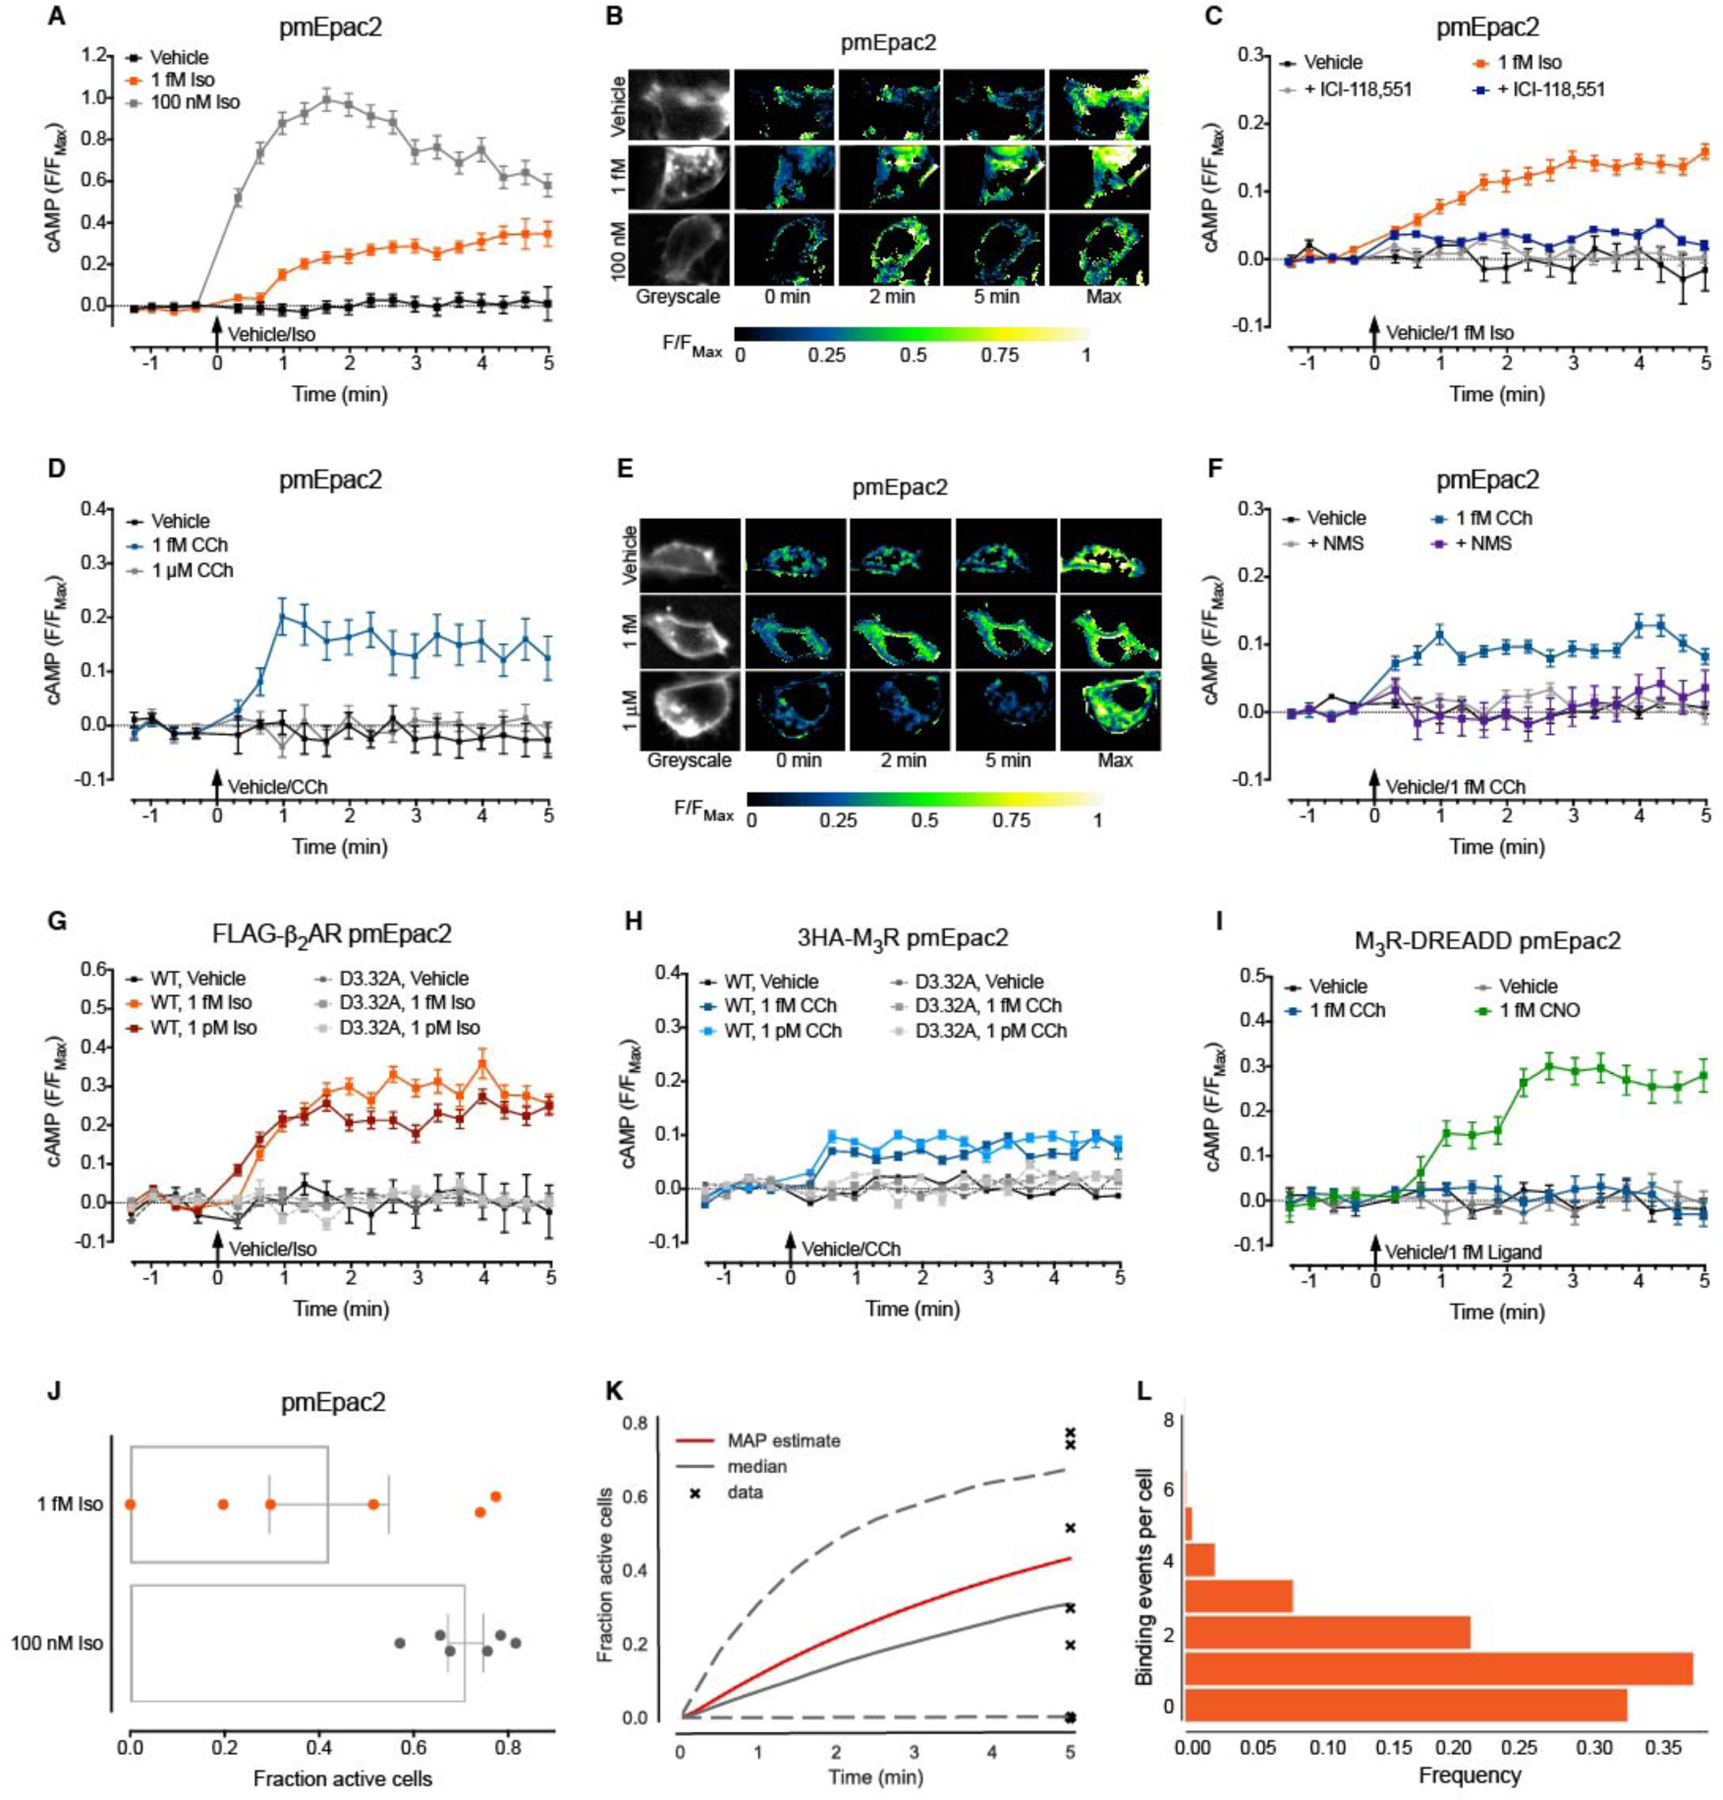
(A-F) cAMP was detected at the plasma membrane in single native HEK293 cells. (A) Stimulation with vehicle (0.0001% v/v ascorbic acid), 1 fM or 100 nM Iso for 5 min (n=47–79 cells). (B) Representative ratiometric pseudocolor images of cells from (A) at selected time points following stimulation. (C) Antagonist pre-incubation (100 nM ICI-118,551, 100x Ki for β2AR, 10 min) and stimulation with vehicle (0.0001% v/v ascorbic acid) or 1 fM Iso for 5 min (n=51–97 cells). (D) Stimulation with vehicle (0.001% v/v milliQ water), 1 fM or 1 μM CCh for 5 min (n=29–53 cells). (E) Representative ratiometric pseudocolor images of cells from (D) at selected time points following stimulation. (F) Antagonist pre-incubation (10 nM N-methyl scopolamine, NMS, 100x Ki for M3R, 10 min) and stimulation with vehicle (0.001% v/v milliQ water) or 1 fM CCh for 5 min (n=56–95 cells). (G-I) cAMP was detected at the plasma membrane in single HEK293 cells transiently expressing receptors. (G) Wild-type (WT) or D3.32A mutant FLAG-β2AR stimulated with vehicle (0.0001% v/v ascorbic acid), 1 fM or 1 pM Iso for 5 min (n=43–151 cells). (H) WT or D3.32A mutant 3HA-M3R stimulated with vehicle (0.001% v/v milliQ water), 1 fM or 1 pM CCh for 5 min (n=119–186 cells). (I) M3R-DREADD stimulated with vehicle (0.001% v/v milliQ water for CCh or 0.01% v/v DMSO for CNO), 1 fM CCh or 1 fM CNO for 5 min (n=57–89 cells). All cells were stimulated at 0 min, and a maximal cAMP response (Max.) was induced after 5 min (10 μM forskolin with 100 μM IBMX and 100 nM PGE1). Individual cells were analyzed from experiments performed on three independent occasions. Data are expressed as the mean ± S.E.M. of n cells, normalized to the maximal cAMP response induced after 5 min (F/FMax). (J) Fraction of responsive HEK293 cells within the field of view following 5 min exposure to 1 fM or 100 nM Iso. Data were analyzed from experiments in Fig. 3, A and B, with an area under the curve (AUC) of greater than 0.697 considered significantly increased compared to vehicle control. Data are expressed as the mean ± S.E.M. of 6 independent experiments. (K) The 95% credible interval for responses to 1 fM Iso over 5 min, using 1,000 randomly subsampled parameter sets from the MCMC sampling procedure. The red line shows the time course with parameters consistent with the maximum a posteriori probability (MAP) estimate. The solid grey line shows the median, and the dashed grey lines show the 95% credible interval for the sub-sampled parameter sets. The data from (J) is shown as crosses; for two of these only a small region (~2%) of sampled parameter space allows the model to reach these points. (L) Normalized frequency of binding for 1 fM Iso from 100 independent model simulations with the MAP estimate parameter set. The average number of binding events is 1.13 per cell.
Activation of GPCRs by femtomolar concentrations of ligand requires an intact orthosteric binding site.
In addition to the primary orthosteric binding site, many GPCRs have allosteric binding sites within the extracellular vestibule of the receptor, which can modulate receptor activity (34). All-atom molecular dynamic simulations have demonstrated that β2AR and M3R ligands make initial contact with this extracellular vestibule prior to achieving the final pose in the orthosteric binding pocket (35, 36). We thus wondered whether this highly responsive state of the β2AR and M3R was due to ligand binding to an allosteric, high affinity binding site, or alternatively, to the canonical orthosteric site.
In cAMP assays, the response to femtomolar concentrations of ligand was masked when receptors were exogenously expressed (e.g. Fig. 1L). However, the plasma membrane-localized cAMP FRET biosensor is more sensitive and has a high spatial resolution; this allowed us to detect cAMP in single cells in response to activation of exogenously expressed receptors by femtomolar concentrations of ligand (fig. S3, A to D). We therefore used this approach to measure cAMP at the plasma membrane of single cells following transient expression of receptors with mutations in the orthosteric binding site. Mutation of a conserved orthosteric binding site residue within transmembrane domain three (D3.32, essential for ligand binding to aminergic receptors (37, 38)) abolished plasma membrane cAMP in response to 1 fM or 1 pM ligand (Fig. 2, G and H and fig. S4, A to D). Canonical signaling in response to high concentrations of Iso and CCh was also inhibited (fig. S4, A and D). To confirm that the orthosteric site was necessary for responses to ultra-low ligand concentrations, we used a well-characterized mutant M3R. The M3R-DREADD (Designer Receptor Exclusively Activated by Designer Drugs) is selectively activated by clozapine-N-oxide (CNO), but not other ligands (39, 40) (fig. S4E). Following expression of M3R-DREADD, only 1 fM CNO, and not CCh, increased plasma membrane cAMP (Fig. 2I and fig. S4E). Taken together, this confirms that activation of the β2AR, M3R and M3R-DREADD by sub-nanomolar concentrations of ligand requires an intact orthosteric binding site.
Mathematical modeling rationalizes GPCR responses to femtomolar concentrations of ligand
Cellular responses to such ultra-low concentrations of GPCR ligands are not typically reported. However, we have clearly shown that these responses can be seen across different cell lines, are observed using distinct cell assays, are receptor dependent (using targeted siRNA and selective antagonists), and can be knocked out by mutation of the orthosteric binding pocket. To further explore the biophysics of receptor activation at such ultra-low ligand concentrations, we developed and analyzed a mathematical model based on chemical kinetics to determine whether the observed cell activation can be explained by a simple ligand-receptor interaction.
We considered a model where activation of a cell is proportional to the number of occupied receptors. We also took into account the fraction of cells in the population that are competent to be activated by ligand (71.1%, determined from single cell FRET experiments using the high concentration of Iso; Fig. 2J). To simulate stochastic ligand-receptor binding kinetics in response to 1 fM Iso we used Gillespie’s algorithm (41). We used a Markov chain Monte Carlo algorithm (MCMC) to sample potential parameter sets and used Bayesian statistics to estimate the probability distributions of the following parameters in our model: kr and kact (dissociation and activation rate constants, respectively), KD (equilibrium dissociation constant) and fc (fraction of cells competent for activation) (see Materials and Methods for model details; fig. S5, A to C). A detailed description of our procedure can be found in (42). MCMC sampling allowed us to calculate credible intervals for the time course of ligand binding in response to 1 fM Iso (Fig. 2K) and the number of binding events per cell (Fig. 2L). From this procedure, we can determine the maximum a posteriori probability (MAP) parameter estimates (analogous to best-fit parameter estimates from non-linear regression). For the MAP parameter estimates, we found that over 70% of the cell population had less than two binding events, and less than 10% had more than two binding events in the allotted time (Fig. 2L). The average number of binding events was slightly more than one per cell. Our model therefore suggests that it is feasible for cells to respond to femtomolar concentrations of ligand, but also predicts that the cells must be sufficiently sensitive (i.e. kact must be sufficiently large) to respond to just one or two binding events per cell. Such highly efficient and amplified signaling is commonly observed in response to cytokines (18). We then input the fastest published on-rate constant (1.2×10¹⁰ M−1min−1 for the μ-opioid receptor ligand carfentanil) and slowest published off-rate constant (4.8×10⁻⁴ min−1 for the M3R ligand tiotropium) for a GPCR ligand (43) to evaluate the capabilities of a “super ligand”. The model revealed that one binding event per cell would occur in response to concentrations of the super ligand as low as 25 aM (attomolar, 10−18M).
Responses to femtomolar concentrations of ligand are dependent on a pre-assembled signaling complex.
We hypothesized that the signal amplification required to cause cell activation in response to one-two ligand binding events per cell may be achieved by the formation of highly specialized signaling complexes to allow rapid and more efficient coupling to intracellular pathways. We therefore sought to identify the signaling proteins involved in the cAMP response to femtomolar concentrations of Iso. The plasma membrane cAMP response was abolished following inhibition of Gαs (NF449), Gβγ (mSIRK, negative control mSIRK L9A) or adenylyl cyclase (AC; 2’,5’-dideoxyadenosine, ddA), suggesting that femtomolar concentrations of Iso leads to Gαs/Gβγ activation of AC to increase plasma membrane cAMP (Fig. 3A and fig. S6, A and B). Consistent with our hypothesis, complexes formed by the β2AR and large scaffolding proteins such as A kinase anchoring protein (AKAP)79, AKAP250, phosphodiesterases (PDEs) and β-arrestins are important for many responses to nanomolar concentrations of ligand (3, 5, 6). We found that the plasma membrane cAMP response to femtomolar concentrations of Iso was dependent on the scaffolding proteins AKAP250 and β-arrestins (Fig. 3A and fig. S6, C to F).
Figure 3. A pre-assembled β2AR signaling complex controls the response to femtomolar concentrations of ligand.
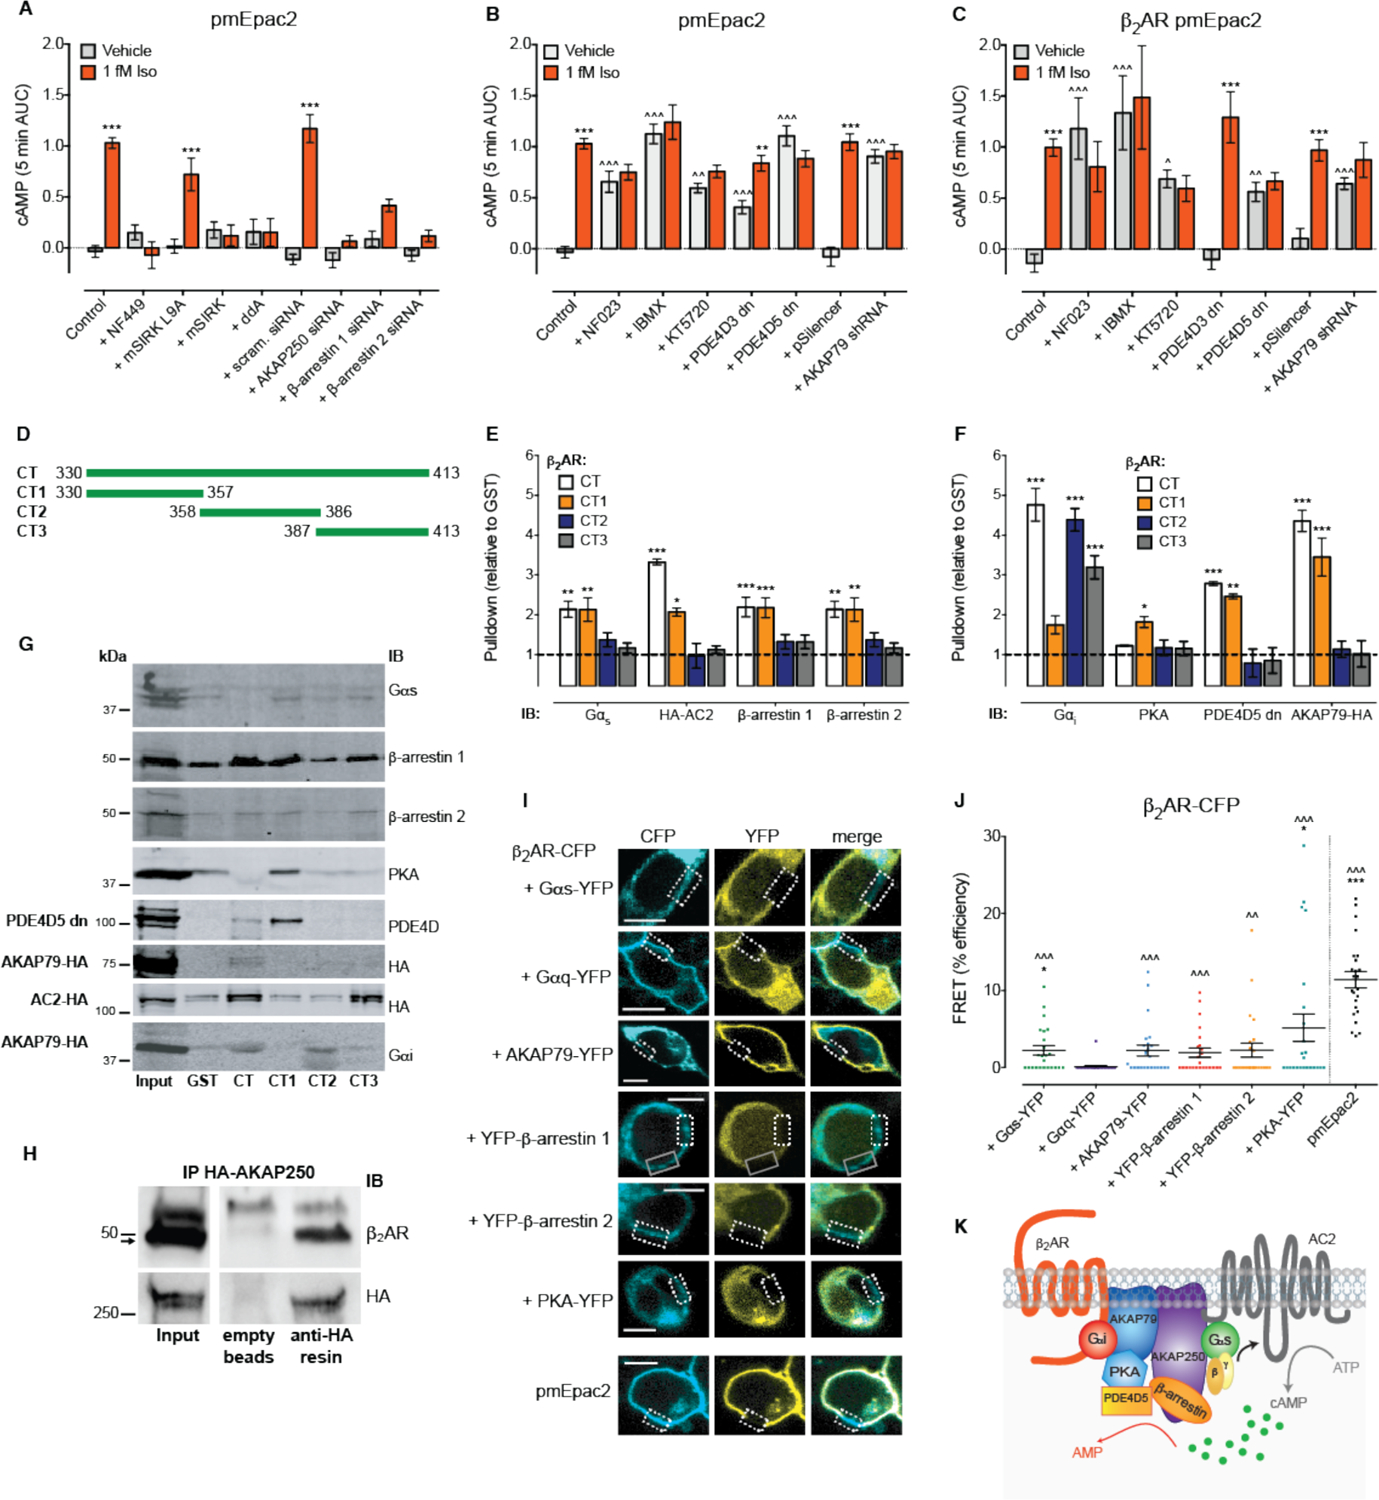
(A-B) cAMP was detected at the plasma membrane in single native HEK293 cells following stimulation with vehicle (0.0001% v/v ascorbic acid) or 1 fM Iso for 5 min. (A) Cells were pre-treated with the Gαs antagonist NF449 (10 μM), the Gβγ inhibitor mSIRK (5 μM) or negative control peptide mSIRK L9A (5 μM), the AC inhibitor 2’,5’-dideoxyadenosine (ddA; 100 μM), or transiently transfected with 25 nM scrambled (scram.), AKAP250, β-arrestin 1 or β-arrestin 2 siRNA (n=36–254 cells). (B) Cells were pre-treated with the Gαi/o antagonist NF023 (10 μM), the PDE inhibitor IBMX (100 μM), the PKA inhibitor KT5720 (1 μM), or transiently transfected with PDE4D3 dominant negative (dn), PDE4D5 dn, pSilencer control or AKAP79 shRNA (n=22–254 cells). (C) cAMP detected at the plasma membrane in HEK293 cells transiently expressing the β2AR following stimulation with vehicle (0.0001% v/v ascorbic acid) or 1 fM Iso for 5 min. Cells were pre-treated with the Gαi/o antagonist NF023 (10 μM), the PDE inhibitor IBMX (100 μM), the PKA inhibitor KT5720 (1 μM), or transiently co-transfected with PDE4D3 dn, PDE4D5 dn, pSilencer control or AKAP79 shRNA (n=22–153 cells). All cells were stimulated at 0 min, and a maximal cAMP response (Max.) was induced after 5 min (10 μM forskolin with 100 μM IBMX and 100 nM PGE1). Individual cells were analyzed from experiments performed on three independent occasions. Data are expressed as the mean ± S.E.M. of n cells, and represented as the 5 min area under the curve (AUC). *** p<0.001 versus vehicle control, two-way ANOVA with Sidak’s multiple comparison test; ^^ p<0.01 and ^^^ p<0.001 versus untreated control, two-way ANOVA with Dunnett’s multiple comparison test. (D) Cartoon showing the regions of the β2AR C-terminal tail (CT) that were tagged with GST. (E-F) Quantification of GST pulldowns from unstimulated native HEK293 lysates. (E) Proteins required for activation of cAMP in response to 1 fM Iso: endogenous Gαs (short and long forms), transfected HA-AC2, endogenous β-arrestin 1 and endogenous β-arrestin 2 (n=5–6). (F) Proteins required for regulation of constitutive activity of the pre-assembled β2AR complex: endogenous Gαi detected following transfection with HA-AC2, PDE4D5 dn or AKAP79-HA, endogenous PKA, transfected PDE4D5 dn and transfected AKAP79-HA (n=3–4). For GST pulldown assays, band densities were normalized for equivalent amounts of GST, and expressed relative to GST alone. Data are mean ± S.E.M. of n independent experiments. * p<0.05 and *** p<0.001 versus GST alone, two-way ANOVA with Dunnett’s multiple comparison test. (G) Representative blots of GST pulldown assays probed with Gαs, β-arrestin 1, β-arrestin 2, PKA, PDE4D, HA or Gαi antibodies. IB, immunoblot. (H) Representative blot of immunoprecipitation (IP) of HA-AKAP250 from lysates of HEK293 cells transiently expressing HA-AKAP250, and probed with β2AR or HA antibodies. (I) Representative images of cells co-expressing β2AR-CFP and a YFP-tagged component of the protein complex, or the positive control pmEpac2, following acceptor photobleaching of a region of the plasma membrane (dotted box). Grey solid box indicates an area of the plasma membrane that was photobleached previously. Scale bar = 10 μm. (J) FRET efficiency at the plasma membrane between β2AR-CFP and YFP-tagged components of the protein complex, calculated from acceptor photobleaching FRET experiments from two regions of interest per cell with four cells analyzed per biological replicate (n=24 ROIs). Data are expressed as the mean ± S.E.M. of n ROIs. * p<0.05 and *** p<0.001 versus β2AR-CFP/Gαq-YFP FRET efficiency, Kruskal-Wallis with Dunn’s multiple comparison test; ^^ p<0.01 and ^^^ p<0.001 versus β2AR-CFP/Gαq-YFP FRET following conversion to binary values (1 = FRET, 0 = no FRET) then Chi-square test. (K) Cartoon of the pre-assembled β2AR signaling complex required for responses to femtomolar concentrations of Iso. Stimulation of cells with 1 fM Iso activates a Gαs-Gβγ stimulation of AC2 that is dependent on AKAP250 and β-arrestins 1 and 2. This increase in cAMP causes the sequential activation of PKA and PDE4D5 which together with Gαi/o, opposes the increase in cAMP. This tonic opposition is dependent on AKAP79. Hierarchy of proteins within the cartoon is based on whether proteins mediate activation or inhibition, and reported protein-protein interactions (3, 5, 53, 59, 85, 86).
The plateau in the cAMP response to ultra-low ligand concentrations (Fig. 1, A, B and D to G) indicates that the balance between production and breakdown of the second messenger is tightly controlled. While the proteins that are required for increased cAMP in response to activation of endogenous receptors are readily identified using inhibitors or genetic targeting, complications may arise when using the same approach to reveal proteins important for cAMP breakdown; any increase in basal cAMP activity could be due to the inhibitors affecting any of the multiple endogenous receptor systems. However, by performing experiments in parallel in cells transiently expressing the β2AR, we can be more confident that observed changes in baseline cAMP are due to a specific effect of the inhibitor on β2AR activity. The efficacy of this approach is illustrated by the identification of distinct proteins involved in the regulation of β2AR vs. M3R basal activity (see below).
As the β2AR can also couple to inhibitory Gαi/o proteins, we first assessed the effect of the Gαi/o antagonist, NF023; inhibition of Gαi/o increased vehicle-stimulated plasma membrane cAMP in native HEK293 cells (Fig. 3B and fig. S6G) and in cells transiently expressing the β2AR (Fig. 3C and fig. S6H). This suggests there is constitutive activity of the endogenous β2AR in these cells which is normally tonically opposed by the activity of Gαi/o. There was no additional increase in plasma membrane cAMP following stimulation with 1 fM Iso, suggesting that there is a ceiling limit for the activation of cAMP by the putative pre-assembled β2AR complex. As cAMP can only be degraded by PDE activity we next examined the effect of a PDE inhibitor, IBMX (3-isobutyl-1-methylxanthine). In cells both endogenously (Fig. 3B and fig. S6I) and exogenously expressing the β2AR (Fig. 3C and fig. S6J), IBMX pre-treatment increased vehicle-stimulated plasma membrane cAMP, with no additional increase following stimulation with 1 fM Iso. The same increase in constitutive plasma membrane cAMP activity was observed following inhibition of protein kinase A (PKA; KT5720), which is activated by cAMP and often controls feedback inhibition pathways (Fig. 3, B and C and fig. S6, I and J). PDE4D contributes a high proportion of PDE activity in HEK293 cells (44), and PKA activates the long isoforms, PDE4D3 and PDE4D5 (45). Over-expression of dominant negative (dn) PDE4D3 dn and PDE4D5 dn caused an increase in vehicle-stimulated plasma membrane cAMP in native HEK293 cells (Fig. 3B and fig. S6, K and L). While 1 fM Iso stimulated an additional increase in plasma membrane cAMP in cells expressing PDE4D3 dn, there was no further increase compared to vehicle in cells expressing PDE4D5 dn. This suggested that while PDE4D5 may regulate the constitutive activity of the pre-assembled β2AR complex, PDE4D3 merely increases basal cAMP globally in the cell. Indeed when we performed the same experiment in cells transiently expressing the β2AR, only co-expression of PDE4D5 dn, but not PDE4D3 dn, caused the same increase in vehicle-stimulated plasma membrane cAMP with no further increase in response to 1 fM Iso (Fig. 3C and fig. S6M). As PKA is tethered in close proximity to the β2AR under resting conditions by the scaffolding protein AKAP79 (3), we assessed the effect of AKAP79 knockdown. Knockdown of AKAP79 (fig. S6N) significantly elevated vehicle-stimulated plasma membrane cAMP, and there was no further increase in plasma membrane cAMP following addition of 1 fM Iso in HEK293 cells endogenously (Fig. 3B and fig. S6O) and exogenously expressing the β2AR (Fig. 3C and fig. S6P). This suggests that AKAP79 plays an important role in regulating responses to 1 fM Iso.
It is interesting that the inhibition of proteins that regulate cAMP causes an increase in signaling under non-stimulated conditions (Fig. 3, B and C). This suggests an inherent constitutive activity of the β2AR signaling complex, and that it may be pre-assembled under non-stimulated conditions. To confirm this, and to also identify the region of the receptor that interacts with the effector proteins, we performed GST pulldowns using the intracellular regions of the β2AR (Fig. 3D and fig. S7A). Under non-stimulated conditions, proteins required for activation and regulation of the β2AR interacted with C-terminal helix 8 (CT1, residues 330–357) (Fig. 3, E to G and fig. S7, A to D). While we could not readily detect interactions with some proteins that were expressed at very low abundance in HEK293 cells (e.g. AC (ADCY), AKAP79 (AKAP5) and PDE4D (PDE4D), see fig. S7E), exogenous expression of the protein of interest allowed detection of interactions with GST-CT1. This also revealed involvement of AC2 in the stimulation of cAMP: Gαs and Gβγ coincidently activate AC2, AC4 and AC7 (46), and β2AR GST-CT1 pulled down exogenously expressed AC2-HA from cell lysates. Further, while we were unable to pull down Gαi from native HEK293 cell lysates, the G protein was pulled down from HEK293 cell lysates transiently expressing AC2-HA, PDE4D5 dn or AKAP79-HA. The propensity of AKAP250 to oligomerize (47) prevented pull down of endogenous or exogenously expressed AKAP250, however, exogenously expressed HA-AKAP250 co-immunoprecipitated with the endogenous β2AR under non-stimulated conditions (Fig. 3H). To confirm that the β2AR signaling complex was pre-assembled at the plasma membrane in intact cells, we used acceptor photobleaching FRET to monitor interactions between β2AR-CFP and some YFP-tagged components of the complex identified in signaling and GST pulldown experiments (Fig. 3I). We measured FRET within two regions of the plasma membrane for each cell analysed. Despite co-localization of proteins, FRET was not always measured in both regions of the plasma membrane (Table S2), suggesting the β2AR signaling complex is only formed in discrete membrane domains. Due to this non-uniform formation of the β2AR signaling complex, the data is not normally distributed. Analysis of the FRET efficiency revealed significant interactions at the plasma membrane under basal conditions between β2AR-CFP and Gαs-YFP and PKA-YFP, versus the negative control Gαq-YFP (Fig. 3J). Conversion of the data to binary values (0 = no FRET, 1 = FRET) revealed significant FRET between β2AR-CFP and all components tested: Gαs-YFP, AKAP79-YFP, YFP-β-arrestin 1 and 2 and PKA-YFP (Fig. 3J and fig. S7F). Therefore, a pre-assembled β2AR signaling complex responds to 1 fM Iso by stimulating a Gαs-Gβγ activation of AC2 to increase cAMP, dependent on AKAP250 and β-arrestins; this cAMP is tonically opposed by Gαi/o inhibition of AC2, and PKA stimulated PDE4D5 activity, dependent on AKAP79 (Fig. 3K).
The cAMP produced following activation of the M3R by 1 fM CCh required a distinct set of proteins to that of the β2AR. There was no effect of Gαs inhibition on the plasma membrane cAMP response to 1 fM CCh (Fig. 4A and fig. S8A) suggesting an alternate pathway can activate AC. Activation of the M3R by micromolar concentrations of CCh induces a cAMP response that is dependent on a signaling complex comprising AKAP79, AC2, PKC, PKA and Gαq/11 (7). Similarly, we found that the plasma membrane cAMP response to femtomolar concentrations of CCh was abolished following inhibition of Gαq/11 (UBO-QIC), Gβγ, PKC (GF109203X) and AC (Fig. 4A and fig. S8, A to C). Thus for the M3R, ultra-low concentrations of ligand lead to Gαq/11-Gβγ activation of PKC which stimulates AC to increase cAMP. In contrast to the β2AR complex, there was no effect of knockdown of AKAP250, however, knockdown of either β-arrestin 1 or β-arrestin 2 abolished the plasma membrane cAMP response to 1 fM CCh (Fig. 4A and fig. S8, D to E).
Figure 4. A pre-assembled M3R signaling complex controls the response to femtomolar concentrations of ligand.
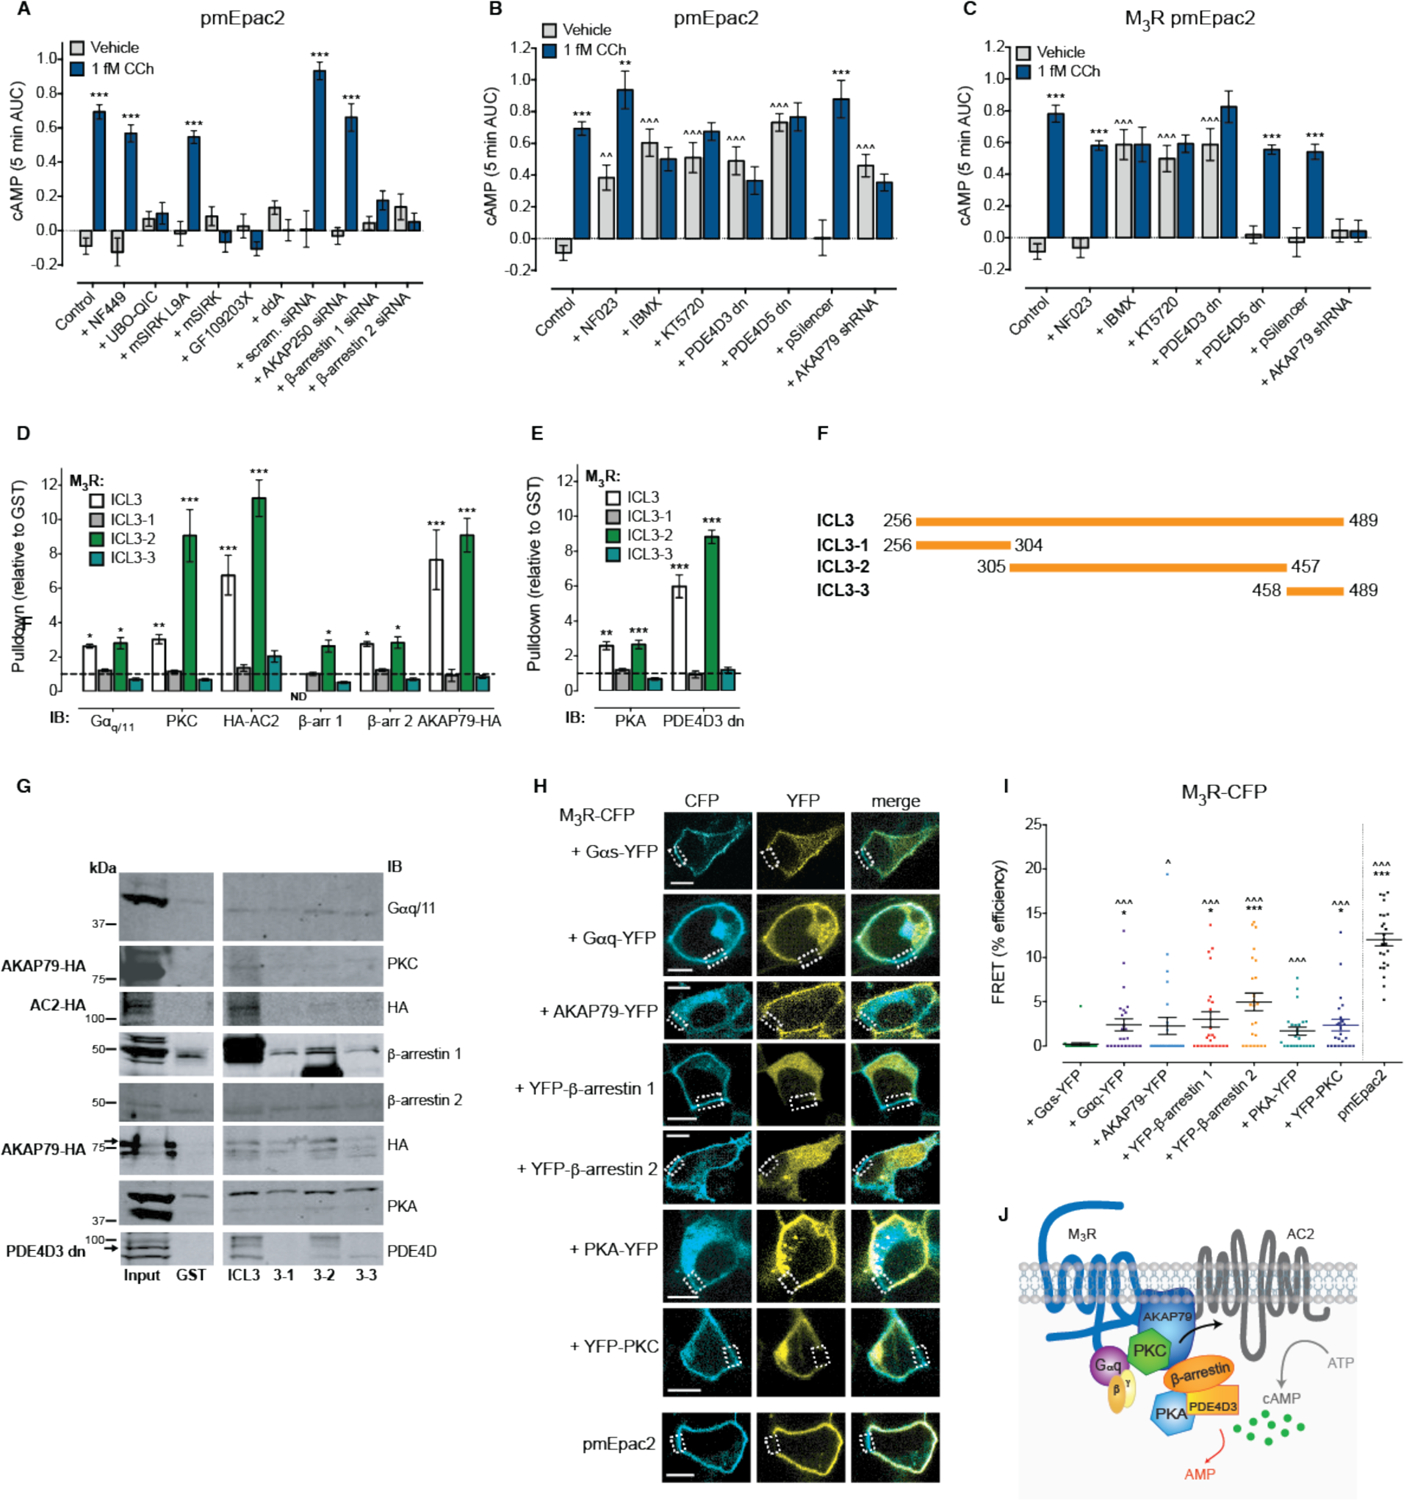
(A-B) cAMP detected at the plasma membrane in single native HEK293 cells following stimulation with vehicle (0.001% v/v milliQ water) or 1 fM CCh for 5 min. (A) Cells were pre-treated with the Gαs antagonist NF449 (10 μM), the Gαq/11 inhibitor UBO-QIC (100 nM), the Gβγ inhibitor mSIRK (5 μM) or negative control peptide mSIRK L9A (5 μM), the PKC inhibitor GF109203X (1 μM), the AC inhibitor 2’,5’-dideoxyadenosine (ddA; 100 μM), or transiently transfected with 25 nM scrambled (scram.), AKAP250, β-arrestin 1 or β-arrestin 2 siRNA (n=39–316 cells). (B) Cells were pre-treated with the Gαi/o antagonist NF023 (10 μM), the PDE inhibitor IBMX (100 μM), the PKA inhibitor KT5720 (1 μM), or transiently transfected with PDE4D3 dn, PDE4D5 dn, pSilencer control or AKAP79 shRNA (n=31–316 cells). (C) cAMP detected at the plasma membrane in HEK293 cells transiently expressing the M3R following stimulation with vehicle (0.001% v/v milliQ water) or 1 fM CCh for 5 min. Cells were pre-treated with the Gαi/o antagonist NF023 (10 μM), the PDE inhibitor IBMX (100 μM), the PKA inhibitor KT5720 (1 μM), or transiently co-transfected with PDE4D3 dn, PDE4D5 dn, pSilencer control or AKAP79 shRNA (n=65–193 cells). All cells were stimulated at 0 min, and a maximal cAMP response (Max.) was induced after 5 min (10 μM forskolin with 100 μM IBMX and 100 nM PGE1). Individual cells were analyzed from experiments performed on three independent occasions. Data are expressed as the mean ± S.E.M. of n cells, and represented as the 5 min area under the curve (AUC). ** p<0.01 and *** p<0.001 versus vehicle control, two-way ANOVA with Sidak’s multiple comparison test; ^^ p<0.01 and ^^^ p<0.001 versus untreated control, two-way ANOVA with Dunnett’s multiple comparison test. (D) Quantification of GST pulldowns from unstimulated native HEK293 lysates of proteins required for activation of cAMP in response to 1 fM CCh: endogenous Gαq/11, endogenous PKC from cells transfected with HA-AC2, PDE4D3 or AKAP79-HA, transfected HA-AC2, endogenous β-arrestin 1, endogenous β-arrestin 2 and transfected AKAP79-HA (n=3–4). (E) Quantification of GST pulldowns from unstimulated native HEK293 cell lysates of proteins required for regulation of constitutive activity of the pre-assembled M3R complex: endogenous PKA and transfected PDE4D3 dn (n=3–4). For GST pulldown assays, band densities were normalized for equivalent amounts of GST, and expressed relative to GST alone. Data are mean ± S.E.M. of n independent experiments. * p<0.05, ** p<0.01 and *** p<0.001 versus GST alone, two-way ANOVA with Dunnett’s multiple comparison test. (F) Cartoon showing the regions of the M3R third intracellular loop (ICL3) that were tagged with GST. (G) Representative blots of GST pulldown assays probed with Gαq/11, PKC, HA, β-arrestin 1, β-arrestin 2, PKA or PDE4D antibodies. IB, immunoblot. (H) Representative images of cells co-expressing M3R-CFP and a YFP-tagged component of the protein complex, or the positive control pmEpac2, following acceptor photobleaching of a region of the plasma membrane (dotted box). Scale bar = 10 μm. (I) FRET efficiency at the plasma membrane between M3R-CFP and YFP-tagged components of the protein complex, calculated from acceptor photobleaching FRET experiments from two regions of interest per cell with four cells analyzed per biological replicate (n=24 ROIs). Data are expressed as the mean ± S.E.M. of n ROIs. * p<0.05 and *** p<0.001 versus M3R-CFP/Gαs-YFP FRET efficiency, Kruskal-Wallis with Dunn’s multiple comparison test; ^ p<0.05 and ^^^ p<0.001 versus M3R-CFP/Gαs-YFP FRET following conversion to binary values (1 = FRET, 0 = no FRET) then Chi-square test. (J) Cartoon of the pre-assembled M3R signaling complex required for responses to femtomolar concentrations of CCh. Stimulation of cells with 1 fM CCh activates a Gαq/11-Gβγ-PKC stimulation of AC2 that is dependent on AKAP79 and β-arrestins 1 and 2. This increase in cAMP causes the sequential activation of PKA and PDE4D3, which opposes the increase in cAMP. Hierarchy of proteins within the cartoon is based on reported protein-protein interactions (5, 55, 63).
As observed for the β2AR (Fig. 3, B and C), inhibition of Gαi/o increased vehicle-stimulated plasma membrane cAMP in native HEK293 cells, however 1 fM CCh stimulated a further increase in plasma membrane cAMP compared to the vehicle control (Fig. 4B and fig. S8F). This suggests that Gαi/o does not regulate the pre-assembled M3R signaling complex. Indeed, in HEK293 cells transiently expressing the M3R there was no effect of NF023 on the plasma membrane cAMP produced in response to vehicle or 1 fM CCh (Fig. 4C and fig. S8G). In contrast, inhibition of PDEs or PKA increased vehicle-stimulated plasma membrane cAMP in both native HEK293 cells (Fig. 4B and fig. S8H) and following transient expression of the M3R (Fig. 4C and fig. S8I), with no further increase in plasma membrane cAMP following stimulation with 1 fM CCh. This confirmed that the M3R also displays an inherent constitutive activity that is likely due to pre-assembly of a signaling complex, as identified for the β2AR. Expression of both PDE4D3 dn and PDE4D5 dn in native HEK293 cells caused a significant increase in vehicle-stimulated plasma membrane cAMP, with no further increase in plasma membrane cAMP in response to 1 fM CCh (Fig. 4B and fig. S8J). However, following co-expression of the M3R, only PDE4D3 dn caused an increase in vehicle-treated plasma membrane cAMP with no further increase in response to 1 fM CCh (Fig. 4C and fig. S8K). Therefore, as for responses to high concentrations of CCh (7), PDE4D3 regulates cAMP activity of the M3R. AKAP79 was required for negative regulation of the activity of the β2AR complex; although knockdown of AKAP79 again increased vehicle-stimulated plasma membrane cAMP in native HEK293 cells (Fig. 4B and fig. S8L), in cells transiently co-expressing the M3R (Fig. 4C and fig. S8M) there was no effect on vehicle-treated plasma membrane cAMP but the response to 1 fM CCh was abolished. Thus as for cAMP responses to micromolar concentrations of CCh (7), an increase in cAMP in response to 1 fM CCh is dependent on AKAP79.
To confirm that these proteins can pre-assemble with the M3R, we performed GST pulldowns from unstimulated HEK293 cell lysates, and showed that all proteins required residues 305–457 of the third intracellular loop (ICL3) for assembly with the M3R (Fig. 4, D to G and fig. S9, A to D). As for the β2AR, while we could not observe endogenous interactions with some proteins that were expressed at very low abundance in HEK293 cells (e.g. AC (ADCY), AKAP79 (AKAP5) and PDE4D (PDE4D), see fig. S7E), exogenous expression of the protein of interest allowed detection of interactions with the GST-ICL2, ICL3–2 and CT (Fig. 4, D to G and fig. S9, A to D). Again, this also revealed involvement of AC2 in the stimulation of cAMP: PKC and Gβγ can activate AC2 (46), and M3R GST-ICL3–2 pulled down exogenously expressed AC2-HA from cell lysates. We were unable to pull down PKC from native HEK293 cell lysates, however the kinase was pulled down by ICL3–2 from cell lysates transiently expressing AC2-HA, AKAP79-HA or PDE4D3 dn (Fig. 4, D and G). As with the β2AR, to confirm pre-assembly of the M3R signaling complex at the plasma membrane of intact cells, we used acceptor photobleaching FRET between M3R-CFP and YFP-tagged components of the signaling complex (Fig. 4H). Formation of the M3R complex did not always occur in regions of protein co-localization (Table S2) and the data was non-normally distributed suggesting the M3R signaling complex forms in discrete regions of the plasma membrane. Analysis of the FRET efficiency revealed significant interactions between M3R-CFP and Gαq-YFP, YFP-β-arrestins 1 and 2, and YFP-PKC, versus the negative control Gαs-YFP (Fig. 4I). Following conversion of the data to binary values (0 = no FRET, 1 = FRET), we observed significant FRET between the M3R-CFP and all components tested: Gαq-YFP, AKAP79-YFP, YFP-β-arrestins 1 and 2, PKA-YFP and YFP-PKC (fig. S9E). Therefore, a pre-assembled M3R signaling complex responds to 1 fM CCh by stimulating a Gαq/11-Gβγ-PKC activation of AC2 to increase cAMP, dependent on AKAP79 and β-arrestins; this cAMP is tonically opposed by PKA stimulated PDE4D3 (Fig. 4J).
Together, these data reveal that while activation of the β2AR and M3R by femtomolar concentrations of ligand produces the same sustained increase in cAMP, the responses require pre-assembly of signaling complexes comprising a distinct subset of proteins that associate with different regions of the receptors (Fig. 3K and 4J).
GPCRs activate sustained, compartmentalized signals in response to femtomolar concentrations of ligand.
Next we investigated whether signaling in response to femtomolar concentrations of ligand extends to pathways other than cAMP, whether this signaling differs from that induced by high concentrations of ligand, and whether this also occurs in human cardiac fibroblasts. Activation of the endogenous β2AR in single HEK293 cells and single human cardiac fibroblasts did not affect cytosolic ERK, but increased nuclear ERK (Fig. 5, A to D and fig. S10A). Mimicking the temporal dynamics of the cAMP response (Fig. 5, E and F), 1 fM Iso caused a sustained increase in nuclear ERK, whereas 100 nM Iso resulted in a transient signal (Fig. 5, A and D). There was no effect of either concentration of CCh on ERK activity in HEK293 cells (Fig. 5C), although a high concentration of CCh (1 μM) caused a transient increase in nuclear ERK in the cardiac fibroblasts (fig. S10B). In contrast, 1 fM CCh caused a sustained increase in cytosolic, but not plasma membrane-localized PKC activity in both cell types (Fig. 5, G to J and fig. S10C); whereas a high concentration (1 μM) generated a transient increase in cytosolic PKC in both cells and an increase in plasma membrane PKC in the cardiac fibroblasts (Fig. 5, G to J and fig. S10C). This again mimicked the temporal dynamics of the M3R cAMP response: 1 fM CCh caused a sustained increase in plasma membrane-localized cAMP, whereas 1 μM CCh induced a delayed and transient increase in plasma membrane cAMP which peaked at 15 min in HEK293 cells and at 5 min in the cardiac fibroblasts (Fig. 5, K and L). There was no effect of either concentration of Iso on PKC activity in the two cell types (Fig. 5I and fig. S10D). Therefore, activation of GPCRs by ultra-low concentrations of ligand also affects other intracellular signaling pathways. In contrast to responses to high concentrations of ligand, this signaling is sustained and restricted to defined sub-cellular compartments. This demonstrates that activation of GPCRs by ultra-low concentrations of ligand induces signaling that is qualitatively different compared to that activated by concentrations in the canonical nanomolar to micromolar range.
Figure 5. Stimulation of the β2AR- and M3R by femtomolar concentrations of ligand activates sustained and compartmentalized kinase signaling.

(A-F) Single native cells were stimulated with vehicle (0.0001% v/v ascorbic acid), 1 fM or 100 nM Iso for 20 min. (A) ERK activity detected in the nucleus of HEK293 cells (n=118–133 cells). Data are normalized to the maximal ERK response induced after 20 min (F/FMax). (B) Representative ratiometric pseudocolor images of cells from (A) at selected time points following stimulation. (C) ERK activity detected in the cytosol (cytoEKAR) or nucleus (nucEKAR) of HEK293 cells. Cells were also stimulated with vehicle (0.001% v/v milliQ water for CCh) or 1 fM CCh for 20 min (n=13–130 cells). Data is represented as the 20 min area under the curve (AUC). (D) ERK activity detected in the nucleus of human cardiac fibroblasts (CF) (n=38–61 cells). Data are normalized to the baseline ERK response (F/F0). (E) cAMP detected at the plasma membrane in HEK293 cells (n=31–44 cells). Data are normalized to the maximal cAMP response induced after 20 min (F/FMax). (F) cAMP detected at the plasma membrane of human cardiac fibroblasts (CF) (n=22–53 cells). Data are normalized to the baseline cAMP response (F/F0). (G-L) Single native cells were stimulated with vehicle (0.001% v/v milliQ water), 1 fM or 1 μM CCh for 20 min. (G) PKC activity detected in the cytosol of HEK293 cells (n=185–226 cells). Data are normalized to the maximal PKC response induced after 20 min (F/FMax). (H) Representative ratiometric pseudocolor images of cells from (G) at selected time points following stimulation. (I) PKC activity detected at the plasma membrane (pmCKAR) or in the cytosol (cytoCKAR) of HEK293 cells. Cells were also stimulated with vehicle (0.0001% v/v ascorbic acid for Iso) or 1 fM Iso (n=10–175 cells). Data is represented as the 20 min AUC. (J) PKC activity detected in the cytosol of human cardiac fibroblasts (CF) (n=69–124 cells). Data are normalized to the baseline PKC response (F/F0). (K) cAMP detected at the plasma membrane of HEK293 cells (n=32–44 cells). Data are normalized to the maximal cAMP response induced after 20 min (F/FMax). The increase in cAMP in response to 1 μM CCh returns to baseline by 20 min and therefore was not detected by cAMP assays in cell populations, which were performed after 30 min stimulation in the absence of IBMX (Fig. 1B). (L) cAMP detected at the plasma membrane of human cardiac fibroblasts (CF) (n=31–50 cells). Data are normalized to the baseline cAMP response (F/F0). All cells were stimulated at 0 min, and a maximal ERK, PKC or cAMP response (Max.) was induced after 20 min (100 nM PDBu for ERK, 100 nM PDBu with phosphatase inhibitors for PKC or 10 μM forskolin with 100 μM IBMX and 100 nM PGE1 for cAMP). Individual cells were analyzed from experiments performed on three independent occasions. Data are expressed as the mean ± S.E.M. of n cells. *** p<0.001 versus vehicle control, two-way ANOVA with Sidak’s multiple comparison test.
Activation of GPCRs by femtomolar concentrations of ligand causes a unique cellular response.
The location and duration of intracellular signals is extremely important in generating unique cellular responses (2, 4, 9). As GPCR activation by femtomolar concentrations of ligand causes sustained signals in defined cellular compartments, this suggests that each femtomolar GPCR response may orchestrate a distinct cellular signal compared to both higher ligand concentrations and other ligands at femtomolar concentrations. Here we employed proteomic analysis as a sensitive and global assessment of the consequences of activation of endogenous GPCRs by femtomolar concentrations of ligand in HEK293 cells. Activation of endogenous GPCRs induced a proteomic pattern that was unique for both the receptor and ligand concentration (Fig. 6, A and B and Table S3). For the β2AR, the abundance of 86 proteins was uniquely affected by 1 fM Iso compared to vehicle or 100 nM Iso. Of these, we identified proteins that were exclusively increased in response to 1 fM Iso, but not by 100 nM Iso or either concentration of CCh. These included five proteins that have a role in RNA processing and transport (Fig. 6C): RPS16 (ribosomal subunit 16) is a component of the 40S ribosomal subunit; NUP43 (nucleoporin 43) is a component of the nuclear pore complex; HNRNPM (heterogeneous nuclear ribonucleoprotein M) binds heterogeneous nuclear RNA to influence mRNA processing, metabolism and transport; MORC3 (MORC family CW-type Zinc finger 3) binds RNA and is localized to the nuclear matrix; and FBL (fibrillarin) is a component of a nucleolar small ribonucleoprotein involved in pre-rRNA processing. This, in addition to the sustained increase in nuclear ERK (Fig. 5, A to C), suggested that ultra-low concentrations of Iso may affect gene transcription. In agreement with the proteomic data, over 4 hours only 1 fM Iso, and not 100 nM Iso or CCh, increased gene transcription (Fig. 6, D and E) as assessed by a GFP reporter under the control of the constitutive promoter, EF1α. We observed the same increase in gene transcription in response to 1 fM Iso, but not 100 nM Iso or CCh, in the human cardiac fibroblasts (Fig. 6, F and G). In HEK293 cells we observed no effect of inhibition of Gαi/o (NF023) on the lack of effect of 100 nM Iso (fig. S10E). This shows that the absence of a signal to 100 nM Iso is not due to additional activation of inhibitory pathways and therefore that responses to 1 fM and 100 nM Iso are qualitatively different. Together, these data demonstrate a unique role in increased gene transcription for activation of the β2AR by femtomolar concentrations of ligand that crucially, is not triggered by higher concentrations.
Figure 6. Activation of the β2AR and M3R by femtomolar concentrations of ligand causes distinct whole cell responses.
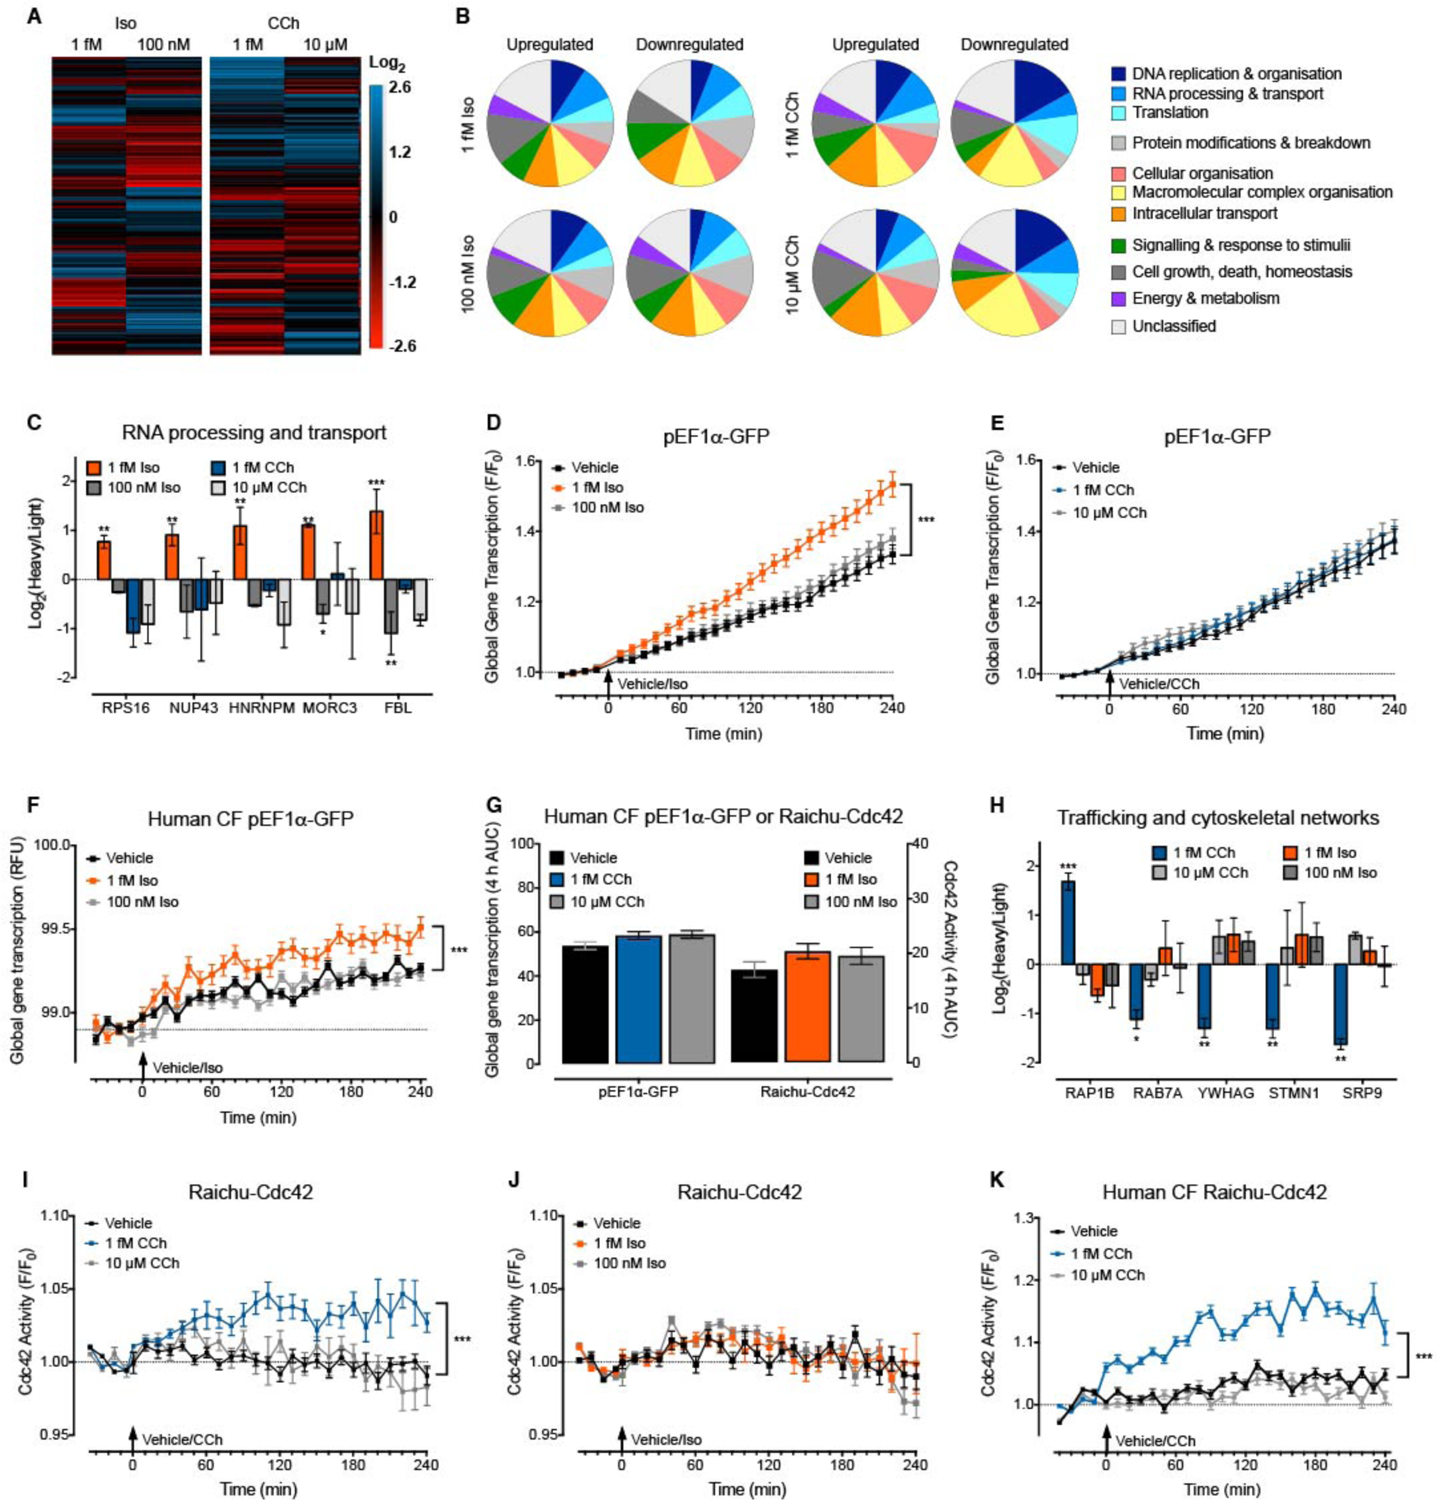
(A) Representative (from n=3) hierarchical clustering of proteins with increased (blue) or decreased (red) abundance in native HEK293 cell populations following stimulation with vehicle (0.0001% v/v ascorbic acid for Iso or 0.001% v/v milliQ water for CCh), 1 fM or 100 nM Iso, or 1 fM or 10 μM CCh for 4 hours. Data are expressed as the ligand-stimulated log2 change in protein abundance compared to vehicle (see also Table S3). (B) Proteins with a significant increase or decrease in abundance in native HEK293 cells following stimulation as per (A) were classified by Gene Ontology (GO) biological process term, and grouped into the following categories: DNA replication & organization; RNA processing & transport; Translation; Protein modifications & breakdown; Cellular organization; Macromolecular complex organization; Intracellular transport; Signaling & response to stimuli; Cell growth, death, homeostasis; Energy & metabolism; or Unclassified. A GO biological process term occurred in two out of the three biological replicates to be included in the analysis. The proportion of proteins in each category is represented in the pie charts. (C) Log2 change in protein abundance vs. vehicle control for RPS16, NUP43, HNRNPM, MORC3 and FBL in native HEK293 cells following stimulation with 1 fM or 100 nM Iso, or 1 fM or 10 μM CCh for 4 hours (n=3). These proteins are involved in RNA processing and transport. (D-E) GFP fluorescence in single native HEK293 cells expressing the constitutive promoter pEF1α-GFP reporter gene following stimulation with (D) vehicle (0.0001% v/v ascorbic acid), 1 fM or 100 nM Iso (n=196–204 cells) or (E) vehicle (0.001% v/v milliQ), 1 fM or 10 μM CCh (n=177–194 cells) for 4 h. Individual cells were analyzed from experiments performed on three independent occasions. Data are expressed relative to baseline fluorescence (F/F0). (F) GFP fluorescence in single human cardiac fibroblasts (CF) expressing the constitutive promoter pEF1α-GFP reporter gene following stimulation with vehicle (0.0001% v/v ascorbic acid), 1 fM or 100 nM Iso (n=64–107 cells) for 4 h. Individual cells were analyzed from experiments performed on four independent occasions. Data are expressed as relative fluorescence units (RFU) per cell. (G) GFP fluorescence in single human cardiac fibroblasts (CF) expressing the constitutive promoter pEF1α-GFP reporter gene following stimulation with vehicle (0.001% v/v milliQ), 1 fM or 10 μM CCh (n=109–121 cells), and activation of Cdc42 in single human CF following stimulation with vehicle (0.0001% v/v ascorbic acid), 1 fM or 100 nM Iso (n=133–178 cells) expressed as the 4 hour area under the curve (AUC). (H) Log2 change in protein abundance versus vehicle control for RAP1B, RAB7A, YWHAG, STMN1 and SRP9 in native HEK293 cell populations following stimulation with 1 fM or 10 μM CCh, or 1 fM or 100 nM Iso for 4 hours (n=3). These proteins are involved in protein trafficking and cytoskeletal networks. (I-J) Activation of Cdc42 in single native HEK293 cells following stimulation with (I) vehicle (0.001% v/v milliQ), 1 fM or 10 μM CCh (n=305–323 cells) or (J) vehicle (0.0001% v/v ascorbic acid), 1 fM or 100 nM Iso (n=304–401 cells) for 4 h. Individual cells were analyzed from experiments performed on three independent occasions. Data are expressed relative to baseline FRET (F/F0). (K) Activation of Cdc42 in single human cardiac fibroblasts (CF) following stimulation with vehicle (0.001% v/v milliQ), 1 fM or 10 μM CCh (n=150–159 cells) for 4 h. Individual cells were analyzed from experiments performed on three independent occasions. Data are expressed relative to baseline FRET (F/F0). All data are expressed as the mean ± S.E.M. of n cells or independent experiments. (C, H) * p<0.05 and ** p<0.01 versus vehicle control, two-way ANOVA with Dunnett’s multiple comparison test. (D, F, I, K) *** p<0.001 versus vehicle control, two-way ANOVA.
Similarly for the M3R, the abundance of 82 proteins was uniquely affected by 1 fM CCh compared to vehicle or 10 μM CCh. Of these, we identified proteins were exclusively increased in response to 1 fM CCh, but unaffected by 10 μM CCh or either concentration of Iso. These included five proteins that affect trafficking and cytoskeletal networks (Fig. 6H): RAP1B (a Ras-like GTP binding protein) regulates cell adhesion, growth and proliferation; RAB7A (a Ras-like GTP binding protein) regulates vesicle trafficking within the endosomal network; YWHAG (14-3-3γ) belongs to the 14-3-3 family of scaffolding proteins which are integration points for proliferative, survival, apoptotic and stress signaling pathways; STMN1 (stathmin 1) promotes disassembly of microtubules; and SRP9 (signal recognition particle 9kDa) has a crucial role in targeting secretory proteins to the rough endoplasmic reticulum. This suggested that ultra-low concentrations of CCh might be important for the regulation of cytoskeletal organization and cellular trafficking. To test this hypothesis we used a FRET biosensor that reports activation of the Rho GTPase, Cdc42 (48); Rho GTPases are important regulators of cytoskeletal organization and trafficking (49). Indeed, in agreement with the proteomic data, over 4 hours only 1 fM CCh caused an increase in Cdc42 activity (Fig. 6, I and J). We observed the same increase in Cdc42 activity in response to 1 fM CCh, but not 10 μM CCh or Iso, in the human cardiac fibroblasts (Fig. 6, G and K). As for cAMP, in HEK293 cells there was no effect of inhibition of Gαi/o (NF023) on the lack of effect of 10 μM CCh (fig. S10F). This shows that 10 μM CCh does not increase Cdc42 activity, and that the responses to 1 fM and 10 μM CCh are qualitatively different. Therefore, activation of the M3R by femtomolar concentrations of CCh causes an increase in Cdc42 activity, which can impact many basic cellular processes including cell morphology, migration, endocytosis and cell cycle progression (49). As for the β2AR, these data demonstrate that activation of the M3R by ultra-low, compared to high, ligand concentrations generates a unique cellular response.
Discussion
The current findings uncover a new dimension to GPCR signaling, with many prototypical GPCRs initiating distinct cellular responses to sub-nanomolar concentrations of ligand. This increased sensitivity of GPCRs to ligand is observed in multiple cell types, is receptor dependent and requires an intact orthosteric binding site. Mathematical modeling suggests that these responses are triggered in an individual cell by one-two binding events, which would necessitate signal amplification. The pre-assembled signaling complex identified may play an important role in amplifying the response to individual receptor binding events by allowing highly efficient coupling to the signaling machinery. Activation of GPCRs by ultra-low concentrations of ligand causes sustained signals within defined sub-cellular compartments. In contrast, higher concentrations of ligand allow many more binding events to both complexed and any uncomplexed receptors, to generate qualitatively different responses at the whole cell level (Fig. 7).
Figure 7. GPCR signaling complexes respond to femtomolar concentrations of ligand.
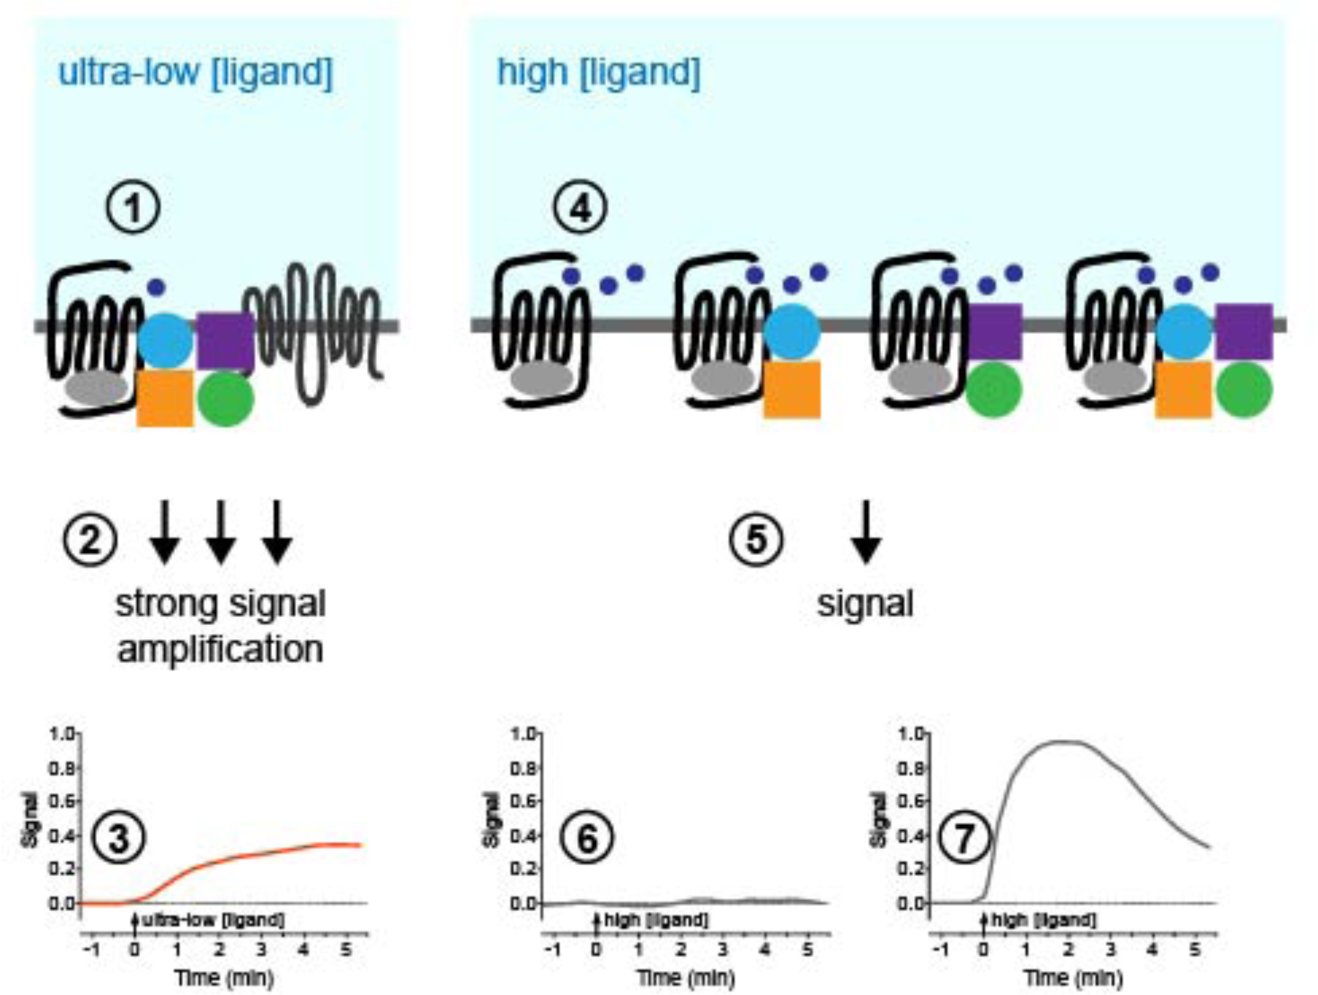
GPCRs exist in pre-assembled protein complexes at the plasma membrane. (1) Simulation of stochastic ligand-receptor binding kinetics reveals that the addition of a 1 fM solution of ligand under our assay conditions would result in an average of one-two binding events per cell within 5 min. (2) One-two binding events stimulates strong signal amplification, dependent on a pre-assembled protein complex at the plasma membrane, that results in (3) a relatively slow and gradual increase in the signal over time. (4) Addition of a high concentration solution (e.g. 100 nM Iso or 1 μM CCh) results in a much greater number of binding events and activates both complexed and any uncomplexed receptors. (5) The resulting activation stimulates a qualitatively different signal e.g. (6) no signal (CCh-stimulated cAMP, EF1α gene transcription, Cdc42 activity) or (7) a more rapid increase in the signal that then declines (Iso-stimulated cAMP, nuclear ERK, cytosolic PKC).
While a sensitivity to femtomolar concentrations of biological compounds is well below the accepted binding affinity of GPCRs, we were able to simulate stochastic ligand binding kinetics to reveal that the addition of femtomolar solutions of ligand under our assay conditions would result in roughly one binding event per cell on average within 5 min. This suggests firstly, that responses to ultra-low concentrations of ligand are triggered by only a few GPCRs at the cell surface, and secondly, that activation of one-two receptors results in highly efficient signal amplification. Such signal amplification resulting from activation of only a few receptors at the cell surface is commonly observed for cytokines (18). There are a number of ways in which such a high degree of signal amplification could occur. Studies using inhibitors, GST pulldowns and acceptor photobleaching FRET suggest that a pre-assembled functional, higher-order signaling complex is essential for responses to ultra-low concentrations of ligand, and that the inherent activity of the GPCR is tightly controlled and ‘capped’. The close proximity of receptor, G proteins and effectors would allow a small number of activated receptors to cause a very rapid increase in signaling. Moreover, an assembled signaling complex may alter the local environment of a ligand near a receptor in such a way that the ligand spends more time in close proximity to the receptor, perhaps allowing a ligand to rebind the receptor multiple times or to bind to the receptor for a longer time, thereby increasing the apparent sensitivity of the receptor to the ligand (50, 51). Indeed, the mere presence of β2AR at the plasma membrane of cells can more than double the local concentration of ligand (52). In addition, if these signaling complexes cluster due to oligomerization of AKAPs (47, 53), this would result in a high local concentration of receptors at the plasma membrane, with the clustered receptors effectively acting as a “ligand sink” to again increase the apparent receptor affinity. Finally, the protein-protein interactions within the complex may allosterically alter the properties of other associated proteins. This could conceivably result in higher affinity binding by the receptor, by locking the transmembrane helices in an open conformation or reducing the dynamic fluctuations of the ligand binding site, to increase ligand accessibility to the binding pocket or to stabilize the ligand receptor interaction to generate a signal robust enough to elicit a cellular response. In fact, binding of a positive allosteric nanobody to the intracellular regions of the β2AR can increase the affinity of Iso by up to 15,000-fold (54); this demonstrates that intracellular allosteric modulation of a subset of receptors could create two defined receptor populations with widely different ligand sensitivity. Allosteric interactions within the signaling complex may also lower the activation threshold of G proteins and other effectors. Previous studies suggest that the association of PKC with AKAP79 ‘locks’ the kinase into an active conformation and it becomes insensitive to the ATP class of competitive inhibitors (55, 56). For the M3R, this heightened PKC activity could be very important for facilitating the efficient activation of AC2 by the kinase in response to ultra-low concentrations of CCh.
It is interesting to note that the activation and regulation of cAMP following stimulation of both the β2AR and M3R by femtomolar concentrations of ligand involves many proteins that are also required for responses to high concentrations of ligand (3, 5–7, 57). As such, although high sensitivity responses are associated with many familiar components of GPCR signaling, the dynamics of the interacting proteins within the signaling complex must differ depending on the abundance of ligand to produce unique signaling outcomes. The proteins of the pre-assembled β2AR complex were found to interact with the CT1 region of the C-terminal tail. This is consistent with previous reports of interactions between the C-terminal tail of the β2AR and proteins including AKAP79, AKAP250, PKA, G protein receptor kinase (GRK) 2 and Src (3, 58, 59). All proteins within the pre-assembled M3R complex were found to interact with ICL3. This is also consistent with previous reports of interactions between the M3R-ICL3 and proteins including Gαq/11, Gβγ, phospholipase Cβ, GRKs, β-arrestins and casein kinase 2 (60–63). Moreover, conformational changes within this loop region are important for the formation of M3R dimers (64). As such, for both the β2AR and M3R a large number of proteins interact with the receptors via the same intracellular region. However, crystal structures of the β2AR in complex with Gαs (65) and electron microscopy reconstruction of the β2AR in complex with β-arrestin (66) or a β2AR/V2 vasopressin receptor chimera in complex with both Gαs and β-arrestin (67), suggest that there is little available space for any additional proteins to interact with a monomeric receptor. Nevertheless, this may be made feasible due to the highly flexible structure of AKAPs, and the observation that both AKAP250 and AKAP79 have a propensity to form higher-order homo- and hetero-oligomeric structures (47, 53). AKAPs may therefore represent an important mechanism to support the efficient scaffolding of a large number of proteins. Consequently, we may envisage a higher-order assembly of a signaling complex, which by scaffolding a large number of effector proteins generates a high degree of signal amplification in close proximity to the receptor.
Responses to very subtle environmental cues have been described from bacteria to mammals. Some metalloregulatory proteins have femtomolar sensitivity to control zinc homeostasis in bacteria (68, 69), and it is proposed that E.coli use sub-femtomolar zinc sensing to gain information about the host niche and form biofilms only in certain environments (70). Here we show that mammalian cells can generate qualitatively unique responses to ultra-low concentrations of GPCR ligands. It is therefore tempting to speculate that the purpose of this high sensitivity is similar: to assess or sample the niche of the cell and to tailor cellular phenotypes accordingly. Thus we could anticipate that cells exposed to ultra-low concentrations of adrenaline may develop a distinct phenotype to cells that are exposed to ultra-low concentrations of acetylcholine. We suggest that this increased dynamic range of GPCR signaling is widespread throughout this receptor superfamily, and that a low level of continuous receptor activation may play a critical role in maintaining cell phenotypes in response to subtle environmental cues. The realization that many prototypical GPCRs respond to ultra-low concentrations of ligand has important implications for the current understanding of GPCR signaling.
Materials and Methods
cDNAs, antibodies and methods for supplementary figures are described in Supplementary Materials and Methods.
Cell culture
HEK293 and CHO-K1 cells (ATCC; negative for mycoplasma contamination) were used as well-characterized generic cell lines with endogenous expression of GPCRs. The cells were grown in DMEM supplemented with 5% v/v FBS. For HEK293 cells all assay dishes and plates were pre-coated with poly-D-lysine (5 μg/cm2). Primary cultures of human cardiac fibroblasts (ScienCell) were grown in poly-L-lysine coated culture flasks (2 μg/cm2) in DMEM supplemented with 5% v/v FBS, fibroblast growth supplement 2 (ScienCell), 100 U/mL penicillin and 100 μg/mL streptomycin.
HEK293 cells were transfected using linear polyethyleneimine (PEI) (71). For experiments using single transfection of siRNA (AlphaScreen cAMP assay), cells were transfected with 25 nM scrambled, β2AR or M3R SMARTpool ON-TARGETplus siRNA (GE Dharmacon) using Lipofectamine 2000 (Invitrogen). Human cardiac fibroblasts were transfected using X-tremeGENE 9 (Roche) at a 1:3 DNA:transfection reagent ratio.
qRT-PCR
RNA was extracted from HEK293 cells and primary human cardiac fibroblasts using the RNeasy Mini Kit (Qiagen). qRT-PCR was performed in triplicate from 100 ng RNA using the iScript One-Step RTPCR Kit (Bio-Rad) and CFX96 Real Time System (Bio-Rad) according to manufacturer’s instructions. TaqMan probes (Applied Biosystems) used in this study were: ADRB2: Hs00240532_s1; CHRM3: Hs00265216_s1 and ACTB: Hs99999903_m1. The 2−ΔCT method(72) was used to analyze results and data are expressed as 2−ΔCT (difference in Ct value of the gene of interest relative to the housekeeping gene, ACTB) from n biological repeats as stated.
AlphaScreen cAMP assay
cAMP from cell populations was measured in duplicate using the AlphaScreen cAMP accumulation assay (PerkinElmer) as described previously (73) with the following modifications to ensure the maximum dynamic range and sensitivity. Cells were seeded into 96-well plates and grown to confluency. On the day of the experiment, cells were pre-incubated with stimulation buffer (HBSS with 5 mM HEPES, 5.6 mM glucose, 1.3 mM CaCl2, 0.1% w/v BSA, pH 7.4) for 45 min at 37°C, prior to addition of ligands, vehicle or positive control (50 μM forskolin, 100 μM IBMX) diluted in stimulation buffer for 30 min at 37°C. For HEK293 cells and human cardiac fibroblasts, the experiment was performed in the absence of PDE inhibition; for CHO-K1 cells, the experiment was performed in the presence of 500 μM IBMX. To terminate the reaction, buffer was aspirated and 50 μL ice-cold ethanol was added per well. Following ethanol evaporation at 37°C, the cell precipitate was resuspended in 30 μL detection buffer (5 mM HEPES, 0.3% Tween-20, 0.1% w/v BSA, pH 7.4; 130 μL for positive control samples), then 10 μL was transferred to a 384-well white OptiPlate (PerkinElmer) on ice. Following addition of anti-cAMP acceptor beads (in the presence of 500 μM IBMX) and donor beads with biotinylated cAMP for 1 h, the plate was read using an EnVision Multilabel Reader (PerkinElmer), and data analyzed against a standard curve using GraphPad Prism from n biological repeats as stated.
Mathematical modeling
Model definition
The kinetics of ligand-receptor binding for a population of cells is defined by:
| (1) |
where i is an index denoting a particular cell, L represents free ligand, R represents the unbound receptor, B represents the occupied receptor, and kf and kr are association and dissociation rate constants, respectively. Activation of a cell is taken to be proportional to the number of occupied receptors:
| (2) |
where kact is the activation rate constant, C represents an inactive cell and C* represents an active cell. Note that Ci has a value of 1 until activation and 0 thereafter. In addition to the kinetic parameters, we introduce fc, the fraction of cells competent to be activated by ligand. This parameter is introduced to account for any intracellular conditions (e.g. gene expression, cell cycle state etc.) that may prevent a cell from responding to ligand.
Simulation
For 1 fM Iso, we simulated the stochastic ligand-receptor binding kinetics using Gillespie’s algorithm (41). This approach is not computationally feasible when considering the high ligand concentration (100 nM), because the number of reaction events per unit time scales linearly with the number of molecules in the system (120,440/well for 1 fM vs. 1.2×10¹³/well for 100 nM). As we use molecule copy numbers in these simulations, the concentrations of biochemical species and the association rate constant, kf, must be converted to the appropriate units:
| (3) |
| (4) |
where V is the extracellular volume (200 μL), M is a biochemical species and NA is the Avogadro constant. To estimate the concentration of occupied receptors ([B]) at high ligand concentration, we make a quasi steady-state approximation for the ligand-receptor interaction since the total ligand concentration, [LT], is much greater than the total receptor concentration, [RT]:
| (5) |
We can also calculate the average concentration of occupied receptors per cell:
| (6) |
The fraction of cells, FA, that are active after a time, t, is:
| (7) |
where is the average rate of activation for each cell. For all cells are kact >10−4s−1, all cells are activated in less than 1 min when [B] ≈ [RT].
Parameter estimation
We used a Bayesian approach to estimate the following parameters in our model: kr and kact, which are rate constants in the model defined above with units of s−1; KD, which is the equilibrium dissociation constant in molar units (M) for ligand-receptor binding and can be used to calculate kf, given kr; and fc, which is the fraction of cells competent for activation (dimension-less).
Our procedure uses a Markov chain Monte Carlo (MCMC) algorithm to estimate the probability distribution of the parameters’ values similar to the procedure outlined in (42). In Bayesian statistics, this estimated distribution is called a parameter’s posterior. For each parameter set sampled during the MCMC run, estimating the posterior requires calculating both the probability of observing the experimental data given a particular set of parameters (the likelihood) and the probability of the parameters given an assumed probability distribution (the parameter’s prior distribution).
Two parameters’ means and standard deviations have already been characterized in the literature, log10 KD (54) and kr (74). We assign log10 KD to have a normal distribution as its prior, with mean, μ, and standard deviation, σ:
| (8) |
Assuming normality for kr results in significant probability density for values below zero. We therefore assign kr to have a gamma distribution as its prior, where the gamma distribution’s parameters α and β are calculated such that the distribution’s mean, α/β, and standard deviation, , correspond to the mean and standard deviation reported in the literature, 0.05 and 0.0255, respectively:
| (9) |
| (10) |
| (11) |
The prior for the fraction of competent cells, fc, can be specified based on our data as follows. We assume that 100 nM Iso is a saturating dose that should activate all competent cells, and so we calculate the mean and standard deviation of the cells that are activated in response to 100 nM Iso (Fig. 2J) and assign fc to have the normal distribution:
| (12) |
where μ and σ are calculated from the data in Fig. 2J. The rate of receptor-dependent cell activation relies on incomplete knowledge of the relevant signaling pathways. However, we can still constrain this parameter with a uniformly distributed prior over a finite range. We assume that the activation rate must be sufficiently fast to activate cells given potential values of kr, and that excessively fast activation rates are not physically realizable. Thus, we set:
| (13) |
Other fixed parameters used in the model are volume of medium (200 μL/well), number of cells (30,000/well) and number of receptors (18,000/cell; (75, 76)). Our MCMC sampling was performed for 1,000,000 iterations with a constant jump size of 0.2 (in log space), and we discarded the first 10,000 points as the burn-in period. Parameter updates were accepted using the Metropolis-Hastings criterion, with approximately 37% of the attempted updates being rejected. The sampling trace for log10 KD appears to have reached stationarity (fig. S5A). From this, we can characterize the posterior distribution of each parameter; the posteriors for three of the four free parameters strongly reflect their priors (fig. S5B). The exception, kact, reveals a posterior that is shifted towards larger values, with near uniformity for parameters larger than 0.01. We can further characterize the correlations between the free parameters by looking at their pairwise scatter plots (fig. S5C). All pairwise relationships result in a Spearman’s rank correlation coefficient, ρ, of less than 0.05, meaning that dependency between any pair of parameters is unlikely.
High-content ratiometric FRET imaging
Ratiometric FRET imaging was performed as described previously (9, 71, 77). HEK293 cells were seeded in black, optically clear 96-well plates and grown to 70% confluency prior to transfection with PEI. Human cardiac fibroblasts were transfected using X-tremeGENE 9 in suspension and seeded in half area black, optically clear 96-well plates at 90% confluency. To measure activation of endogenously expressed receptors, HEK293 cells were transfected with 90 ng/well FRET biosensor and human cardiac fibroblasts were transfected with 100 ng/well FRET biosensor. For over-expression of mutant receptors, HEK293 cells were co-transfected with 55 ng/well receptor and 40 ng/well FRET biosensor. For experiments with siRNA, HEK293 cells were co-transfected with an additional 25 nM scrambled, β-arrestin 1, β-arrestin 2 or AKAP250 SMARTpool ON-TARGETplus siRNA (GE Dharmacon) for 72 hr. For experiments involving dominant negative constructs or shRNA, HEK293 cells were co-transfected with an additional 50 ng/well plasmid for 72 hr. Prior to the experiment, HEK293 cells were partially serum-restricted overnight in 0.5% FBS v/v DMEM.
Cells were pre-treated with inhibitors for 30 min at 37°C in HBSS and inhibitors were used at the following concentrations: 100 μM ddA, 1 μM GF109203X, 100 μM IBMX, 1 μM KT5720, 5 μM mSIRK or mSIRK L9A, 10 μM NF023, 10 μM NF449, 100 nM UBO-QIC. Antagonists were pre-incubated with the cells for 10 min, and were used at 100x the Ki (100 nM ICI-118,551 and 10 nM N-methyl scopolamine).
Fluorescence imaging was performed using a high-content GE Healthcare INCell 2000 Analyzer with a Nikon Plan Fluor ELWD 40x (NA 0.6) objective and FRET module as described (71). For CFP/YFP (pmEpac2, cytoCKAR, pmCKAR, Raichu-Cdc42) emission ratio analysis, cells were sequentially excited using a CFP filter (430/24) with emission measured using YFP (535/30) and CFP (470/24) filters, and a polychroic optimized for the CFP/YFP filter pair (Quad3). For GFP/RFP (cytoEKAR, nucEKAR) emission ratio analysis, cells were sequentially excited using a FITC filter (490/20) with emission measured using dsRed (605/52) and FITC (525/36) filters, and a polychroic optimized for the FITC/dsRed filter pair (Quad4). HEK293 cells were either imaged every 20 sec for 5 min (image capture of 5 wells per 20 sec) or every 1 min for 20 min (image capture of 14 wells per min). Only HEK293 cells with >5% change in F/F0 (FRET ratio relative to baseline for each cell) after stimulation with positive controls were selected for analysis, and the data expressed relative to the positive control (F/FMax). For human cardiac fibroblasts, only cells with >3% change in F/F0 after stimulation with positive controls were selected for analysis, and data were expressed as the F/F0 due to the variation in responses to the positive controls. Data were analyzed using in-house scripts written for the FIJI distribution of ImageJ (78), as described (71).
Ratiometric pseudocolor images were generated as previously described (79). A multiplication factor of 10 was applied using the Ratio Plus plugin, the Green Fire Blue LUT was applied, and the Brightness and Contrast range was set to the minimum and maximum FRET ratios within the image stack.
High-content GFP imaging
HEK293 cells were seeded in black, optically clear 96-well plates and grown to 70% confluency prior to co-transfection with 50 ng/well pEF1α-AcGFP-C1 and 50 ng/well pDsRed-N1 (transfection efficiency control) using PEI. 24 hours post transfection, cells were washed with PBS and partially serum restricted in phenol red-free DMEM supplemented with 0.5% FBS v/v overnight. Human cardiac fibroblasts were transfected with 50 ng/well pEF1α-AcGFP-C1 and 50 ng/well pDsRed-N1 (transfection efficiency control) using X-tremeGENE 9 in suspension, then seeded in black, optically clear 96-well plates at 90% confluency. Experiments in human cardiac fibroblasts used HBSS.
Fluorescence imaging was performed using a high-content GE Healthcare INCell 2000 Analyzer with a Nikon Plan Fluor ELWD 40x (NA 0.6) objective. Sequential GFP/dsRed imaging used FITC (excitation 490/20, emission 525/36) and dsRed (excitation 555/25, emission 605/52) filters and the Quad4 polychroic. Baseline images were taken every 10 min for 40 min, cells were stimulated with ligand and images taken every 10 min for 4 hr. Data were analyzed by selecting 70 cells per well using FIJI, and the GFP fluorescence intensity was expressed relative to the average baseline GFP fluorescence intensity for each cell (F/F0). For human cardiac fibroblasts, all transfected cells were selected and data are expressed as relative fluorescence units (RFU) due to variation in transfection efficiency.
GST pulldowns
GST-tagged fragments were expressed in BL21(DE3)pLys cells at 37°C following induction with 0.1 mM IPTG. Cells were lysed by sonication (three pulses for 30 sec, 70% amplitude; Qsonica Q125) in lysis buffer (50 mM Tris pH 8, 300 mM NaCl, 10 mM MgCl2, 1 mM EDTA, 1 mM DTT, 0.25 mg/mL lysozyme, protease inhibitor cocktail, 100 U DNaseI). The homogenates were centrifuged (15,000g, 20 min, 4°C) and the supernatants incubated with Glutathione Sepharose 4B resin (GE Healthcare; 1 h, 4°C). The resin was washed (50 mM Tris pH 8, 150 mM NaCl, 1 mM EDTA, 1 mM DTT) until no protein remained in the eluate, then an equal volume of PBS (with protease inhibitors and 0.02% w/v NaN3) was added to the resin.
HEK293 cells were seeded into 175 cm2 flasks and grown to confluency. For over-expression pulldowns, cells were transfected with 20 μg AKAP79-HA, PDE4D3 dn, PDE4D5 dn, AC2-HA or HA-AKAP250 using PEI. Cells were lysed in lysis buffer (50 mM Tris pH 7.4, 100 mM NaCl, 10% v/v glycerol, 0.3% v/v NP-40, 2 mM DTT, 1 mM PMSF, 1 mM benzamidine, 10 mM β-glycerophosphate, 2 mM Na3VO4, protease inhibitor cocktail, 100 U DNaseI) by rotating for 30 min at 4°C, then passing 10 times through a 21-gauge needle. The cell homogenates were centrifuged (500g, 3 min, 4°C), then incubated with the GST-β2AR or GST-M3R fragment resin for 4 hours at 4°C with rotation. The GST-β2AR or GST-M3R fragment resin was washed twice in lysis buffer (with 0.03% v/v NP-40), before the bound proteins were eluted in Laemmli buffer and incubated at 37°C for 30 min prior to immunoblotting. Immunoreactive bands were quantified by densitometry using Image Studio Lite 4.0 software (LI-COR Biosciences). Data for each fragment are normalized for equivalent amounts of GST, and expressed relative to GST alone control from n biological repeats as stated.
Immunoblotting
Proteins were resolved by SDS-PAGE using 10% Tris-glycine or pre-cast 4–15% Mini-PROTEAN TGX gels (for AKAP250 co-IP only; Bio-Rad) and transferred to 0.45 μm LF PVDF membranes (Bio-Rad) using a Trans-Blot SD Semi-Dry Transfer Cell (Bio-Rad; 75 min, 10 V). Membranes were blocked for 1 hour at RT (5% w/v BSA for GST pulldowns or 5% w/v skim milk powder for confirmation of protein knockdown and overexpression or co-IP, in PBS with 0.1% v/v Tween-20, PBS-T), and incubated with primary antibody overnight at 4°C (diluted in 1% w/v BSA for GST pulldowns or 1% w/v skim milk powder for confirmation of protein knockdown and overexpression or co-IP, in PBS-T). Membranes were washed, incubated with secondary antibody (diluted in PBS-T for fluorescent secondary antibodies for GST pulldowns or 1% w/v skim milk powder in PBS-T for HRP-conjugated secondary antibodies for confirmation of protein knockdown and overexpression or co-IP) for 1 hour at RT, and washed. Immunoreactivity was detected by fluorescence for GST pulldowns (fluorescently-conjugated secondary antibodies) or ECL for confirmation of protein knockdown and overexpression or co-IP (Millipore, HRP-conjugated secondary antibodies). Fluorescence was detected using the Odyssey Classic Infrared Imager (LI-COR Biosciences), with resolution set at 169 μm and the intensity adjusted to be in the linear range for infrared fluorescence detection. ECL was detected using the ChemiDoc Touch Imaging System (Bio-Rad), with exposures adjusted to be in the linear range for chemiluminescence.
Acceptor photobleaching FRET
HEK293 cells were seeded in 6-well plates and grown to 70% confluency prior to co-transfection with 0.6 μg/well FLAG-β2AR-CFP or 3HA-M3R-CFP and 0.6 μg/well of one of the following YFP-tagged proteins: Gαs-YFP, Gαq-YFP, AKAP79-YFP, YFP-β-arrestin 1, YFP-β-arrestin 2, YFP-PKC or PKA-YFP. The FRET biosensor, pmEpac2, was used as a positive control. 4 hours post-transfection, cells were re-seeded (40,000 cells/well) into a 8-well μ-slide (iBidi). 24 hours post-transfection, cells were rinsed in PBS, fixed (4% w/v paraformaldehyde, 30 min at RT), rinsed three times in PBS, then stored at 4°C.
Acceptor photobleaching FRET was performed using a Leica SP8 confocal microscope with HCX PL APO 63x CS2 (NA 1.40) oil objective using the FRET Acceptor Photobleaching wizard in the LAS X software suite. A region of interest (ROI) was selected, and the acceptor channel bleached at 70% laser intensity (514 nm) until the YFP signal was reduced by at least 90%. CFP (UV 405 nm laser excitation, 465–511 nm emission) and YFP (514 nm laser excitation, 532–603 nm emission) emission was then measured. For each biological replicate, three cells and two ROIs per cell were analysed (total 24 ROIs from four biological replicates). FRET efficiency was calculated by the LAS X software suite using the following equation: FRETeff = (Donorpost – Donorpre)/Donorpost. Gαq-YFP and Gαs-YFP were used as negative controls for FLAG-β2AR-CFP and 3HA-M3R-CFP FRET, respectively. Due to non-uniform distribution of protein complexes at the plasma membrane, and a large number of “0” FRET values, the data was not normally distributed and was therefore statistically analysed using a non-parametric Kruskal-Wallis test. For further analysis, data were converted to binary values (0 = no FRET, 1 = FRET) and analysed using a Chi-square test with two-sided P-values and 95% confidence interval.
LC-MS/MS: FASP protein digestion and dimethyl labeling
HEK293 cells were seeded in 6-well plates and grown to confluency. Cells were treated with vehicle or ligand for 4 h, then incubated in lysis buffer (100 mM Tris pH 7.6, 4% w/v SDS, 100 mM DTT) at 95°C for 3 min, prior to sonication (30 sec, 30% amplitude, Qsonica Q125) and centrifugation (16,000g, 5 min, RT). 100 μg supernatant was digested using the FASP Protein Digestion Kit (Expedeon), with trypsin digestion overnight at 37°C. Digested peptides were labeled as previously described (80) using 40 mM 12C3 light or 13C3 heavy formaldehyde with 20 mM NaCNBOH for 1 hour at 37°C, before the reaction was quenched with formic acid (to pH 2.5). The light- and heavy-labeled samples were mixed at a 1:1 ratio, and desalted using C-18 desalting columns and three washes with 0.1% v/v formic acid. Samples were eluted in 70% v/v acetonitrile and 0.1% v/v formic acid, then dried by SpeedVac (LABCONCO). Peptides were fractionated following resuspension in Strong Anion Exchange (SAX) buffer (20 mM acetic acid, 20 mM phosphoric acid, 20 mM boric acid) pH 11 and loading onto stage tips containing five layers of anion exchange discs. The first fraction was collected following centrifugation (1,000g, 3 min, RT). A total of seven fractions were collected by sequentially eluting fractions from the stage tips in SAX buffer at pH 8, 6, 5, 4, 3 and SAX buffer 7 (10% v/v formic acid, pH 1). Fractions were dried, then resuspended in 2% v/v acetonitrile with 1% v/v formic acid by sonication at 37°C for 10 min prior to LC-MS/MS.
LC-MS/MS: data collection and analysis
Samples were analyzed by LC-MS/MS using a Q Exactive™ or Q Exactive Plus™ Orbitrap mass spectrometer (Thermo Scientific) coupled online with an UltiMate 3000 RSLC nano-UHPLC (Thermo Scientific). Samples were injected onto an Acclaim™ PepMap100 RSLC C18 analytical column (100 Å pore size, 75 μm i.d. × 50 cm reversed phase nanoViper column, Thermo Scientific) with 95% buffer A (0.1% v/v formic acid) at a flow rate of 250 or 300 nL/min. The peptides were eluted over 60 min using a gradient to 42.5% buffer B (80% v/v acetonitrile, 0.1% v/v formic acid). The eluate was nebulized and ionized using a Nano ElectroSpray Ion Source (Thermo Scientific) with coated borosilicate emitter and a capillary voltage of 1700 V. Peptides were selected for MS/MS analysis using Xcalibur™ software (Thermo Scientific) in full MS/dd-MS2 (TopN) mode with the following parameter settings: MS AGC target 3E6, MS maximum injection time 120 ms, MS/MS TopN=10 or 12, MS/MS AGC target 1e5, MS/MS maximum injection time 120 ms, normalized collision energy 27, and isolation window of 2 or 1.8 m/z. Dynamic exclusion was set to 15 sec. Protein identification and quantification was performed using MaxQuant software (81) (version 1.5.2.8). Searches were performed against human sequences downloaded from UniProt (82) (March 2015 version) using the following parameters: specific digestion with trypsin with up to two missed cleavages, protein N-terminal acetylation and methionine oxidation were set as variable modifications, and cysteine alkylation was set as a fixed modification.
Data were analyzed using Perseus software (version 15.0.9). Common contaminants, reverse peptides, and proteins identified only by a modification site were removed. All data were expressed relative to vehicle-treated controls (heavy/light or transformed 1/[heavy/light], as appropriate), ratios were log2 normalized to allow quantitative analysis, and any non-valid values removed. Only proteins that differed significantly from vehicle controls (t-test with p<0.05) were retained and Z-scored to prepare the data for clustering. Hierarchical clustering was performed using default settings. Data for individual proteins are expressed as the log2 change relative to vehicle control from n biological repeats as stated. The proteins used for hierarchical clustering were further classified by their Biological Process GeneOntology (GO) term, using the Database for Annotation, Visualization and Integrated Discovery (DAVID, v6.7) (83, 84) to generate pie charts. Classifications with p-values <0.05 were used to group proteins according to biological function, synonymous classifications were removed, and the number of proteins classified within these groups were counted. Only classifications that were identified in at least two biological replicates were included within the final count.
Statistics
All data points are the mean ± S.E.M. of at least three independent experiments unless otherwise stated. All data were analyzed using GraphPad Prism with statistically significant differences (p<0.05) determined using Kruskal-Wallis or Chi-square analaysis (acceptor photobleaching FRET) or one- or two-way ANOVAs (all other experiments) with appropriate post-tests, as stated.
Supplementary Material
Table S1. Femtomolar concentrations of ligand increase cAMP.
Table S2. The β2AR and M3R constitutively form complexes at the plasma membrane.
Table S3. Proteins from hierarchical clustering analysis.
Figure S1. Endogenous expression of GPCRs in HEK293 cells.
Figure S2. Biphasic changes in cAMP are due to activation of endogenously expressed β2AR and M3R. Figure S3. FRET biosensors can detect responses to femtomolar concentrations of ligand with endogenous or exogenous receptor expression.
Figure S4. Plasma membrane localization and activity of mutant β2AR and M3R.
Figure S5. Modeling responses to femtomolar concentrations of Iso.
Figure S6. Identification of proteins involved in stimulation and regulation of responses to 1 fM Iso. Figure S7. The β2AR forms a pre-assembled signalling complex.
Figure S8. Identification of proteins involved in stimulation and regulation of responses to 1 fM CCh. Figure S9. The M3R forms a pre-assembled signalling complex.
Figure S10. Femtomolar ligand concentrations activate compartmentalised signalling and unique cell responses.
Acknowledgements
The authors thank Professors Roger J Summers, Dermot MF Cooper, Patrick M Sexton and Arthur Christopoulos for critical discussion, and Mr Cameron J Nowell (Monash Institute of Pharmaceutical Sciences Imaging, Flow Cytometry and Analysis Core Facility) and Ms Carmen Choo for technical assistance. This work was supported by a National Health and Medical Research Council of Australia R.D. Wright Fellowship (1061687) and Project Grant (1047633) to M.L.H., and a Monash Institute of Pharmaceutical Sciences Strategic Grant to M.L.H. The authors declare they have no conflicts of interest.
Footnotes
References
- 1.Audet M, Bouvier M, Insights into signaling from the β2-adrenergic receptor structure, Nat Chem Biol 4, 397–403 (2008). [DOI] [PubMed] [Google Scholar]
- 2.Tsvetanova NG, von Zastrow M, Spatial encoding of cyclic AMP signaling specificity by GPCR endocytosis, Nat Chem Biol 10, 1061–1065 (2014). [DOI] [PMC free article] [PubMed] [Google Scholar]
- 3.Fraser IDC, Cong M, Kim J, Rollins EN, Daaka Y, Lefkowitz RJ, Scott JD, Assembly of an A kinase-anchoring protein–β2-adrenergic receptor complex facilitates receptor phosphorylation and signaling, Curr Biol 10, 409–412 (2000). [DOI] [PubMed] [Google Scholar]
- 4.Calebiro D, Nikolaev VO, Gagliani MC, de Filippis T, Dees C, Tacchetti C, Persani L, Lohse MJ, Persistent cAMP-signals triggered by internalized G-protein-coupled receptors, PLoS Biol 7, e1000172 (2009). [DOI] [PMC free article] [PubMed] [Google Scholar]
- 5.Lynch MJ, Baillie GS, Mohamed A, Li X, Maisonneuve C, Klussmann E, van Heeke G, Houslay MD, RNA silencing identifies PDE4D5 as the functionally relevant cAMP phosphodiesterase interacting with β arrestin to control the protein kinase A/AKAP79-mediated switching of the β2-adrenergic receptor to activation of ERK in HEK293B2 cells, J Biol Chem 280, 33178–33189 (2005). [DOI] [PubMed] [Google Scholar]
- 6.Shih M, Lin F, Scott JD, Wang H-Y, Malbon CC, Dynamic complexes of β2-adrenergic receptors with protein kinases and phosphatases and the role of gravin, J Biol Chem 274, 1588–1595 (1999). [DOI] [PubMed] [Google Scholar]
- 7.Shen JX, Cooper DMF, AKAP79, PKC, PKA and PDE4 participate in a Gq-linked muscarinic receptor and adenylate cyclase 2 cAMP signalling complex, Biochem J 455, 47–56 (2013). [DOI] [PMC free article] [PubMed] [Google Scholar]
- 8.Halls ML, Cooper DMF, Sub-picomolar relaxin signalling by a pre-assembled RXFP1, AKAP79, AC2, β-arrestin 2, PDE4D3 complex, EMBO J 29, 2772–2787 (2010). [DOI] [PMC free article] [PubMed] [Google Scholar]
- 9.Jensen DD, Lieu T, Halls ML, Veldhuis NA, Imlach WL, Mai QN, Poole DP, Quach T, Aurelio L, Conner J, Herenbrink CK, Barlow N, Simpson JS, Scanlon MJ, Graham B, McCluskey A, Robinson PJ, Escriou V, Nassini R, Materazzi S, Geppetti P, Hicks GA, Christie MJ, Porter CJH, Canals M, Bunnett NW, Neurokinin 1 receptor signaling in endosomes mediates sustained nociception and is a viable therapeutic target for prolonged pain relief, Sci Transl Med 9, pii: eaal3447 (2017). [DOI] [PMC free article] [PubMed] [Google Scholar]
- 10.Yarwood RE, Imlach WL, Lieu T, Veldhuis NA, Jensen DD, Klein Herenbrink C, Aurelio L, Cai Z, Christie MJ, Poole DP, Porter CJH, McLean P, Hicks GA, Geppetti P, Halls ML, Canals M, Bunnett NW, Endosomal signaling of the receptor for calcitonin gene-related peptide mediates pain transmission, Proc Natl Acad Sci USA 114, 12309–12314 (2017). [DOI] [PMC free article] [PubMed] [Google Scholar]
- 11.Nikolaev VO, Bünemann M, Schmitteckert E, Lohse MJ, Engelhardt S, Cyclic AMP imaging in adult cardiac myocytes reveals far-reaching beta1-adrenergic but locally confined β 2-adrenergic receptor-mediated signaling, Circ Res 99, 1084–1091 (2006). [DOI] [PubMed] [Google Scholar]
- 12.Irannejad R, Tomshine JC, Tomshine JR, Chevalier M, Mahoney JP, Steyaert J, Rasmussen SGF, Sunahara RK, El-Samad H, Huang B, von Zastrow M, Conformational biosensors reveal GPCR signalling from endosomes, Nature 495, 534–538 (2013). [DOI] [PMC free article] [PubMed] [Google Scholar]
- 13.DeFea KA, β-arrestins as regulators of signal termination and transduction: how do they determine what to scaffold? Cell Signal 23, 621–629 (2011). [DOI] [PubMed] [Google Scholar]
- 14.Ferrandon S, Feinstein TN, Castro M, Wang B, Bouley R, Potts JT, Gardella TJ, Vilardaga J-P, Sustained cyclic AMP production by parathyroid hormone receptor endocytosis, Nat Chem Biol 5, 734–742 (2009). [DOI] [PMC free article] [PubMed] [Google Scholar]
- 15.Wehbi VL, Stevenson HP, Feinstein TN, Calero G, Romero G, Vilardaga J-P, Noncanonical GPCR signaling arising from a PTH receptor-arrestin-Gβγ complex, Proc Natl Acad Sci USA 110, 1530–1535 (2013). [DOI] [PMC free article] [PubMed] [Google Scholar]
- 16.Feinstein TN, Wehbi VL, Ardura JA, Wheeler DS, Ferrandon S, Gardella TJ, Vilardaga J-P, Retromer terminates the generation of cAMP by internalized PTH receptors, Nat Chem Biol 7, 278–284 (2011). [DOI] [PMC free article] [PubMed] [Google Scholar]
- 17.Kotowski SJ, Hopf FW, Seif T, Bonci A, von Zastrow M, Endocytosis promotes rapid dopaminergic signaling, Neuron 71, 278–290 (2011). [DOI] [PMC free article] [PubMed] [Google Scholar]
- 18.Dinarello CA, The interleukin-1 family: 10 years of discovery, FASEB J 8, 1314–1325 (1994). [PubMed] [Google Scholar]
- 19.Bruzzone A, Saulière A, Finana F, Sénard J-M, Lüthy I, Gales C, Dosage-dependent regulation of cell proliferation and adhesion through dual β2-adrenergic receptor/cAMP signals, FASEB J 28, 1342–1354 (2014). [DOI] [PubMed] [Google Scholar]
- 20.Ngala RA, O’Dowd J, Wang SJ, Stocker C, Cawthorne MA, Arch JRS, β2-adrenoceptors and non-beta-adrenoceptors mediate effects of BRL37344 and clenbuterol on glucose uptake in soleus muscle: studies using knockout mice, Br J Pharmacol 158, 1676–1682 (2009). [DOI] [PMC free article] [PubMed] [Google Scholar]
- 21.Ngala RA, O’Dowd J, Wang SJ, Agarwal A, Stocker C, Cawthorne MA, Arch JRS, Metabolic responses to BRL37344 and clenbuterol in soleus muscle and C2C12 cells via different atypical pharmacologies and β2-adrenoceptor mechanisms, Br J Pharmacol 155, 395–406 (2008). [DOI] [PMC free article] [PubMed] [Google Scholar]
- 22.Block L, Forshammar J, Westerlund A, Björklund U, Lundborg C, Biber B, Hansson E, Naloxone in ultralow concentration restores endomorphin-1-evoked Ca2+ signaling in lipopolysaccharide pretreated astrocytes, Neuroscience 205, 1–9 (2012). [DOI] [PubMed] [Google Scholar]
- 23.Liu B, Qin L, Yang SN, Wilson BC, Liu Y, Hong JS, Femtomolar concentrations of dynorphins protect rat mesencephalic dopaminergic neurons against inflammatory damage, J Pharmacol Exp Ther 298, 1133–1141 (2001). [PubMed] [Google Scholar]
- 24.Crain SM, Shen KF, Ultra-low concentrations of naloxone selectively antagonize excitatory effects of morphine on sensory neurons, thereby increasing its antinociceptive potency and attenuating tolerance/dependence during chronic cotreatment, Proc Natl Acad Sci USA 92, 10540–10544 (1995). [DOI] [PMC free article] [PubMed] [Google Scholar]
- 25.Goldberg MR, Joiner PD, Hyman AL, Kadowitz PJ, Unusual venoconstrictor effects of angiotensin II, Proc Soc Exp Biol Med 149, 707–713 (1975). [DOI] [PubMed] [Google Scholar]
- 26.Kuttan SC, Sim MK, Endothelium-dependent response of the rabbit aorta to femtomolar concentrations of angiotensin II, J Cardiovasc Pharmacol 17, 929–934 (1991). [DOI] [PubMed] [Google Scholar]
- 27.Sun Y, Huang J, Xiang Y, Bastepe M, Jüppner H, Kobilka BK, Zhang JJ, Huang X-Y, Dosage-dependent switch from G protein-coupled to G protein-independent signaling by a GPCR, EMBO J 26, 53–64 (2007). [DOI] [PMC free article] [PubMed] [Google Scholar]
- 28.Uhlén M, Fagerberg L, Hallström BM, Lindskog C, Oksvold P, Mardinoglu A, Sivertsson Å, Kampf C, Sjöstedt E, Asplund A, Olsson I, Edlund K, Lundberg E, Navani S, Szigyarto CA-K, Odeberg J, Djureinovic D, Takanen JO, Hober S, Alm T, Edqvist P-H, Berling H, Tegel H, Mulder J, Rockberg J, Nilsson P, Schwenk JM, Hamsten M, von Feilitzen K, Forsberg M, Persson L, Johansson F, Zwahlen M, von Heijne G, Nielsen J, Pontén F, Proteomics. Tissue-based map of the human proteome, Science 347, 1260419 (2015). [DOI] [PubMed] [Google Scholar]
- 29.Atwood BK, Lopez J, Wager-Miller J, Mackie K, Straiker A, Expression of G protein-coupled receptors and related proteins in HEK293, AtT20, BV2, and N18 cell lines as revealed by microarray analysis, BMC Genomics 12, 14 (2011). [DOI] [PMC free article] [PubMed] [Google Scholar]
- 30.van Wijk XM, Döhrmann S, Hallström BM, Li S, Voldborg BG, Meng BX, McKee KK, van Kuppevelt TH, Yurchenco PD, Palsson BO, Lewis NE, Nizet V, Esko JD, Whole-genome sequencing of invasion-resistant cells identifies laminin α2 as a host factor for bacterial invasion, MBio 8, pii: e02128–16 (2017). [DOI] [PMC free article] [PubMed] [Google Scholar]
- 31.Yang J, Hlavacek WS, Scaffold-mediated nucleation of protein signaling complexes: elementary principles, Math Biosci 232, 164–173 (2011). [DOI] [PMC free article] [PubMed] [Google Scholar]
- 32.Wachten S, Masada N, Ayling L-J, Ciruela A, Nikolaev VO, Lohse MJ, Cooper DMF, Distinct pools of cAMP centre on different isoforms of adenylyl cyclase in pituitary-derived GH3B6 cells, J Cell Sci 123, 95–106 (2010). [DOI] [PMC free article] [PubMed] [Google Scholar]
- 33.Nakakuki T, Birtwistle MR, Saeki Y, Yumoto N, Ide K, Nagashima T, Brusch L, Ogunnaike BA, Okada-Hatakeyama M, Kholodenko BN, Ligand-specific c-Fos expression emerges from the spatiotemporal control of ErbB network dynamics, Cell 141, 884–896 (2010). [DOI] [PMC free article] [PubMed] [Google Scholar]
- 34.Canals M, Sexton PM, Christopoulos A, Allostery in GPCRs: “MWC” revisited, Trends Biochem Sci 36, 663–672 (2011). [DOI] [PubMed] [Google Scholar]
- 35.Dror RO, Pan AC, Arlow DH, Borhani DW, Maragakis P, Shan Y, Xu H, Shaw DE, Pathway and mechanism of drug binding to G-protein-coupled receptors, Proc Natl Acad Sci USA 108, 13118–13123 (2011). [DOI] [PMC free article] [PubMed] [Google Scholar]
- 36.Kruse AC, Hu J, Pan AC, Arlow DH, Rosenbaum DM, Rosemond E, Green HF, Liu T, Chae PS, Dror RO, Shaw DE, Weis WI, Wess J, Kobilka BK, Structure and dynamics of the M3 muscarinic acetylcholine receptor, Nature 482, 552–556 (2012). [DOI] [PMC free article] [PubMed] [Google Scholar]
- 37.Strader CD, Sigal IS, Candelore MR, Rands E, Hill WS, Dixon RA, Conserved aspartic acid residues 79 and 113 of the β-adrenergic receptor have different roles in receptor function, J Biol Chem 263, 10267–10271 (1988). [PubMed] [Google Scholar]
- 38.Fraser CM, Wang CD, Robinson DA, Gocayne JD, Venter JC, Site-directed mutagenesis of m1 muscarinic acetylcholine receptors: conserved aspartic acids play important roles in receptor function, Mol Pharmacol 36, 840–847 (1989). [PubMed] [Google Scholar]
- 39.Armbruster BN, Li X, Pausch MH, Herlitze S, Roth BL, Evolving the lock to fit the key to create a family of G protein-coupled receptors potently activated by an inert ligand, Proc Natl Acad Sci USA 104, 5163–5168 (2007). [DOI] [PMC free article] [PubMed] [Google Scholar]
- 40.Alvarez-Curto E, Prihandoko R, Tautermann CS, Zwier JM, Pediani JD, Lohse MJ, Hoffmann C, Tobin AB, Milligan G, Developing chemical genetic approaches to explore G protein-coupled receptor function: validation of the use of a receptor activated solely by synthetic ligand (RASSL), Mol Pharmacol 80, 1033–1046 (2011). [DOI] [PMC free article] [PubMed] [Google Scholar]
- 41.Gillespie DT, Stochastic simulation of chemical kinetics, Annu Rev Phys Chem 58, 35–55 (2007). [DOI] [PubMed] [Google Scholar]
- 42.Kozer N, Barua D, Orchard S, Nice EC, Burgess AW, Hlavacek WS, Clayton AHA, Exploring higher-order EGFR oligomerisation and phosphorylation--a combined experimental and theoretical approach, Mol Biosyst 9, 1849–1863 (2013). [DOI] [PMC free article] [PubMed] [Google Scholar]
- 43.Strasser A, Wittmann H-J, Seifert R, Binding kinetics and pathways of ligands to GPCRs, Trends Pharmacol Sci 38, 717–732 (2017). [DOI] [PubMed] [Google Scholar]
- 44.Lynch MJ, Baillie GS, Houslay MD, cAMP-specific phosphodiesterase-4D5 (PDE4D5) provides a paradigm for understanding the unique non-redundant roles that PDE4 isoforms play in shaping compartmentalized cAMP cell signalling, Biochem Soc Trans 35, 938–941 (2007). [DOI] [PubMed] [Google Scholar]
- 45.MacKenzie SJ, Baillie GS, McPhee I, MacKenzie C, Seamons R, McSorley T, Millen J, Beard MB, van Heeke G, Houslay MD, Long PDE4 cAMP specific phosphodiesterases are activated by protein kinase A-mediated phosphorylation of a single serine residue in Upstream Conserved Region 1 (UCR1), Br J Pharmacol 136, 421–433 (2002). [DOI] [PMC free article] [PubMed] [Google Scholar]
- 46.Halls ML, Cooper DMF, Regulation by Ca2+-signaling pathways of adenylyl cyclases, Cold Spring Harb Perspect Biol 3, a004143 (2011). [DOI] [PMC free article] [PubMed] [Google Scholar]
- 47.Gao S, Wang H-Y, Malbon CC, AKAP5 and AKAP12 form homo-oligomers, J Mol Signal 6, 3 (2011). [DOI] [PMC free article] [PubMed] [Google Scholar]
- 48.Itoh RE, Kurokawa K, Ohba Y, Yoshizaki H, Mochizuki N, Matsuda M, Activation of rac and cdc42 video imaged by fluorescent resonance energy transfer-based single-molecule probes in the membrane of living cells, Mol Cell Biol 22, 6582–6591 (2002). [DOI] [PMC free article] [PubMed] [Google Scholar]
- 49.Takai Y, Sasaki T, Matozaki T, Small GTP-binding proteins, Physiol Reviews 81, 153–208 (2001). [DOI] [PubMed] [Google Scholar]
- 50.Vauquelin G, Charlton SJ, Long-lasting target binding and rebinding as mechanisms to prolong in vivo drug action, Br J Pharmacol 161, 488–508 (2010). [DOI] [PMC free article] [PubMed] [Google Scholar]
- 51.Sykes DA, Parry C, Reilly J, Wright P, Fairhurst RA, Charlton SJ, Observed drug-receptor association rates are governed by membrane affinity: the importance of establishing “micro-pharmacokinetic/pharmacodynamic relationships” at the β2-adrenoceptor, Mol Pharmacol 85, 608–617 (2014). [DOI] [PubMed] [Google Scholar]
- 52.Gherbi K, Briddon SJ, Charlton SJ, Micro-pharmacokinetics: Quantifying local drug concentration at live cell membranes, Sci Rep accepted. [DOI] [PMC free article] [PubMed] [Google Scholar]
- 53.Gao S, Wang H-Y, Malbon CC, AKAP12 and AKAP5 form higher-order hetero-oligomers, J Mol Signal 6, 8 (2011). [DOI] [PMC free article] [PubMed] [Google Scholar]
- 54.Staus DP, Strachan RT, Manglik A, Pani B, Kahsai AW, Kim TH, Wingler LM, Ahn S, Chatterjee A, Masoudi A, Kruse AC, Pardon E, Steyaert J, Weis WI, Prosser RS, Kobilka BK, Costa T, Lefkowitz RJ, Allosteric nanobodies reveal the dynamic range and diverse mechanisms of G-protein-coupled receptor activation, Nature 535, 448–452 (2016). [DOI] [PMC free article] [PubMed] [Google Scholar]
- 55.Hoshi N, Langeberg LK, Gould CM, Newton AC, Scott JD, Interaction with AKAP79 modifies the cellular pharmacology of PKC, Mol Cell 37, 541–550 (2010). [DOI] [PMC free article] [PubMed] [Google Scholar]
- 56.Hoshi N, Langeberg LK, Scott JD, Distinct enzyme combinations in AKAP signalling complexes permit functional diversity, Nat Cell Biol 7, 1066–1073 (2005). [DOI] [PMC free article] [PubMed] [Google Scholar]
- 57.Shen JX, Wachten S, Halls ML, Everett KL, Cooper DMF, Muscarinic receptors stimulate AC2 by novel phosphorylation sites, whereas Gβγ subunits exert opposing effects depending on the G-protein source, Biochem J 447, 393–405 (2012). [DOI] [PMC free article] [PubMed] [Google Scholar]
- 58.Fan G, Shumay E, Wang H, Malbon CC, The scaffold protein gravin (cAMP-dependent protein kinase-anchoring protein 250) binds the β2-adrenergic receptor via the receptor cytoplasmic Arg-329 to Leu-413 domain and provides a mobile scaffold during desensitization, J Biol Chem 276, 24005–24014 (2001). [DOI] [PubMed] [Google Scholar]
- 59.Cong M, Perry SJ, Lin FT, Fraser ID, Hu LA, Chen W, Pitcher JA, Scott JD, Lefkowitz RJ, Regulation of membrane targeting of the G protein-coupled receptor kinase 2 by protein kinase A and its anchoring protein AKAP79, J Biol Chem 276, 15192–15199 (2001). [DOI] [PubMed] [Google Scholar]
- 60.Torrecilla I, Spragg EJ, Poulin B, McWilliams PJ, Mistry SC, Blaukat A, Tobin AB, Phosphorylation and regulation of a G protein-coupled receptor by protein kinase CK2, J Cell Biol 177, 127–137 (2007). [DOI] [PMC free article] [PubMed] [Google Scholar]
- 61.Wu G, Bogatkevich GS, Mukhin YV, Benovic JL, Hildebrandt JD, Lanier SM, Identification of Gβg binding sites in the third intracellular loop of the M(3)-muscarinic receptor and their role in receptor regulation, J Biol Chem 275, 9026–9034 (2000). [DOI] [PubMed] [Google Scholar]
- 62.Borroto-Escuela DO, Correia PA, Romero-Fernandez W, Narvaez M, Fuxe K, Ciruela F, Garriga P, Muscarinic receptor family interacting proteins: role in receptor function, J Neurosci Methods 195, 161–169 (2011). [DOI] [PubMed] [Google Scholar]
- 63.Kan W, Adjobo-Hermans M, Burroughs M, Faibis G, Malik S, Tall GG, Smrcka AV, M3 muscarinic receptor interaction with phospholipase C β3 determines its signaling efficiency, J Biol Chem 289, 11206–11218 (2014). [DOI] [PMC free article] [PubMed] [Google Scholar]
- 64.Hu J, Thor D, Zhou Y, Liu T, Wang Y, McMillin SM, Mistry R, Challiss RAJ, Costanzi S, Wess J, Structural aspects of M3 muscarinic acetylcholine receptor dimer formation and activation, FASEB J 26, 604–616 (2012). [DOI] [PMC free article] [PubMed] [Google Scholar]
- 65.Rasmussen SGF, DeVree BT, Zou Y, Kruse AC, Chung KY, Kobilka TS, Thian FS, Chae PS, Pardon E, Calinski D, Mathiesen JM, Shah STA, Lyons JA, Caffrey M, Gellman SH, Steyaert J, Skiniotis G, Weis WI, Sunahara RK, Kobilka BK, Crystal structure of the β2 adrenergic receptor-Gs protein complex, Nature 477, 549–555 (2011). [DOI] [PMC free article] [PubMed] [Google Scholar]
- 66.Shukla AK, Westfield GH, Xiao K, Reis RI, Huang L-Y, Tripathi-Shukla P, Qian J, Li S, Blanc A, Oleskie AN, Dosey AM, Su M, Liang C-R, Gu L-L, Shan J-M, Chen X, Hanna R, Choi M, Yao XJ, Klink BU, Kahsai AW, Sidhu SS, Koide S, Penczek PA, Kossiakoff AA, Woods VL, Kobilka BK, Skiniotis G, Lefkowitz RJ, Visualization of arrestin recruitment by a G-protein-coupled receptor, Nature 512, 218–222 (2014). [DOI] [PMC free article] [PubMed] [Google Scholar]
- 67.Thomsen ARB, Plouffe B, Cahill TJ, Shukla AK, Tarrasch JT, Dosey AM, Kahsai AW, Strachan RT, Pani B, Mahoney JP, Huang L, Breton B, Heydenreich FM, Sunahara RK, Skiniotis G, Bouvier M, Lefkowitz RJ, GPCR-G protein-β-arrestin super-complex mediates sustained G protein signaling, Cell 166, 907–919 (2016). [DOI] [PMC free article] [PubMed] [Google Scholar]
- 68.Outten CE, O’Halloran TV, Femtomolar sensitivity of metalloregulatory proteins controlling zinc homeostasis, Science 292, 2488–2492 (2001). [DOI] [PubMed] [Google Scholar]
- 69.Draper J, Karplus K, Ottemann KM, Identification of a chemoreceptor zinc-binding domain common to cytoplasmic bacterial chemoreceptors, J Bacteriol 193, 4338–4345 (2011). [DOI] [PMC free article] [PubMed] [Google Scholar]
- 70.Zähringer F, Lacanna E, Jenal U, Schirmer T, Boehm A, Structure and signaling mechanism of a zinc-sensory diguanylate cyclase, Structure 21, 1149–1157 (2013). [DOI] [PubMed] [Google Scholar]
- 71.Halls ML, Poole DP, Ellisdon AM, Nowell CJ, Canals M, Detection and quantification of intracellular signaling using FRET-based biosensors and high content imaging, Methods Mol Biol 1335, 131–161 (2015). [DOI] [PubMed] [Google Scholar]
- 72.Livak KJ, Schmittgen TD, Analysis of relative gene expression data using real-time quantitative PCR and the 2(-Delta Delta C(T)) Method, Methods 25, 402–408 (2001). [DOI] [PubMed] [Google Scholar]
- 73.Halls ML, Bond CP, Sudo S, Kumagai J, Ferraro T, Layfield S, Bathgate RAD, Summers RJ, Multiple binding sites revealed by interaction of relaxin family peptides with native and chimeric relaxin family peptide receptors 1 and 2 (LGR7 and LGR8), J Pharmacol Exp Ther 313, 677–687 (2005). [DOI] [PubMed] [Google Scholar]
- 74.Sykes DA, Dowling MR, Leighton-Davies J, Kent TC, Fawcett L, Renard E, Trifilieff A, Charlton SJ, The influence of receptor kinetics on the onset and duration of action and the therapeutic index of NVA237 and tiotropium, J Pharmacol Exp Ther 343, 520–528 (2012). [DOI] [PubMed] [Google Scholar]
- 75.Koryakina YA, Fowler TW, Jones SM, Schnackenberg BJ, Cornett LE, Kurten RC, Characterization of a panel of six β2-adrenergic receptor antibodies by indirect immunofluorescence microscopy, Respir Res 9, L279 (2008). [DOI] [PMC free article] [PubMed] [Google Scholar]
- 76.Huang B, Wu H, Bhaya D, Grossman A, Granier S, Kobilka BK, Zare RN, Counting low-copy number proteins in a single cell, Science 315, 81–84 (2007). [DOI] [PubMed] [Google Scholar]
- 77.Halls ML, Yeatman HR, Nowell CJ, Thompson GL, Gondin AB, Civciristov S, Bunnett NW, Lambert NA, Poole DP, Canals M, Plasma membrane localization of the μ-opioid receptor controls spatiotemporal signaling, Sci Signal 9, ra16–ra16 (2016). [DOI] [PubMed] [Google Scholar]
- 78.Schindelin J, Arganda-Carreras I, Frise E, Kaynig V, Longair M, Pietzsch T, Preibisch S, Rueden C, Saalfeld S, Schmid B, Tinevez J-Y, White DJ, Hartenstein V, Eliceiri K, Tomancak P, Cardona A, Fiji: an open-source platform for biological-image analysis, Nat Meth 9, 676–682 (2012). [DOI] [PMC free article] [PubMed] [Google Scholar]
- 79.Kardash E, Bandemer J, Raz E, Imaging protein activity in live embryos using fluorescence resonance energy transfer biosensors, Nat Protoc 6, 1835–1846 (2011). [DOI] [PubMed] [Google Scholar]
- 80.Boersema PJ, Raijmakers R, Lemeer S, Mohammed S, Heck AJR, Multiplex peptide stable isotope dimethyl labeling for quantitative proteomics, Nat Protoc 4, 484–494 (2009). [DOI] [PubMed] [Google Scholar]
- 81.Cox J, Mann M, MaxQuant enables high peptide identification rates, individualized p.p.b.-range mass accuracies and proteome-wide protein quantification, Nat Biotechnol 26, 1367–1372 (2008). [DOI] [PubMed] [Google Scholar]
- 82.Consortium UniProt, UniProt: a hub for protein information, Nucleic Acids Res 43, D204–12 (2015). [DOI] [PMC free article] [PubMed] [Google Scholar]
- 83.Huang DW, Sherman BT, Lempicki RA, Systematic and integrative analysis of large gene lists using DAVID bioinformatics resources, Nat Protoc 4, 44–57 (2008). [DOI] [PubMed] [Google Scholar]
- 84.Huang DW, Sherman BT, Lempicki RA, Bioinformatics enrichment tools: paths toward the comprehensive functional analysis of large gene lists, Nucleic Acids Res 37, 1–13 (2009). [DOI] [PMC free article] [PubMed] [Google Scholar]
- 85.Diviani D, Soderling J, Scott JD, AKAP-Lbc anchors protein kinase A and nucleates Ga12-selective Rho-mediated stress fiber formation, J Biol Chem 276, 44247–44257 (2001). [DOI] [PubMed] [Google Scholar]
- 86.Tao J, Wang H-Y, Malbon CC, Protein kinase A regulates AKAP250 (gravin) scaffold binding to the β2-adrenergic receptor, EMBO J 22, 6419–6429 (2003). [DOI] [PMC free article] [PubMed] [Google Scholar]
- 87.Willoughby D, Masada N, Wachten S, Pagano M, Halls ML, Everett KL, Ciruela A, Cooper DMF, AKAP79/150 interacts with AC8 and regulates Ca2+-dependent cAMP synthesis in pancreatic and neuronal systems, J Biol Chem 285, 20328–20342 (2010). [DOI] [PMC free article] [PubMed] [Google Scholar]
- 88.Dehvari N, Hutchinson DS, Nevzorova J, Dallner OS, Sato M, Kocan M, Merlin J, Evans BA, Summers RJ, Bengtsson T, β(2)-Adrenoceptors increase translocation of GLUT4 via GPCR kinase sites in the receptor C-terminal tail, Br J Pharmacol 165, 1442–1456 (2012). [DOI] [PMC free article] [PubMed] [Google Scholar]
- 89.Tang Y, Hu LA, Miller WE, Ringstad N, Hall RA, Pitcher JA, DeCamilli P, Lefkowitz RJ, Identification of the endophilins (SH3p4/p8/p13) as novel binding partners for the beta1-adrenergic receptor, Proc Natl Acad Sci USA 96, 12559–12564 (1999). [DOI] [PMC free article] [PubMed] [Google Scholar]
- 90.Mccahill A, McSorley T, Huston E, Hill EV, Lynch MJ, Gall I, Keryer G, Lygren B, Tasken K, van Heeke G, Houslay MD, In resting COS1 cells a dominant negative approach shows that specific, anchored PDE4 cAMP phosphodiesterase isoforms gate the activation, by basal cyclic AMP production, of AKAP-tethered protein kinase A type II located in the centrosomal region, Cell Signal 17, 1158–1173 (2005). [DOI] [PubMed] [Google Scholar]
- 91.Baillie GS, Sood A, McPhee I, Gall I, Perry SJ, Lefkowitz RJ, Houslay MD, β-Arrestin-mediated PDE4 cAMP phosphodiesterase recruitment regulates β-adrenoceptor switching from Gs to Gi, Proc Natl Acad Sci USA 100, 940–945 (2003). [DOI] [PMC free article] [PubMed] [Google Scholar] [Retracted]
- 92.Tao J, Wang H-Y, Malbon CC, Protein kinase A regulates AKAP250 (gravin) scaffold binding to the β2-adrenergic receptor, EMBO J 22, 6419–6429 (2003). [DOI] [PMC free article] [PubMed] [Google Scholar]
- 93.Wachten S, Masada N, Ayling L-J, Ciruela A, Nikolaev VO, Lohse MJ, Cooper DMF, Distinct pools of cAMP centre on different isoforms of adenylyl cyclase in pituitary-derived GH3B6 cells, J Cell Sci 123, 95–106 (2010). [DOI] [PMC free article] [PubMed] [Google Scholar]
- 94.Harvey CD, Ehrhardt AG, Cellurale C, Zhong H, Yasuda R, Davis RJ, Svoboda K, A genetically encoded fluorescent sensor of ERK activity, Proc Natl Acad Sci USA 105, 19264–19269 (2008). [DOI] [PMC free article] [PubMed] [Google Scholar]
- 95.Gallegos LL, Kunkel MT, Newton AC, Targeting protein kinase C activity reporter to discrete intracellular regions reveals spatiotemporal differences in agonist-dependent signaling, J Biol Chem 281, 30947–30956 (2006). [DOI] [PubMed] [Google Scholar]
- 96.Violin JD, Zhang J, Tsien RY, Newton AC, A genetically encoded fluorescent reporter reveals oscillatory phosphorylation by protein kinase C, J Cell Biol 161, 899–909 (2003). [DOI] [PMC free article] [PubMed] [Google Scholar]
- 97.Niwa H, Yamamura K, Miyazaki J, Efficient selection for high-expression transfectants with a novel eukaryotic vector, Gene 108, 193–199 (1991). [DOI] [PubMed] [Google Scholar]
- 98.Yost EA, Mervine SM, Sabo JL, Hynes TR, Berlot CH, Live cell analysis of G protein β5 complex formation, function, and targeting, Mol Pharmacol 72, 812–825 (2007). [DOI] [PubMed] [Google Scholar]
- 99.Dell’Acqua ML, Membrane-targeting sequences on AKAP79 bind phosphatidylinositol-4,5-bisphosphate, EMBO J 17, 2246–2260 (1998). [DOI] [PMC free article] [PubMed] [Google Scholar]
- 100.Oakley RH, Laporte SA, Holt JA, Caron MG, Barak LS, Differential affinities of visual arrestin, β arrestin1, and β arrestin2 for G protein-coupled receptors delineate two major classes of receptors, J Biol Chem 275, 17201–17210 (2000). [DOI] [PubMed] [Google Scholar]
- 101.Zaccolo M, Pozzan T, Discrete microdomains with high concentration of cAMP in stimulated rat neonatal cardiac myocytes, Science 295, 1711–1715 (2002). [DOI] [PubMed] [Google Scholar]
- 102.Ballesteros JA, Weinstein H, Sealfon SC, Ed. Integrated methods for the construction of three-dimensional models and computational probing of structure-function relations in G protein-coupled receptors, Methods Neurosci 25, 366–428 (1995). [Google Scholar]
Associated Data
This section collects any data citations, data availability statements, or supplementary materials included in this article.
Supplementary Materials
Table S1. Femtomolar concentrations of ligand increase cAMP.
Table S2. The β2AR and M3R constitutively form complexes at the plasma membrane.
Table S3. Proteins from hierarchical clustering analysis.
Figure S1. Endogenous expression of GPCRs in HEK293 cells.
Figure S2. Biphasic changes in cAMP are due to activation of endogenously expressed β2AR and M3R. Figure S3. FRET biosensors can detect responses to femtomolar concentrations of ligand with endogenous or exogenous receptor expression.
Figure S4. Plasma membrane localization and activity of mutant β2AR and M3R.
Figure S5. Modeling responses to femtomolar concentrations of Iso.
Figure S6. Identification of proteins involved in stimulation and regulation of responses to 1 fM Iso. Figure S7. The β2AR forms a pre-assembled signalling complex.
Figure S8. Identification of proteins involved in stimulation and regulation of responses to 1 fM CCh. Figure S9. The M3R forms a pre-assembled signalling complex.
Figure S10. Femtomolar ligand concentrations activate compartmentalised signalling and unique cell responses.