Abstract
Purpose:
The purpose of this study is to evaluate the performance characteristic of volumetric image-guided dedicated-nozzle pencil beam-scanning proton therapy (PT) system.
Materials and Methods:
PT system was characterized for electromechanical, image quality, and registration accuracy. Proton beam of 70.2–226.2 MeV was characterized for short- and long-term reproducibility in integrated depth dose; spot profile characteristics at different air gap and gantry angle; positioning accuracy of single and pattern of spot; dose linearity, reproducibility and consistency. All measurements were carried out using various X-ray and proton-beam specific detectors following standard protocols.
Results:
All electro-mechanical, imaging, and safety parameters performed well within the specified tolerance limit. The image registration errors along three translation and three rotational axes were ≤0.5 mm and ≤0.2° for both point-based and intensity-based auto-registration. Distal range (R90) and distal dose fall-off (DDF) of 70.2–226.2 MeV proton beams were within 1 mm of calculated values based on the international commission on radiation units and measurements 49 and 0.0156× R90, respectively. The R90 and DDF were reproducible within a standard deviation of 0.05 g/cm2 during the first 8 months. Dose were linear from 18.5 (0.011 MU/spot) to 8405 (5 MU/spot) MU, reproducible within 0.5% in 5 consecutive days and consistent within 0.8% for full rotation. The cGy/MU for 70.2–226.2MeV was consistent within 0.5%. In-air X(Y) spot-sigma at isocenter varies from 2.96 (3.00) mm to 6.68 (6.52) mm for 70.2–226.2 MeV. Maximum variation of spot-sigma with air-gap of ±20 cm was ±0.36 mm (5.28%) and ±0.82 mm (±12.5%) along X- and Y-direction and 3.56% for full rotation. Relative spot positions were accurate within ±0.6 mm. The planned and delivered spot pattern of known complex geometry agreed with (γ%≤1) for 1% @ 1 mm >98% for representative five-proton energies at four gantry angle.
Conclusion:
The PT-system performed well within the expected accuracy level and consistent over a period of 8 months. The methodology and data presented here may help upcoming modern PT center during their crucial phase of commissioning.
Keywords: Characterization, commissioning, pencil-beam scanning, proton, validation
INTRODUCTION
Proton therapy (PT) has shown better sparing of surrounding normal tissue and reduction of integral dose as compare to outcome, improved quality of life, and reduction of second cancer.[1] Recently, PT with pencil-beam scanning (PBS) technique is increasingly adopted (https:// www.ptcog.ch) primarily due to its technological advancement as compare to traditional passive-scattering technique, availability of less-expensive single-room compact system, and emergence of promising dosimetric and clinical outcome data.[1] The first PT facility in India was clinically commissioned at the Apollo Proton Cancer Center (APCC), Chennai. This three room (two gantries and one fix line) PT facility is equipped with the latest model of Proteus 235 (IBA, Louvain-la-Neuve, Belgium) with dedicated nozzle (DN) and cone-beam computed tomography (CBCT). The DN is a newly developed nozzle exclusively for PBS technique, and it claimed to produce the proton spots of smaller size in comparison to previous universal nozzle.[2] CBCT is also a new system capability in addition to orthogonal radiograph.
The characterization of a new PT system is of paramount importance to understand its complete behavior and establishing baseline data for subsequent consistency check. Characterization need to be carried out with the highest possible accuracy for precise and safe delivery of dose to patient. Very recently, the American Association of Physicist in Medicine (AAPM) have published the guideline for the quality assurance (QA) of PT system in its task group report no 224 (AAPM-TG 224).[3] However, consensus guideline for the characterization of PT facility for clinical commissioning is still lacking in the literature. Adopted methodology and test protocols vary from center to center depending on the system configuration, measuring equipment type, and physicist viewpoint. Proton beam characteristic of active scanning PT systems have been reported from few PT centers, equipped with different proton accelerators and beam delivery techniques.[4,5,6] However, comprehensive proton-beam characteristics, dosimetric data, electromechanical, image quality, and image registration evaluation results from Proteus 235 PT system with dedicated PBS nozzle is lagging in the literature. In this study, we report the performance characteristics of the first gantry of our multi-room PT facility capable of delivering both single-field uniform dose and intensity-modulated proton therapy. Performance characterization includes (a) electro-mechanical characterization, (b) image quality and image registration accuracy test using different registration algorithms, and (c) characterization, calibration, and consistency of proton beam.
MATERIALS AND METHODS
Overview of the proton therapy facility
Proteus-235 comprises C230 isochronous cyclotron, energy selection system (ESS), beam transport system (BTS), dedicated PBS nozzle, and two pairs of kV X-ray tube (Rad-A and Rad-B) and flat-panel detectors. Leoni robot (Leoni, France) was integrated to Proteus 235 for patient positioning and set-up error correction in six dimensions (6D). The C230 isochronous cyclotron uses an azimuthally varying field to accelerate hydrogen nuclei up to 230 MeV which can be reduced till 70 MeV using beam degrader in ESS. Minimum and maximum extracted beam current ranges from 1 to 350 nA with an average extraction efficiency better than 50%. Average magnetic field at center, valley, and extraction is 1.76, 0.9, and 2.188 Tesla, respectively. The stated range of proton varies from 4 to 32 g/cm2 at DN exit. The range of proton beam can be reduced further by 7.5 g/cm2 using an add-on Lexan (density = 1.25 g/cm2) Range shifter having water equivalent thickness of 7.5 g/cm2 (physical thickness of 6 cm). One spot sigma for the maximum proton energy in air and at isocenter was quoted at 3 mm. The maximum field size was 30 cm × 40 cm at isocenter. Minimum and maximum MUs per spot were limited to 0.01–12 MU by the controller software. The two pairs of kV imaging system driven by Adapt Insight software (IBA, Louvain-la-Neuve, Belgium) enable patient positioning verification in 6D employing orthogonal planar radiograph and CBCT and the same can be corrected in 6D using Leoni robot.
Electro-mechanical and safety test
Electromechanical test related to translational and rotational movement accuracy of Leoni robot patient positioning system (PPS), gantry rotational and speed accuracy, isocentric accuracy with respect to PPS and gantry movement, congruence of proton isocenter, and imaging isocenter were tested following standard test methods. Safety interlock tests were performed following the manufacturer test protocol. Mechanical and image quality-related tests of IGRT system were carried out in both stereo X-ray imaging and CBCT mode using appropriate test tools and methodology described in AAPM TG179[7] and acceptance test protocol of IBA. The included test were the congruence of Rad-A and Rad-B isocenter, low and high-contrast resolution in planar radiography and CBCT mode, computed tomography (CT) number accuracy and uniformity test for CBCT in small and large field of view (LFOV). The details of the test methods are describe elsewhere.[7]
Image registration accuracy test
Image registration accuracy test was carried out using an anthromorphic head and neck phantom having seven markers implanted at predefined locations. Thin slice (1 mm) CT scan of this phantom acquired on 85 cm bore multislice AcquilonLB (M/S Canon Medical System Corporation, Japan) CT scanner was used to create a four-field treatment plan in RayStation TPS. The approved plan was exported to AdaptInsight through MOSAIQ oncology information system. The phantom was setup on the Leoni PPS and aligned using room laser as if it is done for the patient. An orthogonal radiographs were acquired and subsequently registered with the digitally reconstructed radiograph; first using the point-based automatic registration algorithm and second by automatic matching based on intensity. The procedure was repeated after applying known off-set in all three translational axes and rotation. The measured stereo X-ray correction vectors were compared with the known off-sets. Using the same plan, CBCT were acquired for the same phantom and co-registered with reference planning CT datasets using intensity-based auto-registration and estimated correction vectors were compared against known expected values.
Characterization and calibration of proton beam
Pristine Bragg peak/integrated depth dose measurement
Integrated depth doses (IDD) from 70.2 to 226.2 MeV proton energy were acquired in 10 MeV increment using 3D scanning tank (Blue Phantom2) and large diameter (12 cm) parallel plate ionization chamber (StingRay Sr No 0042; IBA Dosimetry, Germany). The IC23 available in DN exit was used as a reference detector. All the measurements were carried out at gantry 0° and water surface at isocenter following general guideline described in AAPM TG106.[8] The measured range (R90) from each IDD was compared against calculated range based on the international commission on radiation units and measurements 49.[9] The measured distal dose fall-off (DDF), defined as the depth difference between 20% and 80% distal depth dose (DDF = R20% − R80%), were compared against expected value calculated as 0.0156 times calculated range.[10] The complete set of IDDs measurement was repeated in the next week to check the short-term reproducibility. IDDs were also measured from 70.2 to 226.2 MeV in 10 MeV increment using a Zebra multi-layer ionization chamber (MLIC) (IBA Dosimetry, Germany). It contains 180 air-vented parallel plate ionization chambers of 2.5 cm diameter and inter-chamber spacing of 2 mm. It can cover energies ranging from 2 to 33 cm of WET with a resolution of 2 mm. The detail performance characteristics of Zebra MLIC is reported elsewhere.[11] The R90 extracted from the IDDs measured in water phantom using stingray and zebra MLIC was compared to establish the baseline for subsequent QA. The long-term reproducibility of the IDDs over the period of 8 months was also assessed from the five repeated measurement of IDDs using Zebra MLIC.
Spot profile and position measurement
Spot profiles from a five-spot pattern of mono-energy proton ranging from 70.2 to 226.2 MeV were acquired in 10 MeV increment in air by keeping the active layer of Lynx (IBA Dosimetry, Germany) at air gap of 0 cm (isocenter), ±10 cm and ±20 cm, respectively. Lynx is a gadolinium-based two-dimensional-scintillation detector having an effective spatial resolution of 0.5 mm and active surface area of 30 cm × 30 cm and its detail characteristics are reported elsewhere.[12] From these five set of measurements per chosen energy, the central spot profile were analyzed using Omnipro IMRT software and myQA fast tract software (IBA dosimetry, Germany) and was used as an input data for commissioning RayStation TPS. Spot size represented by one sigma (1 σ) of each Gaussian distribution along X and Y direction were estimated for each select energies at five air gap. Spot symmetry along X and Y direction were also estimated from the measured profiles for the selected energies and air gap. The dependence of spot size with gantry angle was investigated by repeating the measurement of spot pattern at different gantry angle of 0°, 60°, 220°, and 270° degree for five proton energies of 70.2, 100, 115, 145, and 226.2 MeV, respectively. The same five spot patterns acquired for 70.2–226.2 MeV in 10 MeV increment at gantry 90° at different air gaps were also used to calculate the relative spot position of the corner spots with respect to the central spot.
Spot pattern accuracy
A complex dose/spot pattern of known geometry was created in PBS layer dose (PLD) file, an IBA specific format. This PLD file were exposed on Lynx at four gantry angle of 0°, 60°, 270°, and 220° for every proton energy of 226.2, 145, 120, 100, and 70.2 MeV, respectively. The agreement between measured and planned dose fluence of the known geometry was compared using gamma (γ% ≤1) values set at 1.0% dose difference at 1 mm.
Absolute dose calibration
Dose (cGy)/monitor unit calibration
The number of spots (1681), spot spacing (2.5 mm), and monitor unit (MU)/spot (1 MU) of every mono-energy scanned field were optimized to deliver a uniform dose to 10 cm × 10 cm field. Ionization measurement from 33 mono-energy (70.2–226.2 MeV in 5 MeV increment) scanned field of 10 cm × 10 cm were carried out in water phantom at 2–8 cm depths, using PPC05 parallel plate chamber and Dose-1 electrometer (IBA dosimetry, Germany), following recommendation of RayStation TPS beam physics guide. The absorbed dose to water at the reference depths was calculated following the formalism of International Atomic Energy Agency TRS-398.[13]
Dose linearity and monitor unit accuracy
The above mono-energy scanned field of 10 cm × 10 cm were edited with MU/spot ranging from 0.011 to 5 resulting in 12 fields, each delivering total MU ranging from 18.49 to 8405 respectively. Dose measurement from these 12 fields were carried out for proton energy of 226.2, 145 and 70.2 MeV using PPC05 ionization chamber positioned at 2 cm depth in a solid RW3 phantom of 35 cm × 35 cm × 35 cm. For each programed MUs, the corresponding MU readings from primary and secondary monitor chambers were also recorded at the end of the irradiation to check the accuracy of MU counters.
Dose reproducibility and Output constancy with gantry angle
The short and long term dose reproducibility were tested by repeating the measurement 10 times within 15 min, 8 h (1 day) and 5 days (1 week) from any arbitrarily chosen energy of 200 MeV scanned for 10 cm × 10 cm with 1 MU/spot. Ionization measurement from 150 MeV scan field of 10 cm × 10 cm were also performed for five times for every gantry angle of 0°, 30°, 90°, 135°, 180°, 270°, 325°.
RESULTS
The results of the electromechanical test related to Leoni PPS, Gantry, isocentricity, congruence of X-ray and proton isocenter are summarized in Table 1. It also shows the results of planar kV and CBCT image quality, scale and distance measurement on CBCT images, CT number accuracy and uniformity in CBCT both for small field of view and LFOV. All the parameters were within the acceptance tolerance limit provided by the manufacturer and recently published AAPM TG224.[3,7] Also, all the safety features pass the acceptance criteria. The point based image registration errors along translation (X, Y, Z) and rotation (Yaw, pitch, roll) were 0.3,-0.2, 0.5 mm and 0°, 0.2°, 0.1° respectively. The corresponding values for intensity based auto-registration error were 0.4, 0.0, 0.1 mm and-0.1°, 0.0°, 0.1° respectively. The details of the test results will not be discuss in this manuscript.
Table 1.
Results of the electromechanical test and imaging parameters
| Results | |
|---|---|
| Electro-mechanical parameters test related to Leoni PPS and proton gantry | |
| Accuracy in linear movements of Leoni PPS | Max deviation from programmed position along X=0.3 mm, Y=0.2 mm and Z=0.1 mm |
| Accuracy in the angular movement of Leoni PPS | Max deviation from programmed position in Pitch=0.1°, roll=0.1° and rotation=0.3° |
| Isocentricity of Leoni PPS | <1 mm diameter (Max deviation along X=±0.4 mm, Y=−0.7 mm, Z=±0.4 mm) |
| Isocentricity with respect to gantry rotation | <1 mm diameter (Max deviation along X=±0.2 mm, Y=±0.4 mm, Z=±0.3 mm) |
| MRD of gantry due to emergency stop | <5° for rotational speed of 6°/S and <1° for rotational speed of 1°/S |
| Gantry rotation speed | 6°/s for gantry speed of 1 RPM, 1°/s for Gantry speed of 0.13 RPM |
| Rotational accuracy of gantry | ±0.1° |
| X-ray beam and Proton beam co-incidence at different gantry angle | <1.5 mm diameter |
| Image quality test performed | |
| High-contrast spatial resolution tested using Digi-13 imaging phantom for planar kV X-rays | 3.1 lp/mm for Rad A and 3.4 lp/mm for Rad B |
| Low-contrast resolution tested using Digi-13 imaging phantom for planar kV X-rays | 1.2% for Rad A and 0.8% for Rad B |
| Scale and distance measurement accuracy in CBCT images | Deviation between expected and measured distance were ≤0.5 mm for both large and small FOV |
| CT number accuracy and uniformity test for CBCT in small and large FOV | Measured and expected CT number for water, acrylic, air and LDPE agrees within±30 HU and±20 HU for SFOV and LFOV, respectively |
| High-contrast spatial resolution tested using CatPhan-600 for CBCT | 8 lp/cm for LFOV and 7 lp/cm for SFOV |
| Low contrast sensitivity tested using CatPhan-600 for CBCT | 15 mm @ 1% |
PPS: Patient positioning system, MRD: Maximum rotational displacement, CT: Computed tomography, CBCT: Cone beam CT, FOV: Field of view, LFOV: Large FOV, SFOV: Small FOV
Characterization and calibration of proton beam
Pristine Bragg peak/integrated depth dose characteristics
Figure 1 represents one set of normalized IDDs from 70.2 to 226.2 MeV proton energy in 10 MeV increment. The corresponding calculated range (R90) and the absolute difference observed in two separate measurements (inside bar plot) is shown in Figure 2a. The expected range for 70.2–226.2 MeV increases from 4.1 to 32.04 g/cm2. The difference between calculated and measured ranges for the entire energy was within ±0.1 g/cm2. Furthermore, the first and second sets of measured IDD agree within ±0.1 g/cm2. Figure 2b shows the calculated DDF (DDF = 0.0156 × calculated range) for 70.2–226.2 MeV proton energy in 10 MeV increment. The inside bar plot represents the absolute difference between calculated and measured (R20 − R80) DDF. The calculated and measured DDF agrees well within ±0.08 g/cm2 for all proton energies. The mean values of R90 for 70.2–226.2 MeV measured with Zebra MLIC and StingRay agrees within ±0.1 g/cm2. The five sets of IDDs measured from 70.2 to 226.2 MeV in 10 MeV increment over the period of 8 months using Zebra MLIC were reproducible within a standard deviation (SD) of 0.05 g/cm2 in R90 [Figure 3].
Figure 1.
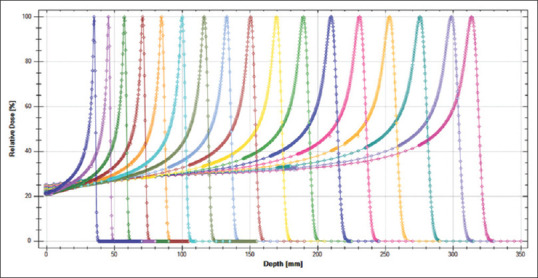
Normalized integrated depth doses from 70.2 to 226.2 MeV proton beam measured using large diameter StingRay parallel plate ionization chamber in water tank
Figure 2.
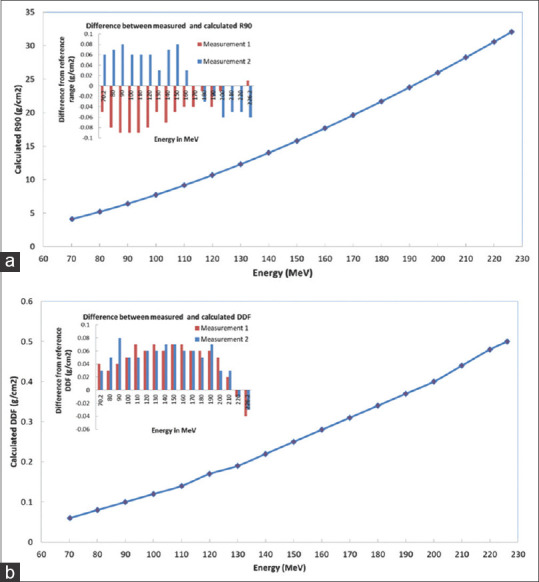
(a) Expected range (R90) in g/cm2 for proton energies from 70.2-226.2 MeV. Inside bar plot represent the difference in ranges between expected and from two sets of separate measurement. (b) Expected distal dose fall-off in g/cm2 for proton energies from 70.2 to 226.2 MeV. Inside bar plot represent the difference in distal dose fall-off between expected and from two sets of separate measurement
Figure 3.
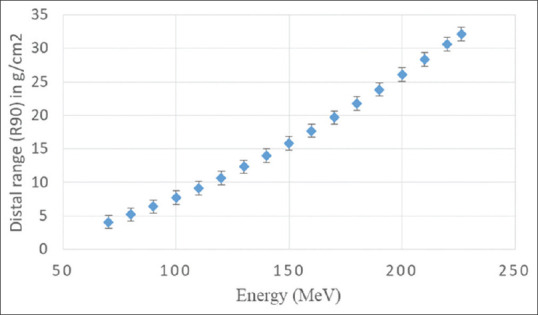
Variation in the distal range (R90) corresponding to proton energy ranging from 70.2 to 226.2 MeV over the period of 8 months. All measurements were performed using Zebra multi-layer ionization chamber
Spot Profile and position characteristics
The spot size (1 σ) measured at different air gaps of 0 cm (isocenter), ±10 cm and ±20 cm from the isocenter for 70.2–226.2 MeV proton in 10 MeV increment are shown in Figure 4. The Spot sigma along X-direction [Figure 4a] varies from 2.96 mm for 226.2 MeV to 6.68 mm for 70.2 MeV at isocenter. The corresponding values in Y-direction [Figure 4b] were 3.0 mm and 6.52 mm respectively. For the same proton energy, the percentage difference in the spot sigma along X and Y direction varies from ±0.19% (±0.01 mm) up to ±4.5% (±0.15 mm) at isocenter. No correlation was observed between the magnitude of deviation and beam energy. However, the deviation between X and Y sigma increases as the air gap increases primarily due to the changes in Y spot sigma with air gap. In comparison to spot sigma measured at isocenter, the variation in spot sigma with air gap was minimal along X-direction with a maximum deviation of 0.36 mm (5.28%) for 70.2 MeV and more along Y-direction with maximum deviation of ±0.82 mm (±12.5%) for 70.2 MeV, which gradually decreases with increase in energy and attain a minimum value of ±0.21 mm (±7.15%) for 226.2 MeV. The spot sigma measured at isocenter along X and Y direction for five selective energies at four different gantry positions is shown in Table 2. In comparison to median spot size, a maximum deviation of 3.56% was observed for range of 145 MeV at 220 gantry angle. The deviation between planned and measured positions of the four-corner spots with respect to central spot were within ±0.6 mm as shown in [Figure 5a]. The central spot profiles of 70.2–226.2 MeV at different air gaps of 0 (isocenter), ±10 cm and ±20 cm were symmetric both in X and Y direction within ±10% [Figure 5b]. The comparison of planned and measured spot pattern/dose fluence along with the gamma analysis value for one of the representative proton energy of 226.2 MeV at 0° gantry is shown in [Figure 6]. In all four gantry angles and proton energies studied, planned and measured dose distribution/spot pattern agrees with (γ% ≤1) greater than 97% for evaluation criteria of 1% dose difference at 1 mm distance-to-agreement (1%@1 mm). The average ±SD γ% were 98.0 ± 0.44% for 226.2 MeV, 98.15% ± 0.23% for 145 MeV, 98.85% ± 0.05% for 120 MeV, 98.85% ± 0.23% for 100 MeV and 99.35% ± 0.11% for 70.2 MeV respectively.
Figure 4.
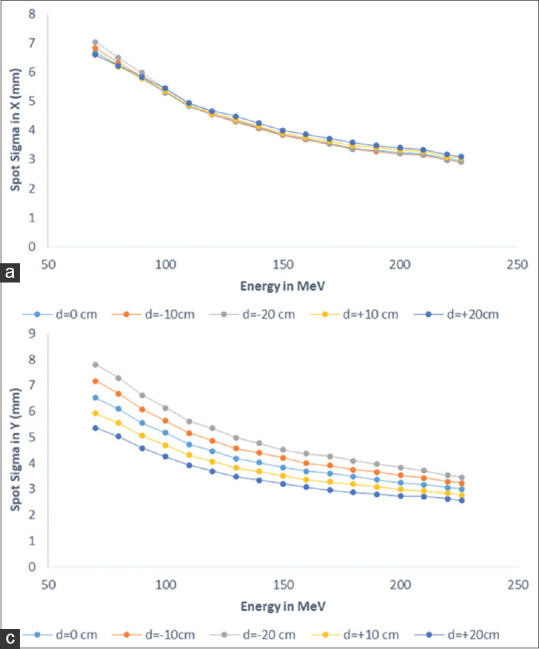
In-air spot size represented by one sigma (1 σ) of X profile (a) and Y profile (b) of the central spot at isocenter for various air gap of 0 (isocenter) cm, ±10 cm and ±20 cm for proton energies ranging from 70.2 to 226.2 MeV in 10 MeV increment
Table 2.
The variation in spot sigma in mm along X and Y direction for different energies at different gantry angle
| Gantry angle | Spot size (1σ) value in mm along X and Y direction for different energies of | |||||||||
|---|---|---|---|---|---|---|---|---|---|---|
| 226.2 MeV | 145 MeV | 115 MeV | 100 MeV | 70.2 MeV | ||||||
| X | Y | X | Y | X | Y | X | Y | X | Y | |
| 0 | 3.00 | 3.08 | 3.89 | 4.01 | 4.55 | 4.74 | 5.36 | 5.23 | 6.48 | 6.63 |
| 60 | 3.03 | 3.02 | 3.87 | 4.04 | 4.51 | 4.76 | 5.11 | 5.40 | 6.49 | 6.74 |
| 220 | 3.01 | 2.97 | 3.93 | 3.87 | 4.54 | 4.65 | 5.16 | 5.32 | 6.52 | 6.68 |
| 270 | 3.00 | 3.00 | 3.98 | 4.02 | 4.60 | 4.70 | 5.22 | 5.37 | 6.56 | 6.65 |
| Median spot size | 3.01 | 3.01 | 3.91 | 4.02 | 4.55 | 4.72 | 5.19 | 5.35 | 6.51 | 6.67 |
| SD | 0.01 | 0.05 | 0.05 | 0.08 | 0.04 | 0.05 | 0.11 | 0.07 | 0.04 | 0.05 |
SD: Standard deviation
Figure 5.
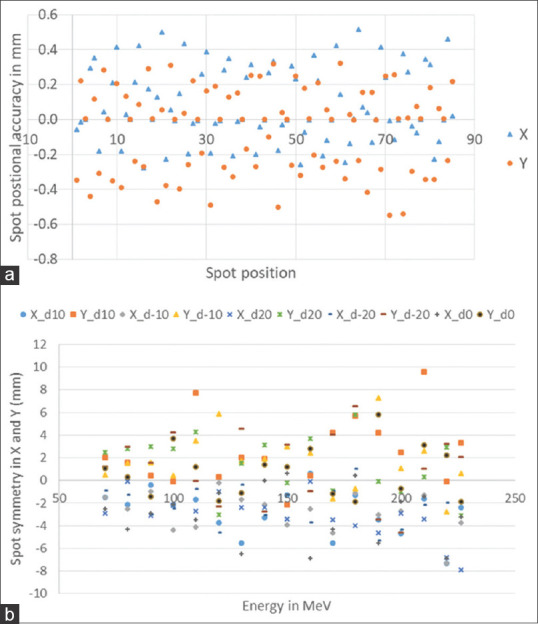
(a) Relative positional deviation of the four corner spots normalized with respect to the central spot for enrgies from 70.2 to 226.2 MeV at isocenter (air gap = 0) and for gantry 90°. (b) Symmetry in % of the central single spots along X and Y direction measured for 70.2–226.2 MeV at 10 MeV increment for gantry 90°and at different air gaps of 0 (isocenter), ±10 cm and ±20 cm
Figure 6.
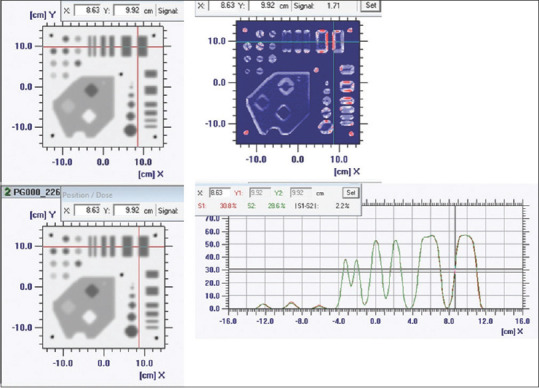
Comparison of planned and measured dose fluence/spot pattern along with the gamma analysis for 226.2 MeV at gantry 0°
Absolute calibration
The variation of output (cGy/MU) with proton energies and their reproducibility in two different days of measurement separated by a week is shown in Figure 7. The output (cGy/MU) decreases sharply in lower energy region and becomes relatively less sensitive in medium to higher energy. The maximum deviation between the two consecutive set of measurement were within ±0.5%. The delivered MU versus the measured dose for three select proton energies is shown in Figure 8. The measured dose was linear within MU ranging from 18.5 to 8405 with regression co-efficient (R2) value of 1.0 for all the three proton energies. The deviation between programed MU and MU monitored by the primary and secondary monitor chambers were within ±0.05% for set MU ≥400. This deviation increases gradually by up to 0.48% for primary and 0.54% for secondary for smaller programed MU of 18.5. However, the overall absolute difference between the programmed MU and monitor chamber monitored MU were within ±0.5 MU for both primary and secondary except for the very high programmed MU of 8405 where the secondary MU monitor recorded more by 1.21 MU. The measured dose from the scanned mono-energy field was reproducible with a co-efficient of variation of 0.07% in 15 min, 0.44% in 8 h and 0.45% in 5 consecutive days. The variation of output at different gantry angle as compared to output at gantry 0° were <0.8%.
Figure 7.
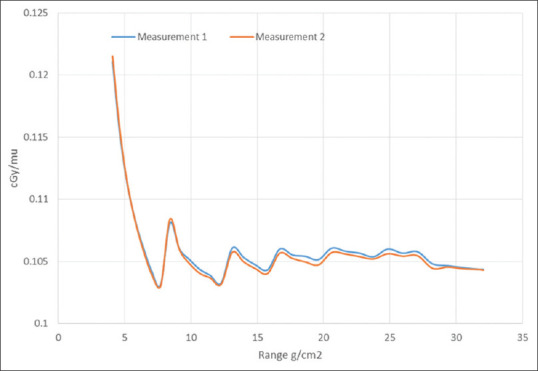
Variation in output (cGy/MU) from 70.2 to 226.2 MeV at 5 MeV increment at gantry 0°and at different depths of measurement in two different days seperated by a week
Figure 8.
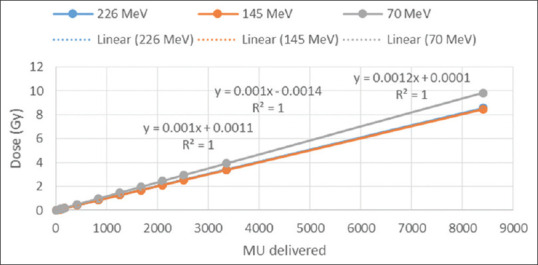
Linearity of the response of the dose monitoring unit over the ranges of 18.49–8405 MU for 226, 145 and 70 MeV
DISCUSSION
Although the accelerator (C230 isochronous cyclotron) and beam delivery technique (PBS) used in our study is similar to the one investigated in the study by Pidikiti et al.,[6] the ESS, BTS, nozzle and image guidance system differs largely and hence expect differences in electro-mechanical and proton beam characteristics. Therefore our results are not directly comparable with any of the previous publications.[4,5,6] Moreover, almost all PT systems today are designed to deliver proton beam in PBS technique and the number of such installations are increasing worldwide. Thus reporting of characterization, performance, commissioning procedures and results from various PT system and delivery technique will be useful for inter comparison of new or existing PT centres, which subsequently may help in developing a common consensus guideline and protocol.
The maximum deviation of calculated and measured R90 were within the specified tolerance limit of 1 mm and were comparable to the data reported by previous investigators.[4,5,6] However it is slightly higher than ±0.15 mm between FLUKA MC calculated and measurement reported by Mirandola et al.[5] This could be due to the difference in depth resolution. The deviation between measured and calculated DDF were within the specified tolerance limit of 1 mm.[6] The increase in spot size with decrease in beam energy is primarily due to the larger wide angle scatter of lower energy proton. However, the larger variation in Y-spot sigma observed at different air gap could be due to the inability of the beam optics to focus all beams at different air gaps. IBA calibrate the beam optics only to make X-and Y spot-sigma similar at isocenter. The variation of spot size with respect to gantry rotation and accuracy of relative spot positions were well within the specified limit of the manufacturer and AAPM TG224.[3]
The output (cGy/MU) calibration for PBS techniques has been reported mostly based on a single depth (2 cm) of measurement. In our study, we have chosen different depth of measurement based on the recommendation of RayStation beam physics guide. The output (cGy/MU) was consistent for the entire energy with a maximum variation of ≤0.5%. We found a very small dependence of ion recombination factor of PPC05 with beam energy and hence corrected accordingly. Excellent results of dose linearity, reproducibly, MU accuracy, and output constancy demonstrate the capability of beam management system to deliver any number of MU between 0.01 MU/spot to 5 MU/spot with high accuracy consistently with accurate monitoring by both primary and secondary MU counters.
CONCLUSION
The performance of first gantry of Proteus235 PT facility equipped with PBS DN and CBCT at APCC is well within the expected accuracy level. The methodology and results presented here might certainly help upcoming modern PT center during its crucial commissioning phase wherein establishing highest possible accuracy of test parameters in time sensitive project is of paramount important.
Financial support and sponsorship
Nil.
Conflicts of interest
There are no conflicts of interest.
REFERENCES
- 1.Loeffler JS, Durante M. Charged particle therapy--optimization, challenges and future directions. Nat Rev Clin Oncol. 2013;10:411–24. doi: 10.1038/nrclinonc.2013.79. [DOI] [PubMed] [Google Scholar]
- 2.Lin L, Ainsley CG, Solberg TD, McDonough JE. Experimental characterization of two-dimensional spot profiles for two proton pencil beam scanning nozzles. Phys Med Biol. 2014;59:493–504. doi: 10.1088/0031-9155/59/2/493. [DOI] [PubMed] [Google Scholar]
- 3.Arjomandy B, Taylor P, Ainsley C, Safai S, Sahoo N, Pankuch M, et al. AAPM task group 224: Comprehensive proton therapy machine quality assurance. Med Phys. 2019;46:e678–e705. doi: 10.1002/mp.13622. [DOI] [PubMed] [Google Scholar]
- 4.Gillin MT, Sahoo N, Bues M, Ciangaru G, Sawakuchi G, Poenisch F, et al. Commissioning of the discrete spot scanning proton beam delivery system at the University of Texas MD Anderson Cancer Center, Proton Therapy Center, Houston. Med Phys. 2010;37:154–63. doi: 10.1118/1.3259742. [DOI] [PMC free article] [PubMed] [Google Scholar]
- 5.Mirandola A, Molinelli S, Vilches Freixas G, Mairani A, Gallio E, Panizza D, et al. Dosimetric commissioning and quality assurance of scanned ion beams at the Italian National Center for Oncological Hadrontherapy. Med Phys. 2015;42:5287–300. doi: 10.1118/1.4928397. [DOI] [PubMed] [Google Scholar]
- 6.Pidikiti R, Patel BC, Maynard MR, Dugas JP, Syh J, Sahoo N, et al. Commissioning of the world's first compact pencil-beam scanning proton therapy system. J Appl Clin Med Phys. 2018;19:94–105. doi: 10.1002/acm2.12225. [DOI] [PMC free article] [PubMed] [Google Scholar]
- 7.Bissonnette JP, Balter PA, Dong L, Langen KM, Lovelock DM, Miften M, et al. Quality assurance for image-guided radiation therapy utilizing CT-based technologies: A report of the AAPM TG-179. Med Phys. 2012;39:1946–63. doi: 10.1118/1.3690466. [DOI] [PubMed] [Google Scholar]
- 8.Das IJ, Cheng CW, Watts RJ, Ahnesjö A, Gibbons J, Li XA, et al. Accelerator beam data commissioning equipment and procedures: Report of the TG-106 of the Therapy Physics Committee of the AAPM. Med Phys. 2008;35:4186–215. doi: 10.1118/1.2969070. [DOI] [PubMed] [Google Scholar]
- 9.Berger MJ, Inokuti M, Andersen HH, Bichsel H, Powers D, Seltzer SM, et al. Stopping powers and ranges for protons and alpha particles: ICRU (International Commission on Radiation Units and Measurements) Report. 1993 May 49; [Google Scholar]
- 10.Arduini G, Cambria R, Canzi C, Gerardi F, Gottschalk B, Leone R, et al. Physical specifications of clinical proton beams from a synchrotron. Med Phys. 1996;23:939–51. doi: 10.1118/1.597735. [DOI] [PubMed] [Google Scholar]
- 11.Dhanesar S, Sahoo N, Kerr M, Taylor MB, Summers P, Zhu XR, et al. Quality assurance of proton beams using a multilayer ionization chamber system. Med Phys. 2013;40:092102. doi: 10.1118/1.4817481. [DOI] [PubMed] [Google Scholar]
- 12.Russo S, Mirandola A, Molinelli S, Mastella E, Vai A, Magro G, et al. Characterization of a commercial scintillation detector for 2-D dosimetry in scanned proton and carbon ion beams. Phys Med. 2017;34:48–54. doi: 10.1016/j.ejmp.2017.01.011. [DOI] [PubMed] [Google Scholar]
- 13.Andreo P, Burns DT, Hohlfeld K, Huq MS, Kanai T, Laitano F, et al. Vienna: IAEA; 2000. Absorbed Dose Determination in External Beam Radiotherapy: An International Code of Practice for Dosimetry Based on Standards of Absorbed Dose to Water IAEA Technical Report Series 398. [Google Scholar]


