Abstract
Purpose
To image retinal macrophages at the vitreoretinal interface in the living human retina using a clinical optical coherence tomography (OCT) device.
Methods
Eighteen healthy controls and three patients with retinopathies were imaged using a clinical spectral-domain OCT. In controls, 10 sequential scans were collected at three different locations: (1) ∼9 degrees temporal to the fovea, (2) the macula, and (3) the optic nerve head (ONH). Intervisit repeatability was evaluated by imaging the temporal retina twice on the same day and 3 days later. Only 10 scans at the temporal retina were obtained from each patient. A 3-µm OCT reflectance (OCT-R) slab located above the inner limiting membrane (ILM) surface was averaged.
Results
In controls, ramified macrophage-like cells with regular spatial separation were visualized in the temporal and ONH OCT-R images; however, cell structures were not resolvable at the macula. Interim changes in cell position suggestive of cell translocation were observed between images collected on the same day and those collected 3 days later. There was considerable variation in cell density and nearest-neighbor distance (NND) across controls. Mean ± SD cell densities measured at the temporal and ONH were 78 ± 23 cells/mm2 and 57 ± 16 cells/mm2, respectively. Similarly, mean ± SD NNDs measured at the temporal and ONH were 74.3 ± 13.3 µm and 93.3 ± 20.0 µm, respectively. Nonuniform spatial distribution and altered morphology of the cells were identified in patients with retinopathies.
Conclusions
Our findings showed regular spatial separation and ramified morphology of macrophage-like cells on the ILM surface with cell translocation over time in controls. Their distribution and morphology suggest an origin of macrophage-like cells such as microglia or hyalocytes.
Keywords: OCT, macrophages, hyalocytes, OCT-A, microglia
The retina contains multiple cell types from the myeloid lineage that play a critical role in the immunity and homeostasis of the retinal microenvironment.1,2 These cells are mainly dendritic cells and macrophages, such as microglia and hyalocytes. Microglia are innate immune cells that reside within the central nervous system, including the retina.3–5 Physiologically, they react to control invading micro-organisms, regulate immune reactions and tissue repair, and release neuroprotective and anti-inflammatory factors.6,7 In the human adult retina, microglia play two main functions, antigen presentation and phagocytosis.8 They provide constant surveillance of their environment and activate promptly at the onset of retinal injury, playing a crucial role during disease development and progression.4,6,9 Hyalocytes are considered the resident macrophages of the vitreous body.10 They were first defined by Balazs et al.,11 who described their location, lining the cortical vitreous.11,12 Histologically, studies have confirmed that hyalocytes are macrophages, immune cells with the capacity to react to antibodies through specific antigenic markers.13,14 Several studies have demonstrated how they react to damage or external insults.15,16 They undergo changes in morphology, immunophenotype, and density in response to changes in their environment.10,17 Physiologically, they help maintain the transparency of the vitreous by clearing cellular debris and secreting antiangiogenic factors that inhibit vessel growth within it.18,19
Due to their role within immunity and inflammation, both microglia and hyalocytes play important roles in retinal pathology. Several groups have demonstrated abnormal microglia accumulation and altered morphologies in retinal diseases such as glaucoma,20,21 diabetic retinopathy,22,23 optic neuropathy,23,24 retinal detachments,25 and age-related macular degeneration.26 Similarly, studies have focused on the response of hyalocytes to pathologic conditions and have shown their role within reactions to photocoagulation,27 hyperglycemia, and VEGF secretion.10 Therefore, understanding and characterizing the different morphologic changes that these cells undergo would be helpful in better understanding of disease mechanisms, severity, and treatment effect.
Studies of retinal macrophages have predominantly been performed ex vivo or in animal models using staining and confocal imaging modalities. These studies have revealed the distribution and dynamic nature of microglia and hyalocytes under various physiologic states9,28–30 and changes in cell morphology and motility in response to injury.31 Recent advances in retinal imaging have enabled the visualization of retinal components at a cellular level in humans.32,33 A few groups have reported the ability to visualize macrophage-like cells within the human retina with the use of commercial optical coherence tomography (OCT)34,35 and adaptive optics optical coherence tomography (AO-OCT).36–38 Additionally, advances in the technology of en face OCT allow the isolation of specific retinal layers, segmented according to their axial depth. This technique employs the coronal plane perspective familiar from conventional ophthalmoscopy, facilitating correlation of findings with other similarly oriented fundus imaging.35–39 However, prior studies using commercial OCT devices have used only OCT B-scans or en face OCT reflectance (OCT-R) with relatively thick slabs, and therefore, it is difficult to characterize morphology and spatial distributions of macrophage-like cells.34,35 AO-OCT allows in vivo high-resolution macrophage-like cell imaging, but its field of view is typically six times smaller than a commercial OCT device.36–38 Another major drawback of AO-OCT systems to date has been the limited availability for clinical application due to their cost and technical complexity. In this study, we present a novel in vivo imaging approach to visualize individual macrophage-like cells in the human retina using clinical en face OCT-R images.
Methods
Subjects
This study was conducted at the New York Eye and Ear Infirmary of Mount Sinai and the Medical College of Wisconsin. All procedures adhered to the tenets of the Declaration of Helsinki and were approved by the Institution Review Board of the New York Eye and Ear Infirmary of Mount Sinai (identifier: 17-00041) and the Medical College of Wisconsin (identifier: PRO 23999). Written informed consent was obtained from all subjects. A total of 21 controls were recruited from the New York Eye and Ear infirmary of Mount Sinai and the Medical College of Wisconsin. Three patients with different retinal pathologies were also recruited from the New York Eye and Ear infirmary of Mount Sinai.
Subjects inclusion criteria required a natural lens, clear media, and good fixation. Subjects were excluded for any evidence of active anterior chamber inflammation, pseudophakia, cataract of any type ≥ grade 3 according to the Lens Opacity Classification System III, other significant opacities, nystagmus, and inability to fixate. Controls were also excluded if they had any systemic vascular diseases such as hypertension, diabetes, and sickle cell disease. All controls were devoid of any retinal or optic nerve pathology on fundus photographs and OCT scans of the macula and optic nerve head (ONH). Only one eye from each subjects was included for imaging and data analysis.
En Face OCT-R and OCT Angiography Image Acquisition
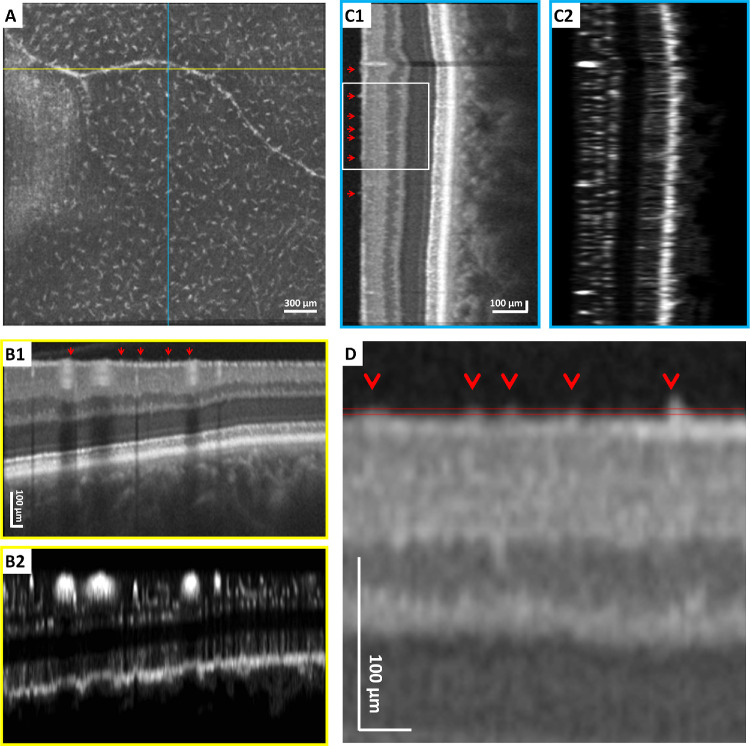
Each control was imaged at three sessions using a commercial spectral domain OCT System with a scan rate of 70,000 A-scans per second, scan beam wavelength centered at 840 nm, and bandwidth of 45 nm (Avanti RTVue-XR; Optovue, Fremont, CA, USA). There were 304 A-scans per B-scan and a total of 608 B-scans per volumetric raster scan with two sequential B-scans taken at each location. Each OCT-R and OCT angiography (OCT-A) image was composed of a merged X-fast and Y-fast volumetric raster scan. Spacing between B-scans was 10 µm and 15 µm in a 3-mm × 3-mm and 4.5-mm × 4.5-mm raster scan, respectively. The device has an axial and lateral optical resolution of 5 µm and 10 µm, respectively. In the first imaging session, three sets of 10 scans were obtained. The first set consisted of 10 sequential 3-mm × 3-mm scans centered at 9 degrees temporal from the fovea, the second set consisted of 10 sequential 3-mm × 3-mm scans centered at the fovea, and the third set consisted of 10 sequential 4.5-mm × 4.5-mm scans centered at the ONH. The second imaging session was performed 2 to 6 hours after the first session. The third imaging session was performed 3 days later. Only 10 sequential 3-mm × 3-mm scans centered at 9 degrees temporal from the fovea were obtained in the second and third imaging sessions. In controls, intervisit repeatability was evaluated by comparing the temporal retina scans collected at three imaging sessions. In brief, each control received a total of 50 scans with 30 scans at the temporal retina, 10 scans at the macula, and 10 scans at the ONH. Patients with retinal pathologies were only imaged once with 10 sequential 3-mm × 3-mm scans at the temporal retina. While the total chair time was approximately 15 minutes for each set of 10 scans, actual scan times were considerably shorter. Following image acquisition, OCT-R and corresponding OCT-A images were generated using the Optovue AngioAnalytics software (version 2017.1.0) and the XR-Avanti Exporting Tool (version 2019.1.28) (Optovue). While OCT-R images were generated using the mean projection of the reflectance signal, OCT-A images were generated using the split-spectrum amplitude decorrelation angiography algorithm.40 For the visualization of macrophage-like cells on the retinal surface, a 3-µm OCT-R slab located above the inner limiting membrane (ILM) was used for further image processing and analysis (Fig. 1). Specifically, a 3-µm OCT-R slab located between the ILM and 3 µm above the ILM was extracted for the macular and temporal regions, and a 3-µm OCT-R slab located between 3 and 6 µm above the ILM was extracted for the ONH region. This 3-µm OCT-R slab above the ILM was studied due to the high likelihood of capturing the macrophage-like cells at this level since better structural contrast on the OCT-R image could be achieved by excluding the strong background signal from the highly reflective retinal nerve fiber layer (RNFL) underneath.
Figure 1.
The 3-mm × 3-mm en face OCT-R imaging of the temporal retina in a healthy control using a clinical OCT device. (A) The 3-µm OCT-R slab located above the ILM, showing regular spatial separation of macrophage-like cells. Fovea is located to the left of the image. (B1, B2) Horizontal OCT and OCT-A B-scan at the position indicated by the yellow horizontal line in A. (C1, C2) Vertical OCT and OCT-A B-scan at the position indicated by the blue vertical line in A. (D) Magnified OCT B-scan (rotated horizontally) at the region indicated by the white box in C1. The axial depth of the 3-µm OCT-R slab in A is indicated by the parallel red lines. Red arrows indicate individual cells on the ILM surface. All B-scans were flattened at the ILM for better visualization of the macrophage-like cells on the ILM surface.
Image Registration and Averaging
Image registration and averaging were performed on the OCT-R and OCT-A images to increase the signal-to-noise ratio and enhance visualization of macrophage-like cells and capillary networks. Studies previously published by our laboratory have demonstrated the value of image averaging in removal of motion artifacts and improving structural contrast on OCT-R images and continuity of vascular outlines on OCT-A images.41,42
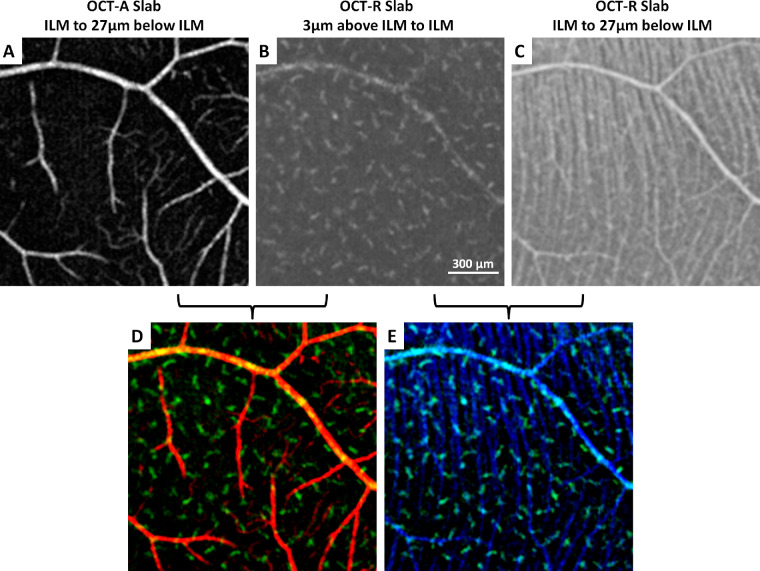
For each set of 10 scans, full vascular OCT-A slabs located between the ILM and 9 µm below the outer plexiform layer were used as the primary data set for registration using the Register Virtual Stack Slices plug-in on ImageJ43 (ImageJ, US National Institutes of Health, Bethesda, MD, USA). The transformation matrix from this set of full vascular OCT-A images was then applied to the corresponding 3-µm OCT-R slabs using the Transform Virtual Stack Slices plug-in on ImageJ. For better understanding of the spatial relationship between the macrophage-like cells, retinal vascular network, and retinal nerve fiber bundles, respective OCT-R and OCT-A slabs located between the ILM and 27 µm below the ILM from the same set of 10 scans were also registered (Fig. 2). Color overlay of the macrophage-like cell layer, retinal vascular network, and RNFL was performed using Adobe Photoshop CS6 (Adobe Systems, Inc., San Jose, CA, USA) (Figs. 2D, 2E). In brief, each layer was first coded in a designated color and then contrast stretched using the levels tool. Specifically, the macrophage-like cell layer was coded in green, the retinal vascular network was coded in red, and the RNFL was coded in blue. After contrast stretching, the macrophage-like cell layer was merged with either the retinal vascular network or the RNFL for better visualization of the spatial relationships among structures.
Figure 2.
Simultaneous imaging of (A) superficial retinal vascular network, (B) macrophage-like cells, and (C) RNFL at the temporal retina in a healthy control. (D, E) Overlay of superficial retinal vascular network (red), macrophage-like cells (green), and retinal nerve fiber bundles (blue) shows the spatial relationships among structures. Fovea is located to the left of all images.
Macrophage-Like Cell Density and Nearest Neighbor Distance Analysis
Macrophage-like cell density and nearest neighbor distance (NND) were measured on the averaged 3-µm OCT-R slab at the temporal retina and the ONH. No measurement was performed on the macula region due to the poor visibility of cell structures. One trained expert manually marked the center of the macrophage-like cells on a 500-µm × 500-µm region of interest (ROI) near the center of the temporal retina and at the supero- and inferotemporal of the ONH on the averaged 3-µm OCT-R images obtained at each imaging session. In the temporal retina, measurements were performed on the same ROI in all three imaging sessions. Cell density and NND were then computed within each ROI. Axial length was obtained using an IOL Master (Carl Zeiss Meditec, Dublin, CA, USA) for ocular magnification correction of each image.44 A second independent grader performed cell density and NND measurements on the baseline scans for intergrader agreement or reproducibility analysis.
Statistical Analysis
All statistical analyses were performed using SPSS 24.0 (IBM Corporation, Chicago, IL, USA). Differences between the temporal retina (mean of three imaging sessions) and ONH (mean of superotemporal and inferotemporal) measurements were compared using the Wilcoxon signed-rank test. Intervisit repeatability was assessed using interclass correlation coefficients (ICCs) with 95% confidence intervals (CIs) and within-subject standard deviation (Sw),45 using macrophage-like cell density and NND measurements at the temporal retina over all three imaging sessions. Intergrader reproducibility on the macrophage cell density and NND was assessed on the baseline temporal retina imaging session using ICCs with 95% CIs and the Bland-Altman plot.
Results
Subjects
Of the 21 controls who were recruited, 3 were excluded due to inability to complete all three imaging sessions. In total, 18 controls were included for image analysis (age range: 22–36 years; mean age: 27.9 ± 4.0 years; male: 9; female: 9). Three patients with different pathologies—proliferative diabetic retinopathy (PDR), central retinal vein occlusion (CRVO), and open angle glaucoma (OAG)—were also recruited for demonstration of macrophage-like cell imaging in patients and qualitative comparison with the controls.
Macrophage-Like Cell Morphology and Translocation
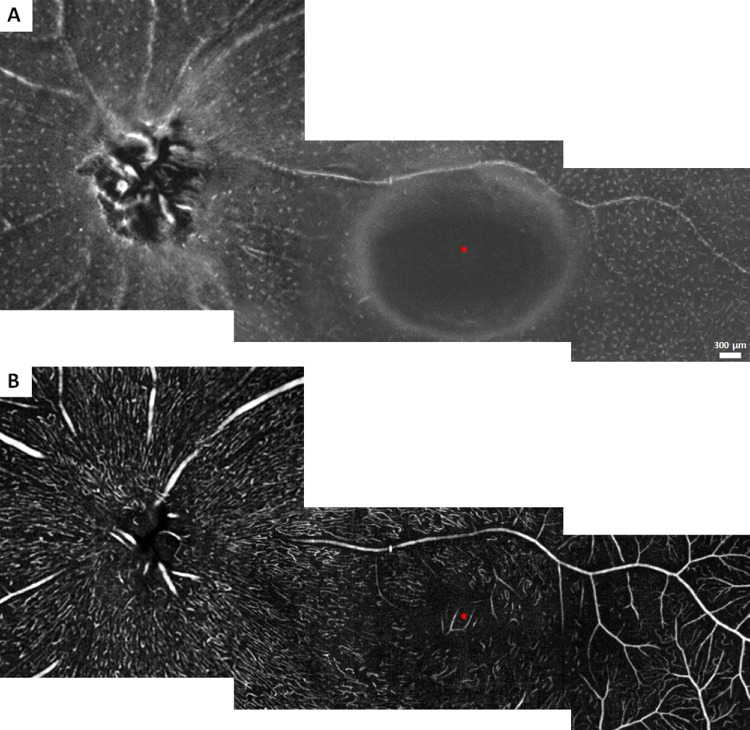
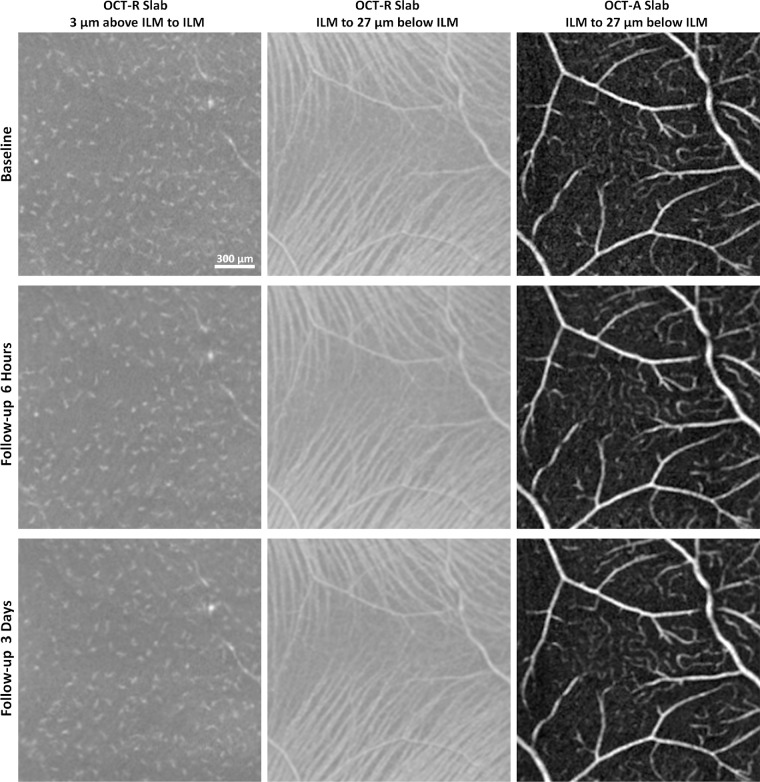
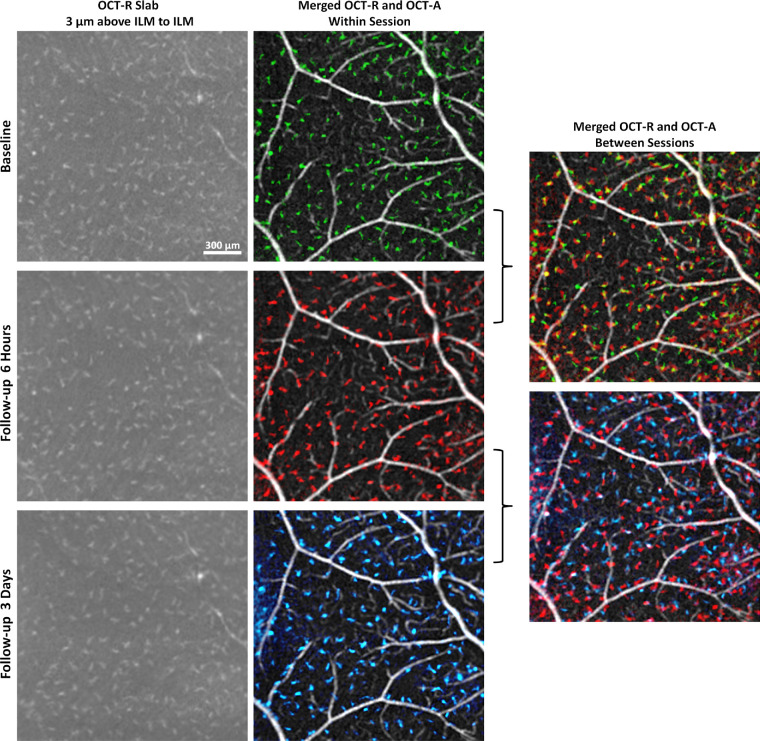
In controls, macrophage-like cells were clearly visible on the averaged 3-µm OCT-R slab of both the temporal retina and the ONH images; however, cell structures were not resolvable at the macula (Fig. 3). Cellular morphology appeared more slender with spindle- or star-like configuration at the temporal retina as compared to the ONH. Upon close examination of the images, ramified macrophage-like cells with two or more protrusions extending in any direction were observed at the temporal retina. Regular spatial separation of the cell structures was also observed at the temporal retina and ONH. These cell structures appeared to be evenly distributed without lateral overlapping and colocalized with larger blood vessels appearing on the retinal nerve fiber layer (RNFL) surface (Fig. 3). Cell translocation was observed within the same day and 3 days later (Figs. 4, 5).
Figure 3.
Spatial distribution of macrophage-like cells and the corresponding superficial retinal vascular network across the retina in a single example of a healthy control. (A) Montage of 3-µm OCT-R slabs located above the ILM surface. (B) Montage of 27-µm OCT-A slabs located below the ILM surface. Asterisks indicate the center of the foveal avascular zone.
Figure 4.
In vivo imaging of macrophage-like cells over time in a healthy control. Left column: 3-µm OCT-R slabs located above the ILM surface. Middle column: 27-µm OCT-R slabs located below the ILM surface, showing the retinal nerve fiber bundles at the temporal raphe. Right column: 27-µm OCT-A slabs located below the ILM surface. Fovea is to the left of all images.
Figure 5.
In vivo imaging of macrophage-like cells over time in a healthy control (same subject as shown in Fig. 4). Left column: 3-µm OCT-R slabs located above the ILM surface at the temporal retina. Middle column: OCT-R (baseline in green, 6 hours follow-up in red, and 3 days follow-up in blue) and OCT-A overlaid. Right column: Merged OCT-R and OCT-A images from two imaging sessions. Cell structures are in different locations at 6 hours and 3 days later, suggesting cell translocation over time. Fovea is located to the left of all images.
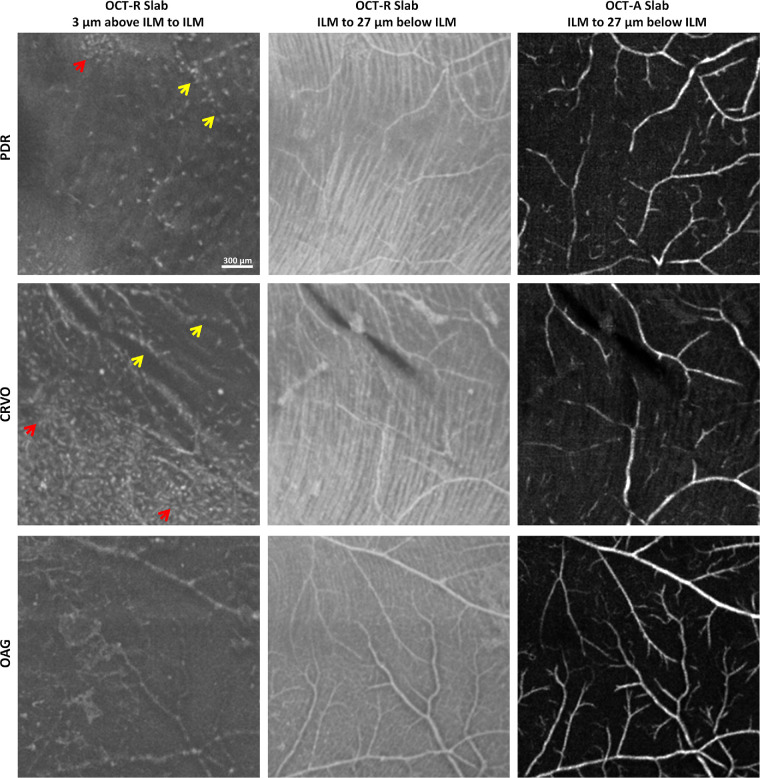
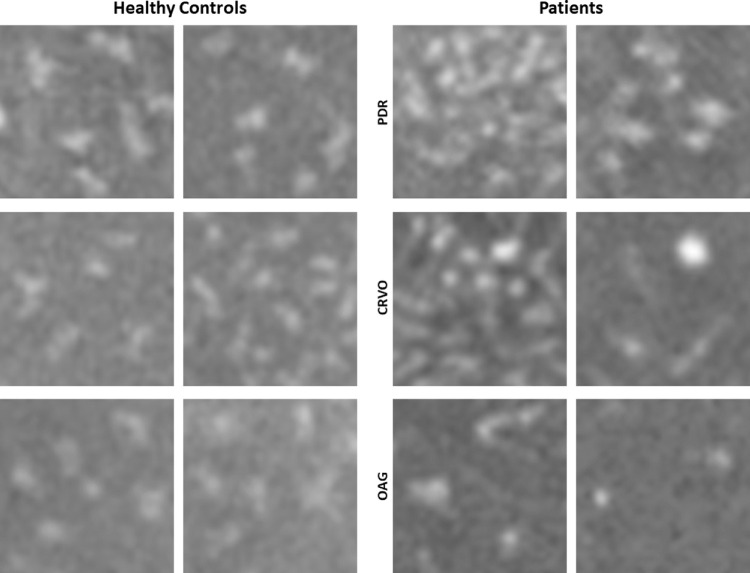
Nonuniform spatial distribution and altered morphology of the macrophage-like cells were identified in patients with retinopathies (Fig. 6). Their morphology appeared relatively larger and more plump with fewer protrusions. Comparisons of macrophage-like cells in healthy controls and patients are shown in Figure 7. In eyes with PDR and CRVO, clusters of cell structures with less slender cell appearance were observed in the temporal retina as compared to controls (Fig. 6, red arrows). These cell structures also appeared to colocalize with the surface of the larger blood vessels (Fig. 6, yellow arrows). In the eye with OAG, diffuse macrophage-like cells and less slender cell appearances were associated with areas of severe RNFL thinning.
Figure 6.
In vivo imaging of macrophage-like cells in patients with retinal pathologies. Left column shows 3-µm OCT-R slabs located above the ILM in patients with PDR (top row), CRVO (middle row), and OAG (bottom row) showed nonuniform distribution and altered morphology of the macrophage-like cells. Corresponding OCT-R and OCT-A of the underlying retinal nerve fiber bundles along the temporal raphe and superficial retinal vascular network are shown in the middle and right columns. Red arrows indicate clusters of cells. Yellow arrows indicate colocalization of cell structures and larger blood vessels. Fovea is to the left of all images.
Figure 7.
Comparisons of macrophage-like cells in six healthy controls and three patients with different retinal pathologies obtained at the temporal retina. Two ROIs with relatively higher and lower cell densities were shown in each patient. Macrophage-like cells in controls appear more slender with spindle- or star-like configuration. In patients, the cells look relatively larger and plumper with fewer protrusions. Each panel is 300 µm × 300 µm in size.
Macrophage-Like Cell Density and Nearest Neighbor Distance Analysis
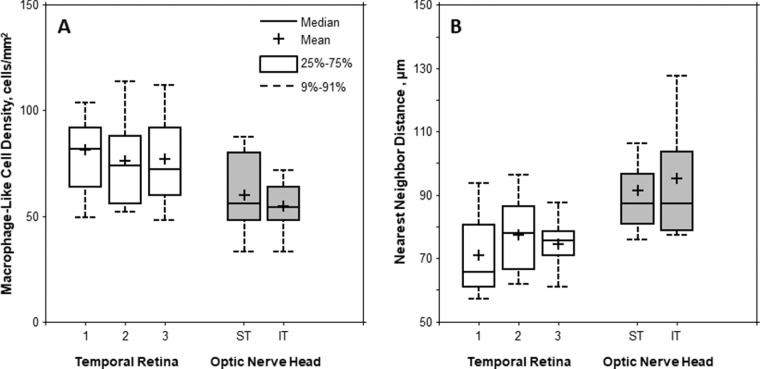
There was considerable variation in macrophage-like cell density and NND across controls. Boxplots of the cell density and NND measured on the temporal retina and ONH are shown in Figure 8. Mean ± SD cell densities measured at the temporal and ONH were 78 ± 23 cells/mm2 (range: 44–156 cells/mm2) and 57 ± 16 cells/mm2 (range: 20–92 cells/mm2), respectively. Similarly, mean ± SD NNDs measured at the temporal and ONH were 74.3 ± 13.3 µm (range: 44.3–108.8 µm) and 93.3 ± 20.0 µm (range: 62.1–164.2 µm), respectively.
Figure 8.
Boxplots of the (A) macrophage-like cell density and (B) NND measured on the temporal retina at three imaging sessions and ONH (superotemporal [ST] and inferotemporal [IT]). Mean macrophage-like cell density was significantly higher in the temporal retina than that of the ONH (P = 0.001, Wilcoxon signed-rank test). However, the mean NND was significantly lower in the temporal retina than that of the ONH (P < 0.001, Wilcoxon signed-rank test).
The mean cell density was significantly higher in the temporal retina than near the ONH (P = 0.001, Wilcoxon signed-rank test). Likewise, the mean NND was significantly lower in the temporal retina than near the ONH (P < 0.001, Wilcoxon signed-rank test; Fig. 8).
For intervisit repeatability, cell density measured at the temporal retina was moderately correlated between the three sessions, with an ICC of 0.77 (95% CI, 0.49–0.90) for the first versus second session and 0.65 (95% CI, 0.28–0.85) for the first versus third session. In contrast, measurement of NND showed low agreement between the three sessions, with an ICC of 0.47 (95% CI, −0.47 to 0.76) for the first versus second session and 0.09 (95% CI, −0.37 to 0.52) for the first versus third session. The within-subject SD (defined as 2.77 times the within-subject standard deviation Sw) was 12.35 cells/mm2 and 10.59 µm for cell density and NND, respectively.
For intergrader reproducibility, there was excellent correlation on cell density and NND measurements obtained at the temporal retina by both graders on baseline scans, with an ICC of 0.98 (95% CI, 0.96–0.99) for cell density measurement and 0.97 (95% CI, 0.92–0.99) for NND measurement. Bland-Altman plots showed no significant bias between graders (mean ± SD difference between graders was −1.11 ± 4.50 cells/mm2 and −1.24 ± 3.30 µm for cell density and NND, respectively).
Discussion
In this study, we present a novel image-processing approach using a clinical OCT device to visualize in vivo human macrophage-like cells located on the ILM surface (Fig. 1). Our findings showed regular spatial separation and morphology of these cells with cell translocation over time in healthy controls (Fig. 5). Their spatial distribution and morphology characteristics suggest the nature of macrophage-like cells such as microglia or hyalocytes.
In vivo visualization of macrophage-like cells within the retina has been reported previously. Liu et al.36 were the first group to image star-shaped cells on the surface of the ILM in living human retina using AO-OCT and hypothesized they were microglia or astrocytes. Following this, two groups imaged the retinal star-shaped cells, one of them on mice using adaptive optics - scanning light ophthalmoscopy (AO-SLO) fluorescence46 and the other with AO-OCT on humans,37 and labeled them as microglia. Histologically, microglia within the healthy retina remain in a dormant state while they actively survey their environment.47–50 In their resting state, they have a quiescent phenotype, characterized by small somata and ramified filodopia-like processes.23,51 The description of dormant microglia matches with the star-shaped cells described by both studies as well as the appearance of the cells revealed within our own images. Additionally, time-lapse confocal microscopy has demonstrated their dynamic behavior as evidenced by the continuous movement of their processes.9 They appear to be in constant motion, extending and retracting with the purpose of surveying their environment.51 The motility of their processes is supported by our own observations of shifts in location and orientation of these macrophage-like cells between images at different time points of the same control subject (Fig. 5). This finding is also consistent with several animal studies that reported microglial motility in the brain and retina.52,53 This cell motility over time could therefore explain the relatively low intervisit repeatability of NND measurements in the current study. Other studies hypothesized that hyperreflective spots seen on a commercial OCT B-scan could be activated microglia, and they were able to find these spots in some of their controls on the ILM.34,54 Two studies that specifically harvested human ILM using surgical procedures demonstrated the presence of cells of glial origin in the surgical specimens using histologic staining.55,56 These studies, conducted on the maculae of diabetics, suggested that the cells were of glial origin, specifically microglia, within this retinal layer. Similarly, when compared to histologic studies, our own findings, which showed wide variation between individuals in cellular density, appeared to closely correspond to data previously reported.30 Additionally, our NND calculations were similar to results reported on mice.9
In healthy adults, retinal microglia are mainly found within the inner retinal layers, including the nerve fiber layer, the ganglion cell layer, and the inner and outer plexiform layers.57–59 In contrast to histologic studies that have been able to visualize these cells at levels below the ILM, we have only able to visualize these star-shaped cells above the ILM surface (Fig. 1D). This may have been due to the reduced contrast between the macrophage-like cells and the neighboring tissue within the retina on our OCT-R images. The inability to visualize these macrophage-like cells within the retina may also suggest the possibility of imaging hyalocytes instead of microglia. Hyalocytes are cells that reside in the vitreous cavity. They localize to the peripheral or cortical regions of the vitreous body, at the base and the posterior hyaloid, lining the inner surface of the retina, close to the ILM.60–62 Hyalocytes have been described by light microscopy as being spindle-shaped, round, or star-shaped cells. Their location and morphology described in previous studies are consistent with the macrophage-like cells we have visualized. Also consistent with our findings, a recent in vivo AO-OCT imaging study showed that ramified macrophage-like cells with cellular motion located right above the ILM surface could be indicative of hyalocytes instead of microglia due to the inability to visualize these cell structures within the human retina.38 Additionally, several studies have reported hyalocytes as exhibiting amoeboid movement and motion of their processes, which is consistent with our findings of cell translocation between imaging sessions.63,64 The role of hyalocytes within vitreoretinal disease has being recently studied, specifically within epiretinal membranes. Kohno et al.65 found that most of the cells located at the center of this membrane are hyalocytes. This is also consistent with the hypothesis that the cells we have imaged are of hyalocyte lineage. Additionally, histologic studies of guinea pig14 and mice eyes10 have reported hyalocytes on the surface of the ILM in densities similar to those we observed.
Both microglia and hyalocytes undergo changes in their morphology and spatial distribution in reaction to intrusions into their environment. Microglia's processes shorten, and their cell bodies change into an amoeboid state with larger cell bodies, as they proliferate and alter their distribution and cluster around lesions.3,8,66 Hyalocytes have also been described as having a bloated appearance in the diseased retina.
In the present study, nonuniform distribution and altered morphology of the macrophage-like cell were seen in eyes of patients with retinopathies (Fig. 6). These cells, which appeared to adhere or aggregate on the surface of both larger and smaller blood vessels, showed reduced cell density in the neighboring area. Unlike healthy controls, this appearance of cell adherence on the superficial large blood vessels and deeper small blood vessels may have been due to RNFL thinning in eyes with retinopathies. RNFL thinning exposes deeper small blood vessels close to the ILM surface, giving the false impression that these cells are located at different axial locations within the retina. In addition, clustered cell structures with plumper appearance were found on the ILM surface in patients, suggesting active translocation of these cells in response to retinal injury. These changes in morphology and behavior within the damaged retina further support our hypothesis that these are macrophage-like cells, either microglia or hyalocytes.6,26,67,68 Further investigation of their behavior in relation to retinal injuries and/or other retinal neurons may provide more insight into their identity.
Our study is limited in several aspects. First, we were unable to visualize these macrophage-like cells on the ILM surface of the macula. This may have been due to the needle-like morphology described for foveal microglia,69 which is beyond the resolution limit of the OCT device used in the current study. Second, due to the noninvasive nature of the imaging approach, we are unable to confirm the exact origin and lineage cells using cell surface markers; we can only hypothesize their identity based upon features described in the literature. Third, even though changes in cell location were observed at different imaging sessions, visualization of continuous cell motility was not possible, and therefore, cells were not trackable across imaging sessions. Fourth, the current study involves a limited sample size and age range, which reduces our ability to apply the results to older populations. Previous literature has pointed to differences in microglial density across age groups.30 Furthermore, the technique requires acquisition of 10 sequential scans to achieve an adequate signal-to-noise ratio, which is not clinically practical, especially for many patients who have difficulty with fixation. Finally, the current method of manual cell identification on amoeboid structures is both time-consuming and fraught with inaccuracy. Perhaps future advances in clinical OCT technology will achieve real-time multiple volume averaging and high-resolution cellular imaging necessary for robust automated cell identification and morphologic analyses.
Conclusion
In summary, we have demonstrated that clinical OCT can be used to image individual macrophage-like cells. These may have the potential to be used as biomarkers of activity of inflammation or other activated states within the retina. Future studies will help with further characterization of these cells for clinical application and better understanding of how their morphology and spatial distribution correlate with various retinal diseases.
Acknowledgments
Supported by the National Eye Institute of the National Institutes of Health under award numbers R01EY027301 and R01EY024969. The content is solely the responsibility of the authors and does not necessarily represent the official views of the National Institutes of Health. Additional funding for this research was provided by the New York Eye and Ear Infirmary Research Foundation, the Marrus Family Foundation, the Geraldine Violett Foundation, the Wise Family Foundation, the Jeremiah Milbank Foundation, and the Jorge N. Buxton Microsurgical Foundation. The sponsors and funding organizations had no role in the design or conduct of this research.
Disclosure: M.V. Castanos, None; D.B. Zhou, None; R.E. Linderman, Optovue (C); R. Allison, None; T. Milman, None; J. Carroll, OptoVue (F), AGTC (F), MeiraGTx (C, F), Translational Imaging Innovations (I); J. Migacz, None; R.B. Rosen, OptoVue (C), Boehringer-Ingelheim (C), Astellas (C), Genentech-Roche (C), NanoRetina (C), OD-OS (C), Opticology (I); Guardion (I), Regeneron (C), Bayer (C); T.Y.P. Chui, None
References
- 1. Zhang C, Lam TT, Tso MO. Heterogeneous populations of microglia/macrophages in the retina and their activation after retinal ischemia and reperfusion injury. Exp Eye Res. 2005; 81: 700–709. [DOI] [PubMed] [Google Scholar]
- 2. Forrester JV, Xu H, Kuffova L, Dick AD, McMenamin PG. Dendritic cell physiology and function in the eye. Immunol Rev. 2010; 234: 282–304. [DOI] [PubMed] [Google Scholar]
- 3. Davalos D, Grutzendler J, Yang G, et al.. ATP mediates rapid microglial response to local brain injury in vivo. Nat Neurosci. 2005; 8: 752–758. [DOI] [PubMed] [Google Scholar]
- 4. Nimmerjahn A, Kirchhoff F, Helmchen F. Resting microglial cells are highly dynamic surveillants of brain parenchyma in vivo. Science. 2005; 308: 1314. [DOI] [PubMed] [Google Scholar]
- 5. Wang X, Zhao L, Zhang J, et al.. Requirement for microglia for the maintenance of synaptic function and integrity in the mature retina. J Neurosci. 2016; 36: 2827. [DOI] [PMC free article] [PubMed] [Google Scholar]
- 6. Li L, Eter N, Heiduschka P. The microglia in healthy and diseased retina. Exp Eye Res. 2015; 136: 116–130. [DOI] [PubMed] [Google Scholar]
- 7. Streit WJ. Microglia as neuroprotective, immunocompetent cells of the CNS. Glia. 2002; 40: 133–139. [DOI] [PubMed] [Google Scholar]
- 8. Provis JM, Diaz CM, Penfold PL. Microglia in human retina: a heterogeneous population with distinct ontogenies. Perspect Dev Neurobiol. 1996; 3: 213–222. [PubMed] [Google Scholar]
- 9. Lee JE, Liang KJ, Fariss RN, Wong WT. Ex vivo dynamic imaging of retinal microglia using time-lapse confocal microscopy. Invest Ophthalmol Vis Sci. 2008; 49: 4169–4176. [DOI] [PMC free article] [PubMed] [Google Scholar]
- 10. Vagaja NN, Chinnery HR, Binz N, et al.. Changes in murine hyalocytes are valuable early indicators of ocular disease. Invest Ophthalmol Vis Sci. 2012; 53: 1445–1451. [DOI] [PubMed] [Google Scholar]
- 11. Balazs EA, Toth LZ, Eckl EA, Mitchell AP. Studies on the structure of the vitreous body: Xii. Cytological and histochemical studies on the cortical tissue layer. Exp Eye Res. 1964; 3: 57–71. [DOI] [PubMed] [Google Scholar]
- 12. Bloom GD, Balazs EA.. An electron microscopic study of hyalocytes. Exp Eye Res. 1965; 4: 249–255. [DOI] [PubMed] [Google Scholar]
- 13. Lazarus HS, Hageman GS.. In situ characterization of the human hyalocyte. Arch Ophthalmol. 1994; 112: 1356–1362. [DOI] [PubMed] [Google Scholar]
- 14. Ogawa K. Scanning electron microscopic study of hyalocytes in the guinea pig eye. Arch Histol Cytol. 2002; 65: 263–268. [DOI] [PubMed] [Google Scholar]
- 15. Gloor BP. Mitotic activity in the cortical vitreous cells (hyalocytes) after photocoagulation. Invest Ophthalmol. 1969; 8: 633–646. [PubMed] [Google Scholar]
- 16. Lazarus HS, Schoenfeld CL, Fekrat S, et al.. Hyalocytes synthesize and secrete inhibitors of retinal pigment epithelial cell proliferation in vitro. Arch Ophthalmol. 1996; 114: 731–736. [DOI] [PubMed] [Google Scholar]
- 17. Lazarus HS, Hageman GS.. In situ characterization of the human hyalocyte. Arch Ophthalmol. 1994; 112: 1356–1362. [DOI] [PubMed] [Google Scholar]
- 18. Uehara M, Imagawa T, Kitagawa H. Morphological studies of the hyalocytes in the chicken eye: Scanning electron microscopy and inflammatory response after the intravitreous injection of carbon particles. J Anat. 1996; 188: 661–669. [PMC free article] [PubMed] [Google Scholar]
- 19. Zhu M, Penfold PL, Madigan MC, Billson FA. Effect of human vitreous and hyalocyte-derived factors on vascular endothelial cell growth. Aust N Z J Ophthalmol. 1997; 25(Suppl 1): S57–S60. [DOI] [PubMed] [Google Scholar]
- 20. Bosco A, Inman DM, Steele MR, et al.. Reduced retina microglial activation and improved optic nerve integrity with minocycline treatment in the dba/2j mouse model of glaucoma. Invest Ophthalmol Vis Sci. 2008; 49: 1437–1446. [DOI] [PubMed] [Google Scholar]
- 21. Neufeld AH. Microglia in the optic nerve head and the region of parapapillary chorioretinal atrophy in glaucoma. Arch Ophthalmol. 1999; 117: 1050–1056. [DOI] [PubMed] [Google Scholar]
- 22. Zeng HY, Green WR, Tso MO. Microglial activation in human diabetic retinopathy. Arch Ophthalmol. 2008; 126: 227–232. [DOI] [PubMed] [Google Scholar]
- 23. Karlstetter M, Scholz R, Rutar M, et al.. Retinal microglia: Just bystander or target for therapy? Prog Retin Eye Res. 2015; 45: 30–57. [DOI] [PubMed] [Google Scholar]
- 24. Heiduschka P, Schnichels S, Fuhrmann N, et al.. Electrophysiological and histologic assessment of retinal ganglion cell fate in a mouse model for opa1-associated autosomal dominant optic atrophy. Invest Ophthalmol Vis Sci. 2010; 51: 1424–1431. [DOI] [PubMed] [Google Scholar]
- 25. Lewis GP, Sethi CS, Carter KM, Charteris DG, Fisher SK. Microglial cell activation following retinal detachment: a comparison between species. Mol Vis. 2005; 11: 491–500. [PubMed] [Google Scholar]
- 26. Gupta N, Brown KE, Milam AH. Activated microglia in human retinitis pigmentosa, late-onset retinal degeneration, and age-related macular degeneration. Exp Eye Res. 2003; 76: 463–471. [DOI] [PubMed] [Google Scholar]
- 27. Gloor BP. Mitotic activity in the cortical vitreous cells (hyalocytes) after photocoagulation. Invest Ophthalmol. 1969; 8: 633–646. [PubMed] [Google Scholar]
- 28. Santos AM, Calvente R, Tassi M, et al.. Embryonic and postnatal development of microglial cells in the mouse retina. J Comp Neurol. 2008; 506: 224–239. [DOI] [PubMed] [Google Scholar]
- 29. Paques M, Simonutti M, Roux MJ, et al.. High resolution fundus imaging by confocal scanning laser ophthalmoscopy in the mouse. Vision Res. 2006; 46: 1336–1345. [DOI] [PubMed] [Google Scholar]
- 30. Singaravelu J, Zhao L, Fariss RN, Nork TM, Wong WT. Microglia in the primate macula: specializations in microglial distribution and morphology with retinal position and with aging. Brain Struct Funct. 2017; 222: 2759–2771. [DOI] [PMC free article] [PubMed] [Google Scholar]
- 31. Eter N, Engel DR, Meyer L, et al.. In vivo visualization of dendritic cells, macrophages, and microglial cells responding to laser-induced damage in the fundus of the eye. Invest Ophthalmol Vis Sci. 2008; 49: 3649–3658. [DOI] [PubMed] [Google Scholar]
- 32. Felberer F, Kroisamer JS, Baumann B, et al.. Adaptive optics slo/oct for 3d imaging of human photoreceptors in vivo. Biomed Opt Express. 2014; 5: 439–456. [DOI] [PMC free article] [PubMed] [Google Scholar]
- 33. Scoles D, Sulai YN, Langlo CS, et al.. In vivo imaging of human cone photoreceptor inner segments. Invest Ophthalmol Vis Sci. 2014; 55: 4244–4251. [DOI] [PMC free article] [PubMed] [Google Scholar]
- 34. Vujosevic S, Bini S, Midena G, et al.. Hyperreflective intraretinal spots in diabetics without and with nonproliferative diabetic retinopathy: an in vivo study using spectral domain oct. J Diabetes Res. 2013; 2013: 491835. [DOI] [PMC free article] [PubMed] [Google Scholar]
- 35. Nassisi M, Fan W, Shi Y, et al.. Quantity of intraretinal hyperreflective foci in patients with intermediate age-related macular degeneration correlates with 1-year progression. Invest Ophthalmol Vis Sci. 2018; 59: 3431–3439. [DOI] [PubMed] [Google Scholar]
- 36. Liu Z, Kurokawa K, Zhang F, Lee JJ, Miller DT. Imaging and quantifying ganglion cells and other transparent neurons in the living human retina. Proc Natl Acad Sci USA. 2017; 114: 12803–12808. [DOI] [PMC free article] [PubMed] [Google Scholar]
- 37. Liu Z, Tam J, Saeedi O, Hammer DX. Trans-retinal cellular imaging with multimodal adaptive optics. Biomedical Optics Express. 2018; 9: 4246–4262. [DOI] [PMC free article] [PubMed] [Google Scholar]
- 38. Kurokawa K, Crowell J, Zhang F, Miller D. Suite of methods for assessing inner retinal temporal dynamics across spatial and temporal scales in the living human eye. Neurophotonics. 2020; 7: 015013. [DOI] [PMC free article] [PubMed] [Google Scholar]
- 39. Michael Heiferman M, Joseph Simonett B, Amani Fawzi M. En face oct imaging in retinal disorders. Retinal Physician. 2015; 12: 45–48, 50. [Google Scholar]
- 40. Jia Y, Tan O, Tokayer J, et al.. Split-spectrum amplitude-decorrelation angiography with optical coherence tomography. Opt Express. 2012; 20: 4710–4725. [DOI] [PMC free article] [PubMed] [Google Scholar]
- 41. Mo S, Phillips E, Krawitz BD, et al.. Visualization of radial peripapillary capillaries using optical coherence tomography angiography: the effect of image averaging. PLoS One. 2017; 12: e0169385. [DOI] [PMC free article] [PubMed] [Google Scholar]
- 42. Lynch G, Romo JSA, Linderman R, et al.. Within-subject assessment of foveal avascular zone enlargement in different stages of diabetic retinopathy using en face OCT reflectance and OCT angiography. Biomed Opt Express. 2018; 9: 5982–5996. [DOI] [PMC free article] [PubMed] [Google Scholar]
- 43. Rueden CT, Schindelin J, Hiner MC, et al.. ImageJ2: ImageJ for the next generation of scientific image data. BMC Bioinformatics. 2017; 18: 529. [DOI] [PMC free article] [PubMed] [Google Scholar]
- 44. Bennett AG, Rudnicka AR, Edgar DF. Improvements on Littmann's method of determining the size of retinal features by fundus photography. Graefes Arch Clin Exp Ophthalmol. 1994; 232: 361–367. [DOI] [PubMed] [Google Scholar]
- 45. Bland JM, Altman DG. Statistics notes: measurement error. BMJ. 1996; 313: 744. [DOI] [PMC free article] [PubMed] [Google Scholar]
- 46. Miller EB, Zhang P, Ching K, Pugh EN, Burns ME. In vivo imaging reveals transient microglia recruitment and functional recovery of photoreceptor signaling after injury. Proc Natl Acad Sci USA. 2019; 116: 16603–16612. [DOI] [PMC free article] [PubMed] [Google Scholar]
- 47. Nolte C, Moller T, Walter T, Kettenmann H. Complement 5a controls motility of murine microglial cells in vitro via activation of an inhibitory G-protein and the rearrangement of the actin cytoskeleton. Neuroscience. 1996; 73: 1091–1107. [DOI] [PubMed] [Google Scholar]
- 48. Stence N, Waite M, Dailey ME. Dynamics of microglial activation: a confocal time-lapse analysis in hippocampal slices. Glia. 2001; 33: 256–266. [PubMed] [Google Scholar]
- 49. Derecki NC, Cronk JC, Kipnis J. The role of microglia in brain maintenance: implications for Rett syndrome. Trends Immunol. 2013; 34: 144–150. [DOI] [PMC free article] [PubMed] [Google Scholar]
- 50. Wang X, Zhao L, Zhang J, et al.. Requirement for microglia for the maintenance of synaptic function and integrity in the mature retina. J Neurosci. 2016; 36: 2827–2842. [DOI] [PMC free article] [PubMed] [Google Scholar]
- 51. Nimmerjahn A, Kirchhoff F, Helmchen F. Resting microglial cells are highly dynamic surveillants of brain parenchyma in vivo. Science. 2005; 308: 1314–1318. [DOI] [PubMed] [Google Scholar]
- 52. Wahl DJ, Ng R, Ju MJ, Jian Y, Sarunic MV. Sensorless adaptive optics multimodal en-face small animal retinal imaging. Biomed Opt Express. 2019; 10: 252–267. [DOI] [PMC free article] [PubMed] [Google Scholar]
- 53. Wake H, Moorhouse AJ, Jinno S, Kohsaka S, Nabekura J. Resting microglia directly monitor the functional state of synapses in vivo and determine the fate of ischemic terminals. J Neurosci. 2009; 29: 3974–3980. [DOI] [PMC free article] [PubMed] [Google Scholar]
- 54. Coscas G, De Benedetto U, Coscas F, et al.. Hyperreflective dots: a new spectral-domain optical coherence tomography entity for follow-up and prognosis in exudative age-related macular degeneration. Ophthalmologica. 2013; 229: 32–37. [DOI] [PubMed] [Google Scholar]
- 55. Schumann RG, Hagenau F, Haritoglou C, et al.. Cells at the vitreoretinal interface in small full-thickness macular holes. Retina. 2015; 35: 1158–1165. [DOI] [PubMed] [Google Scholar]
- 56. Gandorfer A, Scheler R, Schumann R, Haritoglou C, Kampik A. Interference microscopy delineates cellular proliferations on flat mounted internal limiting membrane specimens. Br J Ophthalmol. 2009; 93: 120–122. [DOI] [PubMed] [Google Scholar]
- 57. Altmann C, Schmidt MHH.. The role of microglia in diabetic retinopathy: inflammation, microvasculature defects and neurodegeneration. Int J Mol Sci. 2018; 19: 110. [DOI] [PMC free article] [PubMed] [Google Scholar]
- 58. Hume DA, Perry VH, Gordon S. Immunohistochemical localization of a macrophage-specific antigen in developing mouse retina: phagocytosis of dying neurons and differentiation of microglial cells to form a regular array in the plexiform layers. J Cell Biol. 1983; 97: 253–257. [DOI] [PMC free article] [PubMed] [Google Scholar]
- 59. Santos AM, Martin-Oliva D, Ferrer-Martin RM, et al.. Microglial response to light-induced photoreceptor degeneration in the mouse retina. J Comp Neurol. 2010; 518: 477–492. [DOI] [PubMed] [Google Scholar]
- 60. Szirmai J, Balazs E.. Studies on the structure of the vitreous body: III. Cells in the cortical layer. AMA Arch Ophthalmol. 1958; 59: 34–48. [DOI] [PubMed] [Google Scholar]
- 61. Hamburg A. Some investigations on the cells of the vitreous body. Ophthalmologica. 1959; 138: 81–107. [DOI] [PubMed] [Google Scholar]
- 62. Zhu M, Provis JM, Penfold PL. The human hyaloid system: cellular phenotypes and inter-relationships. Exp Eye Res. 1999; 68: 553–563. [DOI] [PubMed] [Google Scholar]
- 63. Bloom GD, Balazs EA.. An electron microscopic study of hyalocytes. Exp Eye Res. 1965; 4: 249–255. [DOI] [PubMed] [Google Scholar]
- 64. Henis MEG, Ahmed AK, Ibrahim IA, Saleh AM. Light and electron microscopical studies on the hyalocytes of turkey (Meleagris gallopavo). J Adv Vet Res. 2015; 5: 8–13. [Google Scholar]
- 65. Kohno RI, Hata Y, Kawahara S, et al.. Possible contribution of hyalocytes to idiopathic epiretinal membrane formation and its contraction. Br J Ophthalmol. 2009; 93: 1020–1026. [DOI] [PubMed] [Google Scholar]
- 66. Dheen ST, Kaur C, Ling EA. Microglial activation and its implications in the brain diseases. Curr Med Chem. 2007; 14: 1189–1197. [DOI] [PubMed] [Google Scholar]
- 67. Kreutzberg GW. Microglia: a sensor for pathological events in the CNS. Trends Neurosci. 1996; 19: 312–318. [DOI] [PubMed] [Google Scholar]
- 68. Ng TF, Streilein JW.. Light-induced migration of retinal microglia into the subretinal space. Invest Ophthalmol Vis Sci. 2001; 42: 3301–3310. [PubMed] [Google Scholar]
- 69. Singaravelu J, Zhao L, Fariss RN, Nork TM, Wong WT. Microglia in the primate macula: Specializations in microglial distribution and morphology with retinal position and with aging. Brain Struct Funct. 2017; 222: 2759–2771. [DOI] [PMC free article] [PubMed] [Google Scholar]


