

Abstract
Background
Low birth weight (LBW) is associated with a higher risk of end-stage renal disease (ESRD). The relative impacts of absolute birth weight, birth weight in relation to gestational age and preterm birth are, however, uncertain.
Methods
The Medical Birth Registry of Norway has since 1967 recorded data on all births. All patients with ESRD since 1980 have been registered in the Norwegian Renal Registry. Data from these registries were linked. All individuals registered in the Medical Birth Registry were included and the development of ESRD was used as endpoint in Cox regression statistics. LBW and LBW for gestational age [small for gestational age (SGA)] according to the 10th percentiles were used as the main predictor variables.
Results
Of the 2 679 967 included subjects, 1181 developed ESRD. Compared with subjects without LBW, subjects with LBW had an adjusted hazard ratio (aHR) for ESRD of 1.61 (1.38–1.98). SGA had an aHR of 1.44 (1.22– 1.70). Further analyses showed that as compared with subjects who had none of the risk factors LBW, SGA and preterm birth, subjects with one risk factor had an aHR of 1.05 (0.84–1.31), subjects with two risk factors had an aHR of 1.67 (1.40–1.98) and subjects with three risk factors had an aHR of 2.96 (1.84–4.76).
Conclusions
We conclude that LBW was associated with increased risk for ESRD during the first 50 years. Our analyses add to previous knowledge showing that only subjects with at least two of the risk factors LBW, SGA or preterm birth have increased risk.
Keywords: CKD, ESRD, low birth weight, prematurity, small for gestational age
INTRODUCTION
In 1988, Brenner et al. hypothesized that low birth weight (LBW) might predispose for chronic kidney disease (CKD) in adult age through a mechanism of impaired nephron endowment in utero [1]. This hypothesis was later supported by several studies, and measures of LBW have been associated with increased risk of albuminuria, end-stage renal disease (ESRD) and CKD [2]. Recent papers thus argue for screening for kidney disease in subjects with LBW [2–4].
The World Health Organization (WHO) defines LBW as birth weight <2500 g and several studies have confirmed that this is associated with CKD and ESRD [2, 5–7]. Other measures of LBW or preterm birth have also been associated with increased risk, such as birth weight less than the 10th percentile, gestational age <37 weeks and LBW for gestational age [small for gestational age (SGA)] [5, 7–9]. A previous Norwegian study showed that SGA might be more important than LBW in adult patients and that preterm birth might further increase the risk [7]. LBW could on the other hand be more strongly associated with ESRD before 18 years of age due to hereditary or developmental disorders [7, 8]. Based on the existing literature there thus seems to be an important need for further studies of the relative contributions of different markers of LBW as well as a possible gender difference.
The Norwegian studies described above had investigated the association between markers of LBW and risk of ESRD for the first 38–42 years of life [7, 8]. In this study, we have linked the Norwegian registries once more and the new data allowed for follow-up until 50 years of age and a deeper analysis of the relative contributions of LBW, SGA and preterm birth. We also analysed different cut-offs for LBW and SGA as well as possible gender differences. We hypothesized that LBW and SGA would be associated with increased risk of ESRD and that preterm birth and gender modify this risk.
MATERIALS AND METHODS
Since 1967, extensive data on all births in Norway as well as maternal disease and conditions of the newborn have been registered in the Medical Birth Registry of Norway for all births of 16 weeks gestation or more; data were available until the end of 2016. Since 1980, data (including date of onset and cause of ESRD) on all patients developing ESRD (defined as starting chronic dialysis treatment or undergoing renal transplantation) have been registered in the Norwegian Renal Registry; data were available until December 2016. The Norwegian Population Registry has the registered date of death for all inhabitants for the relevant period of time until 31 December 2016.
We included all individuals born alive in Norway between 1967 and 2016. We excluded twins, individuals who died before age 1 year and individuals who died before 1980. Data were recorded in the Medical Birth Registry of Norway and linked with the Norwegian Renal Registry and the Norwegian Population registry using the national identification number (unique for each citizen and used by all administrative and health services—offering a complete and exact linkage).
The study protocol was approved by the regional ethics committee with approval number 2017/627.
Explanatory variables
Birth weight was measured immediately after birth. LBW was defined as birth weight less than the gender-specific 10th percentile (2.94 kg for male and 2.85 kg for female). Preterm birth was defined as gestational age <37 weeks. Based on gender, gestational age and birth weight, z-score of birth weight for gestational age has been calculated for all single births. SGA was defined as birth weight less than the 10th percentile for gestational age using previously published gender-specific reference values in Norway [10].
Maternal preeclampsia was defined as increased blood pressure to >140/90 mmHg and proteinuria after 20 weeks of gestation [11]. We did not have an access to information about the severity or onset of preeclampsia. We defined pregestational maternal disease as maternal diabetes mellitus, kidney disease, rheumatic disease or essential hypertension diagnosed before pregnancy. Malformations in the newborns had been recorded as present if any malformation had been observed before dismissal from the hospital; in the statistical analyses, a dichotomous variable was used.
Outcome variables
The outcome was development of ESRD and onset defined as the date of starting dialysis treatment or undergoing renal transplantation. Subjects with kidney failure who did not receive chronic dialysis treatment or kidney transplantation were not recorded as having an outcome. Subjects who did not develop ESRD were followed until 31 December 2016 or date of death. Causes of ESRD were divided into five categories: glomerular diseases, interstitial diseases, congenital or hereditary disease (congenital kidney or urinary tract malformations, cystic kidney disease and other heritable causes of renal disease), diabetic nephropathy and other causes (hypertensive nephropathy, renal vascular disease, tumours, rare causes and unknown cause).
Statistical analyses
Data were analysed in a cohort design with birth-related variables for the subject as exposure variables and ESRD as the outcome variable. Hazard ratio (HR) estimates were obtained by Cox regression statistics, start of follow-up was set at the date of birth. Participants with missing data were not included in the statistical analyses. Birth weight was missing for 0.09% of included participants and gestational age was missing for 4.3%. Adjusted analyses were performed for the main analyses by including birth year, gender (male versus female), maternal disease (yes versus no), maternal preeclampsia (yes versus no), maternal marital status (single versus non-single) and malformations in the newborn (yes versus no) in the statistical analyses. Risks after 18 years of age were analysed separately. Analyses using different gender-specific cut-offs for birth weight and z-score and gender stratified analyses were performed.
Because no cases with ESRD had been registered between 1967 and 1979, subjects born in this period were left truncated in the survival analyses before January 1980. Consequently, the counting process formulation of proportional hazards (Cox regression) was applied. This method does not include index subjects in the analysis until an event could be registered, i.e. a subject born in 1973 would be included in the analyses at 7 years of age and right censored at age 43 years if he/she did not develop ESRD or died.
If not otherwise stated, values are reported as means (SD), or HR estimates with 95% confidence intervals (CIs) are given; P < 0.05 was considered statistically significant and all tests were two-tailed. The analyses were performed using the STATA SE Edition 15.1 statistical package (StataCorp).
RESULTS
Study participants
A total of 2 679 967 individuals were included in this study and 1181 of these developed ESRD during follow-up at a mean age of 27.9 ± 11.5 years. The mean age at ESRD was 26.5 ± 13.0 years for LBW and 27.5 ± 11.9 years for SGA. Characteristics of included individuals are shown in Table 1. In Supplementary data, Table S1, we have shown characteristics according to birth weight percentile. Individuals who later developed ESRD more often had LBW (16.1% versus 10%), SGA (15.5% versus 10%) or preterm birth (7.3% versus 4.8%) as compared with individuals who did not develop ESRD (Supplementary data, Table S2).
Table 1.
Characteristics of participants
| Characteristic | LBW (<10th percentile) |
SGA (<10th percentile) |
||
|---|---|---|---|---|
| No | Yes | No | Yes | |
| Total number | 2 408 569 | 270 217 | 2 306 286 | 257 156 |
| Number with ESRD | 990 | 191 | 932 | 183 |
| Number with ESRD per 1 000 000 participants follow-up year | 17.0 | 29.89 | 16.27 | 25.96 |
| Mean ± SD duration follow-up, years | 25.26 ± 14.35 | 25.61 ± 14.50* | 24.84 ± 14.48 | 27.41 ± 14.5* |
| Mean ± SD age at ESRD, years | 28.29 ± 11.17 | 26.53 ± 13.0 | 28.08 ± 11.39 | 27.57 ± 11.92 |
| Mean ± SD parity | 0.95 ± 1.07 | 0.78 ± 1.07* | 0.96 ± 1.07 | 0.72 ± 1.01* |
| Mean ± SD birth weight, g | 3656 ± 435 | 2517 ± 421* | 3626 ± 490 | 2729 ± 379* |
| Mean ± SD z-score | 0.136 ± 1.21 | −1.38 ± 1.16* | 0.18 ± 0.2 | −1.8 ± 0.46* |
| Mean ± SD gestational age, weeks | 39.94 ± 1.57 | 37.29 ± 3.13* | 39.69 ± 1.93 | 39.53 ± 2.1* |
| Preterm birth (%) | 1.78 | 3.1* | 4.63 | 6.42* |
| Apgar score 5 min <7 (%) | 0.75 | 2.89* | 0.9 | 1.65* |
| Maternal preeclampsia (%) | 2.21 | 8.87* | 2.47 | 6.52* |
| Maternal diseasea (%) | 2.32 | 3.31* | 2.37 | 2.74* |
| Congenital malformations (%) | 2.86 | 4.67* | 2.99 | 3.78 |
| Congenital malformations of kidney or urinary tract (%) | 0.10 | 0.15* | 0.10 | 0.12 |
Maternal disease defines as pregestational diabetes mellitus, kidney or urinary tract disease, rheumatic disease or essential hypertension.
P < 0.001.
Risk associated with birth-related variables
At ages 10, 20, 30, 40 and 50 years, 0.0037, 0.014, 0.040, 0.083 and 0.14%, respectively, of included individuals had developed ESRD. Compared with individuals with birth weight above the 10th percentile, LBW was associated with an increased HR of 1.68 (1.44–1.97) for development of ESRD (Table 2). Corresponding HRs for individuals with SGA was 1.49 (1.27–1.75), for preterm birth 1.65 (1.31–2.07), for birth weight < 2.5 kg 2.0 (1.59–2.56) and for maternal preeclampsia HR was 1.53 (1.12–2.08). Results were largely the same in males and females, except for preterm birth, which was not significantly associated with ESRD in females.
Table 2.
HR for ESRD according to birth-related variables
| Risk marker | Unadjusted | Adjusteda |
||||||||||
|---|---|---|---|---|---|---|---|---|---|---|---|---|
| All |
All |
Men |
Women |
|||||||||
| n | HR (95% CI) | P-value | HR (95% CI) | P-value | n | HR (95% CI) | P-value | n | HR (95% CI) | P-value | ||
| Birth weight <10th percentile | No | 981 | 1.0 (ref) | 1.0 (ref) | 628 | 1.0 (ref) | 353 | 1.0 (ref) | ||||
| Yes | 191 | 1.68 (1.44–1.97) | <0.001 | 1.61 (1.38–1.88) | <0.001 | 118 | 1.55 (1.27–1.89) | <0.001 | 73 | 1.71 (1.33–2.27) | <0.001 | |
| Z-score <10th percentile | No | 932 | 1.0 (ref) | 1.0 (ref) | 592 | 1.0 (ref) | 330 | 1.0 (ref) | ||||
| Yes | 183 | 1.49 (1.27–1.75) | <0.001 | 1.44 (1.23–1.69) | <0.001 | 116 | 1.46 (1.19–1.79) | <0.001 | 67 | 1.40 (1.07–1.82) | 0.013 | |
| Preterm birth | No | 1100 | 1.0 (ref) | 1.0 (ref) | 698 | 1.0 (ref) | 405 | 1.0 (ref) | ||||
| Yes | 81 | 1.65 (1.31–2.07) | <0.001 | 1.54 (1.22–1.92) | <0.001 | 58 | 1.64 (1.25–2.15) | <0.001 | 23 | 1.32 (0.86–2.01) | 0.2 | |
| Birth weight <2.5 kg | No | 1109 | 1.0 (ref) | 1.0 (ref) | 710 | 1.0 (ref) | 399 | 1.0 (ref) | ||||
| Yes | 72 | 2.0 (1.59–2.56) | <0.001 | 1.91 (1.50–2.43) | <0.001 | 43 | 1.86 (1.36–2.54) | <0.001 | 29 | 1.98 (1.35–2.90) | <0.001 | |
| Maternal preeclampsia | No | 1139 | 1.0 (ref) | 1.0 (ref) | 725 | 1.0 (ref) | 414 | 1.0 (ref) | ||||
| Yes | 42 | 1.53 (1.12–2.08) | 0.006 | 1.48 (1.09–2.02) | 0.012 | 28 | 1.52 (1.04–2.22) | 0.029 | 14 | 1.41 (0.82–2.41) | 0.203 | |
Adjusted for birth year, gender, maternal disease (defines as maternal diabetes mellitus, kidney disease, rheumatic disease or essential hypertension diagnosed before pregnancy), maternal preeclampsia, maternal marital status and malformations in the newborn.
In Table 2, we observed higher HR for LBW if defined by birth weight <2.5 kg as compared with LBW defined by <10th percentile (2.94 kg for males and 2.85 kg for females). We therefore decided to investigate possible dose–response relationships for LBW and LBW for gestation age. In these analyses, we categorized birth weight and birth weight for gestational age according to gender-specific percentiles and the following groups were analysed: below 5th percentile, 5–10th, 10–20th, 20–80th (reference), 80–90th, 90–95th and above the 95th percentile cut-offs. Dose–response relationships were observed both for LBW and birth weight for gestational age with higher risks for lower birth weights and non-significant trends for lower risk in the 90–95th percentile groups (Table 3). There was, however, a difference as the 5–10th percentile groups were only significant for LBW (P = 0.001) and not for birth weight for gestational age (P = 0.1). When these analyses were stratified for gender, we observed that the risk of ESRD was increased at the 5–10th percentile both for men and for women in LBW (P = 0.001 and 0.045, respectively). When these analyses were stratified by maternal preeclampsia, we observed that maternal preeclampsia did not impact this risk.
Table 3.
Risk of ESRD for different percentile cut-offs for birth weight and birth weight for gestational age, separate analyses stratified for gender
| Risk marker | All |
Men |
Women |
|||||
|---|---|---|---|---|---|---|---|---|
| Total, n | ESRD, n | HR (95% CI) | P-value | HR (95% CI) | P-value | HR (95% CI) | P-value | |
| Birth weight | ||||||||
| <5th percentile | 135 599 | 105 | 1.89 (1.53–2.32) | <0.001 | 1.84 (1.38–2.36) | <0.001 | 2.04 (1.47–2.83) | <0.001 |
| 5–10th percentile | 134 809 | 86 | 1.48 (1.18–1.85) | 0.001 | 1.48 (1.12–1.96) | 0.006 | 1.46 (1.00–2.13) | 0.045 |
| 10–20th percentile | 270 389 | 130 | 1.10 (0.91–1.33) | 0.3 | 1.24 (0.98–1.55) | 0.047 | 0.86 (0.61–1.22) | 0.4 |
| 20–80th percentile | 1 615 278 | 667 | 1.0 (ref) | 1.0 (ref) | 1.0 (ref) | |||
| 80–90th percentile | 258 169 | 97 | 0.97 (0.78–1.20) | 0.8 | 0.98 (0.75–1.28) | 0.9 | 0.94 (0.66–1.35) | 0.8 |
| 90–95th percentile | 129 163 | 39 | 0.80 (0.58–1.10) | 0.2 | 0.89 (0.61–1.31) | 0.6 | 0.62 (0.34–1.13) | 0.1 |
| >95th percentile | 132 049 | 48 | 0.98 (0.73–1.32) | 0.9 | 0.79 (0.52–1.20) | 0.3 | 1.29 (0.84–1.98) | 0.2 |
| Birth weight for gestational age (z-score) | ||||||||
| <5th percentile | 129 628 | 111 | 1.74 (1.42–2.12) | <0.001 | 1.68 (1.30–2.18) | <0.001 | 1.84 (1.33–2.54) | <0.001 |
| 5–10th percentile | 127 528 | 72 | 1.20 (0.94–1.54) | 0.1 | 1.33 (1.00–1.82) | 0.06 | 1.00 (0.65–1.55) | 0.9 |
| 10–20th percentile | 261 890 | 121 | 1.03 (0.85–1.26) | 0.7 | 1.06 (0.83–1.36) | 0.6 | 1.02 (0.74–1.40) | 0.9 |
| 20–80th percentile | 1 534 279 | 624 | 1.0 (ref) | 1.0 (ref) | 1.0 (ref) | |||
| 80–90th percentile | 256 637 | 95 | 0.96 (0.77–1.19) | 0.7 | 1.03 (0.80–1.34) | 0.9 | 0.83 (0.57–1.23) | 0.4 |
| 90–95th percentile | 12 140 | 36 | 0.75 (0.54–1.06) | 0.1 | 0.80 (0.53–1.20) | 0.3 | 0.68 (0.38–1.22) | 0.2 |
| >95th percentile | 126 340 | 56 | 1.16 (0.88–1.53) | 0.3 | 1.05(0.73–1.50) | 0.8 | 1.34 (0.87–2.06) | 0.2 |
Risks associated with combinations of LBW, SGA and preterm birth
To further analyse the different effects of LBW, SGA and preterm birth, we investigated how combinations of these variables associated with risk of ESRD. Compared with individuals who had been born at term without LBW and SGA, having been born at term with SGA and LBW [adjusted HR (aHR) = 1.71 (1.41–2.09)], having been born preterm with LBW but without SGA [aHR = 1.54 = (1.11–2.13)] and having been born preterm with LBW and SGA [aHR = 2.96 (1.84–4.76)] were associated with increased risk of ESRD (Table 4). Based on these results, we chose to perform an analysis in which we counted the risk markers (LBW, SGA and preterm birth). Compared with individuals with zero risk markers, individuals with one risk marker did not have increased risk of ESRD [aHR = 1.05 (0.84–1.31)], individuals with two risk markers had an increased risk with aHR = 1.67 (1.40–1.98) and individuals with three risk markers had an increased risk with aHR = 2.96 (1.84–4.76). Figure 1 illustrates the same finding but also illustrates that the groups separate in adult age.
Table 4.
HR for ESRD according to whether the individuals had LBW, SGA or were born preterm
| Risk marker | Total follow-up period |
Age 18–50 years |
||||||
|---|---|---|---|---|---|---|---|---|
| Total, n | ESRD, n | aHRa (95% CI) | P-value | Total, n | ESRD, n | aHRa (95% CI) | P-value | |
| Term, not SGA or LBW | 2 162 166 | 851 | 1.0 (ref) | 1 348 384 | 689 | 1.0 (ref) | ||
| Term, SGA, not LBW | 100 971 | 52 | 1.01 (0.76–1.34) | 0.9 | 74 138 | 44 | 1.03 (0.76–1.40) | 0.8 |
| Term, not SGA, LBW | 34 160 | 11 | 0.89 (0.50–1.61) | 0.7 | 18 793 | 6 | 0.60 (0.27–1.34) | 0.3 |
| Term, SGA and LBW | 139 520 | 113 | 1.71 (1.41–2.09) | <0.001 | 96 560 | 87 | 1.56 (1.24–1.96) | <0.001 |
| Preterm, not SGA or LBW | 40 909 | 23 | 1.26 (0.83–1.91) | 0.3 | 28 252 | 18 | 1.20 (0.76–1.93) | 0.3 |
| Preterm, SGA, not LBW | No data | No data | No data | |||||
| Preterm, not SGA, LBW | 65 631 | 38 | 1.54 (1.11–2.13) | 0.009 | 37 335 | 28 | 1.41 (0.97–2.06) | 0.07 |
| Preterm, SGA and LBW | 16 482 | 18 | 2.96 (1.84–4.76) | <0.001 | 9624 | 12 | 2.44 (1.36–4.35) | 0.003 |
| Number of risk factorsb | ||||||||
| 0 | 2 162 166 | 851 | 1.0 (ref) | 1 348 384 | 689 | 1.0 (ref) | ||
| 1 | 176 040 | 86 | 1.05 (0.84–1.31) | 0.7 | 121 183 | 68 | 1.00 (0.78–1.29) | 0.9 |
| 2 | 205 151 | 151 | 1.67 (1.40–1.98) | <0.001 | 133 895 | 115 | 1.52 (1.25–1.85) | <0.001 |
| 3 | 16 482 | 18 | 2.96 (1.84–.76) | <0.001 | 9624 | 12 | 2.44 (1.37–4.34) | 0.003 |
Adjusted for birth year, gender, maternal disease (defines as maternal diabetes mellitus, kidney disease, rheumatic disease or essential hypertension diagnosed before pregnancy), maternal preeclampsia, maternal marital status and malformations in the newborn.
Number of the risk factors LBW (defined by <10th percentile), SGA (defined by <10th percentile) and preterm birth (<37 weeks).
FIGURE 1.
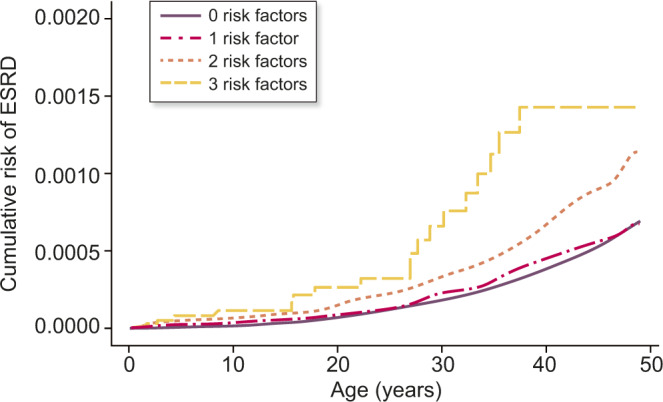
Risk of ESRD according to number of birth-related risk factors (birth weight <10th percentile, birth weight for gestational age <10th percentile and preterm birth).
Risk factors for ESRD due to different causes
Among the 1181 individuals who developed ESRD, 486 developed ESRD as a result of glomerular disease, 113 as a result of interstitial disease, 303 as a result of congenital or inherited disease, 187 as a result of diabetic nephropathy and 144 due to other causes. Corresponding numbers for individuals who developed ESRD after 18 years of age were 406, 96, 172, 157 and 129. Table 5 shows risk for specific causes of ESRD according to the three different main risk markers: LBW, SGA and preterm birth.
Table 5.
HR for different causes of ESRD according to birth characteristics
| Risk marker | Glomerular disease |
Interstitial disease |
Hereditary/ developmental disease |
Diabetic nephropathy |
Other renal diseases |
||||||
|---|---|---|---|---|---|---|---|---|---|---|---|
| n | HR (95% CI) | n | HR (95% CI) | n | HR (95% CI) | n | HR (95% CI) | n | HR (95% CI) | ||
| Birth weight <10th percentile | No | 421 | 1.0 (ref) | 95 | 1.0 (ref) | 239 | 1.0 (ref) | 159 | 1.0 (ref) | 113 | 1.0 (ref) |
| Yes | 65 | 1.33 (1.03–1.74) | 15 | 1.36 (0.80–2.35) | 61 | 2.26 (1.70–3.00) | 28 | 1.50 (1.00–2.25) | 28 | 2.12 (1.40–3.21) | |
| Z-score <10th percentile | No | 385 | 1.0 (ref) | 90 | 1.0 (ref) | 234 | 1.0 (ref) | 148 | 1.0 (ref) | 116 | 1.0 (ref) |
| Yes | 79 | 1.56 (1.23–1.99) | 15 | 1.26 (0.73–2.18) | 51 | 1.70 (1.25–2.31) | 27 | 1.32 (0.88–1.99) | 22 | 1.41 (0.89–2.31) | |
| Preterm birth | No | 466 | 1.0 (ref) | 107 | 1.0 (ref) | 274 | 1.0 (ref) | 173 | 1.0 (ref) | 132 | 1.0 (ref) |
| Yes | 20 | 0.96 (0.61–1.50) | 6 | 1.25 (0.55–2.83) | 29 | 2.32 (1.60–3.41) | 14 | 1.82 (1.06–3.14) | 12 | 2.04 (1.13–3.70) | |
For individuals with ESRD due to hereditary or developmental disease, age at ESRD was lower for subjects with LBW as compared with subjects with normal birth weight (19.2 versus 24.0 years; P = 0.01). For other causes of ESRD, age at ESRD was similar, i.e. 26.7 versus 27.6 years (P = 0.5) for glomerular disease, 29.8 versus 28.6 years (P = 0.7) for interstitial disease, 36.0 versus 36.8 years (P = 0.6) for diabetic nephropathy and 34.1 versus 31.8 years (P = 0.3) for other kidney disease.
We observed the strongest risk estimates for ESRD due to hereditary or developmental diseases, but risks were otherwise similarly associated with the different causes of ESRD. There is a possibility that congenital urinary tract malformations and hereditary renal disease might be a cause of low weight. We therefore decided to repeat the main analyses in Table 4 using ESRD due to other causes than hereditary or congenital disease as the outcome variable. In these analyses, we observed almost identical HRs as we did in the analyses of the adult age group 18–50 years (right part of Table 4), i.e. slightly lower risk estimates than for all-cause ESRD.
DISCUSSION
This study showed that LBW was associated with a 70% increased risk and SGA was associated with a 50% increased risk for development of ESRD during the first 50 years of life. Some previous studies have observed that males are more affected by LBW than females [2, 6, 9, 12], but we observed no gender difference in our study. The most novel finding was, however, that none of the risk markers LBW, SGA or preterm birth was associated with risk of ESRD if present alone; at least two of the risk markers needed to be present in order to see an increased risk. This importantly narrows the cohort with increased risk that might need further follow-up. As the number of individuals with ESRD has doubled since the last Norwegian studies [7, 8], this study offers more certain analyses of gender differences, combination of risk markers and different cut-offs for LBW and SGA.
Our study supports previous studies [2, 4, 9, 13, 14] that there is a significant association between markers of intrauterine growth such as LBW, SGA and prematurity and later development of ESRD in adult age. The risk was increased for all causes of ESRD and this supports the Brenner hypothesis that impaired nephron endowment with lower glomerular number and compensatory larger glomeruli lead to increased risk of progression in any kidney disease [1, 25, 26, 28]. The plausible mechanisms of impaired nephron endowment, and thus which risk marker is more important, has been discussed in several studies [7, 9, 15, 16, 27]. Eriksson et al. reported that LBW and prematurity were associated with CKD in older people [9] and recently Crump et al. showed that prematurity was an important risk marker for CKD before the age of 20 years, but that there did not seem to be an increased risk after the age of 20 years [27]. The relative importance of the different risk markers thus seems to change with age. LBW is the most accessible and used marker of adverse intrauterine environment and it results from either intrauterine growth restriction or preterm birth [5]. Intrauterine growth restriction is measured in our study as birth weight for gestational age, but could also be measured during pregnancy by clinical examination or ultrasonography. Our study confirms the findings of previous studies that LBW, SGA and preterm birth are associated with increased risk for kidney disease in adult age [7, 8], and all risk markers seemed to be important. Previous studies have shown that combination of these risk markers increases risk further [17]. We found the same in this study, but we also showed that participants who only had one of the risk markers LBW, SGA or preterm birth did not have an increased risk. This has never been shown before and should be investigated further. Studies have argued that all subjects with either LBW, SGA or preterm birth should have some sort of follow-up to detect early kidney disease [3, 18], which according to our study would constitute 15.6% of the population (Table 4). Importantly, this could be reduced to 8.6% by including only subjects with at least two of the risk markers. More studies are needed to investigate this association in other populations and to address the potential cost versus benefit of such follow-up. As most developing countries define low birth weight <2.5 kg and often have imprecise data for gestational age and SGA, our results should be used with caution in such settings. It should also be mentioned that our data only discuss risk of severe kidney disease and that screening for cardiovascular risk factors such as hypertension and diabetes mellitus might be beneficial also in individuals with only one risk marker.
There seems to be a dose–response relationship between the severity of preterm birth, LBW or SGA and risk of kidney disease in adult age. In our main analyses, we have defined LBW and SGA as less than the 10th percentile in order to have sufficient numbers of outcomes in subgroups. In both this and previous studies, we have however shown that using the WHO cut-off of 2.5 kg yielded higher risk estimates [19]. In this study, we explored the association between different cut-offs for LBW and SGA and risk of developing ESRD; further more, we also investigated possible gender differences that have been suggested by other studies [6, 12]. For both LBW and SGA, HRs increased with lower cut-offs and was statistically significant at lower than the 10th percentile for LBW but only for less than the 5th percentile for SGA. Overall, these analyses supported the use of the 10th percentile cut-off for LBW but one could argue that the 5th percentile should be used for SGA. As all previous studies investigating SGA have used the 10th percentile [7, 20–22], we have decided to do the same. Use of the 10th percentile for LBW in Norway defined all newborns with a birth weight of <2.8–2.9 kg as LBW. Our study cannot answer whether this cut-off, the WHO cut-off of 2.5 kg or the national 10th percentile should be used to identify newborns at risk in other populations. A major challenge is selection of an appropriate global reference [20]. LBW could be a marker of intrauterine growth restriction, but in an international context it could also include newborns who are small due to genetic factors, maternal smoking or maternal undernutrition. Prevalence of offspring with birth weight <2.5 kg is for example very high in South Asia, but it is unknown whether these data represent true growth restriction or normal development of smaller offspring [14]. At the same time, using the 10th percentile cut-off might be problematic in populations affected by undernutrition, in which the cut-off should preferably be defined in sub-populations without undernutrition.
The major strength of our study is the opportunity to use the national registries to include a large number of participants with prospective registration of birth-related variables and near-complete follow-up. Compared with a previous Norwegian study from 2016 [8], we have in this study a much larger number of included subjects. This was mostly due to follow-up until 2016 (versus 2009) and inclusion of the whole population (versus only those with at least one sibling). One limitation is that ESRD was not registered between 1967 and 1980, and the counting processes of Cox regression were therefore used for statistical analyses and likely compensated this limitation. The study population is mostly Caucasian so results might be different in other populations groups. Another limitation is that ESRD is a rare endpoint, and even though we included 2.7 million participants, only 1181 developed ESRD. This is, however, twice the number as compared with our previous studies [7, 8]. Potential confounders could be low socio-economic status, smoking, educational level and ethnic origin. We did not have access to these data in our study but we were able to adjust for single versus non-single mother, which is a socio-economic marker. A weakness is also that we had no information on diseases diagnosed after the prenatal period and could therefore not adjust for diseases developed in adulthood.
In conclusion, we have shown that markers of LBW are associated with development of ESRD during the first 50 years of life. Our study also showed that the risk markers LBW, SGA and preterm birth may not be associated with development of ESRD if present alone. Furthermore, our study investigated cut-offs for LBW and SGA and suggested that using the 10th percentile could be the best, but it is still uncertain which cut-offs are the best in other populations. We suggest that our results should be investigated further in other populations and preferably also using lower CKD stages as outcomes. Early detection of individuals with high risk of kidney disease would allow for early intervention to delay disease progression and the most clinically relevant might be screening for hypertension, diabetes mellitus and proteinuria [3, 23, 24]. Our study indicates that this might be beneficial in persons with at least two of the risk factors LBW, SGA or preterm birth.
FUNDING
This study is supported by grants from Helse-Fonna and from the Western Norway Regional Health authority funds. These supporters played no part in development or approval of the manuscript.
CONFLICT OF INTEREST STATEMENT
None of the authors have any conflicts of interest regarding this study. Results presented in this article have not been published previously in whole or part, except in abstract format.
(See related article by Terstappen and Lely. Long-term renal disease after prematurity or fetal growth restriction: who is at risk? Nephrol Dial Transplant 2020; 35: 1087--1090)
Supplementary Material
REFERENCES
- 1. Brenner BM, Garcia DL, Anderson S.. Glomeruli and blood pressure. Less of one, more the other? Am J Hypertens 1988; 1: 335–347 [DOI] [PubMed] [Google Scholar]
- 2. White SL, Perkovic V, Cass A. et al. Is low birth weight an antecedent of CKD in later life? A systematic review of observational studies. Am J Kidney Dis 2009; 54: 248–261 [DOI] [PubMed] [Google Scholar]
- 3. Luyckx VA, Perico N, Somaschini M. et al. A developmental approach to the prevention of hypertension and kidney disease: a report from the low birth weight and nephron number working group. Lancet 2017; 390: 424–428 [DOI] [PMC free article] [PubMed] [Google Scholar]
- 4. Bacchetta J, Harambat J, Dubourg L. et al. Both extrauterine and intrauterine growth restriction impair renal function in children born very preterm. Kidney Int 2009; 76: 445–452 [DOI] [PubMed] [Google Scholar]
- 5. Luyckx VA, Brenner BM.. The clinical importance of nephron mass. J Am Soc Nephrol 2010; 21: 898–910 [DOI] [PubMed] [Google Scholar]
- 6. Li S, Chen SC, Shlipak M. et al. Low birth weight is associated with chronic kidney disease only in men. Kidney Int 2008; 73: 637–642 [DOI] [PubMed] [Google Scholar]
- 7. Vikse BE, Irgens LM, Leivestad T. et al. Low birth weight increases risk for end-stage renal disease. J Am Soc Nephrol 2008; 19: 151–157 [DOI] [PMC free article] [PubMed] [Google Scholar]
- 8. Ruggajo P, Skrunes R, Svarstad E. et al. Familial factors, low birth weight, and development of ESRD: a nationwide registry study. Am J Kidney Dis 2016; 67: 601–608 [DOI] [PubMed] [Google Scholar]
- 9. Eriksson JG, Salonen MK, Kajantie E. et al. Prenatal growth and CKD in older adults: longitudinal findings from the Helsinki birth cohort study, 1924–1944. Am J Kidney Dis 2018; 71: 20–26 [DOI] [PubMed] [Google Scholar]
- 10. Skjærven R, Gjessing HK, Bakketeig LS.. Birthweight by gestational age in Norway. Acta Obstet Gynecol Scand 2000; 79: 440–449 [PubMed] [Google Scholar]
- 11. Vikse BE, Irgens LM, Leivestad T. et al. Preeclampsia and the risk of end-stage renal disease. N Engl J Med 2008; 359: 800–809 [DOI] [PubMed] [Google Scholar]
- 12. Hallan S, Euser AM, Irgens LM. et al. Effect of intrauterine growth restriction on kidney function at young adult age: the Nord Trondelag Health (HUNT 2) Study. Am J Kidney Dis 2008; 51: 10–20 [DOI] [PubMed] [Google Scholar]
- 13. Rodriguez MM, Gomez AH, Abitbol CL. et al. Histomorphometric analysis of postnatal glomerulogenesis in extremely preterm infants. Pediatr Dev Pathol 2004; 7: 17–25 [DOI] [PubMed] [Google Scholar]
- 14. Luyckx VA, Brenner BM.. Birth weight, malnutrition and kidney-associated outcomes–a global concern. Nat Rev Nephrol 2015; 11: 135–149 [DOI] [PubMed] [Google Scholar]
- 15. Luyckx VA, Bertram JF, Brenner BM. et al. Effect of fetal and child health on kidney development and long-term risk of hypertension and kidney disease. Lancet 2013; 382: 273–283 [DOI] [PubMed] [Google Scholar]
- 16. Barker DJ, Gluckman PD, Godfrey KM. et al. Fetal nutrition and cardiovascular disease in adult life. Lancet 1993; 341: 938–941 [DOI] [PubMed] [Google Scholar]
- 17. Schreuder MF, Wilhelm AJ, Bokenkamp A. et al. Impact of gestational age and birth weight on amikacin clearance on day 1 of life. Clin J Am Soc Nephrol 2009; 4: 1774–1778 [DOI] [PMC free article] [PubMed] [Google Scholar]
- 18. Keijzer-Veen MG, Dulger A, Dekker FW. et al. Very preterm birth is a risk factor for increased systolic blood pressure at a young adult age. Pediatr Nephrol 2010; 25: 509–516 [DOI] [PMC free article] [PubMed] [Google Scholar]
- 19. Selewski DT, Charlton JR, Jetton JG. et al. Neonatal acute kidney injury. Pediatrics 2015; 136: e463–473 [DOI] [PubMed] [Google Scholar]
- 20. Lee AC, Katz J, Blencowe H. et al. National and regional estimates of term and preterm babies born small for gestational age in 138 low-income and middle-income countries in 2010. Lancet Glob Health 2013; 1: e26–36 [DOI] [PMC free article] [PubMed] [Google Scholar]
- 21. Mikolajczyk RT, Zhang J, Betran AP. et al. A global reference for fetal-weight and birthweight percentiles. Lancet 2011; 377: 1855–1861 [DOI] [PubMed] [Google Scholar]
- 22. Beck S, Wojdyla D, Say L. et al. The worldwide incidence of preterm birth: a systematic review of maternal mortality and morbidity. Bull World Health Org 2010; 88: 31–38 [DOI] [PMC free article] [PubMed] [Google Scholar]
- 23. Kristensen JH, Basit S, Wohlfahrt J. et al. Pre-eclampsia and risk of later kidney disease: nationwide cohort study. BMJ 2019; 365: l1516. [DOI] [PMC free article] [PubMed] [Google Scholar]
- 24. Hommel K, Madsen M, Kamper AL.. The importance of early referral for the treatment of chronic kidney disease: a Danish nationwide cohort study. BMC Nephrol 2012; 13: 108. [DOI] [PMC free article] [PubMed] [Google Scholar]
- 25. Ruggajo P, Leh S, Svarstad E. et al. Low birth weight associates with glomerular area in young male IgA nephropathy patients. BMC Nephrol 2018; 19: 287. [DOI] [PMC free article] [PubMed] [Google Scholar]
- 26. Hoy WE, Samuel T, Mott SA. et al. Renal biopsy findings among Indigenous Australians: a nationwide review. Kidney Int 2012; 82: 1321–1331 [DOI] [PubMed] [Google Scholar]
- 27. Crump C, Sundquist J, Winkleby MA. et al. Preterm birth and risk of chronic kidney disease from childhood into mid-adulthood: national cohort study. BMJ 2019; 365: l1346. [DOI] [PMC free article] [PubMed] [Google Scholar]
- 28. Ruggajo P, Svarstad E, Leh S. et al. Low birth weight and risk of progression to end stage renal disease in IgA nephropathy–A retrospective registry-based cohort study. PLoS One 2016; 11: e0153819. [DOI] [PMC free article] [PubMed] [Google Scholar]
Associated Data
This section collects any data citations, data availability statements, or supplementary materials included in this article.