

Abstract
Background:
Neurofilament light (NfL) is a promising biomarker of active axonal injury and neuronal degeneration. We aimed to characterize cross-sectional and longitudinal plasma NfL measurements and estimated ages of biomarker onset in an exceptionally large number of presenilin (PSEN1) E280A mutation carriers and age-matched non-carriers, 8–75 years of age, from the world’s largest autosomal dominant Alzheimer’s disease kindred.
Methods:
Between August 1998 and December 2018, members of the familial Alzheimer’s disease Colombian kindred were recruited from the Alzheimer’s Prevention Registry at the University of Antioquia, Medellín, Colombia. In this cohort study we used a single molecule array immunoassay and log-transformed data to examine the relationship between plasma NfL levels and age, and determine the earliest age at which NfL separates between mutation carriers and non-carriers.
Results:
We included a cohort of 1,070 PSEN1 E280A mutation carriers and 1,074 non-carriers with baseline assessments and 242 mutation carriers and 262 non-carriers with longitudinal (6 ±3 years) measures, ranging in age from 8 to 75 years. Plasma NfL measurements increased with age in both groups (p<0.01), and began to differentiate carriers from non-carriers at age 22 (22 years before the estimated median age at mild cognitive impairment [MCI] onset of 44), though the ability of plasma NfL to discriminate between carriers and non-carriers only reached high sensitivity close to the age of clinical onset.
Interpretation:
Our findings support the promise of plasma NfL as a biomarker of active neurodegeneration in the detection and tracking of Alzheimer’s disease and the evaluation of disease-modifying therapies.
Funding:
National Institute on Aging, National Institute of Neurological Disorders and Stroke, Banner Alzheimer’s Foundation, COLCIENCIAS, the Torsten Söderberg Foundation, the Swedish Research Council, the Swedish Alzheimer Foundation, the Swedish Brain Foundation, and the Swedish state under the ALF-agreement.
Keywords: Alzheimer’s disease, presenilin-1, preclinical, Alzheimer’s disease, NfL, biomarkers
INTRODUCTION
Neurofilament light (NfL) –, a major component of the cytoskeleton in large caliber, myelinated axons –, is a promising biomarker of active axonal injury and neuronal degeneration1,2. NfL concentrations in CSF, serum, and/or plasma have been used to detect and track neurodegeneration in individuals with Alzheimer’s Disease (AD) and other neurodegenerative, neuroinflammatory, traumatic, and cerebrovascular disorders 3–5. Studies on NfL have investigated cognitively unimpaired individuals at risk for AD, transgenic mouse models of AD and other neurodegenerative proteinopathies, normal brain aging, and neurodegenerative disease intervention trials 6–8.
The ultra-sensitive single molecule array (Simoa) immunoassay has recently enabled measuring NfL concentrations in serum or plasma9. Studies have shown close correlations between these blood-based and CSF measurements in persons and animal models of neurodegenerative proteinopathies10. Most NfL studies have examined elevations in concentrations in patients relative to controls, but minimal work has examined individual differences in NfL levels or rates of change. Additional research is needed to understand how blood-based NfL measurements behave longitudinally, and to clarify the role of NfL in the detection, tracking, treatment, and prevention of neurodegeneration in the preclinical and clinical stages of AD.
Researchers from the Dominantly Inherited Network (DIAN) characterized NfL concentrations in 405 adult autosomal-dominant AD mutation carriers and non-carriers between 28 years before and 15 years after the carriers’ estimated age at symptomatic onset. Cross-sectional measurements were estimated to distinguish carriers from non-carriers starting about 7 years before the carriers’ predicted age at symptomatic onset and were correlated in carriers with cross-sectional CSF NfL concentrations, precuneus cortical thickness, lower baseline Mini-Mental State Exam (MMSE) and recall memory scores, as well as subsequent rates of decline in precuneus cortical thickness, MMSE, and memory recall11. The DIAN study also characterized longitudinal NfL measurements in 196 of these participants over a median of 3 years; longitudinal serum NfL increases were estimated to distinguish carriers from non-carriers starting about 16 years before the carriers’ predicted age at symptomatic onset and were correlated in carriers with decline in precuneus cortical thickness, MMSE, and memory.
Weston et al.12,13 also studied serum NfL in ADAD. Cross-sectionally, they studied 48 samples from ADAD carriers and non-carriers and reported that NfL levels differed between impaired carriers, unimpaired carriers and non-carriers, and that elevated serum NfL was correlated with smaller brain volumes and lower cognitive performance. Longitudinally, they studied 61 samples and reported that levels begin to distinguish carriers from non-carriers 15 years before their expected symptom onset.
Though work from DIAN and others have contributed to our understanding of NfL in preclinical ADAD, we have the opportunity to investigate cross-sectionally and longitudinally a unique cohort to a) extend the study to a much larger number of individuals, b) do so over a wider age range, and c) do so in a more homogeneous population with or without one single ADAD mutation. Antioquia, Colombia is home to the world’s largest ADAD kindred due to a single-mutation (E280A) in presenilin-1 (PSEN1). Carriers and non-carriers from this kindred have been extensively characterized by researchers from the Neurosciences Group of Antioquia (GNA) and the United States. Carriers are virtually certain to develop AD, have a well characterized disease course, and have been estimated to progress to mild cognitive impairment (MCI) and dementia at the respective ages of 44 (95% confidence interval: 43–45) and 49 (95% confidence interval: 49–50) 14,15.
In this study, we used available cross-sectional plasma samples to characterize cross-sectional NfL concentrations in 2,144 participants of the Colombian API Registry, including 1,070 PSEN1 E280A mutation carriers and 1,074 non-carriers, 8–75 years of age, who were matched for age. Available longitudinal plasma samples were also analyzed from 262 carriers and 242 non-carriers who were followed over an average of 6 years to characterize changes in plasma NfL. We compared cross-sectional and longitudinal plasma NfL measurements in cognitively impaired carriers, cognitively unimpaired carriers, and non-carriers, and estimated the ages at which cross-sectional and longitudinal NfL elevations in carriers began to distinguish carriers from non-carriers. We also characterized the extent to which baseline NfL measurements and longitudinal declines are related to baseline memory performance and clinical ratings and longitudinal declines in carriers.
METHODS
Study design and participants
Between August 1998 and December 2018, all members of the PSEN1 E280A mutation Colombian kindred were invited to enroll the API Colombia Registry, as previously described 16,17. For this cohort study, participants were cognitively unimpaired and impaired PSEN1 E280A carriers or cognitively unimpaired non-carriers, and were at least 8 years of age. Participants were considered cognitively unimpaired if they had a MMSE18 score ≥26, a functional assessment staging test (FAST)19 score <2, and no cognitive impairment on the Spanish version of the Consortium to Establish a Registry for Alzheimer’s disease (CERAD) battery 20. Impaired mutation carriers were required to have a FAST score of >3, and MCI or dementia due to Alzheimer’s disease according to National Institute on Aging—Alzheimer’s Association criteria 21. Individuals with significant medical, psychiatric or neurological disorders, or a history of stroke, seizures, substance abuse, or other disorders that affect motor, visuospatial or cognitive abilities were excluded.
This study was approved by the institutional review board at the University of Antioquia, Colombia (Francisco Lopera, principal investigator). Informed written consent for Registry participation and the use of data and samples was obtained from the cognitively unimpaired adult participants, a partner or offspring serving as the legal representative for cognitively impaired participants, and a parent serving as the legal representative for participants under 18 years of age.
Procedures
Clinical and cognitive assessments were undertaken at the University of Antioquia (Medellín, Colombia). Adult participants completed a clinical interview and that included the MMSE, the Spanish CERAD battery 20, the FAST19, and the Yesavage Geriatric Depression Scale 22. Younger participants (<18 years old) completed a clinical interview, which included questions about general cognitive functioning).
Testing was conducted in Spanish by neuropsychologists or psychologists trained in neuropsychological assessment. Clinical histories and neurological examinations were performed by neurologists or physicians trained in the assessment of dementia. Clinical data were recorded on SISNE2, a relational database at the GNA.
For genetic analyses, genomic DNA was extracted from blood by standard protocols, and PSEN1 E280A characterization was done at the University of Antioquia using methods previously described 23.
Plasma was collected in the morning (not fasting). Three aliquots of 1ml were collected. Samples were stored at −80˚C. For NfL analysis, one plasma aliquot was shipped on dry ice to the Clinical Neurochemistry Laboratory at Sahlgrenska University Hospital, Mölndal, Sweden. NfL concentration was measured using an in-house Single molecule array (Simoa) assay, as previously described in detail (manufacturer: Quanterix, Billerica, MA) 9. The measurements were performed by board-certified laboratory technicians. One batch of reagents and one instrument was used to analyze the whole study. Participants and investigators were blinded to genetic test results.
Outcomes
The primary outcome of interest in this study was plasma NfL levels (pg/ml) in the PSEN1 E280A mutation carriers and non-carriers, which was modeled against age to determine the earliest age at which NfL levels separate between mutation carriers and non-carriers. Secondary outcomes of this study included baseline cognitive performance (MMSE total score; CERAD world list delayed recall score); change in cognitive performance on these tests and plasma NfL levels (pg/ml/year) were also assessed for participants whom had available longitudinal data.
Statistical Analyses
All available plasma samples and clinical data were included in the analyses. For the primary analysis of the relationship between plasma NfL levels and age, we used the log transformed NfL level measurements for both cross-sectional and longitudinal analysis following the same methods reported on a recent paper with a similar ADAD cohort11. The relationship between baseline plasma NfL level and age was modeled using a restricted cubic spline model. Model parameters were estimated using a Hamiltonian Markov Chain Monte Carlo (HMCMC) analysis approach implemented in Stan (http://mc-stan.org). This approach allowed the estimation of the median and 99% credible intervals of the model fits at every age for non-carriers and mutation carriers. It also allowed the estimation of the distribution of the differences in NfL levels between carriers and non-carriers with 99% credible interval. Based on the difference curve and its credible interval, we then estimated the age of onset as the earliest time where the 99% credible intervals around the differences distribution did not overlap. This procedure was applied to the cross-sectional NfL data from 1070 carriers and 1074 non-carriers. Bivariate local polynomial regression (LOESS) analysis was also performed and reported in supplementary to examine the impact of the underlying model chosen to fit the NfL data. Additional details about this methodology can be found in the appendix, pages 1–2.
For longitudinal analysis, the rate of change in NfL levels was estimated using linear mixed effects models (LMEMs) with fixed and random effects for age from baseline and carrier status. The overall individual level rate of change was then calculated based on the parameters derived from the LMEMs. Based on the estimated rate of change, we used the HMCMC model described above with the restricted cubic spline model to examine the relationship between the rate of change and baseline age for mutation carrier and non-carriers. Again, log transformed NfL levels were used in the primary analysis, and this longitudinal analysis was applied to 262 carriers and 242 non-carriers. Analyses without log transform and LOESS regression are presented in supplementary for comparison purpose.
Chi-square and independent sample t-tests were used to identify differences between carriers and non-carriers in demographic, clinical, and cognitive variables. Given that plasma NfL data were not normally distributed, all NfL analyses were performed after log transformation. One-way analysis of covariance was used to examine differences in plasma NfL levels between groups (carriers vs. non-carriers), after adjusting for age and years of education. Pearson correlation analysis was used to assess the relationship between plasma NfL levels and age, as well as correlations between both baseline and longitudinal NfL, MMSE, and CERAD Delayed Recall. Statistical analyses were performed using statistical software (SPSS V.21.0; SPSS Inc, Chicago, Illinois, USA).
Role of the funding source
The sponsors of the study had no role in the study design, data collection, data analysis, data interpretation, or the writing or review of this manuscript. The corresponding and senior authors have full access to all the data in the study, and all authors have the final responsibility for the decision to submit for publication.
RESULTS
Our study cohort consisted of 2,144 Registry participants (age range 8–75), including 1,070 PSEN1 E280A mutation carriers and 1,074 non-carriers from the same kindred who were matched to the carriers for age (using the same age range for both groups; Table 1). Longitudinal NfL concentrations were also characterized over 6 ± 3 (1–13) year follow-up in 504 available plasma samples (262 carriers and 242 non-carriers; Table 2). A subset of 1,470 adults (>18years old) in the API Registry also consented to baseline clinical and cognitive assessments (573 unimpaired carriers, 154 impaired, and 743 non-carriers; Table 3), and 314 adults also consented to and completed longitudinal cognitive assessments (Table 4). The number of participants further stratified by age groups (22 years and above) are presented in Supplementary Table 1 in the appendix, page 6.
Table 1.
Baseline plasma NfL levels, clinical measures, and demographics in all mutation carriers and non-carriers
| Carriers | Non-carriers | p-value | |
|---|---|---|---|
| N | 1070 | 1074 | |
| Age (years) | 30±15 (8 – 73) | 29±16 (8 – 75) | 0.65 |
| Male(%) | 488(45.6%) | 490(45.6%) | 0.99 |
| Female(%) | 582(54.4%) | 584(54.4%) | 0.99 |
| Education (years) | 6.8±4.1 | 8.0±4.4 | <0.0001 |
| MMSE | 26.60±5.25 | 28.74±2.35 | <0.0001 |
| CERAD Word List Delayed Recall | 4.92±2.73 | 6.25±1.91 | <0.0001 |
| NfL (pg/ml) | 18.08±66.41 | 9.09±22.72 | <0.0001 |
Reported values are means and standard deviation (SD). All p-values are based on the raw measures (without log transformation) and without adjusting for covariates.
P-values are based on ANOVA comparing the three groups.
Note: NfL = neurofilament light
MMSE = Mini-Mental State Exam
CERAD = Consortium to Establish a Registry for Alzheimer’s Disease
Pg/ml= Picograms Per Milliliter
Table 2.
Longitudinal demographic and plasma NfL measurements in mutation carriers and non-carriers
| Carriers | Non-carriers | p-value | |
|---|---|---|---|
| N | 262 | 242 | |
| Baseline age (years) | 29±16 (8 – 73) | 27±16 (8 – 72) | 0.28 |
| Male (%) | 114(43.5%) | 95(39.3%) | 0.33 |
| Female (%) | 148(56.5%) | 147(60.7%) | 0.33 |
| Education (years) | 7.3±4.1 | 7.9±4.2 | 0.13 |
| Follow-up duration for NfL measurements (years) | 4.6±3.0(1 – 23) | 5.3±2.8(1 – 15) | 0.01 |
| Annual NfL change (pg/ml/yr) | 15.26±75.88 (−19.89 – 824.90) | 1.99±16.47 (−2.96 – 242.63) | 0.01 |
Reported values are means and standard deviation (SD). All p-values are based on the raw measures (without log transformation) and without adjusting for covariates P-values are based on ANOVA comparing the three groups.
Note: NfL = neurofilament light.
Pg/ml= Picograms Per Milliliter
Table 3.
Baseline plasma NfL levels, clinical measures, and demographics in impaired carriers, unimpaired carriers and non-carriers (age above 18 years old)
| Impaired carriers | Unimpaired carriers | Non-carriers | p-value* | |
|---|---|---|---|---|
| N | 154 | 573 | 743 | |
| Age (years) | 50±6 (39 – 73) | 31±9 (18 – 67) | 37±13 (18 – 75) | <0.0001 |
| Male(%) | 68(44.2%) | 257(44.9%) | 327(44.0%) | 0.95 |
| Female(%) | 86(55.8%) | 316(55.1%) | 416(56%) | 0.95 |
| Education (years) | 5.1±3.7 | 7.9±4.4 | 8.6±4.8 | <0.0001 |
| MMSE | 17.61±7.00 | 28.34±2.18 | 28.71±2.39 | <0.0001 |
| CERAD Word List Delayed Recall | 1.84±1.55 | 5.78±2.00 | 6.28±1.82 | <0.0001 |
| NfL (pg/ml) | 41.83±83.41 | 9.07±8.34 | 10.73±26.92 | <0.0001 |
Reported values are means and standard deviation (SD). All p-values are based on the raw measures (without log transformation) and without adjusting for covariates.
P-values are based on ANOVA comparing the three groups.
Note: NfL = neurofilament light
MMSE = Mini-Mental State Exam
CERAD = Consortium to Establish a Registry for Alzheimer’s Disease
Pg/ml= Picograms Per Milliliter
Table 4.
Impaired carriers, unimpaired carriers and non-carriers with longitudinal clinical assessments and longitudinal NfL measurements (age above 18 years old)
| Impaired carriers | Unimpaired carriers | Non-carriers | p-value* | |
|---|---|---|---|---|
| N | 38 | 116 | 160 | |
| Baseline age (years) | 50±6 (40 – 73) | 32±9 (18 – 67) | 36±12 (18 – 72) | <0.0001 |
| Male (%) | 16(42.1%) | 47(40.5%) | 52(32.5%) | 0.30 |
| Female (%) | 22(57.9%) | 69(59.5%) | 108(67.5%) | 0.30 |
| Education (years) | 5.9±3.9 | 8.8 ±4.2 | 8.3 ±4.7 | 0.01 |
| Follow-up duration for NfL measurements (years) | 4.7±3.0 (1 – 14) | 5.7±2.8 (1 – 13) | 6.0±3.1 (1 – 15) | 0.07 |
| Number of follow-up NfL measurements | 2.2±0.4 (2–3) | 2.2±0.4 (2–3) | 2.1±0.3 (2–3) | 0.06 |
| Baseline NfL level (pg/ml) | 33.39±17.57 | 10.00±6.85 | 8.65±14.39 | <0.0001 |
| Annual NfL change (pg/ml/yr) | 80.89±181.76 (−19.89 – 824.90) | 6.25±25.67 (−4.93 – 187.71) | 2.98±20.19 (−2.96 – 242.63) | <0.0001 |
Reported values are means and standard deviation (SD). All p-values are based on the raw measures (without log transformation) and without adjusting for covariates
P-values are based on ANOVA comparing the three groups.
Note: NfL = neurofilament light.
Pg/ml= Picograms Per Milliliter
Intra-assay coefficients of variation (repeatability) for plasma samples were 8.0% and 5.7% for two quality control (QC) samples with NfL concentrations of 11.7 and 182 pg/mL, respectively, that were run on each plate.
While carriers and non-carriers did not differ in their age (30±15 [8–75] in the overall group) or sex (46% female), carriers had significantly lower educational levels (p<0.0001). Compared with unimpaired mutation carriers, cognitively impaired mutation carriers were older and scored significantly worse across all cognitive tests. Compared with non-carriers, cognitively unimpaired carriers had significantly lower MMSE and CERAD word list delayed recall scores (p < 0.01).
In the entire sample, baseline NfL concentrations were increased in carriers (mean, 18.08 +/−66.41 pg/mL) compared to non-carriers (mean, 9.09+/−22.72 pg/mL). There was an age-associated NfL increase in both carriers and non-carriers (carriers: r=.32, p<.01; non-carriers r=.26, p<.01). In the subset of carriers and non-carriers (> 18 years old) with clinical data, baseline NfL was elevated in impaired carriers (41.83±83.41 pg/mL), compared to non-carrier (10.73±26.92 pg/mL). There were no significant differences between adult unimpaired carriers (9.07±8.34 pg/mL) and age-matched non-carriers. (p > .05). Baseline and annual NfL change for the carriers were highly correlated (r=0.72; slope=3.86; p<0.0001). Elevated cross-sectional plasma NfL concentrations in carriers began to differ from non-carriers at the average age of 22 years (22 years before the estimated age of 44 at clinical onset of MCI) (Figure 1). HMCMC models estimated that the age at which the 99% CI’s begin to be non-overlapping between carriers and non-carriers when evaluating rate of change in NfL is 22 years (again, 22 years before estimated age of clinical onset of MCI) (Figure 2). These NfL group differences had low sensitivity at younger ages (i.e., less than 60% sensitivity) until approximately 3 years prior to the median estimated age of MCI onset. Sensitivity and specific values at different age ranges, as well as the methods with which we ran this post-hoc analysis, are presented in the appendix, pages 4–6.
FIGURE 1. Cross-sectional plasma NfL levels start to divert between mutation carriers and non-carriers 22 years before estimated clinical onset (44 years).
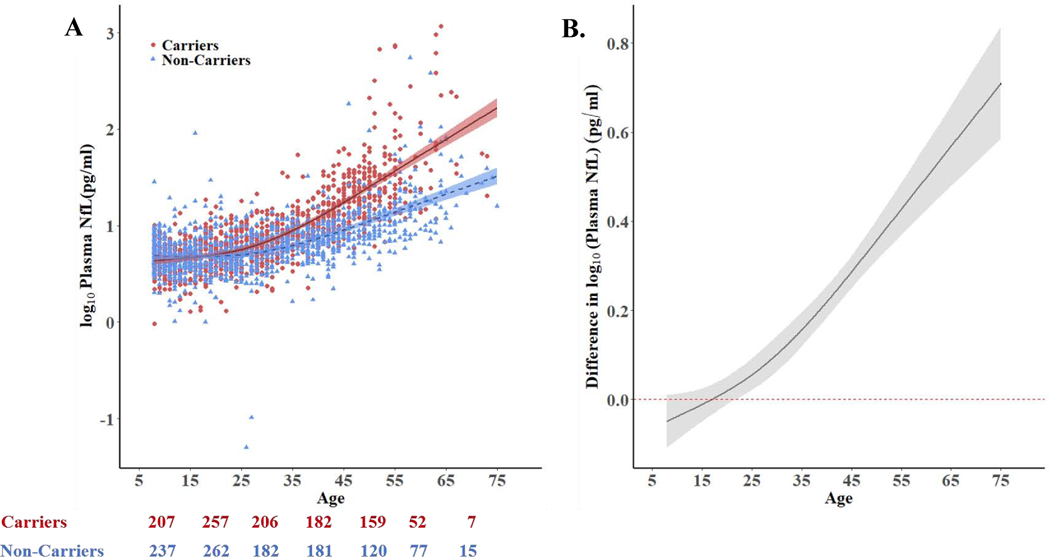
A. Log-transformed cross-sectional plasma NfL values of non-carriers (blue triangles, n = 1074) and mutation carriers (red circles, n = 1070) as a function of age. B. Differences in log-transformed plasma NfL (i.e., the space between the carrier and non-carrier mean values at any given age) between carriers and non-carriers as a function of age. Non-carrier levels are set at zero. The curves and credible intervals are drawn from the actual distributions of model fits derived by the Hamiltonian Markov chain Monte Carlo analyses. Baseline plasma NfL increases in PSEN1 E280A mutation carriers began to differ from non-carriers at age 22, 22 years before the carriers’ estimated mean age of 44 at MCI onset. For A and B the shaded areas represent the 99% credible intervals around the model estimates.
Numbers below 1A indicate number of participants breaking into separate age ranges matching x-axis label.
Pg/ml= Picograms Per Milliliter
FIGURE 2. Rate of change in Plasma NfL levels as a function of age in mutation carriers and non-carriers: Log-transformed longitudinal data.
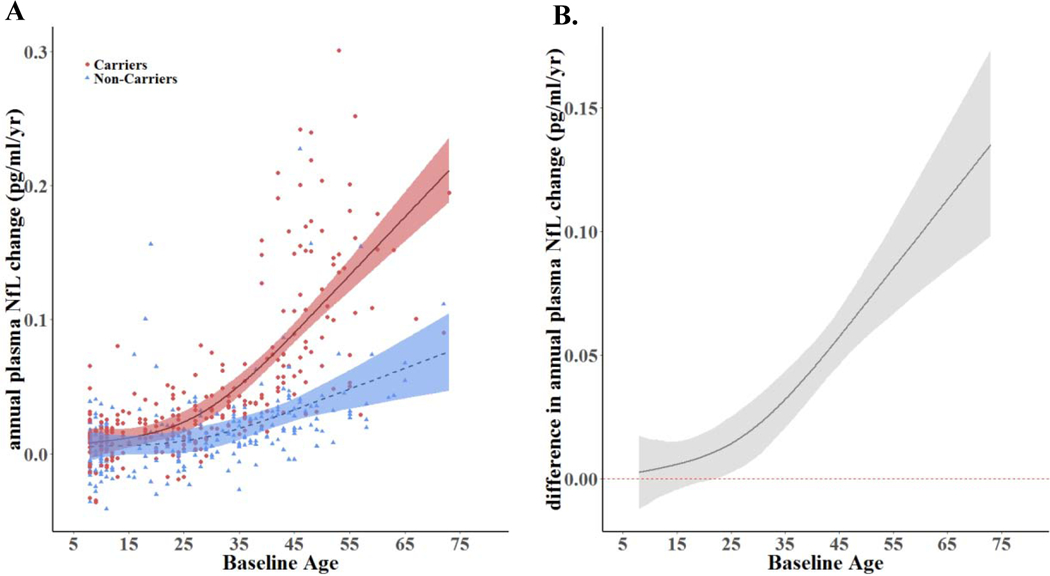
A. Longitudinal change rates of plasma NfL as a function of age. B. Change rate differences between carriers & non-carriers as a function of age (i.e., the space between the carrier and non-carrier mean values at any given age). Non-carrier rates are set at zero. The rate of NfL increases in PSEN1 E280A mutation carriers began to differ from non-carriers at age 22, 22 years before the carriers’ estimated median age of 44 at MCI onset. Log-transformed data were modeled using Linear Mixed Effects Models (LMEMs), a restricted cubic spline, & Hamiltonian Markov chain Monte Carlo (MCMC) analyses. The shaded areas represent 99% credibility intervals. The underlying modeling procedures used in the generation of these representations of the longitudinal changes rates of plasma NfL are very similar to those used to generate the representations in Figure 1 (cross-sectional plasma NfL between carriers and non-carriers) but the dependent variable (i.e. the rate of change in NfL) of the models was different between the analyses.
Pg/ml= Picograms Per Milliliter
Higher baseline plasma NfL levels correlated with lower baseline MMSE scores in impaired carriers (r = −0.39, p < .01), and unimpaired carriers (r = −0.22, p <.01). Baseline NfL concentrations were also associated with greater longitudinal decline in memory scores in carriers (CERAD Word List Recall, r=−.65; slope= −0.36; p <0.01), after adjustment for age. Further, in all carriers, baseline NfL levels were associated with rate of annual change of MMSE scores (r=−0.66; slope= −1.38; p<.01) (Figure 3).
FIGURE 3. Correlations between baseline and longitudinal plasma NfL and subsequent clinical and cognitive decline for unimpaired and impaired carriers.
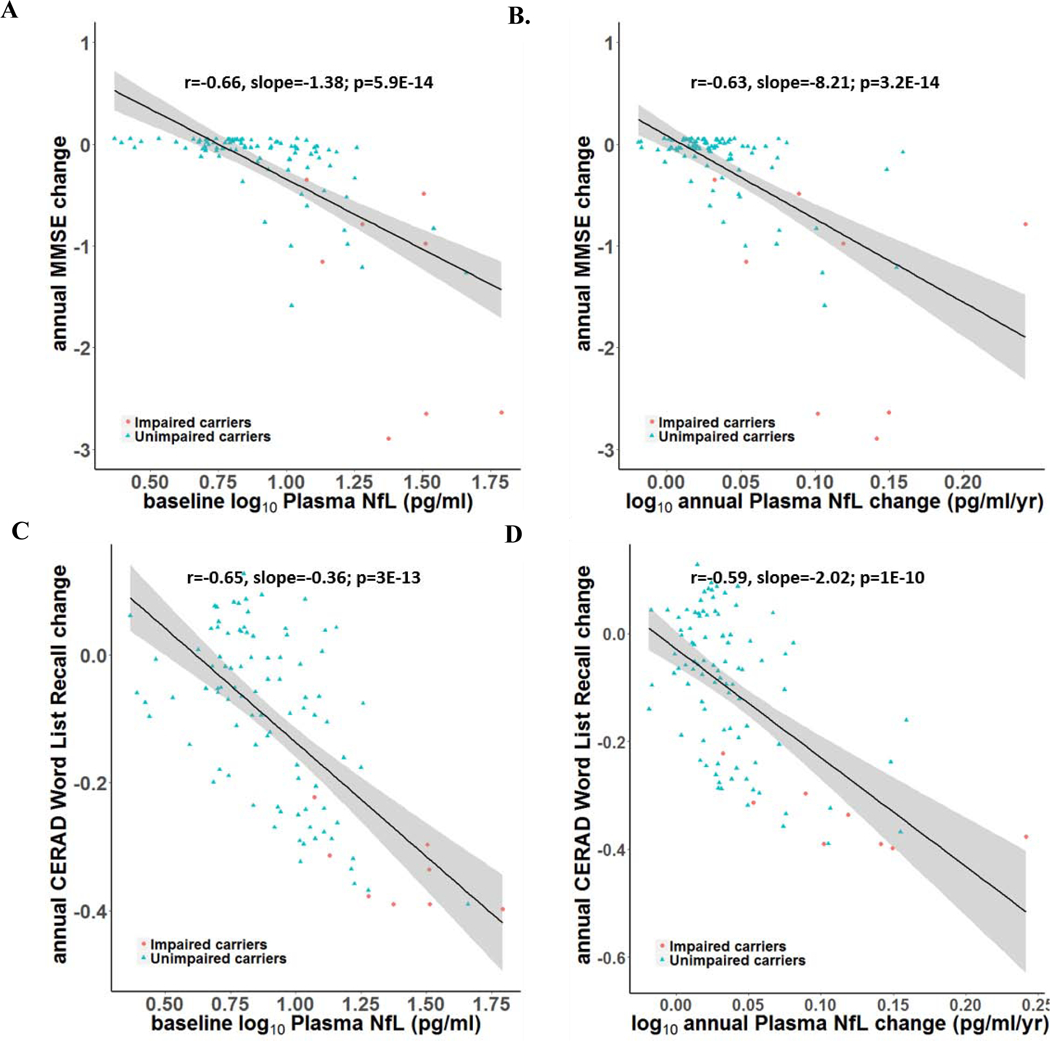
Baseline plasma NfL levels & annual change rates are associated with annual clinical and cognitive decline rates in impaired & unimpaired mutation carriers. A. Correlations between baseline plasma NfL and annual decline in MMSE scores. B. Correlations between annual increase in plasma NfL and annual decline in MMSE scores. C. Correlations between baseline plasma NfL and annual decline in CERAD word delayed recall scores. D. Correlations between annual increase in plasma NfL and annual decline in CERAD word delayed recall scores. Impaired carriers are shown in red circles and unimpaired carriers are shown in blue triangles.
Pg/ml= Picograms Per Milliliter
DISCUSSION
This study characterized cross-sectional plasma NfL measurements and annual changes in an exceptionally large number of 8–75 year-old PSEN1 E280A mutation carriers and non-carriers from the world’s largest single-mutation ADAD kindred. Baseline and longitudinal plasma NfL measurements differed significantly in impaired carriers, unimpaired carriers, and non-carriers, and increased with age in all groups. Plasma NfL also significantly began to differentiate carriers from non-carriers at age 22 (22 years before their estimated median age at MCI onset). Baseline and longitudinal plasma NfL were also associated with lower baseline and greater annual decline in MMSE and CERAD word list delayed recall.
Although differences in plasma NfL concentrations between carriers and non-carriers were observed earlier in this cohort relative to previous reports15, the sensitivity of plasma NfL in identifying PSEN1 E280A carriers was low (i.e., less than 60% sensitivity) until approximately 3 years prior to the estimated age of MCI onset, similar to reports by the DIAN11. Post hoc analyses in a subset roughly the same size as in the DIAN study suggests that the earlier age at onset of NfL differentiation between carriers and non-carriers in this study is partly but not solely due to the larger sample size (see the appendix, pages 7–8 for more discussion). It could be also related to the homogeneity of the Colombian PSEN1 E280A cohort. We also postulate that increased variability of plasma NfL at older ages is attributable to a smaller number of older mutation carriers (and thus age-matched non-carriers at older ages), as well as the impact of age and non-AD neuropathological conditions on this measure of neuronal injury and neurodegeneration. In future studies, we plan to estimate the number of ADAD mutation carriers with elevated NfL levels needed to demonstrate a significant effect of an AD-modifying treatment on NfL reductions — and based on the robust NfL increases observed in association with clinical onset, we anticipate that this measure may have significant power to detect those effects, helping to reduce the size and time needed to conduct early phase trials.
Our study adds to previous work on ADAD mutation cohorts 11–13 in three major ways. First, we studied a large number of ADAD mutation carriers and non-carriers (i.e., over 2,000 baseline plasma NfL observations and nearly 400 longitudinal observations with plasma NfL and cognitive testing). Second, this work only included carriers with one of the nearly 300 known ADAD mutations, which has a well-characterized age at the onset of MCI and dementia, mitigating issues of heterogeneity that limit mixed-mutation research. Finally, participants in this study span an unprecedented age range in ADAD research – 8 to 75 years-old – allowing us to examine plasma NfL as a biomarker of axonal degeneration across the lifespan and AD trajectory.
Studies of PSEN1 E280A mutation carriers allow us to examine cognitively unimpaired individuals who will go on to develop AD in the future with virtual certainty. Previously, our group has shown that unimpaired mutation carriers from this kindred had significantly greater amyloid burden in their late 20s and increased tau accumulation in their late 30s, lower cerebral metabolic rates for glucose and smaller hippocampal volume in their late 30s, and lower CSF Aβ1–42, higher CSF total tau and phosphorylated tau in their mid 20s, compared to age-matched non-carriers 24,25. The present findings confirm that changes in plasma markers can be measured decades before clinical onset, though the sensitivity of plasma NfL elevations in identifying PSEN1 E280A mutation carriers was low until within a few years of the median age of onset of MCI for carriers in this cohort.
This study highlights the potential to characterize remarkably early changes in blood-based biomarker measurements of neurodegeneration when applied to an unusually large population--but suggests that the magnitude of these changes may be too small to be clinically meaningful in the clinical setting until close to onset of cognitive impairment. It also provides a foundation to inform the size and design of therapeutic trials in clinical and preclinical stages of AD.
The limitations of this investigation must also be discussed. First, while there are certain advantages to the study of a homogeneous ADAD kindred, this design may be less able to address the generalizability of findings to other ADAD mutations. In the DIAN report15, there were comparable findings in individuals with PSEN1, PSEN2, and APP mutations. Similarly, the relevance of our findings to studies in sporadic AD or in Down syndrome is also unknown. For instance, it has been suggested that plasma NfL elevations in persons with MCI and dementia due to sporadic AD may not be as precise as those in persons with ADAD. Third, while we have not yet characterized or assessed the impact of the APOE4 allele on plasma NfL measurements as a function of age in this Colombian cohort, we are eager to use plasma NfL and other blood-based biomarkers as endophenotypes to assess the impact of APOE variants and other genetic and non-genetic risk factors on potentially dissectible features of AD. Fourth, we have not yet compared NfL measurements to other brain imaging and CSF biomarkers from our ongoing observational and prevention trials, and we have a smaller number of participants with each of those longitudinally acquired biomarkers than those in the DIAN. Ongoing efforts promise to further inform the temporal sequence of these biomarker changes. Finally, additional analyses are needed to inform the size and design of treatment and prevention trials in this kindred, and findings from effective AD-modifying treatments will be required to clarify the theragnostic role of plasma NfL endpoints in the evaluation of promising interventions to treat and prevent AD, including Crenezumab, the drug now being evaluated in the API ADAD Colombia trial.26
Though our findings suggest that plasma NfL changes may begin in preclinical AD, additional studies are needed to clarify the temporal relationship between the onset of different biomarker effects. Our study used the same log transformation, cubic spline, and age at biomarker onset procedures as previously reported by DIAN11. While findings depend in part on the data analysis method and its underlying assumptions, we have confidence in the estimate we have calculated using these methods and we expect to see similar results using other downstream biomarkers in future reports. The statistical approach that we used also yielded low correlation coefficients that, though significant, reflect how changes in plasma NfL are evident, but are subtle across the lifespan of PSEN1 E280A carriers relative to non-carriers. Also, the lack of other biomarkers in this study (e.g., plasma, CSF, PET Aβ or tau) limits the interpretation at this time of the utility of NfL in therapeutic trails, but is a major focus of our ongoing work in the COLBOS (Colombia-Boston) biomarker study and other groups.
Our findings add to the growing evidence that plasma and serum NfL measurements can be useful in detecting neurodegeneration and axonal injury, starting with early, subtle elevations long before the onset of AD clinical symptoms and greater, more sensitive elevations closer to the impending onset of clinical impairment. This research lays the foundation for further exploration of blood-based NfL measurements as a way to inform prognosis and evaluate treatments aimed at preventing AD and related disorders (several of which are associated with NfL elevations). More generally, our work illustrates the feasibility of acquiring large amounts of blood-based biomarkers which will continue to be important in the race to find better diagnostic tools and treatments for AD.
RESEARCH IN CONTEXT
Evidence before this study.
We searched PubMed for studies that examined NfL in neurodegenerative disorders published in any language up to December 31st, 2019. Search terms included “neurofilament light” “plasma biomarker” AND “neurodegeneration” OR “Alzheimer’s disease” OR “dementia” OR “cognition”. The literature elucidated that NfL, a constituent of myelinated neurons, is a promising biomarker of active axonal injury and neurodegeneration in a wide range of neurological disorders. In multiple sclerosis and spinal muscular atrophy, it has been seen that CSF NfL levels decrease 6–12 months after the initiation of successful treatments. In addition, serum NfL measurements have been shown to be elevated in persons with MCI and dementia due to sporadic AD and to be associated with lower CSF amyloid-β42 levels (an indicator of amyloid-β plaque burden) and MRI measurements of brain atrophy. More recently, serum NfL levels were reported in persons with and without different ADAD mutations. These studies (involving measurements in up to about 50 and 400 kindred members, respectively) have reported differences between cognitively impaired carriers, unimpaired carriers, and non-carriers, as well as correlations between greater serum NfL and smaller brain volumes, lower cognitive test scores, and greater cognitive decline. Cross-sectional and longitudinal measurements showed that NfL significantly distinguished carriers from non-carriers 7 and 15 years before the carrier’s estimated symptom onset, respectively.
Added value of this study.
On this study, we examined more than 2,100 mutation PSEN1 E280A mutation carriers and non-carriers, 8–75 years of age, from the world’s largest single-mutation ADAD kindred. Cross-sectional and longitudinal plasma NfL levels, as well as baseline and longitudinal cognitive assessments, allowed us to extend previous reports and identify the age at which plasma NfL begins to differ between PSEN1 E280A carriers and non-carriers (22 years old, or 22 years before the median estimated age at onset of MCI in this cohort), as well as the associations of plasma NfL with baseline and subsequent cognitive performance. Of note, these NfL between-group differences had low sensitivity at younger ages and only showed high sensitivity near the age of clinical onset.
Implications of all the available evidence.
The emerging evidence supports the promise of plasma NfL and other blood-based biomarkers in the detection and tracking of AD and related disorders, the evaluation of risk modifiers for these neurodegenerative diseases, and the evaluation of disease modifying treatments. Additional studies are needed to clarify the generalizability of the findings, the relationship between different blood-based and other biomarkers of AD and related disorders, and the role of these peripheral markers of neurodegeneration in the evaluation of interventions to treat and prevent these disorders, as well as implications for their future use in clinical settings.
Supplementary Material
Acknowledgments.
The authors thank the PSEN1 Colombian families for contributing their valuable time and effort, without which this study would not have been possible. We thank the research staff of the Group of Neuroscience of Antioquia for their help coordinating study visits for the Colombian API Registry.
Funding Sources
Dr. Quiroz was supported by grants from the NIH Office of the Director (DP5OD019833), the National Institute on Aging (R01 AG054671], the Alzheimer’s Association, and Massachusetts General Hospital ECOR (1200–228010 and 1200–228767). Dr. Zetterberg is a Wallenberg Academy Fellow supported by grants from the Swedish Research Council (#2018–02532), the European Research Council (#681712) and Swedish State Support for Clinical Research (#ALFGBG-720931) and the UK Dementia Research Institute at UCL. He has served at scientific advisory boards of Roche Diagnostics, Wave, Samumed and CogRx, and has given lectures in symposia sponsored by Biogen and Alzecure. Dr. Su reports grants from NIH/NIBIB, The Alzheimer’s Association, The BrightFocus Foundation, NIH/NIA, State of Arizona, personal fees from Green Valley Pharmaceutical LLC, outside the submitted work. Mr. Fox-Fuller reports NRSA support from the National Institute on Aging (1F31AG06215801A1). Ms. Schultz received funding from National Science Foundation (DGE-1745038). Dr. Guzman-Velez was supported by the National Institute on Aging (K23AG061276). Dr. Vila-Castelar is supported by a grant from the Alzheimer’s Association (AA Research Fellowship). Drs. Arboleda-Velasquez and Sepulveda-Falla were supported by a grant co-funded by the National Institute on Aging and the National Institute of Neurological Disorders and Stroke (RF1 NS110048). Dr. Lopera was supported by an Anonymous Foundation, and the Administrative Department of Science, Technology and Innovation (Colciencias Colombia;111565741185). Drs. Reiman, Lopera and Tariot are principal investigators of the Alzheimer’s Prevention Initiative (API) Autosomal Dominant AD Trial, which is supported by NIA, philanthropy, Genentech, and Roche. Dr. Reiman reports grants from National Institute on Aging (R01 AG031581, P30 AG19610), Banner Alzheimer’s Foundation and the NOMIS Foundation during the conduct of the study. He reports receiving personal fees as a Scientific Advisor to Roche Diagnostics (travel expenses only), MagQ, Avid Radiopharmaceuticals and is a share-holding co-founder of ALZPath, outside the submitted work. In addition, he is the inventor of a patent issued to Banner Health, which involves the use of biomarker endpoints in at-risk persons to accelerate the evaluation of Alzheimer’s disease prevention therapies and is outside the submitted work. Dr. Tariot reports personal fees from Abbvie, AC Immune, Acadia, Auspex, Boehringer Ingelheim, Chase Pharmaceuticals, Corium, from Eisai, GliaCure, INSYS Therapeutics, Pfizer, T3D, grants and AstraZeneca, grants and personal fees from Avanir, Biogen, Eli Lilly, H. Lundbeck A/S, Merck and Company, Roche, Takeda, grants from Amgen, Avid, GE Healthcare, Genentech, Novartis, National Institute of Aging, Arizona Department of Health Services, grants and other from Adamas, outside the submitted work. In addition, Dr. Tariot has a patent U.S. Patent # 11/632,747, “Biomarkers of Neurodegenerative disease.” Dr. Blennow has served as a consultant or at advisory boards for Axon Neuroscience, Biogen, CogRx, Lilly, MagQu, Novartis, Roche Diagnostics, and is a co-founder of Brain Biomarker Solutions in Gothenburg AB, a GU Venture-based platform company at the University of Gothenburg.
Footnotes
Publisher's Disclaimer: This is a PDF file of an unedited manuscript that has been accepted for publication. As a service to our customers we are providing this early version of the manuscript. The manuscript will undergo copyediting, typesetting, and review of the resulting proof before it is published in its final form. Please note that during the production process errors may be discovered which could affect the content, and all legal disclaimers that apply to the journal pertain.
Conflicts of Interest
All other co-authors have no competing interests.
Contributor Information
Yakeel T. Quiroz, Massachusetts General Hospital, Harvard Medical School, Boston, MA, USA, Grupo de Neurociencias de Antioquia of Universidad de Antioquia, Medellin, CO.
Henrik Zetterberg, Clinical Neurochemistry Laboratory, Sahlgrenska University Hospital, Mölndal, Sweden, Dept. of Psychiatry and Neurochemistry, Inst. of Neuroscience and Physiology, University of Gothenburg, Mölndal Campus, Sweden.
Eric M. Reiman, Banner Alzheimer’s Institute, Phoenix, AZ, USA, University of Arizona College of Medicine, Phoenix AZ, USA, Arizona State University, Tempe, AZ, USA, Translational Genomics Research Institute, Phoenix, AZ, USA.
Yinghua Chen, Banner Alzheimer’s Institute, Phoenix, AZ, USA.
Yi Su, Banner Alzheimer’s Institute, Phoenix, AZ, USA
Joshua T. Fox-Fuller, Massachusetts General Hospital, Harvard Medical School, Boston, MA, USA, Department of Psychological and Brain Sciences, Boston University, Boston, MA.
Gloria Garcia, Grupo de Neurociencias de Antioquia of Universidad de Antioquia, Medellin, CO
Andres Villegas, Grupo de Neurociencias de Antioquia of Universidad de Antioquia, Medellin, CO
Diego Sepulveda-Falla, Grupo de Neurociencias de Antioquia of Universidad de Antioquia, Medellin, CO, Institute of Neuropathology, University Medical Center Hamburg-Eppendorf, Hamburg, Germany
Marina Villada, Grupo de Neurociencias de Antioquia of Universidad de Antioquia, Medellin, CO.
Joseph F. Arboleda-Velasquez, Schepens Eye Research Institute of Mass Eye and Ear, Harvard Medical School, Boston, MA
Edmarie Guzmán-Vélez, Massachusetts General Hospital, Harvard Medical School, Boston, MA, USA
Clara Vila-Castelar, Massachusetts General Hospital, Harvard Medical School, Boston, MA, USA
Brian A. Gordon, Knight Alzheimer’s Disease Research Center, Washington University in St. Louis MO, USA
Stephanie A. Schultz, Knight Alzheimer’s Disease Research Center, Washington University in St. Louis MO, USA
Hillary D. Protas, Banner Alzheimer’s Institute, Phoenix, AZ, USA
Valentina Ghisays, Banner Alzheimer’s Institute, Phoenix, AZ, USA
Margarita Giraldo, Grupo de Neurociencias de Antioquia of Universidad de Antioquia, Medellin, CO
Victoria Tirado, Grupo de Neurociencias de Antioquia of Universidad de Antioquia, Medellin, CO
Ana Baena, Grupo de Neurociencias de Antioquia of Universidad de Antioquia, Medellin, CO
Claudia Munoz, Grupo de Neurociencias de Antioquia of Universidad de Antioquia, Medellin, CO
Silvia Rios-Romenets, Grupo de Neurociencias de Antioquia of Universidad de Antioquia, Medellin, CO
Pierre N. Tariot, Banner Alzheimer’s Institute, Phoenix, AZ, USA, University of Arizona College of Medicine, Phoenix AZ, USA
Kaj Blennow, Clinical Neurochemistry Laboratory, Sahlgrenska University Hospital, Mölndal, Sweden.
Francisco Lopera, Grupo de Neurociencias de Antioquia of Universidad de Antioquia, Medellin, CO.
REFERENCES
- 1.Bridel C, van Wieringen WN, Zetterberg H, et al. Diagnostic Value of Cerebrospinal Fluid Neurofilament Light Protein in Neurology: A Systematic Review and Meta-analysis. JAMA Neurol 2019. [DOI] [PMC free article] [PubMed]
- 2.Khalil M, Teunissen CE, Otto M, et al. Neurofilaments as biomarkers in neurological disorders. Nat Rev Neurol 2018; 14(10): 577–89. [DOI] [PubMed] [Google Scholar]
- 3.Ashton NJ, Leuzy A, Lim YM, et al. Increased plasma neurofilament light chain concentration correlates with severity of post-mortem neurofibrillary tangle pathology and neurodegeneration. Acta Neuropathol Commun 2019; 7(1): 5. [DOI] [PMC free article] [PubMed] [Google Scholar]
- 4.Mattsson N, Cullen NC, Andreasson U, Zetterberg H, Blennow K. Association Between Longitudinal Plasma Neurofilament Light and Neurodegeneration in Patients With Alzheimer Disease. JAMA Neurol 2019; 76(7): 791–9. [DOI] [PMC free article] [PubMed] [Google Scholar]
- 5.Skillback T, Farahmand B, Bartlett JW, et al. CSF neurofilament light differs in neurodegenerative diseases and predicts severity and survival. Neurology 2014; 83(21): 1945–53. [DOI] [PubMed] [Google Scholar]
- 6.Mattsson N, Andreasson U, Zetterberg H, Blennow K, Alzheimer’s Disease Neuroimaging I. Association of Plasma Neurofilament Light With Neurodegeneration in Patients With Alzheimer Disease. JAMA Neurol 2017; 74(5): 557–66. [DOI] [PMC free article] [PubMed] [Google Scholar]
- 7.Gaiottino J, Norgren N, Dobson R, et al. Increased neurofilament light chain blood levels in neurodegenerative neurological diseases. PLoS One 2013; 8(9): e75091. [DOI] [PMC free article] [PubMed] [Google Scholar]
- 8.Kuhle J, Kropshofer H, Haering DA, et al. Blood neurofilament light chain as a biomarker of MS disease activity and treatment response. Neurology 2019; 92(10): e1007–e15. [DOI] [PMC free article] [PubMed] [Google Scholar]
- 9.Gisslen M, Price RW, Andreasson U, et al. Plasma Concentration of the Neurofilament Light Protein (NFL) is a Biomarker of CNS Injury in HIV Infection: A Cross-Sectional Study. EBioMedicine 2016; 3: 135–40. [DOI] [PMC free article] [PubMed] [Google Scholar]
- 10.Bacioglu M, Maia LF, Preische O, et al. Neurofilament Light Chain in Blood and CSF as Marker of Disease Progression in Mouse Models and in Neurodegenerative Diseases. Neuron 2016; 91(2): 494–6. [DOI] [PubMed] [Google Scholar]
- 11.Preische O, Schultz SA, Apel A, et al. Serum neurofilament dynamics predicts neurodegeneration and clinical progression in presymptomatic Alzheimer’s disease. Nat Med 2019; 25(2): 277–83. [DOI] [PMC free article] [PubMed] [Google Scholar]
- 12.Weston PSJ, Poole T, O’Connor A, et al. Longitudinal measurement of serum neurofilament light in presymptomatic familial Alzheimer’s disease. Alzheimers Res Ther 2019; 11(1): 19. [DOI] [PMC free article] [PubMed] [Google Scholar]
- 13.Weston PSJ, Poole T, Ryan NS, et al. Serum neurofilament light in familial Alzheimer disease: A marker of early neurodegeneration. Neurology 2017; 89(21): 2167–75. [DOI] [PMC free article] [PubMed] [Google Scholar]
- 14.Acosta-Baena N, Sepulveda-Falla D, Lopera-Gómez CM, et al. Pre-dementia clinical stages in presenilin 1 E280A familial early-onset Alzheimer’s disease: a retrospective cohort study. Lancet Neurol 2011; 10(3): 213–20. [DOI] [PubMed] [Google Scholar]
- 15.Fuller JT, Cronin-Golomb A, Gatchel JR, et al. Biological and Cognitive Markers of Presenilin1 E280A Autosomal Dominant Alzheimer’s Disease: A Comprehensive Review of the Colombian Kindred. J Prev Alzheimers Dis 2019; 6(2): 112–20. [DOI] [PMC free article] [PubMed] [Google Scholar]
- 16.Tariot PN, Lopera F, Langbaum JB, et al. The Alzheimer’s Prevention Initiative Autosomal-Dominant Alzheimer’s Disease Trial: A study of crenezumab versus placebo in preclinical PSEN1 E280A mutation carriers to evaluate efficacy and safety in the treatment of autosomal-dominant Alzheimer’s disease, including a placebo-treated noncarrier cohort. Alzheimers Dement (N Y) 2018; 4: 150–60. [DOI] [PMC free article] [PubMed] [Google Scholar]
- 17.Rios-Romenets S, Acosta-Baena N, Lopez L, et al. Adherence/Retention Alzheimer’s Prevention Initiative Colombia Plan. Alzheimers Dement (N Y) 2018; 4: 283–7. [DOI] [PMC free article] [PubMed] [Google Scholar]
- 18.Folstein MF, Folstein SE, McHugh PR. “Mini-mental state”. A practical method for grading the cognitive state of patients for the clinician. J Psychiatr Res 1975; 12(3): 189–98. [DOI] [PubMed] [Google Scholar]
- 19.Reisberg B Functional assessment staging (FAST). Psychopharmacol Bull 1988; 24(4): 653–9. [PubMed] [Google Scholar]
- 20.Aguirre-Acevedo DC, Gómez RD, Moreno S, et al. [Validity and reliability of the CERAD-Col neuropsychological battery]. Rev Neurol 2007; 45(11): 655–60. [PubMed] [Google Scholar]
- 21.Albert MS, DeKosky ST, Dickson D, et al. The diagnosis of mild cognitive impairment due to Alzheimer’s disease: recommendations from the National Institute on Aging-Alzheimer’s Association workgroups on diagnostic guidelines for Alzheimer’s disease. Alzheimers Dement 2011; 7(3): 270–9. [DOI] [PMC free article] [PubMed] [Google Scholar]
- 22.Yesavage JA. Opportunities for and obstacles to treatments for dementias. J Am Geriatr Soc 1983; 31(1): 59–60. [DOI] [PubMed] [Google Scholar]
- 23.Lendon CL, Martinez A, Behrens IM, et al. E280A PS-1 mutation causes Alzheimer’s disease but age of onset is not modified by ApoE alleles. Hum Mutat 1997; 10(3): 186–95. [DOI] [PubMed] [Google Scholar]
- 24.Fleisher AS, Chen K, Quiroz YT, et al. Associations between biomarkers and age in the presenilin 1 E280A autosomal dominant Alzheimer disease kindred: a cross-sectional study. JAMA Neurol 2015; 72(3): 316–24. [DOI] [PMC free article] [PubMed] [Google Scholar]
- 25.Quiroz YT, Sperling RA, Norton DJ, et al. Association Between Amyloid and Tau Accumulation in Young Adults With Autosomal Dominant Alzheimer Disease. JAMA Neurol 2018. [DOI] [PMC free article] [PubMed]
- 26.Reiman EM, Langbaum JB, Fleisher AS, et al. Alzheimer’s Prevention Initiative: a plan to accelerate the evaluation of presymptomatic treatments. J Alzheimers Dis 2011; 26 Suppl 3: 321–9. [DOI] [PMC free article] [PubMed] [Google Scholar]
Associated Data
This section collects any data citations, data availability statements, or supplementary materials included in this article.