Supplemental Digital Content is available in the text.
Keywords: acute respiratory distress syndrome, automatic data processing, children, clinical decision support systems, critical care, machine learning
Background:
Influenza virus is a major cause of acute hypoxemic respiratory failure. Early identification of patients who will suffer severe complications can help stratify patients for clinical trials and plan for resource use in case of pandemic.
Objective:
We aimed to identify which clinical variables best predict prolonged acute hypoxemic respiratory failure in influenza-infected critically ill children. Acute hypoxemic respiratory failure was defined using hypoxemia cutoffs from international consensus definitions of acute respiratory distress syndrome in patients with ventilatory support. Prolonged acute hypoxemic respiratory failure was defined by acute hypoxemic respiratory failure criteria still present at PICU day 7.
Derivation Cohort:
In this prospective multicenter study across 34 PICUs from November 2009 to April 2018, we included children (< 18 yr) without comorbid risk factors for severe disease.
Validation Cohort:
We used a Monte Carlo cross validation method with N2 random train-test splits at a 70–30% proportion per model.
Prediction Model:
Using clinical data at admission (day 1) and closest to 8 am on PICU day 2, we calculated the area under the receiver operating characteristic curve using random forests machine learning algorithms and logistic regression.
Results:
We included 258 children (median age = 6.5 yr) and 11 (4.2%) died. By day 2, 65% (n = 165) had acute hypoxemic respiratory failure dropping to 26% (n = 67) with prolonged acute hypoxemic respiratory failure by day 7. Those with prolonged acute hypoxemic respiratory failure had a longer ICU stay (16.5 vs 4.0 d; p < 0.001) and higher mortality (13.4% vs 1.0%). A multivariable model using random forests with 10 admission and eight day 2 variables performed best (0.93 area under the receiver operating characteristic curve; 95 CI%: 0.90–0.95) where respiratory rate, Fio2, and pH on day 2 were the most important factors.
Conclusions:
In this prospective multicentric study, most children with influenza virus–related respiratory failure with prolonged acute hypoxemic respiratory failure can be identified early in their hospital course applying machine learning onto routine clinical data. Further validation is needed prior to bedside implementation.
About one in 10 children for influenza virus infection require admission to a PICU for acute hypoxemic respiratory failure (AHRF), and up to 9% of the critically ill children will not survive (1–4). In the event of an outbreak of a novel influenza A virus, PICUs are at risk to be overwhelmed by the number of patients who require mechanical ventilation and advanced rescue therapies (5, 6). Acute respiratory distress syndrome (ARDS) is a major subgroup of AHRF. Using consensus definitions, ARDS is stratified into a mild, moderate, or severe disease essentially based on the level of hypoxemia and its relationship to mortality (6, 7).
Predictive models have been designed to predict ARDS (8) or its mortality (9–13). Nearly all published ARDS predictive models used logistic regression (LR), which is fairly easy to understand, but must follows several assumptions and has limited abilities to exploit nonlinear data. However, more recent machine learning models do not have those restrictions in finding the best pathway to a prespecified outcome and has been shown to be superior to simple LR for some clinical cohorts (13, 14) and may help with treatment response interpretation (15, 16).
Initial hypoxemia severity has been associated with a longer ventilation duration (17), and multivariable scores have been developed to predict prolonged mechanical ventilation (18, 19). However, none were specifically built to predict prolonged AHRF in influenza infected patients. We hypothesized that in a group of children with minimal risk factors for developing AHRF from influenza infection, using commonly available clinical and laboratory data available early on in their hospital course, we could develop a model that would accurately predict children with a prolonged AHRF. Such model would be helpful for future clinical trials that would aim to target the sickest patients early in their clinical course.
MATERIALS AND METHODS
Data were prospectively collected by the PALISI Pediatric Intensive Care Influenza Investigators across 34 international PICUs from November 2009 to April 2018. Detailed methods have been previously reported (20, 21). Children (< 18 yr) were admitted to a PICU with severe acute respiratory infection symptoms and microbiologically confirmed influenza virus infection. Children with underlying heart, lung, immune, and other disorders that would predispose them to influenza-related complications were excluded. For example, children with mild asthma not on daily controller medications, mild eczema, and those with other conditions who did not impair respiratory function were eligible. We also excluded children suffering a prehospital cardiac arrest with early death from neurologic complications and those where hypoxemia was thought to be due to left atrial hypertension (6). This study was approved by the respective Institutional Review Boards of the participating centers.
Data were collected closest to the PICU admission time and daily closest to 8 am to reflect the time periods of admission and daily clinical rounds when intensive clinical assessments were common. Hypoxemia cutoffs used for classification were stratified according to Figure 1 using primarily the pediatric acute lung injury consensus conference (PALICC) cutoffs and secondarily the Berlin ARDS definition cutoffs (Fig. 1) when PALICC cutoffs could not be calculated due to missing data (6, 7). Only patients with ventilatory support (invasive or noninvasive) could be considered to have AHRF. Following PALICC recommendations, if noninvasive ventilation was used, hypoxemia was defined by a Pao2/Fio2 (PF) ratio less than or equal to 300 mm Hg or by pulse oximetric saturation (Spo2)/Fio2 (SF) less than or equal to 264 mm Hg if no arterial samples were available. In case of invasive ventilation, hypoxemia was defined by an oxygenation index (OI) greater than or equal to 4 or by an oxygenation saturation index (OSI) greater than or equal to 5 if no arterial sample was available. OSI and SF were analyzed using only measurements where Spo2 less than or equal to 97% as PALICC recommends and using all recorded Spo2 values.
Figure 1.
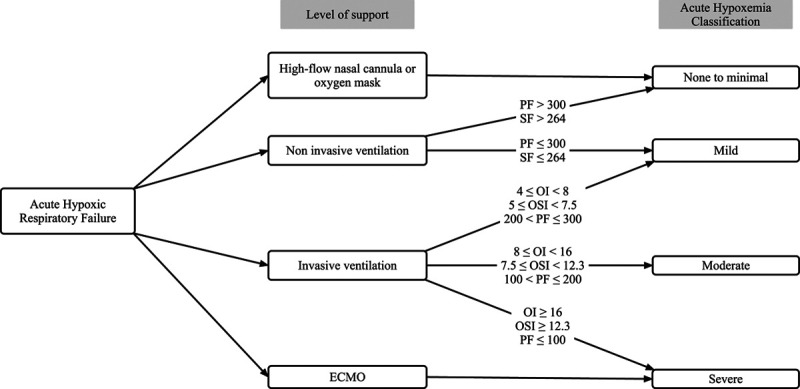
Acute hypoxemia respiratory failure severity classification. If the arterial-based metrics are not available, they may be replaced by their noninvasive equivalent. ECMO = extracorporeal membrane oxygenation, OI = oxygenation index, OSI = oxygenation saturation index, PF = Pao2/Fio2, SF = pulse oximetric saturation/Fio2.
Patients supported by extracorporeal membrane oxygenation (ECMO) were considered to have severe AHRF, regardless of their oxygenation measurement, and patients supported by noninvasive ventilation were classified as mild or no AHRF, even if a more severe hypoxemia was assessed. The main outcome was the presence of AHRF 7 days after the PICU admission (prolonged AHRF) while still in the PICU.
Missing Data Imputation and Statistical Analysis
Descriptive statistics included medians and interquartile ranges (IQRs) for continuous variables and frequencies with percentages for categorical variables. Wilcoxon and Fisher exact tests were used for continuous and discrete variable comparisons, respectively. Missing values were inferred when possible (e.g., ventilation mode based on other available information). If inference was not possible, we assumed normality for pH (7.40), Pco2 (40 mm Hg), or respiratory rate using age reference (22), as frequently done in ICU studies (23–26). Because no normal value exists for mean airways pressure (MAwP), we used the median value of day 1 and day 2, respectively. If no inference could be made (e.g., if no Pao2 was measured), we censored the observation. As noninvasive metrics (OSI and SF ratio) were directly tested, we did not use them to estimate OI or PF.
Data analyses were conducted using Python language, version 3.7.6 (Python Software Foundation, Fredericksburg, VA) and R, version 3.6.2 (R Foundation for Statistical Computing, Vienna, Austria) with the packages “pROC” and “ggalluvial” (27, 28). We used a Monte Carlo cross validation method with N2 random train-test splits (i.e. 66,564 repetitions in our case) at a 70–30% proportion per model (29). The Monte Carlo methods is a bootstrap-based method that provide a robust empirical distribution in order to compare different models (29). We validated the model by calculating the averaged area under the receiver operating characteristic curve (AUROC) on all test groups to estimate the model discrimination (23). This method is appropriate for small datasets and has the advantage to use all the observations, to be relatively robust against overfitting and is able to estimate 95% CIs and p values for model comparison (23). Calibration was assessed using the Hosmer-Lemeshow Goodness of Fit test (30); p value of greater than 0.05 suggested that the model was well calibrated. We followed the 2020 standards for prediction models in critical care (31) and the Transparent Reporting of a multivariable prediction model for Individual Prognosis Or Diagnosis guidelines for development and validation of predictive models (32).
Predictive Models
We chose the random forests (RF) algorithm, a method based on decision tree, for machine learning based on its prior performance and low risk of overfitting (33, 34). RF algorithm is an ensemble method, that is, it is based on multiple small decision subtrees (33). Each subtree is randomly built and is able to come up to a conclusion, but the final result is determined by the sum of all the subtrees in a similar way to a democratic process. Models were built using the R package “randomForest” set with 1,000 trees maximum depth (35). Results were compared with a multivariable LR. We compared common hypoxemia metrics (OI, PF, OSI, and SF) to multivariable models that included respiratory and clinical variables. We used data recorded on day 1 (PICU admission day), day 2 (8 am the day after), and both days. In multivariable models, we estimated the importance of each predictor using the error-rate on classification after permutation (35).
RESULTS
Of the 260 eligible patients, we excluded two who died early after cardiac arrest and resulting neurologic sequelae. No patients were excluded due to suspected left atrial hypertension. Median age was 6.2 years (IQR, 2.1–10.6 yr), female ratio 42% (n = 109), and hospital mortality 4.2% (n = 11). By day 2, 65% (n = 165) met the criteria for AHRF and 26% (n = 67) on day 7. Patients’ characteristics are summarized in Table 1. About 51% (n = 132) were invasively ventilated on day 1, and 38% (n = 97) had an arterial sample. Hypoxemia metrics (OI, PF, OSI, and SF) were applicable to 29%, 38%, 33%, and 62% on day 1. The availability of the main components of each commonly used oxygenation assessment metrics is illustrated in Figure 2.
The evolution of respiratory modalities over PICU days 1–7 (Fig. 3) showed that proportion of patients requiring invasive ventilation increased until PICU day 3, but the number of patients meeting AHRF criteria (Fig. 1) constantly decrease from PICU day 1 to 7. The hypoxemia severity evolution per patient was represented in an alluvial plot (Fig. 4), showing that although 48% of severe patients on PICU day 1 remained severe on PICU day 7, there were many patients undergoing changes of severity classification over the first PICU week.
Figure 4.
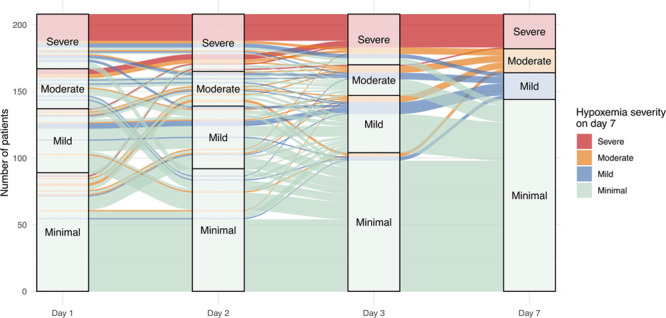
Alluvial plot showing the hypoxemia severity evolution between admission and day 7.
Predictive Models: Hypoxemia Markers
Many patients did not have an available MAwP to calculate OI and OSI, an arterial blood gas for OI and PF, or Spo2 less than or equal to 97% for OSI and SF (Fig. 2). However, common oxygenation markers (OI, PF, OSI, and SF) were found to be discriminant for prolonged AHRF in those patients with available data for calculation (Fig. 5). When using only admission data, SF predicted better than OSI (AUROC 0.79 vs 0.69; p = 0.04), but when both admission and day 2 were provided to the model (Fig. 5), the difference between OSI and SF was no longer significant (p = 0.65). Using both day 1 and day 2 values in the model improved the discrimination for OI, PF, and SF (p = 0.04, 0.009, and 0.002, respectively).
Figure 2.
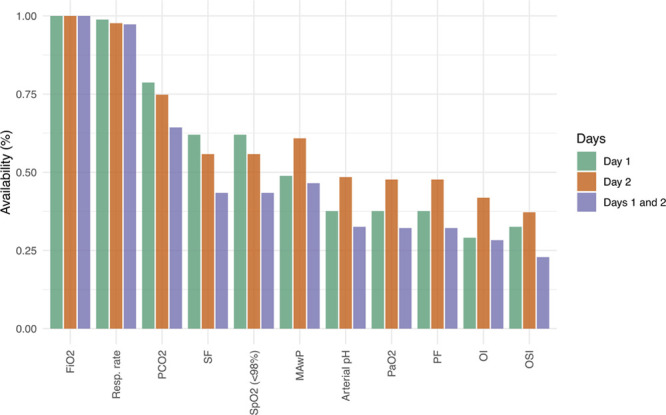
Availability of common oxygenation metrics. MAwP = mean airways pressure, OI = oxygenation index, OSI = oxygenation saturation index, PF = Pao2/Fio2, Resp rate = respiratory rate. Pulse oximetric saturation (Spo2)/, SF = Spo2/Fio2.
Figure 5.
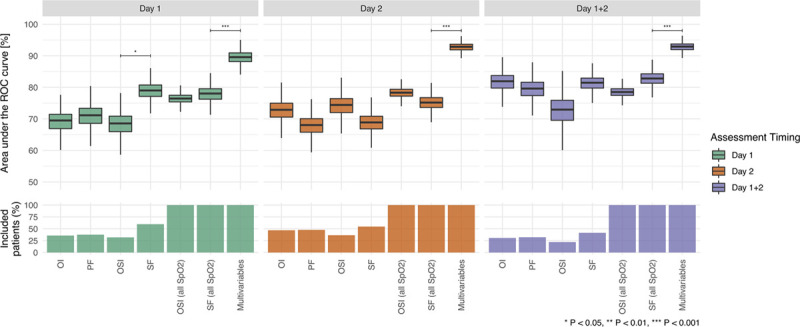
Random forests empirical distributions of the area under the receiver operating characteristic (ROC) curve obtained after Monte Carlo simulation using common hypoxemia markers and multivariable models. Boxplot indicate the median value, interquartile range, and 95% CI. OI = oxygenation index, OSI = oxygenation saturation index, PF = Pao2/Fio2, SF = pulse oximetric saturation/Fio2.
Predictive Models: Multivariable Models
Predictors included continuous age and Pediatric Risk of Mortality (PRISM) III score (36) at PICU admission and Spo2, Fio2, mean airway pressure, invasive ventilation, respiratory rate, pH, and Pco2 at admission and the day after. RF multivariable models outperformed all models using only oxygenation markers (all p < 0.001). Models using both days 1 and 2 achieved a 0.93 AUROC (95% CI, 0.90–0.95) and were similar to model using only day 1 (AUROC 0.90; 95% CI, 0.85–0.93; p = 0.17) or day 2 (AUROC 0.92; 95% CI, 0.90–0.95; p = 0.96) data (Fig. 5). Models using day 2 and both days had good calibration (p = 0.13 and 0.07, respectively), but the model using only day 1 data was borderline (p = 0.05). Using a probability threshold of 0.5, model based on both day 1 and day 2 had 71% sensitivity (95% CI, 60–82%), 93% specificity (95% CI 88%—0.97%), 78% positive predictive value (95% CI, 67–88%), 91% negative predictive value (95% CI, 87–94%), and 88% accuracy (95% CI, 85–91%) (Supplemental Digital Content [SDC] 1, http://links.lww.com/CCX/A239). The analysis of the predictors’ importance after adjusting for PRISM III score (SDC 2, http://links.lww.com/CCX/A239) revealed that respiratory rate, Fio2, and pH on day 2 were the most important factors for the model to predict prolonged AHRF.
Using a backward elimination method, a simpler model was found to include only age, pH, Spo2, and Pco2 on day 1, Fio2, invasive ventilation, and respiratory rate on day 2, and MAwP on both days. This model achieved a similar performance (AUROC 0.91; 95% CI, 0.87–0.94; p = 0.4) than the more complex models.
LR and RF Comparison
Multivariable RF models were superior (p < 0.001) to all LR models. The best LR model achieved an 0.86 AUROC (95% CI 0.83–0.88), but its calibration was low (p = 0.007).
Model Robustness to Time
In LR, admission year was not a significant coefficient (p > 0.6), either in univariate or multivariate analysis. In the RF’ models, the importance of the year was among the lowest values (SDC 2, http://links.lww.com/CCX/A239), suggesting that this variable does not contain discriminant information. When the year was removed from the multivariate model, the discrimination (AUC) was similar (p > 0.7) for both RF and LR.
DISCUSSION
Children who develop prolonged AHRF that is still present on or after PICU day 7 can be identified fairly accurately by the morning of PICU day 2 by applying machine learning to common respiratory variables collected clinically. These children have high morbidity and mortality and high use of ICU resources such as mechanical ventilation. Our final parsimonious model included age, pH, Spo2, and Pco2 on day 1, Fio2, invasive ventilation, and respiratory rate on day 2, and MAwP on both days, and it had an AUROC of 0.91. Although missing data due to rules related to use of oxygenation values (e.g., Spo2 > 97%) were frequent, it could be overcome with either simple rules or decrease in the Spo2 thresholds. Machine learning using RF outperformed LR for all multivariable models.
AHRF is a severe condition that includes ARDS, among other diagnoses. ARDS has a stricter definition (6), but this may not be applicable to all patients, especially in pediatrics where the arterial samples are infrequent and high Spo2 (> 97%) tolerated limiting its use (Fig. 2). The restriction on the Spo2 to be less than or equal to 97% rely on its close relationship with oxyhemoglobin between 80% and 97% (37, 38). Due to inability to use Spo2 greater than 97% and because availability of Pao2 is infrequent and limited to the most severe cases, the PALICC and the Berlin definition of hypoxemia have a limited applicability in clinical research practice in children. As shown in our study, none of the common hypoxemia markers were usable to the whole cohort to adequately classify patients. As other have suggested, it may be better to use the available Spo2 even if greater than 97% than censoring the observation (39), but how to do this requires further investigation. Our findings support that AHRF severity includes oxygenation and mean airway pressure as is in the PALICC but not the Berlin definition
In prior studies, data collected later after admission were slightly more discriminant for mortality than those collected at ICU presentation, although discrimination remained low (< 0.70) (11, 17). Our results do not support a significant benefit of using only day 2 data instead of admission day data as other studies also found (12). However, our data support incorporating the temporal evolution of respiratory variables for optimal prognostication (Fig. 5). Coupling modern machine learning algorithms that do not rely on specific assumption like traditional statistical models (40) to high temporal resolution databases that store raw waveforms, future studies may be able to estimate to assess subtle changes in patients trajectories (41).
The presence of infiltrates was not predictive in either the machine learning or LR models. This is likely because a high proportion of children without prolonged AHRF had infiltrates noted by PICU day 2 (72%) even though all children with prolonged AHRF had infiltrates by day 2 (Table 1) (99%; p < 0.001). Similarly, although the PRISM III score was found to initially be informative, model discrimination was relatively unchanged once it was removed from the model likely because pH, hypoxemia, and age which were included in the final model are also part of the PRISM III score. We also showed that year was not an important predictor, suggesting that our model to predict severe influenza infection prediction is robust to time.
Table 1.
Characteristics of 258 Children With Influenza Virus-Related Critical Illness and No Preexisting Risk Factors for Severe Disease
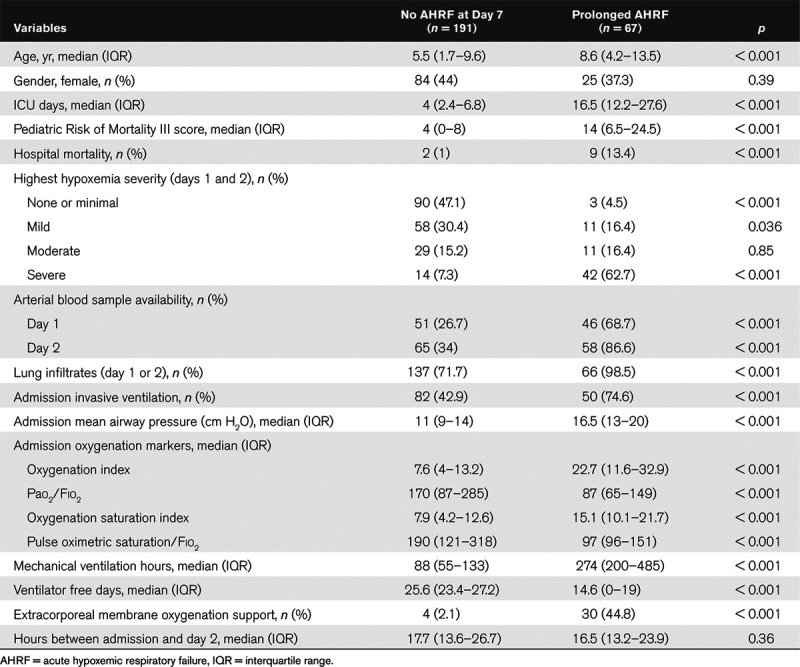
Death was uncommon in our cohort and most of them occurred 3–4 weeks after PICU admission (Fig. 3) with prolonged ventilatory support. Although this may offer a window of opportunity for new therapeutic strategies, early identification of the most severe patients may decrease death and hasten recovery. The PALICC definition does not specify how to categorize severity for noninvasive ventilation or ECMO. This is problematic in severe pediatric influenza infection, where ECMO use is frequent as seen in the literature (42), and in our cohort, where nearly 45% of the prolonged AHRF cohort had ECMO support. As ARDS severity definitions have in the past been based solely on their association with hospital mortality, we believe that ECMO should be classified as severe AHRF or ARDS.
Figure 3.
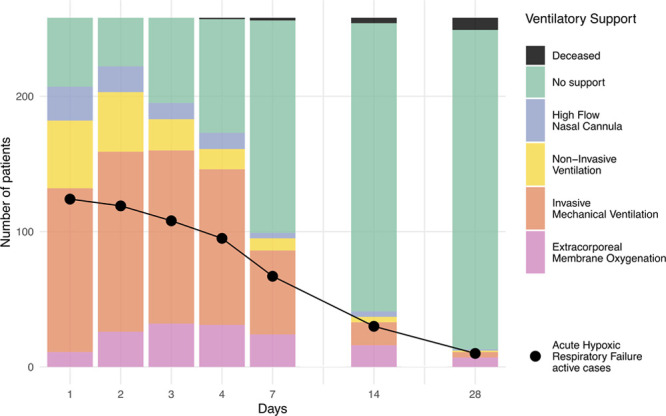
Daily ventilation modalities and acute hypoxic respiratory failure proportion over time.
Our study has strengths. First, it is one of the largest pediatric cohorts with AHRF related to influenza virus infection. Our model had low bias with good generalizability and excellent discrimination (AUROC > 0.90). Although we found no direct comparison in the literature for sustained PARDS prediction, the AUROC for ARDS mortality in the literature ranges from 0.60 to 0.84 (8–13, 17, 43). Second, because many clinical variables are missing that limit the ability to diagnose PARDS, our study provides a clinically useful definition of AHRF that can be done using the available variables in clinical practice.
Our study also has limitations. First, we do not have an external validation cohort. This limitation is mitigated in part by the multicentric design and use of Monte Carlo cross validation methods. Second, bacterial coinfection is a known risk factor for more severe and sustained PARDS (21). However, we did not include coinfection in the predictive models because it is a difficult diagnosis to make prospectively at day 2 (21, 44). Third, the outcome was treated as a binary variable, without incorporating mortality. Because we documented only two deaths (0.8%) before the seventh day, a composite outcome would probably have been influenced minimally by survival. Furthermore, patients with significant comorbidities that were associated with lung disease were excluded from this study, precluding the use of the model in this population. However, those patients were already known to be more at risk of prolonged AHRF (1).
CONCLUSIONS
In our observational prospective multicentric study, prolonged AHRF at 1 week for children with severe influenza is strongly associated with the initial respiratory severity and its evolution by day 2 and is associated with a significantly higher mortality, morbidity. Our model may help future trials to target the most severe group in the first 24 hours after admission and may guide PICU managers to anticipate resources that would be required in case of the emergence of a novel influenza virus. External validation is needed before it can be used at the bedside.
ACKNOWLEDGEMENTS
The following Pediatric Acute Lung Injury and Sepsis Investigators (PALISI) Pediatric Intensive Care Influenza Study (PICFLU) Investigators contributed to the study design, patient enrollment, and critically appraised the manuscript making important contributions: Michele Kong, MD (Children’s of Alabama, Birmingham, AL); Ronald C. Sanders Jr., MD, MS, Olivia K. Irby, MD (Arkansas Children’s Hospital, Little Rock, AR); David Tellez, MD (Phoenix Children’s Hospital, Phoenix, AZ); Katri Typpo, MD (Diamond Children’s Medical Center, Tucson, AZ); Barry Markovitz, MD (Children’s Hospital Los Angeles, Los Angeles, CA); Natalie Cvijanovich, MD, Heidi Flori, MD (UCSF Benioff Children’s Hospital Oakland, Oakland, CA); Adam Schwarz, MD, Nick Anas, MD (Children’s Hospital of Orange County, Orange, CA); Patrick McQuillen, MD (UCSF Benioff Children’s Hospital, San Francisco, CA); Peter Mourani, MD (Children’s Hospital Colorado, Aurora, CO); John S. Giuliano Jr., MD (Yale-New Haven Children’s Hospital, New Haven, CT); Gwenn McLaughlin, MD (Holtz Children’s Hospital, Miami, FL); Matthew Paden, MD, Keiko Tarquinio, MD (Children’s Healthcare of Atlanta at Egleston, Atlanta, GA); Bria M. Coates, MD (Ann & Robert H. Lurie Children’s Hospital of Chicago, Chicago, IL); Neethi Pinto, MD, Juliane Bubeck Wardenburg, MD, PhD, (The University of Chicago Medicine Comer Children’s Hospital, Chicago, IL); Janice Sullivan, MD and Vicki Montgomery, MD, FCCM (University of Louisville and Norton Children’s Hospital, Louisville, KY); Adrienne G. Randolph, MD, MSc, Anna A. Agan, MPH, Tanya Novak, PhD, Margaret M. Newhams, MPH (Boston Children’s Hospital, Boston, MA); Melania Bembea, MD, MPH, Sapna R. Kudchadkar, MD, PhD (John’s Hopkins Children’s Center, Baltimore, MD); Stephen C. Kurachek, MD (Children’s Hospital and Clinics of Minnesota, Minneapolis, MN); Mary E. Hartman, MD (St. Louis Children’s Hospital, St. Louis, MO); Edward J. Truemper, MD, Sidharth Mahapatra, MD, PhD (Children’s Hospital of Nebraska, Omaha, NE); Sholeen Nett, MD, Daniel L. Levin, MD (Children’s Hospital at Dartmouth-Hitchcock, Lebanon, NH); Kate G. Ackerman, MD (Golisano Children’s Hospital, Rochester, NY); Ryan Nofziger, MD, FAAP (Akron Children’s Hospital, Akron, OH); Steven L. Shein, MD (Rainbow Babies and Children’s Hospital, Cleveland, OH); Mark W. Hall, MD (Nationwide Children’s Hospital, Columbus, OH); Neal Thomas, MD (Penn State Hershey’s Children’s Hospital, Hershey, PA); Scott L. Weiss, MD, Julie Fitzgerald, MD, PhD (The Children’s Hospital of Philadelphia, Philadelphia, PA); Renee Higgerson, MD (Dell Children’s Medical Center of Central Texas, Austin, TX); Laura L. Loftis, MD (Texas Children’s Hospital, Houston, TX); Rainer G. Gedeit, MD (Children’s Hospital of Wisconsin, Milwaukee, WI).
Supplementary Material
Footnotes
The Pediatric Acute Lung Injury and Sepsis Investigators (PALISI) Pediatric Intensive Care Influenza (PICFLU) Network Investigators are listed in the Acknowledgments.
Dr. Randolph oversaw all aspects of the study including design, funding, data management, and analysis. Drs. Sauthier and Newhams participated in the design of the study. Data analysis was performed by Dr. Sauthier. Dr. Jouvet critically reviewed the article and assisted in data management. All authors participated in development of the article. Drs. Randolph and Sauthier are accountable for all aspects of the work.
Dr. Sauthier received funding from “Fonds de recherche du Québec en Santé” and the Université de Montréal (Faculty of Medicine). The remaining authors have disclosed that they do not have any potential conflicts of interest.
Supported in part, by, National Institutes of Health (R01AI084011 to Dr. Randolph) and the Centers for Disease Control and Prevention (to Dr. Randolph).
Supplemental digital content is available for this article. Direct URL citations appear in the HTML and PDF versions of this article on the journal’s website (http://journals.lww.com/ccejournal).
Contributor Information
Collaborators: Michele Kong, Ronald C. Sanders, Jr, Olivia K. Irby, David Tellez, Katri Typpo, Barry Markovitz, Natalie Cvijanovich, Heidi Flori, Adam Schwarz, Nick Anas, Patrick McQuillen, Peter Mourani, John S. Giuliano, Jr., Gwenn McLaughlin, Matthew Paden, Keiko Tarquinio, Bria M. Coates, Neethi Pinto, Juliane Bubeck Wardenburg, Janice Sullivan, Vicki Montgomery, Adrienne G. Randolph, Anna A. Agan, Tanya Novak, Margaret M. Newhams, Melania Bembea, Sapna R. Kudchadkar, Stephen C. Kurachek, Mary E. Hartman, Edward J. Truemper, Sidharth Mahapatra, Sholeen Nett, Daniel L. Levin, Kate G. Ackerman, Ryan Nofziger, Steven L. Shein, Mark W. Hall, Neal Thomas, Scott L. Weiss, Julie Fitzgerald, Renee Higgerson, Laura L. Loftis, and Rainer G. Gedeit
REFERENCES
- 1.Jouvet P, Hutchison J, Pinto R, et al. ; Canadian Critical Care Trials Group H1N1 Collaborative. Critical illness in children with influenza A/pH1N1 2009 infection in Canada. Pediatr Crit Care Med. 2010; 11:603–609 [DOI] [PubMed] [Google Scholar]
- 2.Randolph AG, Vaughn F, Sullivan R, et al. ; Pediatric Acute Lung Injury and Sepsis Investigator’s Network and the National Heart, Lung, and Blood Institute ARDS Clinical Trials Network. Critically ill children during the 2009-2010 influenza pandemic in the United States. Pediatrics. 2011; 128:e1450–e1458 [DOI] [PMC free article] [PubMed] [Google Scholar]
- 3.Ampofo K, Gesteland PH, Bender J, et al. Epidemiology, complications, and cost of hospitalization in children with laboratory-confirmed influenza infection. Pediatrics. 2006; 118:2409–2417 [DOI] [PubMed] [Google Scholar]
- 4.Schrag SJ, Shay DK, Gershman K, et al. ; Emerging Infections Program Respiratory Diseases Activity. Multistate surveillance for laboratory-confirmed, influenza-associated hospitalizations in children: 2003-2004. Pediatr Infect Dis J. 2006; 25:395–400 [DOI] [PubMed] [Google Scholar]
- 5.Kumar A, Zarychanski R, Pinto R, et al. ; Canadian Critical Care Trials Group H1N1 Collaborative. Critically ill patients with 2009 influenza A(H1N1) infection in Canada. JAMA. 2009; 302:1872–1879 [DOI] [PubMed] [Google Scholar]
- 6.Khemani RG, Smith LS, Zimmerman JJ, et al. ; Pediatric Acute Lung Injury Consensus Conference Group. Pediatric acute respiratory distress syndrome: Definition, incidence, and epidemiology: Proceedings from the pediatric acute Lung injury consensus conference. Pediatr Crit Care Med. 2015; 16:S23–S40 [DOI] [PubMed] [Google Scholar]
- 7.Ranieri VM, Rubenfeld GD, Thompson BT, et al. Acute respiratory distress syndrome: The Berlin definition. JAMA - J Am Med Assoc. 2012; 307:2526–2533 [DOI] [PubMed] [Google Scholar]
- 8.Gajic O, Dabbagh O, Park PK, et al. ; U.S. Critical Illness and Injury Trials Group: Lung Injury Prevention Study Investigators (USCIITG-LIPS). Early identification of patients at risk of acute lung injury: Evaluation of lung injury prediction score in a multicenter cohort study. Am J Respir Crit Care Med. 2011; 183:462–470 [DOI] [PMC free article] [PubMed] [Google Scholar]
- 9.Villar J, Ambrós A, Soler JA, et al. ; Stratification and Outcome of Acute Respiratory Distress Syndrome (STANDARDS) Network. Age, PaO2/FIO2, and plateau pressure score: A proposal for a simple outcome score in patients with the acute respiratory distress syndrome. Crit Care Med. 2016; 44:1361–1369 [DOI] [PubMed] [Google Scholar]
- 10.Chen WL, Lin WT, Kung SC, et al. The value of oxygenation saturation index in predicting the outcomes of patients with acute respiratory distress syndrome. J Clin Med. 2018; 7:205. [DOI] [PMC free article] [PubMed] [Google Scholar]
- 11.Lai CC, Sung MI, Liu HH, et al. The ratio of partial pressure arterial oxygen and fraction of inspired oxygen 1 day after acute respiratory distress syndrome onset can predict the outcomes of involving patients. Medicine (Baltimore). 2016; 95:e3333. [DOI] [PMC free article] [PubMed] [Google Scholar]
- 12.Spicer AC, Calfee CS, Zinter MS, et al. A simple and robust bedside model for mortality risk in pediatric patients with acute respiratory distress syndrome. Pediatr Crit Care Med. 2016; 17:907–916 [DOI] [PMC free article] [PubMed] [Google Scholar]
- 13.Hu CAA, Chen CM, Fang YC, et al. Using a machine learning approach to predict mortality in critically ill sectional influenza patients: A cross- retrospective multicentre study in Taiwan. BMJ Open. 2020; 10:1–10 [DOI] [PMC free article] [PubMed] [Google Scholar]
- 14.Johnson AE, Ghassemi MM, Nemati S, et al. Machine learning and decision support in critical care. Proc IEEE Inst Electr Electron Eng. 2016; 104:444–466 [DOI] [PMC free article] [PubMed] [Google Scholar]
- 15.Zampieri FG, Costa EL, Iwashyna TJ, et al. ; Alveolar Recruitment for Acute Respiratory Distress Syndrome Trial Investigators. Heterogeneous effects of alveolar recruitment in acute respiratory distress syndrome: A machine learning reanalysis of the alveolar recruitment for acute respiratory distress syndrome trial. Br J Anaesth. 2019; 123:88–95 [DOI] [PubMed] [Google Scholar]
- 16.Goligher EC, Tomlinson G, Hajage D, et al. Extracorporeal membrane oxygenation for severe acute respiratory distress syndrome and posterior probability of mortality benefit in a post hoc Bayesian analysis of a randomized clinical trial. JAMA. 2018; 320:2251–2259 [DOI] [PubMed] [Google Scholar]
- 17.Khemani RG, Smith L, Lopez-Fernandez YM, et al. Paediatric acute respiratory distress syndrome incidence and epidemiology (PARDIE): An international, observational study. Lancet Respir Med. 2018; 2600:1–14 [DOI] [PMC free article] [PubMed] [Google Scholar]
- 18.Payen V, Jouvet P, Lacroix J, et al. Risk factors associated with increased length of mechanical ventilation in children. Pediatr Crit Care Med. 2012; 13:152–157 [DOI] [PubMed] [Google Scholar]
- 19.Seneff MG, Zimmerman JE, Knaus WA, et al. Predicting the duration of mechanical ventilation. The importance of disease and patient characteristics. Chest. 1996; 110:469–479 [DOI] [PubMed] [Google Scholar]
- 20.Hall MW, Geyer SM, Guo CY, et al. ; Pediatric Acute Lung Injury and Sepsis Investigators (PALISI) Network PICFlu Study Investigators. Innate immune function and mortality in critically ill children with influenza: A multicenter study. Crit Care Med. 2013; 41:224–236 [DOI] [PMC free article] [PubMed] [Google Scholar]
- 21.Randolph AG, Xu R, Novak T, et al. ; Pediatric Intensive Care Influenza Investigators from the Pediatric Acute Lung Injury and Sepsis Investigator’s Network. Vancomycin monotherapy may be insufficient to treat methicillin-resistant staphylococcus aureus coinfection in children with influenza-related critical illness. Clin Infect Dis. 2019; 68:365–372 [DOI] [PMC free article] [PubMed] [Google Scholar]
- 22.Fleming S, Thompson M, Stevens R, et al. Normal ranges of heart rate and respiratory rate in children from birth to 18 years of age: A systematic review of observational studies. Lancet. 2011; 377:1011–1018 [DOI] [PMC free article] [PubMed] [Google Scholar]
- 23.Labarère J, Renaud B, Bertrand R, et al. How to derive and validate clinical prediction models for use in intensive care medicine. Intensive Care Med. 2014; 40:513–527 [DOI] [PubMed] [Google Scholar]
- 24.Leteurtre S, Duhamel A, Salleron J, et al. ; Groupe Francophone de Réanimation et d’Urgences Pédiatriques (GFRUP). PELOD-2: An update of the PEdiatric logistic organ dysfunction score. Crit Care Med. 2013; 41:1761–1773 [DOI] [PubMed] [Google Scholar]
- 25.Matics TJ, Sanchez-Pinto LN. Adaptation and validation of a pediatric sequential organ failure assessment score and evaluation of the sepsis-3 definitions in critically ill children. JAMA Pediatr. 2017; 171:e172352. [DOI] [PMC free article] [PubMed] [Google Scholar]
- 26.Pollack MM, Holubkov R, Funai T, et al. ; Eunice Kennedy Shriver National Institute of Child Health and Human Development Collaborative Pediatric Critical Care Research Network. The pediatric risk of mortality score: Update 2015. Pediatr Crit Care Med. 2016; 17:2–9 [DOI] [PMC free article] [PubMed] [Google Scholar]
- 27.Robin X, Turck N, Hainard A, et al. pROC: An open-source package for R and S+ to analyze and compare ROC curves. BMC Bioinformatics. 2011; 12:77. [DOI] [PMC free article] [PubMed] [Google Scholar]
- 28.Brunson JC. ggalluvial: Alluvial Plots in “ggplot2 2019
- 29.Zhang P. Model selection via multifold cross validation. Ann Stat. 1993; 21:299–313 [Google Scholar]
- 30.Hosmer DW, Hosmer T, Le Cessie S, et al. A comparison of goodness-of-fit tests for the logistic regression model. Stat Med. 1997; 16:965–980 [DOI] [PubMed] [Google Scholar]
- 31.Leisman DE, Harhay MO, Lederer DJ, et al. Development and reporting of prediction models: Guidance for authors from editors of respiratory, sleep, and critical care journals. Crit Care Med. 2020; 48:623–633 [DOI] [PMC free article] [PubMed] [Google Scholar]
- 32.Collins GS, Reitsma JB, Altman DG, et al. Transparent reporting of a multivariable prediction model for individual prognosis or diagnosis (TRIPOD): The TRIPOD statement. Ann Intern Med. 2015; 162:55–63 [DOI] [PubMed] [Google Scholar]
- 33.Breiman L. Random forrests. Mach Learn. 2001; 45:5–32 [Google Scholar]
- 34.Fernández-Delgado M, Cernadas E, Barro S, et al. Do we need hundreds of classifiers to solve real world classification problems? J Mach Learn Res. 2014; 15:3133–3181 [Google Scholar]
- 35.Liaw A, Wiener M. Classification and Regression by randomForest. R News. 2002; 2:18–22 [Google Scholar]
- 36.Pollack MM, Patel KM, Ruttimann UE. PRISM III: An updated pediatric risk of mortality score. Crit Care Med. 1996; 24:743–752 [DOI] [PubMed] [Google Scholar]
- 37.Khemani RG, Rubin S, Belani S, et al. Pulse oximetry vs. PaO2 metrics in mechanically ventilated children: Berlin definition of ARDS and mortality risk. Intensive Care Med. 2015; 41:94–102 [DOI] [PubMed] [Google Scholar]
- 38.Khemani RG, Thomas NJ, Venkatachalam V, et al. ; Pediatric Acute Lung Injury and Sepsis Network Investigators (PALISI). Comparison of SpO2 to PaO2 based markers of lung disease severity for children with acute lung injury. Crit Care Med. 2012; 40:1309–1316 [DOI] [PubMed] [Google Scholar]
- 39.Slater A, Straney L, Alexander J, et al. The effect of imputation of PaO2/FIO2 from SpO2/FIO2 on the performance of the pediatric index of mortality 3. Pediatr Crit Care Med. 2020; 21:520–525 [DOI] [PubMed] [Google Scholar]
- 40.Hyland SL, Faltys M, Hüser M, et al. Machine learning for early prediction of circulatory failure in the intensive care unit. Nat Med. 2019; 26:364–373 [DOI] [PubMed] [Google Scholar]
- 41.Brossier D, Sauthier M, Mathieu A, et al. Qualitative subjective assessment of a high-resolution database in a paediatric intensive care unit—Elaborating the perpetual patient’s ID card. J Eval Clin Pract. 2020; 26:86–91 [DOI] [PubMed] [Google Scholar]
- 42.Zangrillo A, Biondi-Zoccai G, Landoni G, et al. Extracorporeal membrane oxygenation (ECMO) in patients with H1N1 influenza infection: A systematic review and meta-analysis including 8 studies and 266 patients receiving ECMO. Crit Care. 2013; 17:R30. [DOI] [PMC free article] [PubMed] [Google Scholar]
- 43.Santos RS, Silva PL, Rocco JR, et al. A mortality score for acute respiratory distress syndrome: Predicting the future without a crystal ball. J Thorac Dis. 2016; 8:1872–1876 [DOI] [PMC free article] [PubMed] [Google Scholar]
- 44.Chomton M, Brossier D, Sauthier M, et al. Ventilator-associated pneumonia and events in pediatric intensive care: A single center study. Pediatr Crit Care Med. 2018; 19:1106–1113 [DOI] [PubMed] [Google Scholar]
Associated Data
This section collects any data citations, data availability statements, or supplementary materials included in this article.


