

Abstract
Elucidating changes in sensory processing across attentional and arousal states is a major focus in neuroscience. The local/global deviant (LGD) stimulus paradigm engages auditory predictive coding over short (local deviance, LD) and long (global deviance, GD) time scales, and has been used to assay disruption of auditory predictive coding upon loss of consciousness. Our previous work (Nourski et al., 2018, J Neurosci 38:8441–52) examined effects of general anesthesia on short- and long-term novelty detection. GD effects were suppressed at subhypnotic doses of propofol, suggesting that they may be more related to task engagement than consciousness per se. The present study addressed this hypothesis by comparing cortical responses to auditory novelty during passive versus active listening conditions in awake listeners. Subjects were seven adult neurosurgical patients undergoing chronic invasive monitoring for medically intractable epilepsy. LGD stimuli were sequences of four identical vowels followed by a fifth identical or different vowel. In the passive condition, the stimuli were presented to subjects as they watched a silent TV program and were instructed to attend to its content. In the active condition, stimuli were presented in the absence of a TV program, and subjects were instructed to press a button in response to GD target stimuli. Intracranial recordings were made from multiple brain regions, including core and non-core auditory, auditory-related, prefrontal and sensorimotor cortex. Metrics of task performance included hit rate, sensitivity index, and reaction times. Cortical activity was measured as averaged auditory evoked potentials (AEPs) and event-related band power in high gamma (70–150 Hz) and alpha (8–14 Hz) frequency bands. The vowel stimuli and LD elicited robust AEPs in all studied brain areas in both passive and active conditions. High gamma responses to stimulus onset and LD were localized predominantly to the auditory cortex in the superior temporal plane and had a comparable prevalence and spatial extent between the two conditions. In contrast, GD effects (AEPs, high gamma and alpha suppression) were greatly enhanced during the active condition in all studied brain areas. The prevalence of high gamma GD effects was positively correlated with individual subjects’ task performance. The data demonstrate distinct task engagement-related effects on responses to auditory novelty across the auditory cortical processing hierarchy. The results motivate a closer examination of effective connectivity underlying attentional modulation of cortical sensory responses, and serve as a foundation for examining changes in sensory processing associated with general anesthesia, sleep and disorders of consciousness.
Keywords: Alpha suppression, auditory evoked potential, electrocorticography, high gamma, human auditory cortex
1. Introduction
The neural mechanisms of novelty detection are complex and rely on multiple interacting networks (Bekinschtein et al., 2009; Nourski et al., 2018a). The contributions of these networks vary depending on the time course of the novelty and on factors such as attention and level of arousal (Chennu et al., 2013; Näätänen et al., 1993; Nourski et al., 2018b; Simpson et al., 2002; Strauss et al., 2015; Uhrig et al., 2016). The local/global deviant (LGD) stimulus paradigm (Bekinschtein et al., 2009) engages auditory novelty detection over two time scales: hundreds of milliseconds (local deviance, LD, akin to the classic auditory oddball paradigm) and several seconds (global deviance, GD). Our previous work using intracranial recordings confirmed the contribution of distributed networks in auditory, auditory-related temporoparietal, and prefrontal cortex acting over multiple time courses to the generation of LD and GD effects (Nourski et al., 2018a). The LD effect as observed in intracranial recordings parallels the mismatch negativity recorded in scalp electroencephalography (EEG), which is classically described as occurring in the absence of task demands (pre-attentive) (Näätänen et al., 2011). In contrast, the GD effect has been associated with task- and attention-dependent components of scalp-recorded event-related potential (e.g. P3a, P3b) (Bekinschtein et al., 2009; Wacongne et al., 2011).
Previous reports indicated that a subset of both LD and GD generators are modulated by attention (Chennu et al., 2013; Näätänen et al., 1993) and level of arousal (Nourski et al., 2018b; Simpson et al., 2002; Strauss et al., 2015; Uhrig et al., 2016). These findings led to the suggestion that cortical responses to auditory novelty, especially the GD effect, could be used as biomarkers of consciousness (Faugeras et al., 2012; Strauss et al., 2015; Uhrig et al., 2016).
During slow administration of propofol for induction of general anesthesia, patients undergo a progressive change in level of consciousness. This includes transitions from awake and alert, to a drowsy sedated state with decreased vigilance, and ultimately to loss of consciousness. In a study that employed this gradual induction protocol, nearly all GD effects as well as prefrontal LD effects were suppressed during sedation by propofol prior to loss of consciousness (Nourski et al., 2018b). By contrast, auditory cortical LD effects remained largely intact. As a result, it was suggested that GD effects and prefrontal LD effects were more likely to index attention or other components of task engagement rather that consciousness per se. Indeed, while task-related activity indicates conscious sensory processing, it is not a prerequisite for it (Pitts et al., 2014; Dykstra et al., 2017).
Whether the observed suppression of LGD effects at subhypnotic doses of propofol was specific to the pharmacological effects of the drug or was a general effect of sedation or attention remains an open question. In order to define the reliable biomarkers of consciousness, a necessary step is to compare the effects of task and attention on responses to auditory novelty in awake and alert subjects. To that end, this study examined cortical responses to auditory novelty when listeners were instructed to perform a GD target detection task versus a passive listening condition in which subjects engaged in a visual task of watching and reporting on a TV program. The primary hypothesis was that GD effects would be particularly sensitive to task engagement and directed attention. Additionally, we sought to examine the extent to which cortical responsivity to auditory stimulation and LD effects were modulated by task.
Almost all of the data published to date on the intersection of task engagement and auditory novelty detection has been obtained non-invasively using EEG, in which spatial localization is indirect, or neuroimaging, in which temporal resolution is limited. The present study took advantage of superior spatial and temporal resolution offered by direct recordings in neurosurgical patients. With this approach, extensive electrode coverage was available for multiple cortical regions contributing to auditory novelty processing, including core (primary), non-core auditory cortex, auditory-related, prefrontal and sensorimotor cortex. The results of this study will aid the interpretation of responses to auditory novelty measured using non-invasive methods.
2. Materials and Methods
2.1. Subjects
Study subjects were seven adult neurosurgical patients with medically refractory epilepsy who had been implanted with intracranial electrodes to identify resectable seizure foci. Research protocols were approved by the University of Iowa Institutional Review Board and the National Institutes of Health, and written informed consent was obtained from all subjects. Research participation did not interfere with acquisition of clinically necessary data, and subjects could rescind consent for research without interrupting their clinical management. Demographic, seizure focus and electrode coverage data for each subject are presented in Table 1. Recording sites that were confirmed to be involved in seizure onset were excluded from analysis. All subjects were native English speakers. All subjects except one had left language dominance as determined by Wada tests (subject L425 did not undergo Wada testing). Two subjects (L425 and R456) were left-handed, the remaining five were right-handed.
Table 1.
Subject demographics and electrode coverage.
| Subject | Age | Sex | Number of recording sites per ROI | Seizure focus | |||||||
|---|---|---|---|---|---|---|---|---|---|---|---|
| HGPM | STP | STG | Auditory-related | Perfrontal | Sensorimotor | Other | Total | ||||
| L400 | 59 | F | 4 | 7 | 7 | 33 | 56 | 21 | 53 | 181 | L mesial temporal |
| L405 | 19 | M | 6 | 13 | 10 | 26 | 38 | 7 | 41 | 141 | L lateral frontal |
| L423 | 51 | M | 7 | 9 | 12 | 29 | 52 | 10 | 58 | 177 | L mesial temporal |
| L425 | 52 | F | 7 | 8 | 47 | 52 | 43 | 11 | 29 | 197 | L temporal pole |
| R456 | 31 | M | 4 | 4 | 25 | 72 | 39 | 19 | 45 | 208 | R mesial temporal |
| B457 | 18 | M | 13 | 7 | 0 | 13 | 27 | 19 | 33 | 112 | L mesial temporal |
| L460 | 52 | M | 5 | 7 | 13 | 24 | 67 | 8 | 40 | 164 | L mesial temporal |
| Total | 46 | 55 | 114 | 249 | 322 | 95 | 299 | 1180 | |||
F: female, HGPM: posteromedial Heschl’s gyrus; L: left; M: male, R: right; ROI, region of interest; STG: superior temporal gyrus; STP, superior temporal plane.
All subjects underwent audiometric evaluation before the study, and none was found to have hearing deficits that should impact the findings presented in this study. Subject L423 had mild-to-moderate loss (L: 30 dB HL at 2 kHz, 50 dB at 3 and 4 kHz, 45 dB at 8 kHz; R: 45 dB at 3, 4 and 8 kHz); subject L425 had mild loss (L: 30 dB HL at 8 kHz; R: 35 dB at 0.125 kHz, 30 dB at 0.25 kHz); the other five subjects had pure-tone thresholds within 25 dB HL between 250 Hz and 4 kHz. Word recognition scores, as evaluated by spondees presented via monitored live voice, were 92/92% in L423 and >96% in all other subjects. Speech reception thresholds were within 20 dB HL in all tested subjects. Cognitive function, as determined by standard neuropsychological assessments, was in the average range in all subjects.
2.2. Stimulus and procedure
Stimulus generation was controlled by a TDT RZ2 real-time processor (Tucker-Davis Technologies, Alachua, FL). Experimental stimuli were the vowels /a/ and /i/, presented in an LGD paradigm (Nourski et al., 2018a; Nourski et al., 2018b) (Fig. 1). The vowels were excised (duration 100 ms) from the steady-state vowel portions of consonant-vowel stimuli /had/ and /hid/, spoken by a female (fundamental frequency 232 Hz and 233 Hz, respectively; (Hillenbrand et al., 1995) (Fig. 1a). The vowels were normalized to the same root-mean-square amplitude and gated with 5 ms on/off ramps. On each trial, five vowels, separated by 50 ms silent intervals, were presented, with the fifth vowel being either the same as the first four (local standard, LS) or different (local deviant, LD; Fig. 1b). This difference constituted local deviance: /aaaaa/ and /iiiii/ were LS stimuli, while /aaaai/ and /iiiia/ were LD stimuli.
Figure 1:
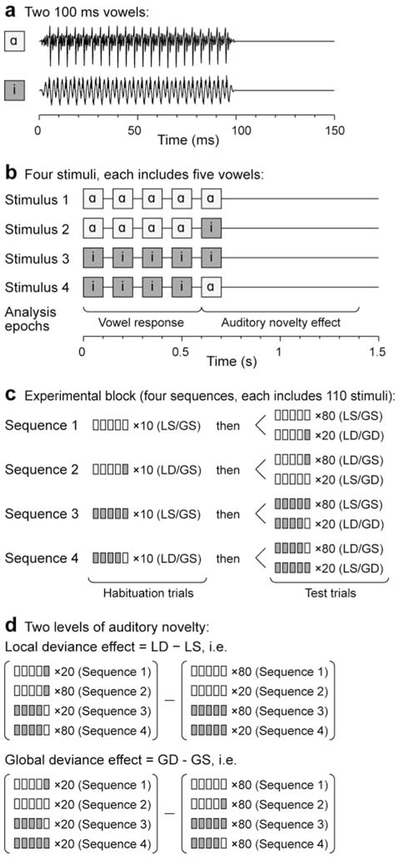
LGD experimental paradigm. a: Waveforms of the two vowel sounds /a/ and /i/ used to construct the experimental stimuli. b: Schematic of the four experimental stimuli. c: Stimulus sequences. d: Comparisons between trials to characterize local and global deviance effects. Modified from Strauss et al. (2015).
The stimuli were presented in blocks of four sequences, with the order of the sequences randomized across experiments (Fig. 1c). In most experiments, each sequence began with 10 habituation trials that established the global standard (GS) stimulus (e.g. /aaaai/ for Sequence 2), and then by 80 GS trials and 20 global deviant (GD) trials, presented in a pseudorandom order. The difference in presentation frequency thus constituted the global deviance, and the identity of the GD stimulus changed across the four sequences within each block. This design allowed for the simultaneous evaluation of responses to auditory novelty on two different time scales (local and global; Fig. 1d). The inter-trial interval varied within a Gaussian distribution (onset-to-onset mean 1500 ms, standard deviation 10 ms) to reduce heterodyning in the recordings secondary to power line noise. The duration of the experimental block was 11 minutes (400 ~1.5 s trials and four 15 s instruction segments).
Each experimental block including four stimulus sequences as described above, was presented twice in all subjects except L400. In the first block, corresponding to the passive condition, stimuli were presented as the subjects watched a silent TV program of their choice. The subjects were instructed to attend to its content and summarize it upon the block completion. In the second block, corresponding to the active condition, the subjects were asked by the experimenter to press a button in response to GD target stimuli (“press the button every time you hear the sound sequence change”). There was a total of 80 GD target trials across the four sequences within the active condition block. The subjects were instructed to use hand ipsilateral to the hemisphere in which the majority of electrodes were implanted to operate the response button. This was done to reduce contributions of preparatory (motor planning), motor and somatosensory responses associated with the button press to recorded neural activity as opposed to auditory deviance processing per se. Subject B457, who had comparable coverage of both hemispheres, used his right hand.
In subject L400, the experimental block for the passive condition was 10 minutes long and included four sequences of 10 habituation trials plus 72 GS trials and 18 GD trials (compared to 80 GS trials and 20 GD trials presented in other subjects). Furthermore, for subject L400 the experimental block for the active condition included a recorded instruction at the beginning of each sequence that defined the task and the target (GD) stimulus to the subject, e.g., for Sequence 2: “This time, press the button when you hear this sound: /aaaaa/. Once again, press the button when you hear this sound: /aaaaa/.” This was followed by 10 GS habituation trials and then by 72 GS trials and 18 GD target trials. Thus, in this subject, there was a total of 72 GD target trials across the four sequences within the block.
Stimuli were delivered to both ears via insert earphones (ER4B, Etymotic Research, Elk Grove Village, IL) that were integrated into custom-fit earmolds. Acoustic stimulation was performed at a comfortable level, typically 60–65 dB SPL.
2.3. Recording
Electrocorticography (ECoG) recordings were made using depth and subdural electrodes (Ad-Tech Medical, Racine, WI) placed on the basis of clinical requirements to identify seizure foci (Nagahama et al., 2018). Electrode implantation, recording and ECoG data analysis have been previously described in detail (Howard et al., 2000; Howard et al., 1996; Nourski et al., 2015a; Reddy et al., 2010). Depth electrode arrays (8–12 cylindrical macro contacts, spaced 5 mm apart) targeting superior temporal plane (STP), including Heschl’s gyrus, were stereotactically implanted along the anterolateral-to-posteromedial axis of the gyrus. Additional arrays targeted insular cortex and provided coverage of posteromedial portion of Heschl’s gyrus (HGPM), planum temporale and planum polare. This configuration was clinically warranted, as it bracketed epileptogenic zones from dorsal, ventral, medial and lateral aspects, providing a more accurate assessment of suspected temporal lobe seizure foci than could be achieved with subdural electrodes alone (Nagahama et al., 2018). Depth electrodes that targeted mesial temporal lobe structures (amygdala and hippocampus) provided additional coverage of auditory-related cortex within superior temporal sulcus.
Subdural arrays consisted of platinum-iridium disc electrodes (2.3 mm exposed diameter, 5–10 mm inter-electrode distance) embedded in a silicon membrane. Subdural strip and grid arrays were implanted over lateral and ventral surfaces of temporal and frontal lobe, and lateral parietal cortex. A subgaleal electrode was used as a reference in all subjects.
Reconstruction of the anatomical locations of implanted electrodes and their mapping onto a standardized set of coordinates across subjects was performed using FreeSurfer image analysis suite (Version 5.3; Martinos Center for Biomedical Imaging, Harvard, MA) and in-house software (see Nourski et al., 2014, for details). In brief, subjects underwent whole-brain high-resolution T1-weighted structural magnetic resonance imaging (MRI) scans (resolution and slice thickness <1.0 mm) before electrode implantation. After electrode implantation, subjects underwent MRI and thin-slice volumetric computerized tomography (CT) (resolution and slice thickness <1.0 mm) scans. Locations of the depth and subdural electrode contacts were first extracted from post-implantation MRI and CT scans, respectively. These were then projected onto preoperative MRI scans using non-linear three-dimensional thin-plate spline morphing, aided by intraoperative photographs. Data from multiple subjects were pooled by transforming the electrode locations into standard Montreal Neurological Institute (MNI) coordinates. This was done for each contact using linear co-registration to the MNI152 T1 average brain, as implemented in FMRIB Software library (Version 5.0; FMRIB Analysis Group, Oxford, UK). Right hemisphere MNI x-axis coordinates (xMNI) were multiplied by (−1) to map them onto the left-hemisphere common space. Contact locations were then projected onto the left lateral hemispheric surface and left STP of the FreeSurfer average template brain.
Electrode coverage in all subjects is summarized in Table 1 and Supplementary Figure 1. Regions of interest (ROIs) included (in roughly ascending hierarchical order):
HGPM (core auditory cortex);
STP (non-core auditory areas), including anterolateral portion of Heschl’s gyrus (HGAL; n = 18 sites), planum temporale (n = 23) and planum polare (n = 14);
Superior temporal gyrus (STG) (non-core auditory cortex);
Auditory-related cortex, including insula (n = 32), superior temporal sulcus (n = 11), middle temporal (n = 136), supramarginal (n = 51) and angular gyrus (n = 32);
Prefrontal cortex, including inferior (IFG; n = 60), middle (MFG; n = 95) and superior (SFG; n = 60) frontal gyrus, orbital (n = 86), transverse frontopolar gyrus (n = 10) and anterior cingulate cortex (n = 11);
Sensorimotor cortex, including precentral (n = 58) and postcentral gyrus (n = 37).
Other regions, with a more limited electrode coverage or those deemed of lesser relevance to the auditory processing hierarchy, included inferior temporal gyrus (n = 55), temporal pole (n = 54), premotor cortex (n = 36), amygdala (n = 23), cingulate gyrus (n = 21), hippocampus (n = 20), parahippocampal gyrus (n = 17), fusiform gyrus (n = 15), gyrus rectus (n = 15), superior parietal lobule (n = 9), inferior occipital gyrus (n = 8), middle occipital gyrus (n = 7), caudate nucleus (n = 5), frontal operculum (n = 5), cuneus (n = 2), intraparietal sulcus (n = 2), subcallosal gyrus (n = 2), globus pallidus (n = 1), lingual gyrus (n = 1) and putamen (n = 1).
Assignment of recording sites to ROIs was based on anatomical reconstructions of electrode locations in each subject. For subdural arrays, it was informed by automated parcellation of cortical gyri (Destrieux et al., 2010; Destrieux et al., 2017) as implemented in the FreeSurfer software package. For depth electrodes, ROI assignment was informed by MRI sections along sagittal, coronal and axial planes. Recording sites identified as seizure foci or those characterized by excessive noise, and (for depth electrode contacts) location in white matter or outside brain, were excluded from analyses and thus are not listed in Table 1.
ECoG data acquisition was performed using a Neuralynx Atlas System (Neuralynx, Bozeman, MT). Recorded data were amplified, filtered (0.1–500 Hz bandpass, 5 dB/octave rolloff), digitized at a sampling rate of 2000 Hz and stored along with timing of button-press events for subsequent offline analysis.
2.4. Analysis
Behavioral performance in the target detection task was assayed by accuracy (hit rate, expressed as percentage of correctly detected target stimuli), sensitivity (d’, calculated as Zhit - Zfalse alarm, where Z is the inverse of the cumulative distribution function of the normal distribution) and reaction times (RTs). Only button presses that occurred between the onset of the 5th vowel and the onset of the next trial (i.e. ~900 ms after the 5th vowel onset; see Fig. 1) were considered hits. Button presses that overlapped with the next non-target trial were considered false alarms. The behavioral results thus likely somewhat underestimated the actual target detection rates and biased the RTs towards faster responses.
Electrophysiological data obtained from each recording site were downsampled to 1000 Hz and denoised using a demodulated band transform-based procedure (Kovach et al., 2016), followed by a power line notch filter (6th order Chebyshev type II, 58–62 Hz stopband, 80 dB stopband attenuation). Voltage deflections exceeding five standard deviations from the across-block mean for each recording site were considered artifacts, and trials containing such deflections were excluded from further analysis. Data analysis was performed using custom software written in MATLAB Version 2019a programming environment (MathWorks, Natick, MA, USA).
For visualization purposes, recorded electrophysiological data were analyzed in the time domain as the averaged evoked potential (AEP) and in time-frequency plane as event-related band power (ERBP). The latter was computed using demodulated band transform approach, developed in-house (Kovach et al., 2016); software available at https://github.com/ckovach/DBT). ERBP was calculated within overlapping frequency windows of variable (between 1 and 20 Hz) bandwidth for theta (center frequencies 4–8 Hz, 1 Hz step), alpha (8–14 Hz, 2 Hz step), beta (14–30 Hz, 4 Hz step), gamma (30–70 Hz, 10 Hz step) and high gamma (70–150 Hz, 20 Hz step) bands. For each center frequency, the squared modulus of the complex signal was log-transformed, segmented into single trial epochs, normalized by subtracting the mean log power within a reference interval (100–200 ms before stimulus onset in each trial), and averaged over trials to obtain ERBP for each center frequency. Average ERBP was computed across all stimulus trials to demonstrate vowel responses, and across LS, LD, GS and GD trials to demonstrate responses specific to these stimulus conditions.
For quantitative analysis, three signals of interest were extracted from the recorded electrophysiological data: AEPs, alpha ERBP and high gamma ERBP. Alpha and high gamma power was calculated for each recording site by bandpass filtering the ECoG signal (300th order finite impulse response filter, 8–14 Hz and 70–150 Hz passband for alpha and high gamma, respectively), followed by Hilbert envelope extraction. Power envelope waveforms were then log-transformed and, for each of the four sequences within the experimental block (see Fig. 1c), normalized to the mean power over the duration of that sequence.
AEPs and ERBP representing vowel responses, i.e. response to the first four vowels of the stimulus prior to the onset of deviance defined by the fifth vowel, were computed by time-domain averaging of single-trial waveforms across all test trials (see Fig. 1c). Responses to local and global auditory novelty (herein termed LD and GD effects) were computed as the difference between averaged responses to standard and deviant trials (see Fig. 1d).
Statistical significance of vowel responses was established within the time interval between 0 and 600 ms following the onset of the first vowel by comparing average response waveforms to surrogate averages of random-onset trials. Statistical significance of LD and GD effects was established within the time interval between 0 and 800 ms following the onset of the fifth vowel. Significance was established using a non-parametric cluster-based permutation test (Maris et al., 2007; Nourski et al., 2018a). The test statistic was based on grouping adjacent time points that exhibited a significant difference between the two sets of trials (e.g. LS vs. LD). The cluster statistic was constructed by first computing two-sample t-statistics across all time points for each recording site. For each time point, t-values were compared to a threshold corresponding to the 1st percentile tail of the T-distribution. The threshold was the 99.5th percentile for two-tailed tests for AEP and 99th percentile for the one-tailed tests for high gamma and alpha data. One-tailed tests were used for high gamma ERBP, as vowel responses and LGD effects in this band were defined as power increases. Likewise, one-tailed tests were used for alpha power, as LGD effect of interest was alpha suppression.
Clusters were defined as consecutive time points for which the t-statistic exceeded the threshold. The cluster-level statistic was computed as the sum of the t-values within each cluster. The significance level (p-value) of those statistics was calculated using permutation tests. To construct the permutation distribution, 10,000 random trial partitions were made and shuffled with respect to trial labels (onset time-locked response vs random-onset surrogate for vowel responses, and standard vs. deviant trials for LGD effects), the cluster statistics were calculated, and the largest cluster-level statistic was identified for each partition. This process yielded a 10,000-sample distribution set of the test statistics. Monte Carlo p-values were calculated for each cluster based on this permutation distribution (Phipson et al., 2010). To correct for multiple comparisons across recording sites, p-values were adjusted by controlling the false discovery rate (FDR) (Benjamini et al., 1995). Vowel responses and LGD effects were considered significant at p < 0.05. Recording sites with at least one significant vowel response or LGD effect cluster were considered as exhibiting the response/effect.
ROIs differing in proportion of responsive sites between active versus passive conditions were assessed by fitting logistic mixed effects models for the effect of condition, with random effects for subject. Models were fit using Markov chain Monte Carlo simulations (Hadfield, 2010) with weak priors. P-values were FDR-corrected across ROIs within each measure and response type (significance threshold p = 0.05). The detailed time course of each response was characterized by summing significant clusters across recording sites in all subjects in each ROI at each time point between 0 and 600 ms following the first vowel onset (for vowel responses) and between 0 and 800 ms following the fifth vowel onset (for LGD effects).
Changes in the magnitude of AEP vowel responses and LGD effects were computed as the modulation index (MI) for each site that exhibited a significant vowel response or deviance effect in either active or passive condition:
where RA and RP are the magnitude (see below) of the vowel response or LGD effect in the active and passive condition, respectively.
As significant vowel responses and LGD effects were typically limited in time, it was overly conservative to compute RA and RP over the entire analysis windows (i.e. between 0 and 600 ms following the first vowel onset for vowel responses and between 0 and 800 ms following the fifth vowel onset for LGD effects). Instead, the analysis window was restricted to the time interval encompassing the 2.5th through 97.5th percentile of latency values across all subjects and all ROIs, as follows.
For the AEP vowel response, R was calculated as the root mean square (RMS) amplitude of the AEP waveform within the time interval of 56 and 585 ms after the first vowel onset. For the AEP LD and GD effects, R was calculated as the RMS amplitude of the AEP difference waveform (deviant minus standard) within the time interval of 57–737 and 116–788 ms after the fifth vowel onset, respectively. MI values were not computed for high gamma and alpha ERBP, as the values of RA and RP in the equation above are required to be non-negative.
Condition-related modulation of response magnitude was tested for significance on a single-site level using permutation tests. Surrogate MI values (10,000 permutation samples) were computed by shuffling trial labels between active and passive conditions. Significance threshold was set at p = 0.05, i.e. MI values below 2.5th or above 97.5th percentile of the surrogate MI distribution were considered significant. On the ROI level, significant condition-related changes in response magnitude were determined using one-sample Wilcoxon signed rank tests, comparing median MI (termed ) within a given ROI to zero. Significance threshold was set at p = 0.05, FDR-corrected for multiple comparisons. Difference in vowel response MI values between IFG, MFG and SFG sites within prefrontal cortex was evaluated using a Kruskal-Wallis test.
The relationship between cortical activity and target detection task performance was examined by computing linear correlation coefficients between percentages of sites within auditory and auditory-related cortex that exhibited significant responses/effects during the task in each subject, and the subjects’ hit rates.
3. Results
3.1. Task performance
All subjects were presented with two experimental stimulus blocks. In the first, stimuli were presented as the subjects watched a silent TV program of their choice (passive condition). All subjects successfully summarized the program upon block completion, indicative of their awake and alert state. In the second block, the subjects were asked to press a button in response to GD target stimuli (active condition). The subjects exhibited variable performance in the GD target detection task (Fig. 2a). Hit rates varied from 24.1% (L423) to 74.7% (L460) (Fig. 2b, upper panel), while d’ varied from 0.543 in subject L423 to 2.33 in subject L460 (Fig. 2b, middle panel). The grand median RT across subjects was 527 ms (Fig. 2b, lower panel). This wide range of behavioral performance enabled examination of the association between electrophysiologic responses and task performance (see below).
Figure 2:

GD target detection task performance. Summary of data from seven subjects. a: Hit rates (% correctly detected target stimuli). b: Sensitivity (d’). c: Reaction times (RTs). Violin plots depict RT distributions and median values. Dashed line corresponds to the grand median RT across all subjects and hit trials (0.527 s).
3.2. Exemplar data
Regional differences in responses to the vowel stimuli and auditory novelty are exemplified by neural activity recorded in subject L400 in Figure 3. Figure 3a depicts electrode coverage of different ROIs in this subject, and also illustrates the seizure focus in the left mesial temporal lobe. Figure 3b presents examples of responses to the experimental stimuli and LGD effects recorded from three cortical regions: core auditory cortex (HGPM), non-core auditory cortex (HGAL within STP) and prefrontal cortex (MFG). AEP waveforms are shown underneath time-frequency ERBP plots. As expected, the AEP and ERBP in core auditory cortex (site A) were time-locked to each vowel regardless of the listening condition. Initial excitation in high and low frequency band components was followed by pronounced suppression spanning theta and alpha frequency bands. Activity in HGAL (site B), 2.5 cm from site A, was markedly different, with slower responses and minimal representation of the stimulus envelope. These responses, however, were also similar in magnitude and time course in the active and passive listening conditions. Minimal activity was observed in the MFG in response to the initial four vowels in either listening condition, as illustrated by site C.
Figure 3.
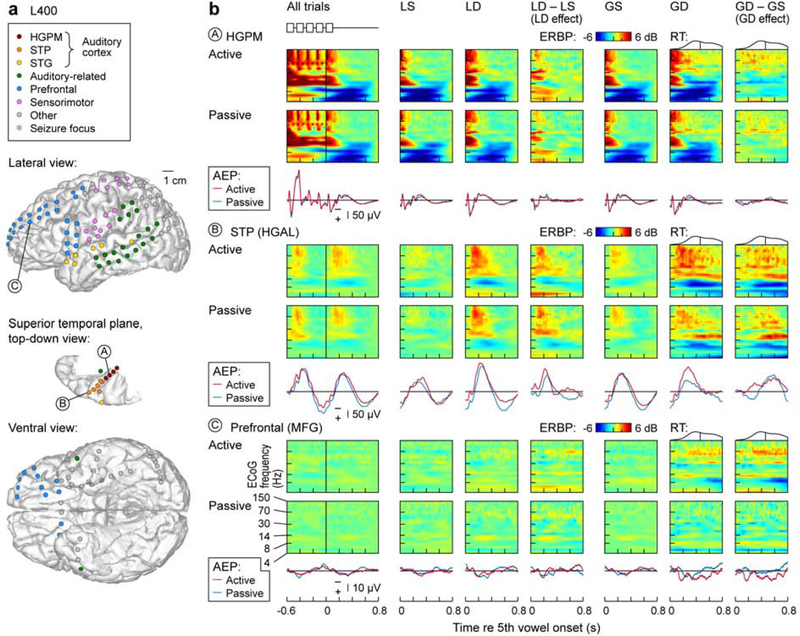
Responses to vowels and auditory novelty. Exemplary data from subject L400. a: Electrode coverage. Lateral view of the left cerebral hemisphere, top-down view of the left superior temporal plane (STP) and the bottom-up view of the ventral brain surface are shown on top, middle and bottom, respectively. Recording sites are color-coded according to ROI (see Methods). Exemplary sites in core auditory cortex (posteromedial portion of Heschl’s gyrus, HGPM), non-core auditory cortex (anterolateral portion of Heschl’s gyrus, HGAL) and prefrontal cortex (middle frontal gyrus, MFG) are labeled A, B and C respectively. b: Exemplary responses to the experimental stimuli and LGD effects recorded from three cortical sites (A, B and C, as shown in panel a). Averaged evoked potential (AEP) waveforms (active block: red; passive block: blue) are plotted underneath time-frequency event-related band power (ERBP) plots of responses recorded during active and passive block. Columns, from left to right: responses to vowels averaged across all trials (stimulus schematic shown on top); responses to LS trials; responses to LD trials; difference between LS and LD responses (LD effect); responses to GS trials; responses to GD trials; difference between GS and GD responses (GD effect). Distribution of reaction times (RTs) and median RT is shown above GD and GS-GD panels. Note that the X-axis in the leftmost column begins at the onset of the 1st vowel; in all other columns the x-axis begins at the onset of the 5th vowel.
Comparison of responses elicited by the fifth vowel when it was an LS or an LD revealed the presence of LD effects in auditory cortex. In HGPM, LD effects were apparent both during active and passive paradigms. Likewise, marked LD effects were seen in HGAL in both conditions. These effects manifested as an AEP, increase in high gamma ERBP and suppression in alpha ERBP. Once again, minimal activity was observed at the MFG site.
The GD effect, measured as the difference between responses to GS and GD trials following the onset of the fifth vowel, was more prominent in the active than passive condition in HGAL and MFG, but not HGPM. This is apparent in both GD and GD – GS AEP waveform plots (i.e. red traces exhibit larger deviations from baseline than blue traces), but is especially apparent in the time-frequency plots. For example, at the recording site in HGAL, the time-frequency plots were similar for GS trials in active and passive conditions, but the GD and the GD-GS plots exhibited larger increases in high gamma ERBP and greater suppression in the alpha frequency band for the active condition. The same trend is apparent for the recording site in MFG. The emergence of an evoked potential associated with GD in the active condition was also observed at the MFG site.
3.3. Vowel responses
The extent of cortical activation by the vowel stimuli in each ROI across all subjects was quantified as the percentage and number of sites that exhibited a significant AEP or high gamma ERBP response (Fig. 4; see Supplementary Figure 2 and Supplementary Figure 3 for percentage and number of sites in each subject, respectively). Figure 4a compares the percentages of responsive sites between the passive and the active conditions (abscissa and ordinate, respectively). Activity was similar in both conditions in all ROIs, as evidenced by the proximity of data points to the diagonal. There were no significant changes in the proportions of responsive sites between the two conditions in all ROIs (p > 0.05 for all ROIs).
Figure 4.

Vowel responses in passive and active conditions. a: Percentages of responsive sites within each ROI across all 7 subjects in the passive and active condition are plotted on abscissa and ordinate, respectively. None of the differences in percentage reached statistical significance threshold (p = 0.05, Fisher exact test, FDR-corrected). b: Distribution of sites that exhibited significant responses in the passive (blue), active (red) or both conditions (light gray), shown for AEP and high gamma ERBP (left and right panel, respectively). Summary of data from 7 subjects, plotted in MNI coordinate space and projected onto FreeSurfer average template brain. Top-down views of the left superior temporal plane are plotted underneath side views of the right lateral hemispheric convexity, aligned with respect to the yMNI coordinate. c: Time course of vowel responses. Number of sites within each ROI, exhibiting significant vowel responses are plotted as a function of time after the stimulus onset for AEP and high gamma in left and right panel, respectively. Values above and below the horizontal axis represent site counts for the active and passive condition, respectively.
The vast majority of sites in HGPM, STP and on the lateral surface of the STG exhibited significant AEP responses in both conditions. This can be seen in Figure 4b, which depicts the spatial distribution of significant AEP and high gamma responses with regard to the two conditions and the MNI coordinates of the recording sites (light gray symbols represent sites that had significant responses in both conditions). Sites exhibiting preferential AEP responses in one condition but not the other were distributed widely and not concentrated in specific ROIs (blue and red symbols). Across all seven subjects, significant AEP vowel responses were observed only during the passive condition, only during the active condition, and during both conditions at 99, 92 and 334 sites, respectively. By contrast, high gamma activity elicited by the vowels was more focal and clustered in the STP, posterior STG, auditory-related cortex in supramarginal gyrus and the IFG. Significant high gamma vowel responses were observed only in the passive condition, only in the active condition, and in both conditions in 31, 6 and 94 sites, respectively.
Figure 4c compares the time course of cortical activation, as indexed by the AEP and high gamma ERBP in each ROI, where responses above and below the horizontal axis represent site counts for the active and passive condition, respectively. AEPs exhibited activation throughout the duration of the stimulus that followed a similar time course in both conditions. In HGPM, the time course of high gamma activation reflected the stimulus envelope, wherein activity was time-locked to each of the four vowels. In contrast, high gamma activity in other ROIs was largely confined to the first 250 ms after stimulus onset and was primarily seen in non-core auditory cortex on the STP, with minor contributions from other ROIs. These patterns were comparable between the active and passive conditions.
In contrast to the comparable prevalence and spatial extent of responses to vowels between the two conditions, we did observe regional effects of condition on the magnitude of responses. The difference in response magnitude between the two conditions, measured as MIs of the AEPs and high gamma power, is shown for all responsive sites in Supplementary Figure 4a. MI values were thresholded based on their significance on a single-site level, as determined by permutation tests (see Methods). MI values of all responsive sites were compared to zero within each ROI. No significant difference from zero was observed in the three auditory cortex ROIs and in auditory-related cortex (p > 0.05 for all comparisons), indicating comparable RMS amplitudes of the AEPs in the two conditions. A difference between the two conditions emerged in prefrontal and sensorimotor cortex, where AEP responses were larger in the active condition (prefrontal: = 0.0550, p = 0.0489, n = 54; sensorimotor: = 0.0484, p = 0.0125, n = 67; Wilcoxon signed rank tests, FDR-corrected). Within prefrontal cortex, IFG generally exhibited the largest increases in AEP amplitude in the active compared to the passive condition ( = 0.0738, n = 25), while SFG generally featured smaller AEPs in response to the vowels during the active condition compared to passive listening ( = −0.148, n = 10). MFG sites were characterized by intermediate MI values ( = 0.0435, n = 11). A Kruskal-Wallis test revealed these differences to be significant (p = 1.57×10⁻⁴). Within sensorimotor cortex, the biggest increases in AEP amplitude associated with vowel responses in the active condition were localized to the superior aspect of the precentral gyrus, which corresponds to the arm and hand motor area. This finding may represent increased vigilance inherent in an active paradigm.
3.4. Local deviance effects
Prevalence, topography and time course of LD effects are depicted in Figure 5 (see Supplementary Figure 2 and Supplementary Figure 3 for single-subject data). For LD effects, the active condition was associated with a slightly higher percentage of responsive sites in multiple ROIs, seen in both the AEP and high gamma ERBP (Fig. 5a). There were no significant differences in the proportions of sites with LD effects in the active condition relative to the passive condition in any of the ROIs (p > 0.05 for all comparisons). AEP LD effects were observed only in the passive condition, only in the active condition, and in both conditions in 43, 92 and 151 sites, respectively (Fig. 5b). High gamma LD effects were observed only in the passive condition, only in the active condition, and in both conditions in 18, 30, and 104 sites, respectively.
Figure 5.

LD effects in passive and active conditions. See caption of Figure 4 for details.
Figure 5c compares the time course of AEP and high gamma LD effects in each ROI. Both effects followed a similar time course in the active and passive conditions. The AEP effect peaked at around 150–250 ms after the fifth vowel onset and gradually dissipated over several hundred milliseconds. The high gamma effect reached its maximum at around 150 ms and dissipated by around 300 ms. The relative magnitude of AEP LD effects, measured as MI, is shown in Supplementary Figure 4b. For responsive sites in the STG, AEP LD effects at the ROI level had larger RMS amplitude in the active compared to the passive condition ( = 0.0489, p = 0.0463, n = 54; Wilcoxon signed rank test, FDR- corrected). All other comparisons failed to reach significance.
3.5. Global deviance
The greatest difference between the passive and the active conditions was observed for neural activity associated with GD. This can be observed in Figure 6a, which shows the marked increases in prevalence of AEP and high gamma GD effects in the active compared to passive condition for all ROIs (p < 0.05; logistic regression, FDR-corrected; see Supplementary Figure 2 and Supplementary Figure 3 for single-subject data). Within the ROI labeled ‘Other’, significant AEP GD effects in the active condition were present in 24 out of 299 sites, including amygdala (n = 9/23 sites), hippocampus (n = 4/20), inferior temporal gyrus (n = 4/55), parahippocampal gyrus (n = 2/17), premotor cortex (n = 2/36), subcallosal gyrus (n = 1/2), cingulate gyrus (n = 1/21), and the temporal pole (n = 1/54). In total, significant AEP GD effects were observed only in the passive condition, only in the active condition, and in both conditions in 10, 129 and 22 sites, respectively (Fig. 6b).
Figure 6.

GD effects in passive and active conditions. a: Percentages of sites with significant GD effects within each ROI across all 7 subjects in the passive and active condition are plotted on abscissa and ordinate, respectively. Crosses and filled circles represent data points associated with non-significant and significant differences, respectively (threshold p = 0.05, Fisher exact test, FDR-corrected) between passive and active conditions. Note the different scales for AEP and high gamma. b: Distribution of sites that exhibited significant GD effects in the passive (blue), active (red) or both conditions (light gray), shown for AEP and high gamma ERBP (left and right panel, respectively). Summary of data from 7 subjects, plotted in MNI coordinate space and projected onto FreeSurfer average template brain. Top-down views of the left superior temporal plane are plotted underneath side views of the right lateral hemispheric convexity, aligned with respect to the yMNI coordinate. c: Time course of GD effects. Number of sites within each ROI, exhibiting significant GD effects are plotted as a function of time after the stimulus onset for AEP and high gamma in left and right panel, respectively. Values above and below the horizontal axis represent site counts for the active and passive condition, respectively. Distribution of reaction times (RTs) and median RT is shown as violin plots above GD time course plots for the active condition.
The active condition was associated with a significantly higher proportion of sites exhibiting high gamma GD effects compared to the passive condition in multiple ROIs. These included STG (p = 0.0252), prefrontal (p = 3.50×10⁻⁴), sensorimotor cortex (p = 0.00327) and other sampled regions (p = 3.50×10⁻⁴; logistic regression, FDR-corrected). Within the latter ROI, significant high gamma GD effects in the active condition were present in 17 sites, including ITG (n = 5 out of 55 sites), premotor cortex (n = 3/36), temporal pole (n = 3/54), gyrus rectus (n = 2/15), intraparietal sulcus (n= 1/2), parahippocampal gyrus (n = 1/17), hippocampus (n = 1/20) and cingulate gyrus (n = 1/21). Significant high gamma GD effects were observed only in the passive condition, only in the active condition, and in both conditions in 13, 82 and 20 sites, respectively.
The time course of AEP GD effect in the active condition was prolonged, with a gradual increase in the number of sites exhibiting the effect over several hundred milliseconds that persisted beyond 800 ms (Fig. 6c). This time course was also markedly prolonged compared to the AEP LD effect (cf. Fig. 5c). By contrast, when present, the activity of those sites exhibiting a significant AEP GD effect in the passive condition had latencies that generally exceeded 600 ms after the onset of the 5th vowel. High gamma GD effects mirrored those seen for the AEP, with the caveat that more sites in auditory-related and prefrontal cortex were active in the passive condition. For both active and passive conditions, the time course was delayed compared to the high gamma LD effect (cf. Fig. 5c). The overall number of sites that exhibited significant high gamma GD effects was smaller than the number of sites with AEP GD effects in both passive and active conditions (note the different Y-scale in Fig. 6c for AEP and high gamma data).
The dramatic modulation of GD effects by condition was also evident in the magnitude of the effects, as measured by the MI (see Supplementary Fig. 4c). MIs were significantly above zero in auditory-related ( = 0.226, p = 0.00458, n = 26), prefrontal ( = 0.257, p = 1.77×10⁻⁵, n = 38), sensorimotor cortex ( = 0.412, p = 2.96×10⁻⁴, n = 23) and across the other recording sites (“Other” ROI) ( = 0.288, p = 2.50×10⁻⁴, n = 24; Wilcoxon signed rank tests, FDR-corrected).
3.6. Alpha suppression
Both LD and GD stimuli were also associated with suppression of ERBP in lower ECoG frequency bands, particularly in the alpha range (8–14 Hz) (see Fig. 3). Alpha power suppression associated with LD effects was particularly prominent (both in terms of percentage and number of sites) within non-core auditory cortex in STP (Fig. 7). There were no significant differences in the proportions of sites with LD effect alpha suppression between the two conditions in any of the ROIs (p > 0.05 for all comparisons). By contrast, alpha suppression associated with GD was almost exclusively present in the active, but not the passive condition (with the exception of one STG site and two STP sites). The modulation of GD alpha suppression was significant (p < 0.05) in all ROIs. Within the “Other” ROI, significant GD alpha suppression in active condition was present in 16 sites, superior parietal lobule (n = 8/9 sites), premotor cortex (n = 3/36), temporal pole (n = 3/54), frontal operculum (n = 1/5), inferior occipital gyrus (n = 1/8).
Figure 7.

Alpha suppression LGD effects in passive and active conditions. a: Percentages of sites within each ROI across all 7 subjects that exhibited significant alpha LD and GD effects (left and right panel, respectively). Percentages of sites in the passive and active conditions are plotted on abscissa and ordinate, respectively. Crosses and filled circles represent data points associated with non-significant and significant differences, respectively (threshold p = 0.05, Fisher exact test, FDR-corrected) between passive and active conditions. b: Distribution of sites that exhibited significant alpha LD and GD effects (left and right panel, respectively) in the passive (blue), active (red) or both conditions (light gray). Summary of data from 7 subjects, plotted in MNI coordinate space and projected onto FreeSurfer average template brain. Top-down views of the left superior temporal plane are plotted underneath side views of the right lateral hemispheric convexity, aligned with respect to the yMNI coordinate. c: Time course of alpha LD and GD effects. Number of sites within each ROI, exhibiting significant LD and GD alpha suppression effects are plotted as a function of time after the fifth vowel onset in left and right panel, respectively. Values above and below the horizontal axis represent site counts for the active and passive condition, respectively. Distribution of reaction times (RTs) and median RT are shown above the GD time course plot for the active condition.
3.7. Responses to auditory stimuli, LGD effects and task performance
The relationship between the presence of vowel responses and LGD effects in the active condition and task performance was examined by computing linear correlation coefficients between percentages of responsive sites in each subject and their target hit rates. Of note, sites outside auditory and auditory-related cortex were excluded from this analysis to minimize potential contributions of activity positively correlated with the motor act of target response. This decision was made because neural activity outside of these ROI extensively overlapped with RTs (see Fig. 6c), and a previous study using a semantic classification task demonstrated that onset latency of high gamma activity paralleled RTs (Nourski et al., 2016). Regression analysis (Supplementary Fig. 5) failed to reveal significant correlations for vowel responses, LD effects and GD AEP effect (p > 0.05 for all comparisons). There was, however, a strong positive correlation between the percentage of sites with significant high gamma GD effects and the subjects’ hit rate (r = 0.894, p = 0.00661, uncorrected). High correlations with task performance were also obtained for high gamma GD effects when prefrontal sites were included (r = 0.800, p = 0.0309, uncorrected) and when both prefrontal and sensorimotor sites were included in the analysis (r = 0.876, p = 0.00974, uncorrected).
4. Discussion
4.1. Summary
The effect of task engagement on novelty processing was investigated by comparing cortical responses to auditory stimuli during active versus passive listening conditions. Three different aspects of the responses were evaluated. Strong responses to the initial portion of the vowel sequences, before the appearance of any deviants, were primarily observed in auditory and auditory-related as well as sensorimotor cortex. These responses were largely unaffected by task engagement. LD effects, reflecting auditory novelty on a short time scale, were prevalent in core and non-core auditory cortex, including STP and, to a lesser extent, lateral STG. LD effects exhibited modest enhancement in magnitude, but not prevalence, in active versus passive listening condition. For novelty detection on a longer time scale, GD effects were sparsely distributed throughout multiple cortical regions. These effects were strongly dependent on listening condition with more frequent and larger GD effects observed for the active listening condition. Alpha-band suppression was observed in response to LD and GD, and, for GD, was limited to the active listening condition. Finally, high gamma GD effects in auditory and auditory-related cortex paralleled task performance. Thus, the results of this study support the hypothesis that cortical responses to long-term auditory novelty, as elicited in the LGD paradigm, are strongly driven by task demands.
4.2. Modulation of responses to novelty by task engagement
This study did not identify task-dependent differences in the prevalence of cortical responses to the vowel stimuli measured prior to the onset of auditory novelty. This result argues against non-specific enhancement of sensory responses as the cause of the task-dependent differences in LGD effects. There were, however, larger AEP responses in prefrontal and sensorimotor cortex in the active condition, suggesting some degree of task modulation of auditory processing in these higher-order areas. This could contribute to modulation of GD effects observed in the present study.
Previous studies utilizing the LGD stimulus paradigm (Bekinschtein et al., 2009; Chennu et al., 2013), found LD effects, as indexed by scalp-recorded MMN, to be present both when the subjects were attending to the auditory stimuli, and when they were not. Quantitatively, however, LD effects were enhanced for attended compared to unattended LGD stimuli, particularly in prefrontal cortex. Consistent with these results, a reduction in the subjects’ level of arousal also affects the prevalence and the magnitude of LD effects, particularly in prefrontal cortex (Nourski et al., 2018b; Strauss et al., 2015). In our previous study on the effects of propofol anesthesia on LGD responses (Nourski et al., 2018b), the prevalence of LD effects in prefrontal cortex was reduced by two thirds when subjects were still responsive under anesthesia but had a reduced level of vigilance as evidenced by a decline in their task performance. In the present study, a relatively small percentage of sites within prefrontal cortex exhibited significant LD effects. Furthermore, no effects of task engagement on the prevalence, and only modest effects on the magnitude of LD effects, were observed. The relatively smaller attentional modulation of LD effects in the present intracranial study compared to that reported previously using scalp EEG recordings (Bekinschtein et al., 2009; Chennu et al., 2013) may in part be attributed to differences in recording methodology as well as subject cohorts (see Caveats and Limitations).
It should be acknowledged that while responses to short-term auditory novelty within prefrontal cortex may reflect engagement of attention (Chennu et al., 2013), this model has been challenged. The short latency of these responses (Yago et al., 2001) and, within IFG, their nonmonotonic relationship to the magnitude of stimulus deviance (Tse et al., 2008) suggest a role in automatic change detection, including contrast enhancement and response inhibition. Likewise, Schonwiesner et al. (2007) proposed the role of IFG in acoustic change detection as “judgement of sufficient novelty for allocation of attentional resources”. Within this model, activity in prefrontal cortex can be considered a precursor of attentional engagement rather than a manifestation of attentional allocation per se. This interpretation suggests that activation of the IFG reflects automatic mechanisms of change detection. Thus, it may be predicted to be enhanced during the GD target detection task, which is contrary to our observations.
GD effects throughout the brain were strongly modulated by task engagement in contrast to the effects produced by LD. This dependence on task engagement was the primary hypothesis tested in the present study, motivated by previously observed modulation of GD effects by the subject’s level of arousal (Nourski et al., 2018a). These results support and extend the findings of non-invasive electrophysiological studies utilizing the LGD paradigm (Bekinschtein et al., 2009; Chennu et al., 2013). Consistent with our previous reports (Nourski et al., 2018a, 2018b), this study demonstrates that the scalp-recorded potentials likely reflect contribution of sources across a broad range of cortical and subcortical networks and structures (including e.g. amygdala and hippocampus). These networks may reflect the multiple dimensions of the active listening condition, which include allocation of attention, target detection, planning and execution of a motor response to the target stimulus. All of these dimensions can be expected to contribute to the contrast between the active and the passive listening condition. The earlier components of AEP and high gamma GD effects likely incorporate attentional allocation and target detection, whereas the later components likely reflect preparation and execution of the motor response to the target stimulus. This is particularly evident in the increased contribution of prefrontal and sensorimotor cortex to high gamma GD effects at 500–600 ms that parallels the timing of behavioral responses and is only present in the active condition.
There is a strong concordance between cortical areas that generate responses to long-term auditory novelty (Bekinschtein et al., 2009; Nourski et al., 2018a), and those implicated in attentional and executive control (Huang et al., 2012; Huang et al., 2013; Salmi et al., 2009). Attentional modulation of cortical responses to novelty is further supported by scalp EEG studies, in which long-term novelty (analogous to the GD effects in the LGD paradigm) is indexed by the N2 and P3 peaks of the event-related potential, the latter including its P3a and P3b components. Lesions in prefrontal cortex result in a reduction in the amplitude of the P3 response as well as reduced behavioral orienting to novel events (Daffner et al., 2003; Daffner et al., 2000; Knight et al., 1998; Løvstad et al., 2012a). Furthermore, experiments utilizing attentional blink demonstrated that N2, P3a and P3b components of visual event-related potentials were strongly and nonlinearly suppressed by inattention and the absence of perception of stimulus (Sergent et al., 2005).
4.3. Alpha suppression
Alpha power suppression is a well-established biomarker of task engagement in multiple sensory modalities, including visual (Pfurtscheller et al., 1991; Pfurtscheller et al., 1994), somatosensory (van Ede et al., 2011) and auditory (de Pesters et al., 2016; Kerlin et al., 2010; Wostmann et al., 2019). Greater alpha power suppression has been associated with attentional allocation as well as stimulus predictability (Bauer et al., 2014). In auditory cortex, prominent alpha power suppression has been observed in HGAL (Billig et al., 2019). Further evidence for this is provided by Halgren et al. (2019), who described propagation of alpha oscillatory waves from higher order to lower order cortical regions. In the present study, alpha power suppression associated with GD effect was observed almost exclusively in the active listening condition, consistent with its role in task engagement. Furthermore, alpha suppression associated with auditory novelty was generally observed outside core auditory cortex. The LD alpha suppression effect was contributed mostly by non-core auditory cortex in the STP, consistent with the postulated role of this region as a source of oscillatory alpha activity (Billig et al., 2019). While we did find alpha suppression in core auditory cortex (see Fig. 3b), it was limited to vowel responses rather than LGD effects.
The timing of the GD alpha suppression effect overlapped with behavioral responses to target stimuli. This suggests that it may at least in part reflect preparation and execution of the motor response (Leocani et al., 1997; Pfurtscheller et al., 1999). An fMRI study of Huang et al. (2012) demonstrated activation of the superior parietal lobule associated with target discrimination (rather than novelty-triggered involuntary attention or cued voluntary attention). In the present study, two subjects had electrode coverage of the superior parietal lobule (7 sites in L400 and 2 in L423). Significant alpha suppression GD effect was present in all 7 sites in L400 and in 1 of 2 sites in L423, and the timing of the alpha suppression GD effect in SPL overlapped RTs. These findings are consistent with the role of the superior parietal lobule in target discrimination.
By contrast, the more rapid time course of alpha suppression following the onset of LD, as well as its dissociation from the behavioral task, suggests that this effect represents sensory processing per se. This again emphasizes the utility of the LGD paradigm to differentiate components of cortical activity that contribute to auditory task engagement.
4.4. Relationship with task performance
Subjects exhibited variable performance in the GD target detection task, with hit rates ranging from 24.1 to 74.7 %. This allowed an examination of relationships between hit rate and the neural activity elicited by the vowels and the two types of auditory novelty. These relationships could take the form of positive associations, i.e. better task performance reflected by a greater prevalence of cortical responses, which may help capture stimulus features relevant to the task (Brechmann et al., 2007; Gaab et al., 2003). Alternatively, one might predict negative correlations, wherein better task performance would be associated with a lower prevalence of cortical responses (Brechmann et al., 2005; Holcomb et al., 1998), reflecting a more efficient use of neural resources. It is also unclear which specific aspect(s) of cortical responses elicited in the LGD task (AEP or high gamma; vowel responses, LD or GD effects) would be more closely associated with the behavioral outcome of the task.
There was no correlation between hit rate and neural activity elicited by vowels, LD, or GD AEP effect in auditory and auditory-related cortex. In contrast, the prevalence of high gamma GD effect in individual subjects was found to be strongly correlated with their hit rate performance. This dissociation between high gamma LD and GD effects is indicative of distinct neural mechanisms contributing to processing of auditory novelty on these time scales as opposed to more general attentional modulation of cortical activity in the active condition (cf. Nourski et al., 2019). High gamma activity has been demonstrated to index underlying spiking activity (Mukamel et al., 2005; Ray et al., 2008; Steinschneider et al., 2008). This result suggests that strong outputs from auditory and auditory-related cortex that signal task-relevant auditory novelty may be a prerequisite for successful performance of the task. The positive correlation between neural activity and behavior likely in part reflects an ongoing learning process associated with the task, with which the subjects had no prior experience. Had the task been overlearned, it might have been expected that subjects with the best performance would require less allocation of neural resources, as is seen in studies of overlearned motor behaviors (Andres et al., 1999; Ewen et al., 2016; Picard et al., 2013).
4.5. Caveats and limitations
There are several caveats that need to be considered when interpreting the results obtained from intracranial recordings. Subjects were neurosurgical patients, and electrode coverage in each subject was determined entirely by clinical considerations. Consequently, some regions that are postulated to play a role in auditory novelty responses and their attentional modulation could not be systematically examined in the present study. For example, medial prefrontal cortex has been demonstrated to play a role in generation of auditory novelty responses (Casado-Román et al., 2019; Løvstad et al., 2012b). In the present study, the coverage of medial prefrontal cortex was relatively limited, precluding a systematic analysis of this region.
The spatial distribution and the time course of the LGD effects were similar to that reported in the previous studies (Nourski et al., 2018a; Nourski et al., 2018b). However, the prevalence of LGD effects outside HGPM and STP in the present subject cohort was generally lower. Methodological differences between these studies may have contributed to the observed quantitative differences in LGD effects and task performance. The subjects in the (Nourski et al., 2018a; Nourski et al., 2018b) studies performed the task after reintroduction of their antiepileptic drugs and at the conclusion of their epilepsy monitoring period, just prior to electrode removal in the operating room. In the present study, the subjects participated in the experiment earlier in their monitoring period, while being tapered off their medications and often with an increased frequency of seizures. Additionally, presence in the operating room may have contributed to elevated vigilance and level of alertness. These factors could contribute to a better task performance in those subjects compared to when experiments were performed with subjects reclining in their hospital beds, as done in the present study.
Finally, we note that in the present study all subjects performed the target detection task following the passive listening block. This introduced the possibility of an order effect. For example, because the passive stimulus presentation was the subjects’ first exposure to the stimuli, the stimuli may have captured the subjects’ attention covertly, leading to an underestimated effect of attention on the neural responses (cf. Nourski et al., 2015b).
4.6. Functional implications and future directions
The results of the present study provide further support for inadequacy of GD effects as a biomarker for consciousness. Previously we have suggested that LD effects, particularly those seen in higher-order cortical areas (auditory-related and prefrontal cortex) may serve as a biomarker for consciousness. A prerequisite for such a biomarker to have clinical utility is that it has to be elicited reliably during passive listening. With that in mind, the confirmation that LD effects are robust during passive listening is encouraging. The conclusion regarding potential utility of LD effects as a biomarker for consciousness is consistent with the data showing a relationship between the MMN and awareness of preceding regularity within the stimulus stream (Dykstra and Gutschalk 2015).
Intracranial electrophysiology provides a unique opportunity to gain insights into the cortical mechanisms of novelty processing. Elucidating these mechanisms will enable more sophisticated interpretation of non-invasive recordings that can be easily obtained in a clinical setting. Responses to auditory novelty obtained in passive auditory paradigms provide multiple translational opportunities. These include improvements in interpretation of tests used to assess prognosis in patients in coma, vegetative or minimally conscious states, identification of phenotypic biomarkers for multiple clinical conditions (e.g. attention deficit hyperactivity disorder, dementia, schizophrenia) (Tada et al., 2019). Additional utility of ever more reliable biomarkers assessing level of consciousness is to improve perioperative monitoring of anesthesia depth and aid development of novel approaches for objective assessment for occupations that require high vigilance. This work represents an important step in identifying the specific components of novelty responses and their cortical generators that are most relevant for clinical monitoring of consciousness. However, important aspects of these generators are yet to be elucidated. Future experiments will seek to disentangle the multiple dimensions of auditory task engagement and will determine the specific contributions of prefrontal, temporal and parietal cortical regions.
Supplementary Material
Highlights.
Responses to local and global auditory novelty were studied in epilepsy patients
Deviance effects were measured in passive and active listening (target detection)
Responses to vowels and local deviance effects were largely unaffected by task
Global deviance effects were strongly driven by task demands
High gamma global deviance effects paralleled task performance
Acknowledgements
We thank Haiming Chen, Dr. Phillip Gander, Dr. Christopher Kovach, Beau Snoad for help with data collection and analysis, and Dr. Matthew Howard for his oversight and support of this work. This study was supported by grants NIH R01-DC04290, R01-GM109086, UL1-RR024979 and the Hoover Fund.
Abbreviations:
- AEP
auditory evoked potential
- CT
computed tomography
- ECoG
electrocorticography
- EEG
electroencephalography
- ERBP
event-related band power
- FDR
false discovery rate
- GD
global deviance/deviant
- GS
global standard
- HGAL
anterolateral Heschl’s gyrus
- HGPM
posteromedial Heschl’s gyrus
- IFG
inferior frontal gyrus
- LD
local deviance/deviant
- LS
local standard
- LGD
local/global deviant
- MFG
middle frontal gyrus
- MI
modulation index
- MNI
Montreal Neurological Institute
- MRI
magnetic resonance imaging
- RMS
root mean square
- ROI
region of interest
- RT
reaction time
- SFG
superior frontal gyrus
- STG
superior temporal gyrus
- STP
superior temporal plane
Footnotes
Kirill V. Nourski: Conceptualization, methodology, software, validation, formal analysis, investigation, data curation, writing - original draft, writing - review and editing, visualization, supervision, project administration, funding acquisition
Mitchell Steinschneider: Writing - original draft, writing - review and editing
Ariane E. Rhone: Investigation, writing - original draft, writing - review and editing, project administration
Bryan M. Krause: Methodology, formal analysis, writing - review and editing
Hiroto Kawasaki: Methodology, resources, data curation
Matthew I. Banks: Conceptualization, methodology, writing - original draft, writing - review and editing, supervision, funding acquisition
Publisher's Disclaimer: This is a PDF file of an unedited manuscript that has been accepted for publication. As a service to our customers we are providing this early version of the manuscript. The manuscript will undergo copyediting, typesetting, and review of the resulting proof before it is published in its final form. Please note that during the production process errors may be discovered which could affect the content, and all legal disclaimers that apply to the journal pertain.
References
- Andres FG, Mima T, Schulman AE, Dichgans J, Hallett M, Gerloff C. 1999. Functional coupling of human cortical sensorimotor areas during bimanual skill acquisition. Brain 122 ( Pt 5), 855–70. [DOI] [PubMed] [Google Scholar]
- Bauer M, Stenner MP, Friston KJ, Dolan RJ 2014. Attentional modulation of alpha/beta and gamma oscillations reflect functionally distinct processes. J Neurosci 34, 16117–25. [DOI] [PMC free article] [PubMed] [Google Scholar]
- Bekinschtein TA, Dehaene S, Rohaut B, Tadel F, Cohen L, Naccache L. 2009. Neural signature of the conscious processing of auditory regularities. Proc Natl Acad Sci U S A 106, 1672–7. [DOI] [PMC free article] [PubMed] [Google Scholar]
- Benjamini Y, Hochberg Y. 1995. Controlling the False Discovery Rate: A Practical and Powerful Approach to Multiple Testing. J Royal Stat Soc Series B Stat Methodol 57, 289–300. [Google Scholar]
- Billig AJ, Herrmann B, Rhone AE, Gander PE, Nourski KV, Snoad BF, Kovach CK, Kawasaki H, Howard MA 3rd, Johnsrude IS 2019. A Sound-Sensitive Source of Alpha Oscillations in Human Non-Primary Auditory Cortex. J Neurosci 39, 8679–8689. [DOI] [PMC free article] [PubMed] [Google Scholar]
- Brechmann A, Scheich H. 2005. Hemispheric shifts of sound representation in auditory cortex with conceptual listening. Cereb Cortex 15, 578–87. [DOI] [PubMed] [Google Scholar]
- Brechmann A, Gaschler-Markefski B, Sohr M, Yoneda K, Kaulisch T, Scheich H. 2007. Working memory specific activity in auditory cortex: potential correlates of sequential processing and maintenance. Cereb Cortex 17, 2544–52. [DOI] [PubMed] [Google Scholar]
- Casado-Román L, Pérez-González D, Malmierca MS 2019. Prediction errors explain mismatch signals of neurons in the medial prefrontal cortex. bioRxiv, 778928. [DOI] [PMC free article] [PubMed] [Google Scholar]
- Chennu S, Noreika V, Gueorguiev D, Blenkmann A, Kochen S, Ibanez A, Owen AM, Bekinschtein TA 2013. Expectation and attention in hierarchical auditory prediction. J Neurosci 33, 11194–205. [DOI] [PMC free article] [PubMed] [Google Scholar]
- Daffner KR, Scinto LF, Weitzman AM, Faust R, Rentz DM, Budson AE, Holcomb PJ 2003. Frontal and parietal components of a cerebral network mediating voluntary attention to novel events. J Cogn Neurosci 15, 294–313. [DOI] [PubMed] [Google Scholar]
- Daffner KR, Mesulam MM, Scinto LF, Acar D, Calvo V, Faust R, Chabrerie A, Kennedy B, Holcomb P. 2000. The central role of the prefrontal cortex in directing attention to novel events. Brain 123 ( Pt 5), 927–39. [DOI] [PubMed] [Google Scholar]
- de Pesters A, Coon WG, Brunner P, Gunduz A, Ritaccio AL, Brunet NM, de Weerd P, Roberts MJ, Oostenveld R, Fries P, Schalk G. 2016. Alpha power indexes task-related networks on large and small scales: A multimodal ECoG study in humans and a non-human primate. Neuroimage 134, 122–131. [DOI] [PMC free article] [PubMed] [Google Scholar]
- Destrieux C, Fischl B, Dale A, Halgren E. 2010. Automatic parcellation of human cortical gyri and sulci using standard anatomical nomenclature. Neuroimage 53, 1–15. [DOI] [PMC free article] [PubMed] [Google Scholar]
- Destrieux C, Terrier LM, Andersson F, Love SA, Cottier JP, Duvernoy H, Velut S, Janot K, Zemmoura I. 2017. A practical guide for the identification of major sulcogyral structures of the human cortex. Brain Struct Funct 222, 2001–2015. [DOI] [PubMed] [Google Scholar]
- Dykstra AR, Cariani PA, Gutschalk A. 2017. A roadmap for the study of conscious audition and its neural basis. Philos Trans R Soc Lond B Biol Sci. 372, 20160103. [DOI] [PMC free article] [PubMed] [Google Scholar]
- Dykstra AR, Gutschalk A. 2015. Does the mismatch negativity operate on a consciously accessible memory trace? Sci Adv. 1:e1500677. [DOI] [PMC free article] [PubMed] [Google Scholar]
- Ewen JB, Pillai AS, McAuliffe D, Lakshmanan BM, Ament K, Hallett M, Crone NE, Mostofsky SH 2016. Practicing Novel, Praxis-Like Movements: Physiological Effects of Repetition. Front Hum Neurosci 10, 22. [DOI] [PMC free article] [PubMed] [Google Scholar]
- Faugeras F, Rohaut B, Weiss N, Bekinschtein T, Galanaud D, Puybasset L, Bolgert F, Sergent C, Cohen L, Dehaene S, Naccache L. 2012. Event related potentials elicited by violations of auditory regularities in patients with impaired consciousness. Neuropsychologia 50, 403–18. [DOI] [PubMed] [Google Scholar]
- Gaab N, Gaser C, Zaehle T, Jancke L, Schlaug G. 2003. Functional anatomy of pitch memory--an fMRI study with sparse temporal sampling. Neuroimage 19, 1417–26. [DOI] [PubMed] [Google Scholar]
- Hadfield JD 2010. MCMC Methods for Multi-Response Generalized Linear Mixed Models: The MCMCglmm R Package. J Stat Softw 33, 1–22.20808728 [Google Scholar]
- Halgren M, Ulbert I, Bastuji H, Fabo D, Eross L, Rey M, Devinsky O, Doyle WK, Mak-McCully R, Halgren E, Wittner L, Chauvel P, Heit G, Eskandar E, Mandell A, Cash SS 2019. The generation and propagation of the human alpha rhythm. Proc Natl Acad Sci U S A. [DOI] [PMC free article] [PubMed] [Google Scholar]
- Hillenbrand J, Getty LA, Clark MJ, Wheeler K. 1995. Acoustic characteristics of American English vowels. J Acoust Soc Am 97, 3099–111. [DOI] [PubMed] [Google Scholar]
- Holcomb HH, Medoff DR, Caudill PJ, Zhao Z, Lahti AC, Dannals RF, Tamminga CA 1998. Cerebral blood flow relationships associated with a difficult tone recognition task in trained normal volunteers. Cereb Cortex 8, 534–42. [DOI] [PubMed] [Google Scholar]
- Howard MA, Volkov IO, Mirsky R, Garell PC, Noh MD, Granner M, Damasio H, Steinschneider M, Reale RA, Hind JE, Brugge JF 2000. Auditory cortex on the human posterior superior temporal gyrus. J Comp Neurol. 416, 79–92. [DOI] [PubMed] [Google Scholar]
- Howard MA 3rd, Volkov IO, Abbas PJ, Damasio H, Ollendieck MC, Granner MA 1996. A chronic microelectrode investigation of the tonotopic organization of human auditory cortex. Brain Res 724, 260–4. [DOI] [PubMed] [Google Scholar]
- Huang S, Belliveau JW, Tengshe C, Ahveninen J. 2012. Brain networks of novelty-driven involuntary and cued voluntary auditory attention shifting. PLoS One 7, e44062. [DOI] [PMC free article] [PubMed] [Google Scholar]
- Huang S, Seidman LJ, Rossi S, Ahveninen J. 2013. Distinct cortical networks activated by auditory attention and working memory load. Neuroimage 83, 1098–108. [DOI] [PMC free article] [PubMed] [Google Scholar]
- Kerlin JR, Shahin AJ, Miller LM 2010. Attentional gain control of ongoing cortical speech representations in a “cocktail party”. J Neurosci 30, 620–8. [DOI] [PMC free article] [PubMed] [Google Scholar]
- Knight RT, Scabini D. 1998. Anatomic bases of event-related potentials and their relationship to novelty detection in humans. J Clin Neurophysiol 15, 3–13. [DOI] [PubMed] [Google Scholar]
- Kovach CK, Gander PE 2016. The demodulated band transform. J Neurosci Methods 261, 135–54. [DOI] [PMC free article] [PubMed] [Google Scholar]
- Leocani L, Toro C, Manganotti P, Zhuang P, Hallett M. 1997. Event-related coherence and event-related desynchronization/synchronization in the 10 Hz and 20 Hz EEG during self-paced movements. Electroencephalogr Clin Neurophysiol 104, 199–206. [DOI] [PubMed] [Google Scholar]
- Løvstad M, Funderud I, Lindgren M, Endestad T, Due-Tonnessen P, Meling T, Voytek B, Knight RT, Solbakk AK 2012a. Contribution of subregions of human frontal cortex to novelty processing. J Cogn Neurosci 24, 378–95. [DOI] [PMC free article] [PubMed] [Google Scholar]
- Løvstad M, Funderud I, Meling T, Kramer UM, Voytek B, Due-Tonnessen P, Endestad T, Lindgren M, Knight RT, Solbakk AK 2012b. Anterior cingulate cortex and cognitive control: neuropsychological and electrophysiological findings in two patients with lesions to dorsomedial prefrontal cortex. Brain Cogn 80, 237–49. [DOI] [PMC free article] [PubMed] [Google Scholar]
- Maris E, Oostenveld R. 2007. Nonparametric statistical testing of EEG- and MEG-data. J Neurosci Methods 164, 177–90. [DOI] [PubMed] [Google Scholar]
- Mukamel R, Gelbard H, Arieli A, Hasson U, Fried I, Malach R. 2005. Coupling between neuronal firing, field potentials, and FMRI in human auditory cortex. Science 309, 951–954. [DOI] [PubMed] [Google Scholar]
- Näätänen R, Kujala T, Winkler I. 2011. Auditory processing that leads to conscious perception: a unique window to central auditory processing opened by the mismatch negativity and related responses. Psychophysiology 48, 4–22. [DOI] [PubMed] [Google Scholar]
- Näätänen R, Paavilainen P, Tiitinen H, Jiang D, Alho K. 1993. Attention and mismatch negativity. Psychophysiology 30, 436–50. [DOI] [PubMed] [Google Scholar]
- Nagahama Y, Kovach CK, Ciliberto M, Joshi C, Rhone AE, Vesole A, Gander PE, Nourski KV, Oya H, Howard MA 3rd, Kawasaki H, Dlouhy BJ 2018. Localization of musicogenic epilepsy to Heschl’s gyrus and superior temporal plane: case report. J Neurosurg 129, 157–164. [DOI] [PMC free article] [PubMed] [Google Scholar]
- Nourski KV, Howard MA 3rd. 2015a. Invasive recordings in the human auditory cortex. Handb Clin Neurol 129, 225–44. [DOI] [PubMed] [Google Scholar]
- Nourski KV, Steinschneider M, Rhone AE, Howard Iii MA 2016. Intracranial Electrophysiology of Auditory Selective Attention Associated with Speech Classification Tasks. Front Hum Neurosci 10, 691. [DOI] [PMC free article] [PubMed] [Google Scholar]
- Nourski KV, Steinschneider M, Oya H, Kawasaki H, Howard MA 3rd. 2015b. Modulation of response patterns in human auditory cortex during a target detection task: an intracranial electrophysiology study. Int J Psychophysiol 95, 191–201. [DOI] [PMC free article] [PubMed] [Google Scholar]
- Nourski KV, Steinschneider M, Rhone AE, Kawasaki H, Howard MA 3rd, Banks MI 2018a. Processing of auditory novelty across the cortical hierarchy: An intracranial electrophysiology study. Neuroimage 183, 412–424. [DOI] [PMC free article] [PubMed] [Google Scholar]
- Nourski KV, Steinschneider M, Rhone AE, Kawasaki H, Howard MA 3rd, Banks MI 2018b. Auditory Predictive Coding across Awareness States under Anesthesia: An Intracranial Electrophysiology Study. J Neurosci 38, 8441–8452. [DOI] [PMC free article] [PubMed] [Google Scholar]
- Nourski KV, Steinschneider M, Rhone AE, Kovach CK, Kawasaki H, Howard MA 3rd. 2019. Differential responses to spectrally degraded speech within human auditory cortex: An intracranial electrophysiology study. Hear Res 371, 53–65. [DOI] [PMC free article] [PubMed] [Google Scholar]
- Nourski KV, Steinschneider M, McMurray B, Kovach CK, Oya H, Kawasaki H, Howard MA 3rd. 2014. Functional organization of human auditory cortex: investigation of response latencies through direct recordings. Neuroimage 101, 598–609. [DOI] [PMC free article] [PubMed] [Google Scholar]
- Pfurtscheller G, Klimesch W. 1991. Event-related desynchronization during motor behavior and visual information processing. Electroencephalogr Clin Neurophysiol Suppl 42, 58–65. [PubMed] [Google Scholar]
- Pfurtscheller G, Lopes da Silva FH 1999. Event-related EEG/MEG synchronization and desynchronization: basic principles. Clin.Neurophysiol 110, 1842–1857. [DOI] [PubMed] [Google Scholar]
- Pfurtscheller G, Neuper C, Mohl W. 1994. Event-related desynchronization (ERD) during visual processing. Int J Psychophysiol 16, 147–53. [DOI] [PubMed] [Google Scholar]
- Phipson B, Smyth GK 2010. Permutation P-values should never be zero: calculating exact P-values when permutations are randomly drawn. Stat Appl Genet Mol Biol 9, 39. [DOI] [PubMed] [Google Scholar]
- Picard N, Matsuzaka Y, Strick PL 2013. Extended practice of a motor skill is associated with reduced metabolic activity in M1. Nat Neurosci 16, 1340–7. [DOI] [PMC free article] [PubMed] [Google Scholar]
- Pitts MA, Padwal J, Fennelly D, Martinez A, Hillyard SA 2014. Gamma band activity and the P3 reflect post-perceptual processes, not visual awareness. Neuroimage 101, 337–350. [DOI] [PMC free article] [PubMed] [Google Scholar]
- Ray S, Crone NE, Niebur E, Franaszczuk PJ, Hsiao SS 2008. Neural correlates of high-gamma oscillations (60–200 Hz) in macaque local field potentials and their potential implications in electrocorticography. J Neurosci 28, 11526–36. [DOI] [PMC free article] [PubMed] [Google Scholar]
- Reddy CG, Dahdaleh NS, Albert G, Chen F, Hansen D, Nourski K, Kawasaki H, Oya H, Howard MA 3rd. 2010. A method for placing Heschl gyrus depth electrodes. J Neurosurg 112, 1301–7. [DOI] [PMC free article] [PubMed] [Google Scholar]
- Salmi J, Rinne T, Koistinen S, Salonen O, Alho K. 2009. Brain networks of bottom-up triggered and top-down controlled shifting of auditory attention. Brain Res 1286, 155–64. [DOI] [PubMed] [Google Scholar]
- Schonwiesner M, Novitski N, Pakarinen S, Carlson S, Tervaniemi M, Naatanen R. 2007. Heschl’s gyrus, posterior superior temporal gyrus, and mid-ventrolateral prefrontal cortex have different roles in the detection of acoustic changes. J Neurophysiol 97, 2075–82. [DOI] [PubMed] [Google Scholar]
- Sergent C, Baillet S, Dehaene S. 2005. Timing of the brain events underlying access to consciousness during the attentional blink. Nat Neurosci 8, 1391–400. [DOI] [PubMed] [Google Scholar]
- Simpson TP, Manara AR, Kane NM, Barton RL, Rowlands CA, Butler SR 2002. Effect of propofol anaesthesia on the event-related potential mismatch negativity and the auditory-evoked potential N1. Br J Anaesth 89, 382–388. [PubMed] [Google Scholar]
- Steinschneider M, Fishman YI, Arezzo JC 2008. Spectrotemporal Analysis of Evoked and Induced Electroencephalographic Responses in Primary Auditory Cortex (A1) of the Awake Monkey. Cereb Cortex 18, 610–625. [DOI] [PubMed] [Google Scholar]
- Strauss M, Sitt JD, King JR, Elbaz M, Azizi L, Buiatti M, Naccache L, van Wassenhove V, Dehaene S. 2015. Disruption of hierarchical predictive coding during sleep. Proc Natl Acad Sci U S A 112, E1353–62. [DOI] [PMC free article] [PubMed] [Google Scholar]
- Tada M, Kirihara K, Mizutani S, Uka T, Kunii N, Koshiyama D, Fujioka M, Usui K, Nagai T, Araki T, Kasai K. 2019. Mismatch negativity (MMN) as a tool for translational investigations into early psychosis: A review. Int J Psychophysiol 145, 5–14. [DOI] [PubMed] [Google Scholar]
- Tse CY, Penney TB 2008. On the functional role of temporal and frontal cortex activation in passive detection of auditory deviance. Neuroimage 41, 1462–70. [DOI] [PubMed] [Google Scholar]
- Uhrig L, Janssen D, Dehaene S, Jarraya B. 2016. Cerebral responses to local and global auditory novelty under general anesthesia. Neuroimage 141, 326–340. [DOI] [PMC free article] [PubMed] [Google Scholar]
- van Ede F, de Lange F, Jensen O, Maris E. 2011. Orienting attention to an upcoming tactile event involves a spatially and temporally specific modulation of sensorimotor alpha- and beta-band oscillations. J Neurosci 31, 2016–24. [DOI] [PMC free article] [PubMed] [Google Scholar]
- Wacongne C, Labyt E, van Wassenhove V, Bekinschtein T, Naccache L, Dehaene S. 2011. Evidence for a hierarchy of predictions and prediction errors in human cortex. Proc Natl Acad Sci U S A 108, 20754–9. [DOI] [PMC free article] [PubMed] [Google Scholar]
- Wostmann M, Alavash M, Obleser J. 2019. Alpha oscillations in the human brain implement distractor suppression independent of target selection. J Neurosci. [DOI] [PMC free article] [PubMed] [Google Scholar]
- Yago E, Escera C, Alho K, Giard MH 2001. Cerebral mechanisms underlying orienting of attention towards auditory frequency changes. Neuroreport 12, 2583–7. [DOI] [PubMed] [Google Scholar]
Associated Data
This section collects any data citations, data availability statements, or supplementary materials included in this article.