Abstract
Background
The traditional criterion for the diagnosis of implant loosening in total hip arthroplasty (THA) was once defined as a radiolucent line of >2 mm in width, based on plain radiography. Recent progress in imaging technology has allowed for the identification of complete radiolucent lines of ≤2 mm around the whole prosthesis as the basis for diagnosing component loosening in the absence of component migration. This study aimed to compare the sensitivity and specificity of digital tomosynthesis with metal artifact reduction with those of radiography and conventional computed tomography (CT) for detecting radiolucent lines of ≤2 mm surrounding cementless femoral stems of different widths.
Methods
The medullary canals of 4 cadaveric femurs were broached to 13 mm in diameter. Cylindrical cementless femoral stems with diameters of 9, 10, 11, 12, and 13 mm were sequentially inserted into each femur, creating 5 groups of radiolucent lines 2.0, 1.5–1.6, 1.1–1.2, 0.5–0.6, and 0 mm in diameter, respectively. Imaging by tomosynthesis, radiography, and CT was conducted for each radiolucent line model. The width information of the radiolucent line models was used as a reference standard for calculating sensitivity and specificity: observations in the group of 0 mm were used for calculating specificity, and those in the other four groups were used for sensitivity. The differences in sensitivity and specificity between the imaging methods were compared with chi-square test, and the 95% confidence intervals of improvements in the sensitivity and specificity of tomosynthesis compared with radiography and CT were calculated using mixed effects models.
Results
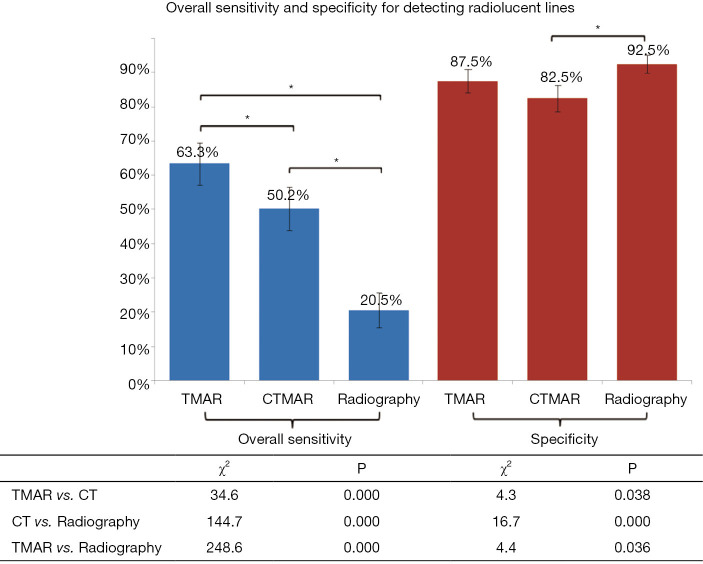
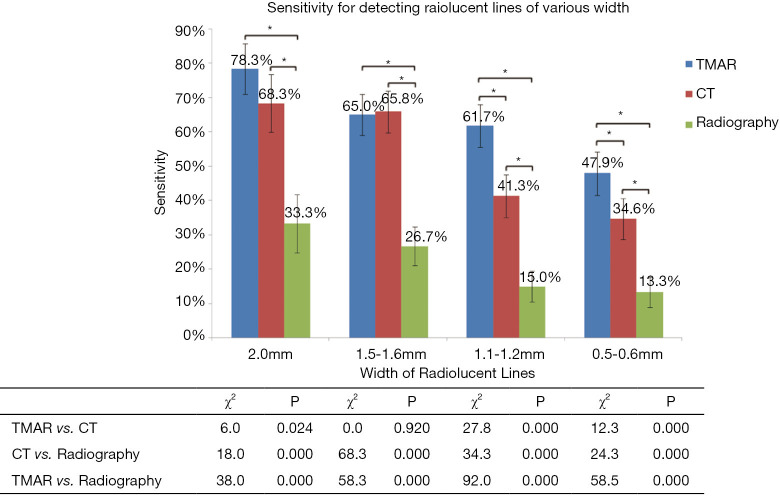
The overall sensitivity of tomosynthesis (63.3%) for detecting radiolucent lines ≤2 mm wide was significantly higher (P<0.017) than that of radiography (20.5%) and CT (50.2%), an improvement of 58.2%±3.1% (95% CI, P<0.001) and 21.7%±7.1% (95% CI, P<0.001) compared to radiography and CT, respectively. The sensitivity values for detecting radiolucent lines in all four groups by tomosynthesis and CT were significantly higher than those of radiography (P<0.017). Tomosynthesis also had significantly higher sensitivity than CT (P<0.017) in detecting radiolucent line ≤1.2 mm wide. The specificity of TMAR, radiography, and CT for detecting radiolucent lines was 87.5%, 92.5%, and 82.5%, respectively, with no significant difference (P>0.017).
Conclusions
Digital tomosynthesis with metal artifact reduction had significantly higher sensitivity than radiography for detecting radiolucent lines ≤2 mm wide surrounding cementless femoral stems. It also displayed higher sensitivity than CT for detecting radiolucent lines ≤1.2 mm in width. With a higher rate of detection for radiolucent lines narrower than 2 mm, tomosynthesis has the potential to improve the accuracy of early diagnosis of cementless THA stem loosening in clinical practice.
Keywords: Hip arthroplasty, radiolucent line, digital tomosynthesis, sensitivity, specificity
Introduction
Cementless prostheses in hip arthroplasty can achieve excellent results. The advantages of using cementless prostheses include avoiding cement-related complications, such as thermal necrosis of the bone, and achieving long-term fixation. Estimates suggest that the number of cementless prostheses used will continue to rise worldwide (1). When assessing patients who have undergone cementless total hip arthroplasty, it is important for hip arthroplasty surgeons to assess the stability of implants. For this purpose, imaging techniques, such as standard radiography and computed tomography (CT), are the most widely employed methods (2,3). Spot welds, which are the radiological signs of osteointegration sites, are crucial to confirming the biological fixation of cementless components (3-8). Similarly, radiolucent lines (RLLs) play a vital role in diagnosing long-term arthroplasty component loosening (5,9-11). However, there is little literature reporting the diagnostic sensitivity and specificity of different imaging modalities for detecting RLLs of various widths. This is due to the difficulties of obtaining a gold standard of imaging for the detection of RLLs. Additionally, there are no clinical methods currently available, since the gap between metal surface and bone is destroyed upon removal of the stem in revision THA surgeries.
Despite this, radiographs are often confusing, with overlapping structures and no allowance for any spatial resolution in depth direction. Sequential X-rays do not have the same rotation or projection and are therefore difficult to compare, especially for small imaging details (12,13). While CT minimizes the overlapping of structures by cross-sectional images and facilitates spatial bone stock analysis, metal artifacts may distort the bone-implant interface, causing RLLs to be underestimated or even unidentifiable (14). Single energy metal artifact reduction is a new technique that has been clinically applied and has improved this issue. Moreover, it has been reported that dual-energy computed tomography, combining metal artifact reduction with monochromatic imaging provided images with fewer artifacts. Despite the progress in metal artifact reduction, the established exposure to high doses of ionizing radiation associated with CT, compared with tomosynthesis, is potentially harmful to patients’ health (15,16).
Tomosynthesis is a promising, novel technique which can improve depth resolution while reducing metal artifacts. In contrast to conventional tomography, a series of images are acquired in a single sweep of the X-ray tube by modern tomosynthesis, with a lower radiation dose. Serial section images are then mathematically reconstructed using various algorithms (17-20). In a recently introduced algorithm for tomosynthesis with metal artifact reduction (TMAR), projected images are first separated into metal and metal-free images according to the highest density of the range of interest. These images are both repeatedly approximated to reduce metal artifacts before they are ultimately merged (21). By comparison to conventional tomosynthesis, the major advantages of TMAR include reconstruction of serial image sections with a single scan and its enhanced ability to reduce artifacts. TMAR can be advantageous when compared to conventional radiography and CT due to its improvement in reducing overlapping structures and metal artifacts, respectively, while reducing radiation exposure by 84% (13,21,22).
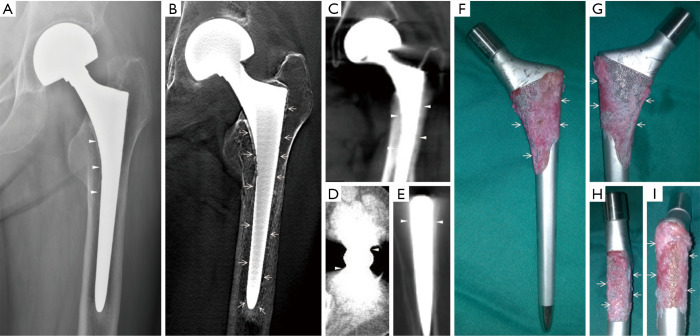
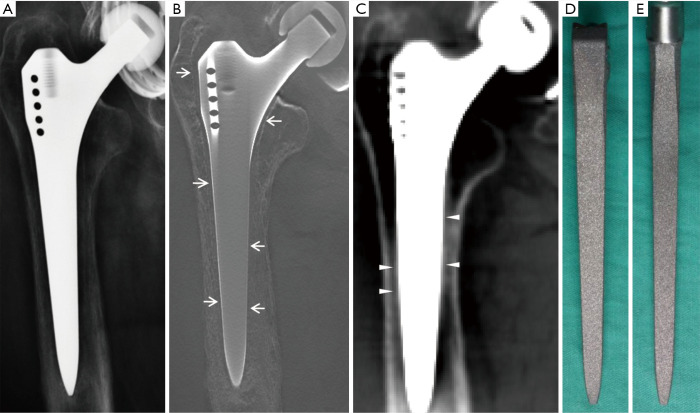
The traditional radiographic criteria of cemented and non-cemented hip arthroplasty prosthesis loosening were described over 30 years ago as an RLL >2 mm wide around the entire circumference of the cement-bone or metal-bone interface, based on plain radiography (5,7). However, Patel et al. reported that as many as 16.3% of components were without frank signs of loosening via radiography and CT detection. In the latter case, loosening was observed intraoperatively (10). This indicates that the traditional radiographic diagnostic criteria failed to identify a substantial number of loose components at an early stage. A recent study reported that a continuous RLL of <1.0 mm in width was important in the diagnosis of loose components without obvious subsidence, migration or RLL >2 mm width, which was historically set as the criteria for cemented fixation component loosening. Technical progress in TMAR might improve the detection rate of continuous RLLs, at a much narrower width than 2 mm (Figures 1,2) (11). This indicates that TMAR might be a useful method in the differential and early diagnosis of femoral stem loosening. However, few studies have evaluated the validity and reliability of TMAR, CT, and radiography in detecting RLL of different widths surrounding cementless femoral stems in hip arthroplasty.
Figure 1.
Clinical case 1. A 69-year-old woman with deteriorating mechanical pain in the hip 1.5 years after the hip hemiarthroplasty, and (A) Radiography showed a segmental radiolucent line <2 mm wide (triangles) without conclusive evidences of loosening, while (B) tomosynthesis revealed a narrow, continuous radiolucent line surrounding the femoral stem (arrows), and (C,D,E) conventional CT showed heavy metal artifacts mimicking osteointegration (triangles), which were found to be (F,G,H,I) connective tissue covering proximal porous coating with no evidence of osteointegration (arrows) in the retrieved prosthesis.
Figure 2.
Clinical case 2. A 72-year-old man with thigh pain 2 years after total hip arthroplasty. (A) Radiography showed no sound evidence of femoral stem loosening, while (B) tomosynthesis depicted a complete fine radiolucent line <1 mm in width (arrows) enveloping the prosthesis. Possible “osteointegration” (triangles) was found on the coronal section of CT (C), and there was no corresponding evidence of osteointegration on the retrieved prosthesis (D,E).
This study aimed to compare the sensitivity and specificity of digital tomosynthesis with metal artifact reduction (TMAR) for detecting RLLs surrounding cementless femoral stems of different widths with those of radiography and CT. We raised two major hypotheses:
TMAR provides higher sensitivity and specificity for detecting RLLs <2.0 mm wide compared to radiography and CT;
CT has higher sensitivity and specificity for detecting RLLs <2.0 mm wide compared to radiography.
To examine these hypotheses, an in vitro diagnostic cadaveric study was performed to determine the sensitivity and specificity of TMAR, CT and radiography for detecting RLLs of different widths.
Methods
Radiolucent line model
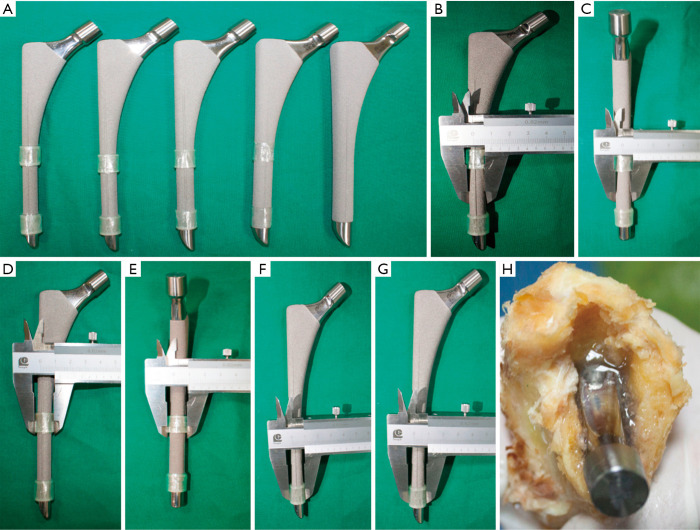
After the study had received approval from the ethics committee in our hospital (code: JLKSZD201706-04), a cadaveric model of radiolucent lines was prepared. Four cadaveric femurs of similar diaphysis intra-medullary diameter measured by CT (13–14 mm) were prepared with serial broaches to a diameter of 13 mm. A cylindrical femoral stem with two longitudinal fins in the anterior and posterior directions (High Rough 160 Stem, Beijing Chunlizhengda Medical Instrument Co., Ltd, Beijing, China) was used for implantation (Figure 3). The prosthesis is made from titanium alloy with extensive plasma spray coating and was designed for cementless fixation. The femoral stem prostheses had diameters of 9, 10, 11, 12, and 13 mm, and were sequentially placed into each femur; thus, each stem was implanted 4 times into each cadaveric femur. The specimens were verified by visual confirmation and tomosynthesis images to exclude any bone fracture during the repeated implantation procedures. To maintain a central position in the prepared femoral canal, the stems were wrapped with radiolucent adhesive tapes to a diameter of 13 mm (Figure 3). Because of the longitudinal fins, the width of the gaps formed between the metal and bone differed in the sagittal and coronal planes. The extra 0.8 mm thickness in the sagittal fins also worked as press fit of the No. 13 stem and helped to create the 0-mm model in the sagittal plane. The width ranging from 0 to 2 mm was calculated in millimeters according to the following formula (Table 1):
Figure 3.
Radiolucent line models preparation process. (A) Each femoral stem, with diameters ranging from 9 to 13 mm, was wrapped with transparent tape so that (B,C,D,E,F,G) the outer diameter reached 13 mm. (H) Then, the cadaveric models were filled up with 1% agarose in the prepared canal before implantation.
Table 1. The measured diameter of each femoral stem and the corresponding width of the RLL model as a reference standard for imaging examinations.
| Stem | Diameter in coronal plane (mm) | Diameter in sagittal plane (mm) | Diameter of last broach (mm) | Width of RLL in coronal plane (mm) | Width of RLL in sagittal plane (mm) |
|---|---|---|---|---|---|
| No. 9 | 9.0 | 10.1 | 13.0 | 2.0 | 1.5 |
| No. 10 | 9.9 | 10.7 | 13.0 | 1.6 | 1.2 |
| No. 11 | 10.8 | 12.1 | 13.0 | 1.1 | 0.5 |
| No. 12 | 11.8 | 13.0 | 13.0 | 0.6 | 0.0 |
| No. 13 | 13.0 | 13.8 | 13.0 | 0.0 | 0.0 |
RLL, radiolucent line.
| Gap width = (broach diameter – stem diameter)/2 |
The prepared femoral canals were then filled with 1% agarose before implantation as a means of mimicking interface tissue. This reduced air artifact between the bone and metal, which can interfere with the imaging procedures (Figure 3).
Imaging examinations
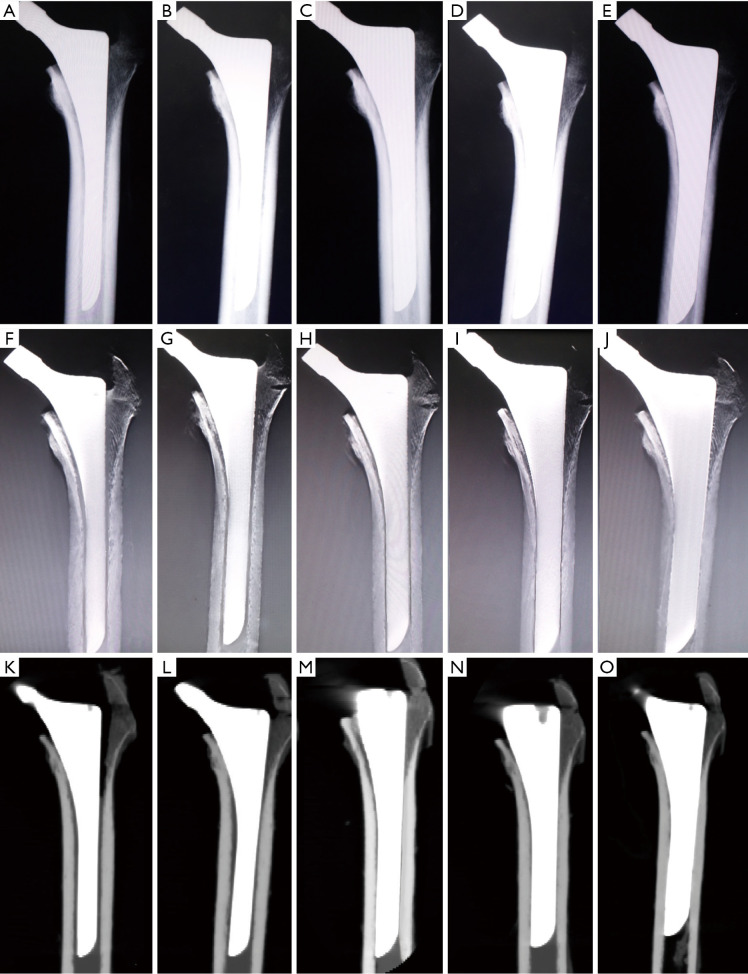
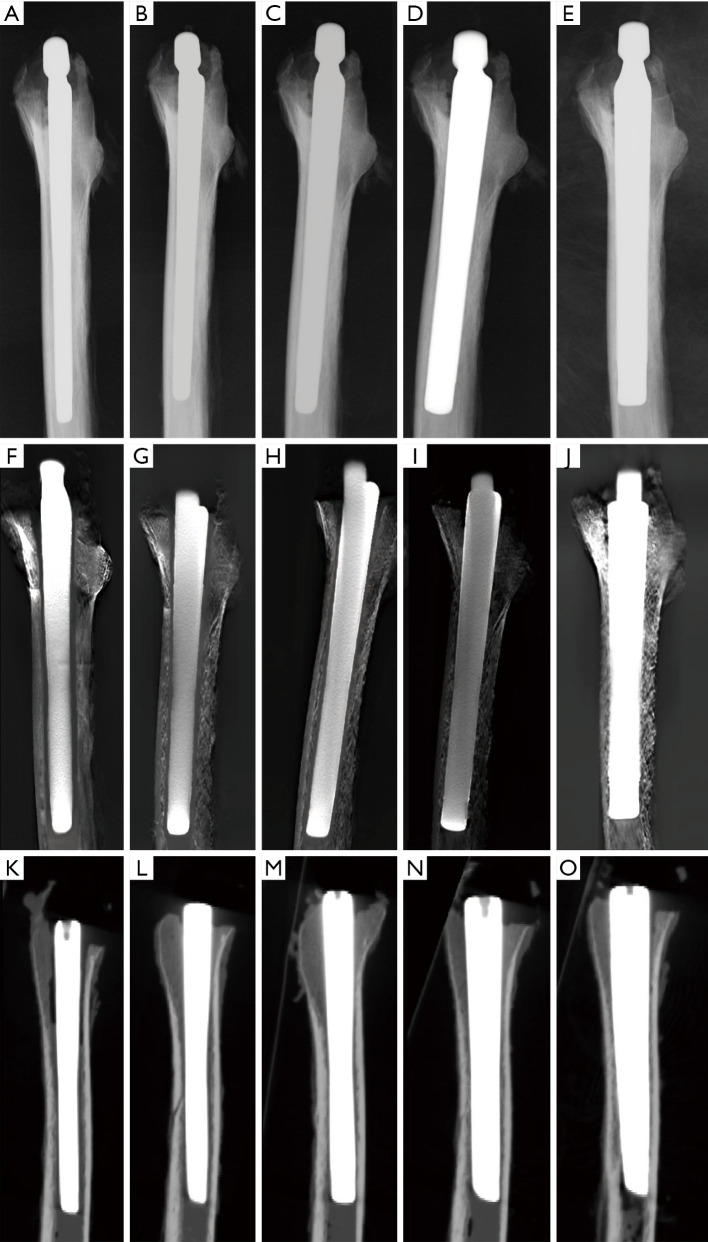
All cadaveric models underwent three imaging examinations. Posterior-anterior and lateral view radiographs were obtained with digital radiograph equipment (KODAK DIRECTVIEW DR7500, Kodak, Carestream Health). Images were taken at a tube voltage of 80 kV and 25 mAs (active image area, 43×43 cm, image matrix size, 3000×3000, pixel pitch, 143 µm) with a focus-detector distance of 100 cm (Figures 4,5).
Figure 4.
Serial anterior-posterior view images. The cadaveric radiolucent line models implanted with stems of 9–13 mm in diameter were scanned in anterior-posterior view of (A,B,C,D,E) radiography, (F,G,H,I,J) tomosynthesis with metal artifact reduction, and (K,O) computed tomography.
Figure 5.
Serial lateral view images. The cadaveric radiolucent line models implanted with stems of 9–13 mm in diameter were scanned in lateral view of (A,B,C,D,E) radiography, (F,G,H,I,J) tomosynthesis with metal artifact reduction, and (K,O) computed tomography.
The AP and lateral view TMAR examinations were obtained with commercially available equipment (SONIALVISION safire II, Shimadzu, Kyoto, Japan). Seventy-four low-dose projection images were collected at a tube voltage of 80 kV and a current of 400 mA within 5 seconds. During the TMAR data acquisition, the X-ray tube moves in a linear fashion in one direction, while the flat-panel-detector moves in the opposite direction. The scanning rotation angle was from −20 to +20 degrees in the standard AP and lateral views, with the center of rotation focused on the cadaveric femur. For the AP and lateral views, 61 images (matrix size 1024×1024) were reconstructed at a 2 mm pitch. The factors for metal reduction algorithm for image optimization were as follows: metal size (medium), object thickness (120 mm), object starting height (20 mm), reconstruction region (from 1 cm above the superior tip to 2 cm below the distal tip of metal stem), iterations (4 times). The two reconstructed central slices in the coronal and sagittal TMAR images were used for evaluation (Figures 4,5).
CT images were obtained using 320-section equipment (Aquilion ONE, Toshiba, Tokyo, Japan) with axial sections of 1.0 mm thickness (120 kV, 250 mA and 125 mAs, field of view dimension 37.9 cm, rotation time 0.5 seconds, matrix size 512×512). Data were used to reconstruct sagittal, coronal, and axial images with a thickness of 1.0 mm using an algorithm of Adaptive Iterative Dose Reduction (AIDR) (23,24). The two reconstructed central slices in the coronal and sagittal CT images were used for evaluation (Figures 4,5).
The effective doses (ED) in radiography and TMAR at the level of the cadaveric model were calibrated by using RTI WinODS 2.0 software with the dose area product (DAP) measured via a DAP meter (DoseGuard 100, RTI Electronics, Mölndal, Sweden). The mean volume CT dose index (CTDIvol) was 14.8 mGy, and the mean Dose Length Product (DLP) was 488 mGy.cm. The effective doses in CT were calculated using the DLP and k coefficients (0.015) from the European Guidelines (25).
Image assessment
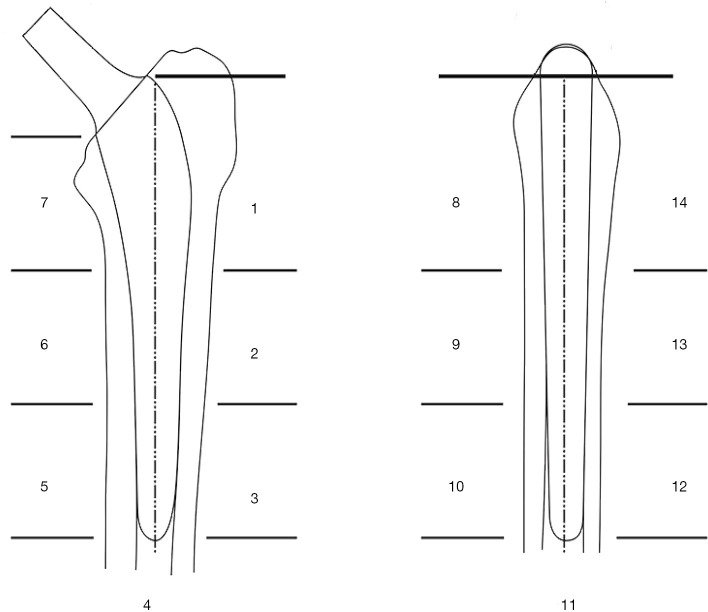
An RLL was defined as a radiolucent zone between the implant and the surrounding bone parallel to the implant surface (3,6,26,27). The cementless hip prosthesis was divided into 14 zones on the AP and lateral views of femoral stems (Figure 6) (7,9,28,29). Five blinded senior orthopedic surgeons (10–25 years of clinical experience) evaluated these images independently. Images were evaluated on an image workstation equipped with a computer (Z-420, Dell, Round Rock, Texas, USA), a screen with resolution of 1280×1024 pixels (SMD19102, Eizo Nanao Corp., Tokyo, Japan). Guidance before assessment included an explanation of the study design, criteria of assessment, and methods of recording results. Each image was evaluated for 1 minute before the results were recorded.
Figure 6.
A schematic drawing of the Gruen zones. The femoral stem was divided into 14 zones for recording radiolucent lines based on Gruen’s method.
The presence or absence of an RLL was recorded at each of the 12 Gruen zones of the femoral stem, except for zones 4 and 11. RLLs with similar widths were combined into one group and there were 5 groups of RLLs for statistical analysis (0, 0.5–0.6, 1.1–1.2, 1.5–1.6, and 2.0 mm). The sensitivity for detecting RLLs in the four groups (0.5–0.6, 1.1–1.2, 1.5–1.6, and 2.0 mm) was calculated for each given width of the RLL model by each method. A false-positive diagnosis was defined as an RLL diagnosis in the group of 0 mm width, which was used to calculate specificity (true negative diagnosis) for each imaging modality. As there were 120 observations for each width of RLL in the single coronal or sagittal plane (6 zones × 4 specimens × 5 observers =120). The total number of observations was 120 for RLL group 2.0 mm, 240 for 1.5–1.6 mm, 240 for 1.1–1.2 mm, and 240 for 0.5–0.6 mm, and 360 for 0 mm, respectively.
Statistical analysis
Using the RLL model as the gold standard, sensitivity was calculated for overall data and for each group of RLLs >0 mm wide. The group of RLLs 0 mm in width was used to calculate the specificity of each imaging modality. The chi-square test was utilized to compare the differences in sensitivity and specificity between each imaging method. Using binary logistic regression as the statistical model and the three imaging modalities as the covariant, the 95% confidence intervals of improvements in sensitivity and specificity were calculated through mixed effects models, utilizing the observation data of the most senior evaluator (evaluator C, Table 2). All statistical analyses were performed using a standard, commercially available statistical software package (SPSS version 15.0; IBM, Armonk, NY, USA), and the level of significance was set at P<0.017 for multiple comparisons between the three imaging modalities using Bonferroni correction.
Table 2. True positive and true negative rates by each individual evaluator for RLL groups of different widths for the three imaging methods.
| Imaging modality | Evaluator | Groups of RLL with different width (mm) | |||||
|---|---|---|---|---|---|---|---|
| Sensitivity | Specificity | ||||||
| 2.0 | 1.5–1.6 | 1.1–1.2 | 0.5–0.6 | 0.0 | |||
| TMAR | A | 87.5% | 50.0% | 64.6% | 41.7% | 91.7% | |
| B | 83.3% | 75.0% | 72.9% | 54.2% | 83.3% | ||
| C | 79.2% | 85.4% | 79.2% | 52.1% | 95.8% | ||
| D | 70.8% | 60.4% | 52.1% | 54.2% | 87.5% | ||
| E | 70.8% | 54.2% | 39.6% | 37.5% | 79.2% | ||
| CT | A | 75.0% | 72.9% | 56.3% | 45.8% | 81.9% | |
| B | 54.2% | 52.1% | 27.1% | 25.0% | 77.8% | ||
| C | 66.7% | 68.8% | 41.7% | 31.3% | 75.0% | ||
| D | 41.7% | 50.0% | 27.1% | 27.1% | 83.3% | ||
| E | 79.2% | 77.1% | 37.5% | 35.4% | 91.7% | ||
| Radiography | A | 45.8% | 64.6% | 37.5% | 16.7% | 91.7% | |
| B | 41.7% | 12.5% | 18.8% | 10.4% | 83.3% | ||
| C | 25.0% | 22.9% | 4.2% | 14.6% | 91.7% | ||
| D | 33.3% | 20.8% | 10.4% | 14.6% | 100.0% | ||
| E | 20.8% | 12.5% | 4.2% | 10.4% | 95.8% | ||
RLL, radiolucent line; TMAR, tomosynthesis with metal artifact reduction; CT, computed tomography.
Research ethics standards compliance
The study was approved by the ethics review committee in our hospital. With cadaveric femurs as the research materials, this study did not involve human participants or animal procedures performed by any of the authors.
Results
The overall sensitivity of TMAR, CT, and radiography for detecting RLLs of all widths was 63.3%, 50.2%, and 20.5%, respectively. The overall sensitivity of TMAR was significantly higher than that of radiography (58.2%±6.0% improvement, P<0.001) and CT (21.7%±7.1% improvement, P<0.001). The sensitivity of CT was significantly higher than that of radiography (36.5%±6.5% improvement, P<0.001) (Table 3, Figure 7). TMAR had significantly higher sensitivity than CT (P<0.001) in the narrow RLL groups (the 1.1–1.2 mm group and 0.5–0.6 mm group) (Table 3, Figure 8). The rates of correct observations by each evaluator for each RLL group of different width are shown in Table 2.
Table 3. Improvements (95% CI) in sensitivity and specificity for all groups of RLLs and each group of RLLs of different widths, calculated by mixed effects models.
| Width of RLL and imaging modalities | Improvement (95% CI) (sensitivity) | P |
|---|---|---|
| All groups of RLL | ||
| TMAR vs. CT | 21.7%±7.1% | <0.001* |
| CT vs. radiography | 36.5%±6.5% | <0.001* |
| TMAR vs. radiography | 58.2%±6.0% | <0.001* |
| 0.5–0.6 mm | ||
| TMAR vs. CT | 24.5%±13.6% | 0.009* |
| CT vs. radiography | 18.2%±11.6% | 0.029 |
| TMAR vs. radiography | 42.7%±12.0% | <0.001* |
| 1.1–1.2 mm | ||
| TMAR vs. CT | 39.1%±12.5% | <0.001* |
| CT vs. radiography | 36.5%±9.7% | <0.001* |
| TMAR vs. radiography | 75.6%±8.5% | <0.001* |
| 1.5–1.6 mm | ||
| TMAR vs. CT | 10.1%±11.2% | 0.212 |
| CT vs. radiography | 52.1%±12.1% | 0.082 |
| TMAR vs. radiography | 62.3%±10.9% | 0.079 |
| 2 mm | ||
| TMAR vs. CT | 4.2%±16.8% | 0.731 |
| CT vs. radiography | 50.0%±17.3% | <0.001* |
| TMAR vs. radiography | 54.0%±16.8% | <0.001* |
| 0 mm | Specificity | |
| TMAR vs. CT | 6.9%±8.4% | 0.220 |
| CT vs. radiography | −11.1%±7.8% | 0.021 |
| TMAR vs. radiography | −4.2%±7.0% | 0.403 |
CI, confidence interval; RLL, radiolucent line; TMAR, tomosynthesis with metal artifact reduction; CT, computed tomography; *, P<0.017 was considered to be statistically significant.
Figure 7.
Overall sensitivity and specificity results. The overall sensitivity and specificity of the three imaging modalities for detecting radiolucent lines ≤2 mm wide were calculated. The χ2 and P values for comparisons of sensitivity and specificity between the three imaging modalities are listed below the graph. *P<0.017. NS, no significant difference.
Figure 8.
The results of subgroup sensitivity analysis. The sensitivity of the three imaging modalities for each group of radiolucent line models with different widths. The χ2 and P values for comparisons of sensitivity between the three imaging modalities for each subgroup are listed below the graph. *P<0.017. NS, no significant difference.
The specificity of TMAR, CT, and radiography for detecting RLLs was 87.5%, 82.5%, and 92.5%, respectively. The specificity of CT was significantly (−11.1%±7.8%) lower than that of radiography (P<0.001) (Figure 7).
The 95% confidence intervals of improvements in sensitivity and specificity between the three imaging modalities evaluated by a single rater for each group of RLL are listed in Table 3.
Intraobserver reliability was shown to be strong for all three imaging modalities, as demonstrated by robust Kappa values (Table 4). However, the interobserver reliability of radiography was less favorable compared with that of TMAR and CT, as measured by the Intraclass correlation coefficient (Table 4).
Table 4. Interobserver and intraobserver reliability for each group of RLLs of different widths.
| Reliability Item | Groups of RLL with different widths (mm) | |||||
|---|---|---|---|---|---|---|
| Overall | 2.0 | 1.5–1.6 | 1.1–1.2 | 0.5–0.6 | 0.0 | |
| Interobserver reliability (ICC) | ||||||
| TMAR | 0.853 | 0.842 | 0.777 | 0.828 | 0.812 | 0.697 |
| CT | 0.832 | 0.758 | 0.754 | 0.832 | 0.761 | 0.753 |
| Radiography | 0.658 | 0.672 | 0.668 | 0.564 | 0.733 | 0.427 |
| Intraobserver reliability (Kappa value) | ||||||
| TMAR | 0.841 | 1.000 | 0.833 | 0.663 | 0.913 | 0.778 |
| CT | 0.855 | 0.780 | 0.789 | 0.915 | 0.685 | 0.514 |
| Radiography | 0.833 | 0.750 | 0.823 | 0.826 | 0.804 | 0.409 |
ICC, intraclass correlation coefficient; RLL, radiolucent line; TMAR, tomosynthesis with metal artifact reduction; CT, computed tomography.
The mean effective dose was 7.98 mSv for CT, 1.12 mSv for TMAR and 0.86 mSv for radiography.
Discussion
This study revealed that the sensitivity values of TMAR and conventional CT for assessing RLLs of different widths surrounding cementless femoral stems were significantly higher than those of radiography. In addition, TMAR showed a significantly higher sensitivity than CT for assessing narrower RLL widths (1.1–1.2 and 0.5–0.6 mm groups) (Figure 8, Table 3). The detection of continuous RLL provides evidence for the diagnosis of component loosening (Figures 7,8) (11). The TMAR technique provided a promising alternative imaging method to improve the diagnostic accuracy for detecting RLLs.
Traditionally, an RLL was not deemed clinically significant until a width of 2 mm was achieved. However, this historical consensus based on radiography was inaccurate, where a portion of components not achieving this criteria were found to be loose (4-7,10). This study demonstrated that radiography had a lower sensitivity than CT and TMAR in detecting RLLs at all widths ≤2.0 mm. These findings are in agreement with a previous report, indicating that a continuous RLL narrower than 1.0 mm in width, detected by tomosynthesis, plays an important role in diagnosing loose components with no obvious subsidence, migration, or RLL >2 mm in width (Figures 7,8) (11).
The inferior sensitivity of radiography in detecting RLLs ≤2.0 mm in width was caused by its low in-depth resolution: signs of an RLL at the bone-implant interface frequently overlapped with projections of trabecular bone, especially in the proximal femoral aspect, which can be frequently deemed as spot welds. Conventionally, contrast arthrography has been conducted to confirm a continuous RLL narrower than 2 mm. However, those narrow RLLs can still pass undetected by radiography (30,31). Recently, progress in metal artifact reduction has allowed RLLs to be detected with TMAR without the concerns associated with invasive procedures and complications linked to using contrast media.
One study reported that conventional CT had an even lower detection rate for complete RLLs ≤1.0 mm wide than radiography (11). This was partially due to the high susceptibility of fine RLLs to distortion by metal artifact at the metal–bone interface. This distortion is partially attributable to the low in-plane resolution on conventional CT imaging (Figure 7,8). Our study showed that conventional CT using AIDR achieved improved sensitivity and specificity for detecting RLLs in all groups ≤2.0 mm (Figure 8, Table 3). This finding is interesting, as it shows that CT with AIDR algorithm was superior to radiography for the evaluation of narrow RLLs. This improvement might be due to different equipment and algorithms being used compared to those employed in the clinical literature. Alternatively, it could be due to less metal being used and the absence of bone remodeling phenomenon in the experimental setting.
Recently, there have been advancements in dual-energy monochromatic imaging CT, which has shown promising effects in periprosthetic imaging of hip arthroplasty when combined with metal artifact reduction software (32-35). This technique may significantly improve the diagnostic accuracy of CT imaging for periprosthetic RLLs, compared to single energy CT scanning. However, the ability of MAR was reported to positively correspond to the energy level of dual energy CT and the smaller size of metal implants (34). Despite its potential to reduce the metal artifacts of hip arthroplasty to the level comparable to or better than that of TMAR, its irradiation exposure significantly exceeds that of TMAR.
Although TMAR and CT had a similar level of accuracy in the groups with 2.0 mm and 1.5–1.6 mm RLLs, the data from the current study indicated that TMAR had higher sensitivity for detecting RLLs at 1.1–1.2 and 0.5–0.6 mm wide. Minoda et al. conducted a diagnostic study of a 2 mm-wide RLL model in knee arthroplasty of swine femurs and reported that the accuracy of CT was lower than that of TMAR (36). Gomi quantitatively studied the imaging quality of TMAR, MARCT, and non-MAR CT. TMAR showed an improved ability to enhance the visibility of a hip prosthesis, and removal of ghosting artifacts. This is consistent with our finding that a reduction in metal artifacts improved the sensitivity of detecting RLL ≤2 mm wide (29). To our knowledge, the reason for there being fewer metal artifacts in TMAR originates from the ability to adjust the scanning direction of the X-ray tube parallel to the longitudinal axis of the stem. This alignment of the X-ray tube rotation to the longitudinal axis of the implanted THA stem is almost impossible for CT. Also, the higher in-plane spatial resolution of our TMAR equipment (0.3 mm pixel size) compared to CT (1 mm pixel size in coronal and sagittal view) is another reason for the improved performance of TMAR in the detection of narrow RLLs.
The current study revealed that metal artifacts associated with conventional CT may affect the raters’ judgment for RLLs ≤1.2 mm width (Table 3). Although it is possible that the metal artifacts in CT can be further decreased by MAR algorithms and improve the diagnostic accuracy, the significantly higher radiation exposure of CT in comparison with TMAR may still be an important concern. For arthroplasty patients, regular follow-up requires an imaging modality with high accuracy and minimized radiation dose, making TMAR an attractive and viable method. However, TMAR also features some disadvantages. CT images can be reconstructed arbitrarily in any direction from a single scan at a minimum of 0.5 mm slice thickness, while TMAR needs two data acquisitions for the coronal and sagittal views and may only achieve a slice thickness of approximately 2 mm as the minimum. Additionally, different acquisition equipment and reconstruction algorithms may lead to will lead to varying imaging quality. The accuracy of TMAR in detecting RLLs should be evaluated by each company supplier.
We acknowledge that there are several limitations to our study. First, soft tissue-free cadaveric femurs cannot mimic the biological bone remodeling of radio-opaque lines caused by loose femoral stems, which may have made the RLLs more detectable. Therefore, it is possible that the sensitivity data were underestimated for all three imaging modalities. However, the means of determining the true gap widths between metal and bone for a retrieved implant has previously been lacking, and 1% agarose has been proven to mimic the granulation tissue effect (36). Second, we investigated a single type of titanium stem extensively coated with plasma spray. The type of metal, coating, and stem design may influence the imaging of an RLL. The results of this study may not be directly applicable to other types of prosthesis. Third, further studies may be required to evaluate the effect of different MAR-CT methods, such as the dual energy method, combining MAR and monochromatic imaging (37,38). Despite these limitations, the current study is still closely relevant to our clinical practice, as conventional CT remains the mainstream method available to most surgeons. Furthermore, MAR-CT cannot overcome the problem of irradiation and is unsuitable for long-term, repeated examinations during regular follow-up. Fourth, the axial planes of CT were not evaluated because there were no axial images for comparison with TMAR and radiography.
The current study indicates that TMAR, with an improved detection rate for RLLs narrower than 2 mm compared to radiography and CT, has the potential to improve the accuracy of diagnosing cementless femoral component loosening in clinical practice.
Acknowledgments
The authors would like to thank Dr. Yingwei Zhao, Dr. Guang Shi, and Dr. Wenhai Wang for technical consultancy in radiology.
Funding: The research was funded by the Beijing Hospital Authority Dengfeng Program (grant number: DFL20190401), Beijing Municipal Administration of Hospitals Incubating Program (Code: PX2018016). the Beijing Talents Fund 2017, and Beijing Jishuitan Hospital Nova Program (grant number: XKXX201805).
Ethical Statement: The study had received approval from the ethics committee in our hospital (code: JLKSZD201706-04).
Open Access Statement: This is an Open Access article distributed in accordance with the Creative Commons Attribution-NonCommercial-NoDerivs 4.0 International License (CC BY-NC-ND 4.0), which permits the non-commercial replication and distribution of the article with the strict proviso that no changes or edits are made and the original work is properly cited (including links to both the formal publication through the relevant DOI and the license). See: https://creativecommons.org/licenses/by-nc-nd/4.0/.
Footnotes
Conflicts of Interest: All authors have completed the ICMJE uniform disclosure form (available at http://dx.doi.org/10.21037/qims-19-1018). The authors have no conflicts of interest to declare.
References
- 1.Dixon T, Shaw M, Ebrahim S, Dieppe P. Trends in hip and knee joint replacement: socioeconomic inequalities and projections of need. Ann Rheum Dis 2004;63:825-30. 10.1136/ard.2003.012724 [DOI] [PMC free article] [PubMed] [Google Scholar]
- 2.Miller TT. Imaging of hip arthroplasty. Eur J Radiol 2012;81:3802-12. 10.1016/j.ejrad.2011.03.103 [DOI] [PubMed] [Google Scholar]
- 3.Engh CA, Massin P, Suthers KE. Roentgenographic assessment of the biologic fixation of porous-surfaced femoral components. Clin Orthop Relat Res 1990:107-28. [PubMed] [Google Scholar]
- 4.Valle AG, Zoppi A, Peterson MG, Salvati EA. Clinical and radiographic results associated with a modern, cementless modular cup design in total hip arthroplasty. J Bone Joint Surg Am 2004;86:1998-2004. 10.2106/00004623-200409000-00019 [DOI] [PubMed] [Google Scholar]
- 5.Meding JB, Ritter MA, Keating EM, Faris PM. Clinical and radiographic evaluation of long-stem femoral components following revision total hip arthroplasty. J Arthroplasty 1994;9:399-408. 10.1016/0883-5403(94)90051-5 [DOI] [PubMed] [Google Scholar]
- 6.Della Valle CJ, Paprosky WG. The femur in revision total hip arthroplasty evaluation and classification. Clin Orthop Relat Res 2004:55-62. 10.1097/00003086-200403000-00009 [DOI] [PubMed] [Google Scholar]
- 7.Engh CA, Bobyn JD, Glassman AH. Porous-coated hip replacement. The factors governing bone ingrowth, stress shielding, and clinical results. J Bone Joint Surg Br 1987;69:45-55. 10.1302/0301-620X.69B1.3818732 [DOI] [PubMed] [Google Scholar]
- 8.Guo S, Tang H, Zhou Y, Huang Y, Shao H, Yang D. Accuracy of Digital Tomosynthesis With Metal Artifact Reduction for Detecting Osteointegration in Cementless Hip Arthroplasty. J Arthroplasty 2018;33:1579-87. 10.1016/j.arth.2017.12.037 [DOI] [PubMed] [Google Scholar]
- 9.Gruen TA, McNeice GM, Amstutz HC. Modes of failure of cemented femoral stem. Clinical Orthopaedics and Related Research 1979;141:17-27. [PubMed] [Google Scholar]
- 10.Patel AR, Sweeney P, Ochenjele G, Wixson R, Stulberg SD, Puri LM. Radiographically Silent Loosening of the Acetabular Component in Hip Arthroplasty. Am J Orthop (Belle Mead NJ) 2015;44:406-10. [PubMed] [Google Scholar]
- 11.Tang H, Yang D, Guo S, Tang J, Liu J, Wang D, Zhou Y. Digital tomosynthesis with metal artifact reduction for assessing cementless hip arthroplasty: a diagnostic cohort study of 48 patients. Skeletal Radiol 2016;45:1523-32. 10.1007/s00256-016-2466-8 [DOI] [PubMed] [Google Scholar]
- 12.Walde TA, Weiland DE, Leung SB, Kitamura N, Sychterz CJ, Engh CA, Jr, Claus AM, Potter HG, Engh CA., Sr Comparison of CT, MRI, and radiographs in assessing pelvic osteolysis: a cadaveric study. Clin Orthop Relat Res 2005;(437):138-44. 10.1097/01.blo.0000164028.14504.46 [DOI] [PubMed] [Google Scholar]
- 13.Zotti MG, Campbell DG, Woodman R. Detection of periprosthetic osteolysis around total knee arthroplasties an in vitro study. J Arthroplasty 2012;27:317-22. 10.1016/j.arth.2011.03.047 [DOI] [PubMed] [Google Scholar]
- 14.Arachchi S, Pitto RP, Anderson IA, Shim VB. Analyzing bone remodeling patterns after total hip arthroplasty using quantitative computed tomography and patient-specific 3D computational models. Quant Imaging Med Surg 2015;5:575-82. [DOI] [PMC free article] [PubMed] [Google Scholar]
- 15.Xia W, Yin XR, Wu JT, Wu HT. Comparative study of DTS and CT in the skeletal trauma imaging diagnosis evaluation and radiation dose. Eur J Radiol 2013;82:e76-80. 10.1016/j.ejrad.2012.09.008 [DOI] [PubMed] [Google Scholar]
- 16.Machida H, Yuhara T, Sabol JM, Tamura M, Shimada Y, Ueno E. Postoperative follow-up of olecranon fracture by digital tomosynthesis radiography. Jpn J Radiol 2011;29:583-6. 10.1007/s11604-011-0589-3 [DOI] [PubMed] [Google Scholar]
- 17.Machida H, Yuhara T, Mori T, Ueno E, Moribe Y, Sabol JM. Optimizing parameters for flat-panel detector digital tomosynthesis. Radiographics 2010;30:549-62. 10.1148/rg.302095097 [DOI] [PubMed] [Google Scholar]
- 18.Canella C, Philippe P, Pansini V, Salleron J, Flipo RM, Cotten A. Use of tomosynthesis for erosion evaluation in rheumatoid arthritic hands and wrists. Radiology 2011;258:199-205. 10.1148/radiol.10100791 [DOI] [PubMed] [Google Scholar]
- 19.Hayashi D, Xu L, Roemer FW, Hunter DJ, Li L, Katur AM, Guermazi A. Detection of osteophytes and subchondral cysts in the knee with use of tomosynthesis. Radiology 2012;263:206-15. 10.1148/radiol.12111649 [DOI] [PubMed] [Google Scholar]
- 20.Sorin V, Sklair-Levy M. Dual-energy contrast-enhanced spectral mammography (CESM) for breast cancer screening. Quant Imaging Med Surg 2019;9:1914-7. 10.21037/qims.2019.10.13 [DOI] [PMC free article] [PubMed] [Google Scholar]
- 21.Sakimoto T, Nishino K, editors. Metal artifact reduction in tomosynthesis by metal extraction and ordered subset-expectation maximization (OS-EM) reconstruction. SPIE Medical Imaging; 2013: International Society for Optics and Photonics. [Google Scholar]
- 22.Kim W, Oravec D, Nekkanty S, Yerramshetty J, Sander EA, Divine GW, Flynn MJ, Yeni YN. Digital tomosynthesis (DTS) for quantitative assessment of trabecular microstructure in human vertebral bone. Med Eng Phys 2015;37:109-20. 10.1016/j.medengphy.2014.11.005 [DOI] [PubMed] [Google Scholar]
- 23.Yamashiro T, Miyara T, Honda O, Kamiya H, Murata K, Ohno Y, Tomiyama N, Moriya H, Koyama M, Noma S, Kamiya A, Tanaka Y, Murayama S, Investigators of ACTIve Study Group Adaptive Iterative Dose Reduction Using Three Dimensional Processing (AIDR3D) improves chest CT image quality and reduces radiation exposure. PLoS One 2014;9:e105735. 10.1371/journal.pone.0105735 [DOI] [PMC free article] [PubMed] [Google Scholar]
- 24.Fareed A, Vavere AL, Zimmermann E, Tanami Y, Steveson C, Matheson M, Paul N, Clouse M, Cox C, Lima JAC, Arbab-Zadeh A. Impact of iterative reconstruction vs. filtered back projection on image quality in 320-slice CT coronary angiography: Insights from the CORE320 multicenter study. Medicine (Baltimore) 2017;96:e8452. 10.1097/MD.0000000000008452 [DOI] [PMC free article] [PubMed] [Google Scholar]
- 25.Christner JA, Kofler JM, McCollough CH. Estimating effective dose for CT using dose-length product compared with using organ doses: consequences of adopting International Commission on Radiological Protection publication 103 or dual-energy scanning. AJR Am J Roentgenol 2010;194:881-9. 10.2214/AJR.09.3462 [DOI] [PubMed] [Google Scholar]
- 26.Lintner F, Zweymuller K, Bohm G, Brand G. Reactions of surrounding tissue to the cementless hip implant Ti-6Al-4V after an implantation period of several years. Autopsy studies in three cases. Arch Orthop Trauma Surg 1988;107:357-63. 10.1007/BF00381062 [DOI] [PubMed] [Google Scholar]
- 27.Lintner F, Zweymuller K, Brand G. Tissue reactions to titanium endoprostheses. Autopsy studies in four cases. J Arthroplasty 1986;1:183-95. 10.1016/S0883-5403(86)80029-8 [DOI] [PubMed] [Google Scholar]
- 28.DeLee JG, Charnley J. Radiological demarcation of cemented sockets in total hip replacement. Clin Orthop Relat Res 1976:20-32. [PubMed] [Google Scholar]
- 29.Gomi T, Hirano H. Clinical potential of digital linear tomosynthesis imaging of total joint arthroplasty. J Digit Imaging 2008;21:312-22. 10.1007/s10278-007-9040-9 [DOI] [PMC free article] [PubMed] [Google Scholar]
- 30.Temmerman OP, Raijmakers PG, Berkhof J, David EF, Pijpers R, Molenaar MA, Hoekstra OS, Teule GJ, Heyligers IC. Diagnostic accuracy and interobserver variability of plain radiography,subtraction arthrography, nuclear arthrography, and bone scintigraphy in the assessment of aseptic femoral component loosening. Arch Orthop Trauma Surg 2006;126:316-23. 10.1007/s00402-006-0120-y [DOI] [PubMed] [Google Scholar]
- 31.Barrack RL, Tanzer M, Kattapuram SV, Harris WH. The value of contrast arthrography in assessing loosening of symptomatic uncemented total hip components. Skeletal Radiol 1994;23:37-41. 10.1007/BF00203699 [DOI] [PubMed] [Google Scholar]
- 32.Mussmann B, Andersen PE, Torfing T, Overgaard S. Bone density measurements adjacent to acetabular cups in total hip arthroplasty using dual-energy CT: an in vivo reliability and agreement study. Acta Radiol Open 2018;7:2058460118796539. 10.1177/2058460118796539 [DOI] [PMC free article] [PubMed] [Google Scholar]
- 33.Yue D, Fan Rong C, Ning C, Liang H, Ai Lian L, Ru Xin W, Ya Hong L. Reduction of metal artifacts from unilateral hip arthroplasty on dual-energy CT with metal artifact reduction software. Acta Radiol 2018;59:853-60. 10.1177/0284185117731475 [DOI] [PubMed] [Google Scholar]
- 34.Kosmas C, Hojjati M, Young PC, Abedi A, Gholamrezanezhad A, Rajiah P. Dual-layer spectral computerized tomography for metal artifact reduction: small versus large orthopedic devices. Skeletal Radiol 2019;48:1981-90. 10.1007/s00256-019-03248-3 [DOI] [PubMed] [Google Scholar]
- 35.Wellenberg RH, Boomsma MF, van Osch JA, Vlassenbroek A, Milles J, Edens MA, Streekstra GJ, Slump CH, Maas M. Quantifying metal artefact reduction using virtual monochromatic dual-layer detector spectral CT imaging in unilateral and bilateral total hip prostheses. Eur J Radiol 2017;88:61-70. 10.1016/j.ejrad.2017.01.002 [DOI] [PubMed] [Google Scholar]
- 36.Minoda Y, Yoshida T, Sugimoto K, Baba S, Ikebuchi M, Nakamura H. Detection of small periprosthetic bone defects after total knee arthroplasty. J Arthroplasty 2014;29:2280-4. 10.1016/j.arth.2014.05.013 [DOI] [PubMed] [Google Scholar]
- 37.Gondim Teixeira PA, Meyer JB, Baumann C, Raymond A, Sirveaux F, Coudane H, Blum A. Total hip prosthesis CT with single-energy projection-based metallic artifact reduction: impact on the visualization of specific periprosthetic soft tissue structures. Skeletal Radiol 2014;43:1237-46. 10.1007/s00256-014-1923-5 [DOI] [PubMed] [Google Scholar]
- 38.Morsbach F, Bickelhaupt S, Wanner GA, Krauss A, Schmidt B, Alkadhi H. Reduction of metal artifacts from hip prostheses on CT images of the pelvis: value of iterative reconstructions. Radiology 2013;268:237-44. 10.1148/radiol.13122089 [DOI] [PubMed] [Google Scholar]


